
Evaluating the Perceived Quality of Mobile Banking Applications in Croatia: An Empirical Study


Faculty of Informatics, Juraj Dobrila University of Pula, Zagrebačka 30, 52100 Pula, Croatia
*
Author to whom correspondence should be addressed.
Future Internet 2023, 15(1), 8; https://doi.org/10.3390/fi15010008
Submission received: 17 November 2022
/
Revised: 7 December 2022
/
Accepted: 19 December 2022
/
Published: 26 December 2022
(This article belongs to the Special Issue Information Networks with Human-Centric AI)
Abstract
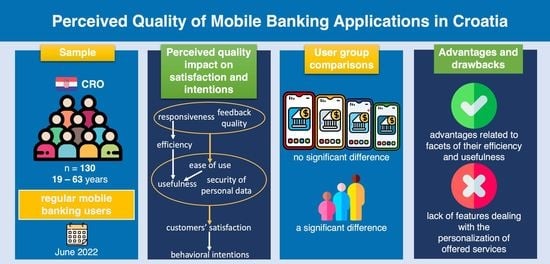
:Mobile banking is nowadays a standard service provided by banks worldwide because it adds convenience for people. There is no more rushing to a bank or waiting in lines for a simple transaction that can be conducted from anywhere and at any time in the blink of an eye. To be consumed by a respective amount of bank clients regularly, mobile banking applications are required to be continuously improved and updated, be in line with recent security standards, and meet quality requirements. This paper tackles the perceived quality of mobile banking applications that are most commonly used in Croatia and has three objectives in that respect. The first one is to identify the extent to which pragmatic and hedonic dimensions of quality contribute to customers’ satisfaction and their behavioral intentions related to the continuous use of mobile banking applications. The second one is to determine if there are significant differences in the perceived quality between users of diverse mobile banking applications as well as between users who belong to different age groups. The last one is to uncover the advantages and disadvantages of evaluated mobile banking applications. For this purpose, an empirical study was carried out, during which data were collected with an online questionnaire. The sample was composed of 130 participants who are representative and regular users of mobile banking applications. The psychometric features of the proposed research model, which represents an interplay of perceived quality attributes, were tested using the partial least squares structural equation modeling (PLS-SEM) method. Differences in the perceived quality among different mobile banking applications and customers of various age groups were explored with Kruskal–Wallis tests. Pros and cons of mobile banking applications were identified with the help of descriptive statistics. Study findings indicate that, in the context of mobile banking applications used in Croatia, feedback quality and responsiveness contribute to the ease of use, usefulness is affected by both ease of use and efficiency, responsiveness has a significant impact on efficiency while ease of use, usefulness, and security of personal data are predictors of customers’ satisfaction which in turn influences their behavioral intentions. While no significant difference exists in the perceived quality of four examined mobile banking applications, we found a significant difference in the perceived quality among three age groups of users of mobile banking applications. The most commonly reported advantages of mobile banking applications were related to facets of their efficiency and usefulness, whereas their main drawback appeared to be the lack of features dealing with the personalization of offered services. The reported and discussed results of an empirical study can be used as a set of guidelines for future advances in the evaluation and design of mobile banking applications.
1. Introduction
Mobile banking, in the form we know it today, has been around for some time now. Over a decade ago, it was mostly performed through Short Message Service (SMS), which was sufficient at that time. Recent advances in the design of web and mobile applications allowed financial institutions to develop more flexible, secure, and usable solutions. Most people nowadays are consuming banking services through mobile applications on their smartphones or tablets. The increased use of smartphones has grown the demand for mobile banking applications, prompting their providers to offer new and improved sets of services and features [1]. As a result, the need for face-to-face interactions between bank staff and customers has decreased [2]. Even though new and more convenient banking services are being implemented, banks often underestimate the hedonic factors when developing mobile applications [3]. Customer trust, as an important characteristic of the modern world financial system, is also often overlooked by banks.
From dense metropolitan areas to remote, rural areas, mobile banking applications and their services are used in many parts of the world. Especially useful for those without access to local financial institutions, mobile banking provides elegant solutions for various services, such as accessing bank account information, account balance/transaction history overview, committing transactions, making investments, or contacting customer support when banking problems occur. When compared to computer-based internet banking, mobile banking offers benefits such as true freedom from time and place and efficient execution of financial transactions [4]. Customers enjoy fast and convenient services whilst banks, as their providers, gain customer loyalty with the added advantage of reduced costs [5]. However, in many developing countries, mobile banking is not widely used because of different technical limitations, such as smartphone inaccessibility and poor infrastructure [1,6]. Various cognitive obstacles, such as tradition, image, and risk barriers, influence customers’ behavior when adopting mobile banking [7].
Bank clients in Croatia believe that mobile banking is safer than internet banking [8]. Several arguments support this statement, the first one being that mobile banking application is usually used on only one specific device where the phone number containing a Subscriber Identity Module (SIM) card is registered to the bank account. On the contrary, internet banking can be used on any device. Although mobile banking applications commonly have implemented biometric or two-factor authentication (2FA) methods that provide an extra layer of protection, mobile banking suffers from various types of attacks that are possible on its infrastructure [9]. Examination of quality enables banks to develop more convenient, efficient, and safer mobile banking applications as well as to improve and enhance the set of services they provide.
The recent COVID-19 pandemic had a huge impact on mobile banking adoption. Customers have formed new habits, and the use of mobile banking applications has become a daily activity. A study conducted by Ali et al. [10] revealed that the COVID-19 threat had a moderating influence on the relationship between customers’ intention to use and actual use of mobile banking applications. According to Fidelity National Information Services (FIS) [11], in early April 2020, new mobile banking registrations jumped approximately 200% over the daily average in March 2020. In addition, on 13 April 2020, logins were 85% higher than the daily average in March 2020 [11]. As of May 2021, most customers in the United States used mobile banking applications to check their account balances [12]. Findings of a recent study conducted in Croatia [8] indicate that the possibility of paying bills is the main motivating factor for using mobile banking, followed by the possibility of monitoring account balance, a savings account, credit card transactions, loan payments, and of receiving notifications about new services, which was perceived as the least relevant motivating factor. Purohit and Arora [13] conducted a study on the determinants of mobile banking adoption, focusing primarily on the benefits and challenges in that respect. Their findings suggest that the most common benefits of mobile banking are reduced cost, reduced time, and personalization, while the most frequently reported challenges are related to the overall quality of the system, security, regulatory environment, and economic viability. According to Khemiri and Jallouli [14], the next step in improving mobile banking applications is the implementation of new technologies such as Big Data, the Internet of Things, and Blockchain.
The main objective of this paper is to examine the perceived quality of mobile banking applications that are mostly used in Croatia. Therefore, we raised the following research questions:
- Which services offered by mobile banking applications are most commonly used?
- What are the main advantages and drawbacks of mobile banking applications?
- Is there a significant difference in the perceived quality among different mobile banking applications?
- Is there a significant difference in the perceived quality of mobile banking applications among users belonging to different age groups?
- What dimensions of the perceived quality contribute to customers’ satisfaction and their behavioral intentions related to the continued use of mobile banking applications?
To obtain answers to the above-mentioned research questions, we conducted an empirical study. Drawing on the review of the recent and relevant literature in the field, we identified eight constructs that constitute the perceived quality of mobile banking applications and proposed a research framework in the form of a conceptual model that represents the interplay of these constructs. As a follow-up, we designed a measuring instrument in the form of a post-use questionnaire that was employed for collecting data from the representative sample of mobile banking application users in Croatia. The validity and reliability of the research model were together with hypothesized relationships between constructs examined with the partial least squares structural equation modeling (PLS-SEM) method. Based on the data collected from users, we identified three different age groups of mobile banking application users and determined which four mobile banking applications are the most commonly consumed in Croatia. Then we applied the Kruskal–Wallis tests to determine if a significant difference in the perceived quality among examined mobile banking applications as well as among identified user age groups exists. Finally, descriptive statistics were used to analyze qualitative data gathered with open-ended items, thus identifying the advantages and disadvantages of evaluated mobile banking applications.
The contributions of this work can be summarized as follows:
- Overview of current advances in the assessment of mobile banking applications;
- Measuring instrument in the form of a post-use questionnaire that can be employed for evaluating the perceived quality of mobile banking applications;
- A valid and reliable conceptual model that can be used for predicting customers’ satisfaction and their behavioral intentions related to continued use of mobile banking applications;
- List of pros and cons of mobile banking applications that are predominantly used in Croatia.
The remainder of the paper is structured as follows. The theoretical background to our empirical study is offered in the next section. The research methodology is described in the third section. The findings of the empirical study are reported in the fourth section and discussed in the fifth section. The limitations of the study are explained in the sixth section. Conclusions and future work directions are provided in the last section.
2. Literature Review
Mobile banking is a delicate topic because it involves the manipulation of users’ funds and private data. User adoption of mobile banking has been growing steadily over the years, but as more people have worked from home due to the COVID-19 pandemic, we have witnessed a surge in consumers using mobile banking for the first time, vastly increasing its popularity. Although mobile banking represents a breakthrough in terms of remote banking services, many bank customers in Croatia still have concerns about its security [8]. Therefore, the perceived quality of mobile banking applications in general, as well as the security of personal data and performance in financial transaction execution in particular, needs to be examined regularly. This section provides a brief overview of current relevant studies on evaluating the service quality, adoption, and success of mobile banking applications.
2.1. Service Quality of Mobile Banking Applications
Service quality denotes the degree to which interaction with a mobile banking application matches customer needs. High service quality of mobile banking applications results in customers’ satisfaction which in turn leads to their loyalty [15]. It is, therefore, of great importance that mobile banking applications meet customers’ expectations and needs. Service quality has been evaluated with various measuring instruments, the most well-known among them being SERVQUAL [16]. This scale examines the essence of service quality with five diverse dimensions, including tangibles, reliability, responsiveness, assurance, and empathy. Amiri Aghdaie and Faghani [17] applied SERVQUAL to examine the service quality of mobile banking and discovered that, of the five mentioned dimensions, only assurance does not affect satisfaction. Shankar et al. [2] found that privacy and security, customer support, interactivity, efficiency, and content are the key dimensions in evaluating the service quality of mobile banking. A recent study [18] on m-banking quality in which data were gathered from bank clients in Croatia revealed that safety, simplicity, and variability of m-banking services have a significant influence on the perceived quality of m-banking which in turn affects a bank’s reputation. As an outcome of their study on m-banking service quality, Jun and Palacios [19] concluded that convenience, accuracy, diverse mobile application service features, ease of use, and continuous improvement, are considered the main sources of customer satisfaction. On the other hand, Arcand et al. [3] discovered that enjoyment, sociality, and trust are significant antecedents of commitment/satisfaction when the service quality of mobile banking is examined. Rejman Petrović et al. [20] pointed out that security/privacy, perceived usefulness, perceived ease of use, design, and enjoyment are important predictors of customer satisfaction which, in turn, has a strong impact on the intention to use mobile banking services. Results of a study conducted during the COVID-19 pandemic suggest that service quality and performance of mobile banking applications can be considerably improved if recommendations drawn from vulnerable people’s experiences are considered [21].
2.2. Adoption of Mobile Banking Applications
Adoption refers to the extent to which a particular piece of technology has a sufficient number of loyal users. Lin and Wang [22] revealed that trust significantly contributes to the satisfaction and loyalty of mobile commerce customers. Zhou [23] discovered that assurance, ubiquity, and perceived ease of use affect trust, whereas ubiquity, perceived ease of use, and personal innovativeness have an influence on flow experience when the adoption of mobile banking is considered. The same author also found that trust has a significant effect on flow experience, that both factors determine usage intention, which in turn contributes to the actual use of mobile banking [23]. The findings of a study dealing with challenges of mobile banking adoption during the COVID-19 pandemic [24] uncovered that the quality of mobile banking services and perceived cost of use significantly contribute to customer satisfaction. Msweli and Mawela [25] found that the adoption of mobile banking by elderly people is affected by both technical and non-technical factors. Saprikis et al. [26] conducted a comparative study to determine if there are any differences in factors that motivate individuals to adopt or not to adopt mobile banking applications. They found that performance expectancy, social influence, and reward affect the behavioral intention of both users and non-users of mobile banking applications [26]. While facilitating conditions, anxiety, and security are important determinants of behavioral intention for users of mobile banking applications, the same holds for risk in the context of non-users of mobile banking applications [26]. Finally, it appeared that effort expectancy affects the behavioral intention of neither users nor non-users of mobile banking applications [26]. Kumar et al. [27] discovered that perceived ease of use, perceived usefulness, personal innovation, subjective norms, and trust have a significant impact on mobile banking adoption intention in India. Findings of a recent study on the adoption of mobile banking in Jordan [28] suggest that performance expectancy, effort expectancy, social influence, perceived risk, perceived trust, and service quality are important predictors of behavioral intention, while facilitating conditions turned out to be not significant in that context. Despite the positive trend in the popularity of mobile banking, uptake of mobile banking applications has remained deplorably low, especially in third-world countries [29,30].
2.3. Success of Mobile Banking Applications
Sustainable development ensures that applications are relevant not just in the present but also in the future. Shankar et al. [31] employed a text-mining approach to explore critical success factors of sustainable banking applications. Their findings match with previous ones and indicate that privacy, security, navigation, customer support, convenience, and efficiency are the key factors of sustainable banking applications [31]. According to findings of a study conducted by Ghobakhloo and Fathi [32], satisfaction with mobile banking service is affected by experienced advantage of mobile banking, mobile banking app system quality, and mobile banking app information quality, while both satisfaction with mobile banking service and post-use trust has a significant impact on attitudinal loyalty toward mobile banking service. Chung and Kwon [33] discovered that perceptions of system quality and information quality moderated by trust have a significant impact on satisfaction with mobile banking services. Zhou [34] uncovered that initial trust and perceived usefulness are the main drivers of usage intention when mobile banking is considered. Current studies have confirmed that system quality [35,36,37], information quality [35,36,38], service quality [36], trust [35], and perceived usefulness [37] significantly contribute to satisfaction with mobile banking. However, while Damabi et al. [38] discovered that user interface design significantly influences customers’ satisfaction with mobile banking, the findings of a study carried out by Lee and Chung [35] were quite the opposite in that respect.
2.4. Filling the Gap
Current studies in the field are mainly exploring security and trust aspects, service quality, and the adoption and success determinants of mobile banking, while very few of them deal with the perceived quality of mobile banking applications in general and their relevant dimensions in particular. Although the literature offers different models that are commonly used to explain the quality of mobile banking, most of them are focused on social rather than on the technical aspects of applications. The majority of extant studies deal with utilitarian aspects of mobile banking applications, while the hedonic ones are neglected in that respect. When the research design is considered, the analysis of the collected data and the testing of the set hypotheses are most often carried out using only one statistical method. Finally, empirical studies examining mobile banking in Croatia are rather rare. Therefore, in our empirical study, we are going to examine both pragmatic and hedonic aspects of the perceived quality of mobile banking applications commonly used in Croatia. Apart from testing the validity and reliability of the proposed conceptual model, we will also analyze differences in the perceived quality among divergent mobile banking applications as well as among diverse user age groups and determine which particularities of mobile banking applications represent their strengths and weaknesses.
3. Methodology
3.1. Research Framework
Mobile banking applications offer various services, such as an overview of bank account details, financial transaction execution, and loan application. Customers perceive quality through the use of those functionalities as well as through the non-tangible dimensions such as responsiveness, efficiency, feedback, ease of use, usefulness, and security of private data, which result in satisfaction/dissatisfaction with mobile banking applications and affect behavioral intention related to their continued use by consumers.
Responsiveness (RES) refers to the degree to which mobile banking application quickly reacts to users’ requests and actions [39]. Even though the execution of financial transactions can take time, especially from one bank to another or abroad, mobile banking application needs to make sure that it looks like the transaction is instant, even if it gets completed hours or days later. Responsive mobile banking applications enable users to commit multiple transactions in a short period which makes them an efficient and easy-to-use means of payment [19]. In that respect, we propose the following hypotheses:
H1.
Responsiveness has a significant positive impact on efficiency in the context of mobile banking applications.
H2.
Responsiveness has a significant positive impact on the ease of use in the context of mobile banking applications.
Efficiency (EFF) denotes the degree to which the use of mobile banking applications saves clients’ resources [40]. The possibility of consuming bank services wherever and whenever clients need them and providing support for performing immediate actions such as money transfers or bills payment [41] in a few taps instead of waiting in line at the bank saves time, thus making mobile banking applications beneficial for the client. Therefore, we propose the following hypothesis:
H3.
Efficiency has a significant positive impact on usefulness in the context of mobile banking applications.
Feedback quality (FEDQ) presents the degree to which notifications provided by mobile banking applications are concise and unambiguous for the users [42]. Clear and understandable feedback from mobile banking applications facilitates monitoring bank account changes and simplifies insight into conducted and upcoming (that have been initiated but have not yet affected bank account balance) transactions, due payments, etc. [34]. Given that the quality of feedback offered by mobile banking applications affects users’ actions related to managing personal finances, we are proposing the following hypothesis:
H4.
Feedback quality has a significant positive impact on the ease of use in the context of mobile banking applications.
Ease of use (EASE) indicates the extent to which interaction with mobile banking applications is effortless [43]. According to Raza et al. [44], perceived ease of use significantly affects perceived usefulness which, in turn, positively contributes to the adoption of mobile banking. Thus, we propose the following hypothesis:
H5.
Ease of use has a significant positive impact on usefulness in the context of mobile banking applications.
While customer satisfaction (SAT) denotes the degree to which mobile banking application has met clients’ expectations, usefulness (USE) refers to the extent to which the use of mobile banking applications enhances clients’ performances in conducting financial transactions [45]. A recent study completed by Metlo et al. [46] revealed that usefulness and ease of use are significant determinants of customer satisfaction in the banking sector. Additionally, findings of a study carried out by Sampaio et al. [47] indicate that benefits offered by mobile banking are positively related to customer satisfaction. Therefore, we propose the following hypotheses:
H6.
Ease of use has a significant positive impact on customer satisfaction in the context of mobile banking applications.
H7.
Usefulness has a significant positive impact on customer satisfaction in the context of mobile banking applications.
Security of personal data (SEC) indicates the degree to which a client’s data is protected from unauthorized access and use [48]. Banks should take major measures, such as biometric authentication, to provide secure m-banking services. A Pareto analysis conducted by Shankar et al. [2] confirmed that security is one of the most important dimensions when the quality of mobile banking applications is concerned. Mobile applications with implemented security protection mechanisms make people feel safe and more relaxed when using them. In that respect, we propose the following hypothesis:
H8.
The security of personal data has a significant positive impact on customer satisfaction in the context of mobile banking applications.
Behavioral intention (BEH) refers to the extent to which clients are willing to recommend mobile banking applications to people who are important to them and continue using them [40]. Current studies uncovered that customer satisfaction has a significant impact on the profitability of an organization and behavioral intentions such as repeating purchases, saying positive things about the organization, and giving recommendations [49,50]. Therefore, we propose the following hypothesis:
H9.
Customer satisfaction has a significant positive impact on customer behavioral intention in the context of mobile banking applications.
Figure 1 presents the research model, which consists of the aforementioned constructs and hypotheses. A proposed model was conceptualized based on the findings of a study conducted by Jun and Palacios [19], which was focused on uncovering the key dimensions of m-banking service quality.
The null hypothesis of the Kruskal–Wallis test is that the mean ranks of the groups are the same. The age of clients is a key determinant of service quality and adoption in the context of mobile banking. The findings of a study carried out by Merhi et al. [51] suggest that consumer behavioral intention, performance, and effort expectancy are significantly moderated by age. Thus, we propose the following hypothesis:
H10.
There is no significant difference in the perceived quality of mobile banking applications among diverse age groups of their clients.
Considering that all mobile applications share essential functionalities but also have particularities that might affect their perceived quality, we propose the following hypothesis:
H11.
There is no significant difference in the perceived quality among various mobile banking applications.
3.2. Apparatus
Data were collected by administering a post-use questionnaire online through Google Forms in June 2022. The questionnaire comprised 4 items related to participants’ demography (gender, age, occupation, and mobile banking application most commonly used for conducting financial transactions), 2 open-ended items meant for collecting data on the advantages and disadvantages of evaluated mobile banking applications, and 34 items designed for exploring facets of 8 constructs which constitute the research framework: responsiveness (3 items), efficiency (5 items), ease of use (5 items), usefulness (5 items), feedback quality (4 items), security of personal data (4 items), customer satisfaction (4 items), and behavioral intention (4 items). An initial pool of set forth 34 items can be found in Appendix A. Responses to questionnaire items were modulated on a five-point Likert scale (1-strongly disagree, 5-strongly agree).
To assess the validity and reliability of the proposed research framework and to test the established hypotheses, we employed a partial least squares structural equation modeling (PLS-SEM) method. PLS-SEM maximizes the explained variance of the endogenous constructs by examining partial model relationships in a repeated sequence of ordinary least squares (OLS) regressions [41]. In PLS-SEM, construct scores are estimated as exact linear combinations of items that measure their aspects [52]. Our decision to use PLS-SEM rather than covariance-based SEM (CB-SEM) is based on the following three main reasons: (1) PLS-SEM does not require rigorous theoretical background, which makes it well suited for exploratory research [53]; (2) when the sample size is relatively small, PLS-SEM attains higher levels of statistical power compared to CB-SEM [54]; (3) the PLS-SEM algorithm transforms data that significantly depart from a normal distribution according to the central limit theorem thus making parameter estimations highly reliable [55]. PLS-SEM path analysis requires a minimum sample size of either [56]: (i) 10 times the largest number of items assigned to the most complex construct in the model or (ii) 10 times the largest number of exogenous constructs having an impact on an endogenous construct. In the proposed research model, the most complex constructs are measured with five items, while the largest number of exogenous constructs contributing to the endogenous construct is three. Given that the minimum required sample size for our study is 50, a sample size of 130 is considered adequate. The software tool SmartPLS 4.0.8.4 [57] was used to assess the psychometric features of both measurement and the structural model.
Kruskal–Wallis test [58] is a non-parametric counterpart to a single-factor analysis of variance (one-way ANOVA). It does not assume a normal distribution of residuals which makes it suitable for comparing more than two independent samples [59]. In our empirical study, the Kruskal–Wallis test was used to determine whether there is a significant difference in the perceived quality among several age groups of mobile banking application users as well as among mobile banking applications that were involved in our study. Descriptive statistics were used to determine the pros and cons of examined mobile banking applications. The Kruskal–Wallis tests and descriptive statistics were carried out using the IBM SPSS 26 software [60].
3.3. Study Participants and Evaluated Mobile Banking Applications
A total of 130 subjects (64.6% male and 35.4% female) took part in the study. The sample comprised 59.2% students, 38.5% employees, and 2.4% retired participants. The age of respondents ranged from 19 to 63 years (M = 29.2, SD = 12.9). At the time the study was conducted, 60% of participants had between 21 and 23 years. Almost one-third (31.5%) of the sample is using “PBZ mobile banking”, 21.5% of them are employing “George” by “Erste Bank”, 18.5% of them are consuming “m-zaba” by “Zagrebačka banka”, and 17.7% of them are applying “OTP m-banking” when they need to conduct financial transactions such as pay bills or check the balance on their bank accounts. The remaining 10.9% of study participants are users of other mobile banking applications. Login screens of mentioned mobile banking applications that were evaluated in our empirical study are shown in Figure 2.
When the frequency of using services provided by mobile banking applications was considered, we discovered that majority (91.5%) of study participants are obtaining an insight into bank account balances, 67.7% of them are committing money transfers, 53.1% of users are obtaining insights into transaction history, 42.3% of bank clients are using the “Scan & Pay” feature (service that enables bill payments by scanning QR code or barcode), 16.2% of respondents perform transaction signing for the completed electronic purchase while 14.6% of study participant are using mobile banking applications for buying mobile phone vouchers.
4. Results
4.1. Model Assessment
The PLS-SEM path analysis algorithm estimates standardized partial regression coefficients in the structural model after approximating the measurement model parameters [61]. Thus, a two-stage evaluation of the psychometric features of the introduced conceptual model was undertaken. The quality of the measurement model was tested by examining the indicator reliability, internal consistency, convergent validity, and discriminant validity.
Indicator reliability was assessed by exploring the standardized loadings of items with their respective construct. According to Hulland’s purification guidelines [62], items should be retained in the measurement model only if their standardized loadings are equal to or greater than 0.708. Since loadings of items USE3, EFF2, EFF4, and EASE1 were below the recommended threshold value, they were removed from the measurement model and further analysis. The outcome of the confirmatory factor analysis (CFA) shown in Table 1 indicates that standardized loadings of all remaining items in the measurement model were above the acceptable cut-off level. Standardized loadings of items that constitute the measurement model are in the range from 0.708 to 0.937, which means that constructs accounted for between 50.13% and 87.80% of their items’ variance.
Internal consistency of constructs was tested using three indices: Cronbach’s alpha, the composite reliability (rho_C), and the consistent reliability coefficient (rho_A). Cronbach’s alpha [63] is a lower bound estimate of construct reliability based on equal weightings of items. By considering the actual item loadings, composite reliability [64] offers a more accurate estimate of internal consistency than Cronbach’s alpha. The consistent reliability coefficient proposed by Dijkstra and Henseler [65] is an approximately exact measure of construct reliability and, as such, represents a compromise between Cronbach’s alpha and composite reliability [66]. For all three indices, values between 0.60 and 0.70 are acceptable in exploratory studies, values between 0.70 and 0.95 represent good internal consistency, while values above 0.95 indicate item redundancy that plagues content validity [67]. Considering that item SEC3 was poorly worded, it was removed from the measurement model, which resulted in values that were in the acceptable range for all three internal consistency indices of the associated security of personal data construct. As shown in Table 2, estimated values for all three set forth indices were in a range from 0.740 to 0.949, thus implying good internal consistency of all eight constructs in the research framework.
Convergent validity was examined with average variance extracted (AVE). An AVE value of 0.50 and higher is considered acceptable because it indicates that the shared variance between a construct and its items exceeds the variance of the measurement error [66]. Study findings presented in Table 2 imply that all constructs in the research model have met the requirements of this criterion.
Discriminant validity refers to the degree to which a particular construct is unique when compared with the remaining ones in the model. It was examined with three measures: the cross-loadings, the Fornell–Larcker criterion, and the Heterotrait–Monotrait ratio of correlations (HTMT).
The cross-loadings measure suggests that the outer loading of each item on the associated construct should be greater than its loadings on the remaining constructs in the model. As shown in Table 1, this appeared to be true for all items in the measurement model of the proposed research framework, which suggests that the requirements of the first measure of discriminant validity have been met. The Fornell–Larcker criterion [68] states that the square root of the AVE of each construct should be greater than its highest correlation with any other construct in the model. Results presented in Table 3 indicate that each construct shares more variance with items that are allocated to it (bold values on the diagonal) than with remaining constructs in the model, thus confirming that the requirements of the second measure of discriminant validity are met.
The Fornell–Larcker criterion is less effective when item loadings on a construct differ by a small amount [66], so Henseler et al. [69] proposed the Heterotrait–Monotrait ratio (HTMT) of the correlations as an alternative measure of discriminant validity. HTMT represents the ratio of the mean value of all correlations of indicators that measure different constructs and the mean value of correlations of indicators that measure the same construct. If there are related constructs in the model, then values above 0.90 imply the absence of discriminant validity, while in the case of conceptually different constructs in the model, the threshold value is set to 0.85 [67]. As presented in Table 4, the HTMT of all constructs in the research framework is below the cut-off value, which indicates that the requirements of the third and last measure of discriminant validity have been met and that constructs are sufficiently different. All of the above confirms that the measurement model is quite reliable and valid.
As soon as the measurement model was determined to be adequate, the appropriateness of the structural model was examined by testing collinearity, path significance, coefficient of determination, effect size, relative measure of predictive relevance, and prediction-oriented results assessment.
The evaluation of the structural model includes the estimation of many regression equations which represent the relationships between constructs. If two or more constructs in the structural model capture similar concepts, they will exhibit too much collinearity, and as a result, estimated partial regression coefficients could potentially be biased. Variance Inflation Factor (VIF) is a commonly used indicator for determining if collinearity among predictor constructs in the structural model exists. Although VIF values of 5 or higher suggest collinearity issues among exogenous constructs, they can easily occur even at VIF values of 3 [66]. Therefore, VIF values should be close to 3 or lower. As shown in Table 5, VIF values for predictor constructs are in a range from 1.000 to 1.721 thus confirming the lack of collinearity in the structural model.
The model’s explanatory power is examined with the coefficient of determination (), which represents the proportion of endogenous constructs’ variance explained by the set of its predictors. The particularities of the research discipline and study being carried out play an important role in determining the acceptable values of [70]. According to Orehovački [71], in empirical studies on software quality evaluation values of 0.15, 0.34, and 0.46 suggest weak, moderate, and substantial explanatory power of exogenous constructs in the research model, respectively. It is a common practice to interpret adjusted since it tailors the value of concerning the size of the model [67]. Study results presented in Table 6 indicate that 39.5% variance in behavioral intention was explained by customer satisfaction, 40.3% of the variance in ease of use was accounted for by responsiveness and feedback quality, 20.3% of the variance in efficiency was explained by responsiveness, 60.9% of the variance in customer satisfaction was accounted for by the ease of use, usefulness, and security of personal data while 45.2% of the variance in usefulness was accounted for by efficiency and ease of use. Considering the aforementioned, determinants of customer satisfaction and usefulness have substantial explanatory power, predictors of behavioral intention and ease of use have moderate explanatory power, while the antecedent of responsiveness has weak explanatory power.
The hypothesized interplay among constructs in the research framework was examined by evaluating the goodness of path coefficients. Through bootstrapping resampling procedure, asymptotic two-tailed t-statistics were used to test the significance of path coefficients. While the number of cases was the same as the sample size, the number of bootstrap samples was 5.000. The outcome of testing the hypotheses is presented in Table 7. It was discovered that ease of use (β = 0.277, p < 0.05), usefulness (β = 0.465, p < 0.0001), and security of personal data (β = 0.228, p < 0.05) significantly contribute to customer satisfaction, thus providing support for H6, H7, and H8, respectively. Data analysis also uncovered that responsiveness (β = 0.459, p < 0.0001) and feedback quality (β = 0.282, p < 0.0001) significantly affect the ease of use, thereby supporting hypotheses H2 and H4. Furthermore, efficiency (β = 0.380, p < 0.0001) and ease of use (β = 0.369, p < 0.0001) were found to have a significant impact on usefulness, thus demonstrating support for H3 and H5, respectively. Study findings also indicate that responsiveness (β = 0.460, p < 0.0001) is a significant determinant of efficiency and that customer satisfaction (β = 0.634, p < 0.0001) is a significant antecedent of behavioral intention, which provides support for H1 and H9, respectively.
The effect size () refers to the change in the coefficient of determination of endogenous construct. Values for of 0.02, 0.15, or 0.35 indicate that the exogenous construct has a small, medium, or large impact on the endogenous construct, respectively [72]. Considering the values presented in Table 8, customer satisfaction ( = 0.671) has a large influence on behavioral intention. Customer satisfaction is strongly affected by usefulness ( = 0.348), and modestly by both ease of use ( = 0.119) and security of private data ( = 0.115). Responsiveness ( = 0.277) has a medium impact on the ease of use which in turn is affected by feedback quality ( = 0.104) to a small extent. Finally, it appeared that responsiveness is medium in size ( = 0.268) predecessors of efficiency while both efficiency ( = 0.157) and ease of use ( = 0.148) have a medium impact on usefulness.
The nonparametric Stone’s [73] and Geisser’s [74] cross-validated redundancy measure that drawing on the blindfolding reuse technique predicts the endogenous construct’s items is commonly applied for testing the predictive validity of exogenous constructs. However, since combines aspects of out-of-sample prediction and in-sample explanatory power [75], it does not represent a measure of out-of-sample prediction [66]. To address the set forth, Shmueli et al. [75,76] developed a PLSpredict algorithm as an alternative approach for evaluating the predictive relevance of a model. PLSpredict employs k-fold cross-validation (where a fold is a subgroup of the total sample, and k is the number of subgroups) to determine whether the model outperforms the most naïve linear regression benchmark (referred to as and defined as the indicator means from the analysis sample) [66,67,76]. PLS path models with values above 0 have lower prediction errors than those given by the most naïve benchmark. Given that can be interpreted similarly as , its values greater than 0, 0.25, and 0.5 point to small, medium, and large predictive relevance of the PLS path model [66]. The predictive power of a model is usually examined with the root mean squared error (RMSE), but in the case of highly non-symmetric distribution of prediction errors, the mean absolute error (MAE) should be used as an alternative [76]. The evaluation procedure represents a comparison of the RMSE (or MAE) values with a naïve benchmark that generates predictions for items by using a linear regression model (LM). The outcome of the comparison can be one of the following [76]: (a) if prediction errors in terms of RMSE (or MAE) values are higher than those of the naïve LM benchmark for all items, the model lacks predictive power; (b) if the majority of endogenous construct items have higher prediction errors when compared to the naïve LM benchmark, this indicates that model has a low predictive power; (c) if the minority (or the same number) of construct items have higher prediction errors when compared to the naïve LM benchmark, this suggests that model has a medium predictive power; (d) if none of the items has higher RMSE (or MAE) values compared to the naïve LM benchmark, the model has high predictive power.
Visual inspection of error histograms uncovered that the distribution of prediction errors is highly non-symmetric. Hence, we based predictive power evaluation on MAE. As shown in the fourth column of Table 9, the majority of endogenous construct items have higher PLS-SEM_MAE values when compared to the naïve LM_MAE benchmark, which suggests that the proposed model has low predictive power.
Changes in reflect the relative impact () of exogenous constructs in predicting the observed measures of endogenous construct in the structural model. According to [53], values of 0.02, 0.15, or 0.35 signify that a particular exogenous construct has weak, moderate, or substantial relevance in predicting an endogenous construct, respectively. Values of are calculated as follows [72]:
refers to the value of an endogenous construct when the observed exogenous construct is included in the model estimation while refers to the value of an endogenous construct when the observed exogenous construct is excluded from the model estimation. Study results provided in Table 10 suggest that customer satisfaction ( = 0.227) has moderate relevance in predicting behavioral intention related to continued interaction with mobile banking applications. While responsiveness ( = 0.252) is a moderate predictor, feedback quality ( = 0.075) appeared to be a weak predictor of ease of use in the context of mobile banking applications. Responsiveness ( = 0.224) was also found to have moderate relevance in predicting the efficiency of mobile banking applications. While ease of use ( = 0.242) has moderate relevance and security of personal data ( = 0.062) has weak relevance, usefulness ( = 0.013) does not have sufficient relevance in predicting customer satisfaction with mobile banking applications. Finally, ease of use appeared to have weak relevance ( = 0.119) in predicting the usefulness of mobile banking applications while efficiency is not relevant enough ( = 0.005) in that respect.
4.2. User Groups Comparisons
For the first comparison, study participants were divided into four independent groups of mobile banking application users. To determine if a significant difference in the perceived quality among mobile banking applications exists, and thus to test the H10 hypothesis, data that were collected with questionnaire items designed for measuring diverse dimensions of quality constructs were combined into a single-score indicator of perceived quality. More specifically, the composite measure of perceived quality represents the arithmetic mean of all responses of each study participant to the aforementioned questionnaire items. Since we only considered users of the four most commonly used mobile banking applications (PBZ mobile banking, Erste George, m-zaba, and OTP m-banking), out of 130 study participants, responses of 116 of them were used in this analysis. Results of the Kruskal–Wallis H test showed that there is no statistically significant difference in the perceived quality among four mobile banking applications that were examined in our study (χ2(3) = 0.648, p = 0.885), thus providing support for the H10 hypothesis. The box plot, which illustrates item means per four commonly used mobile banking applications in Croatia, is shown in Figure 3. Note that dots in the box plot indicate mild outliers.
Results of analyzing the composite measure revealed that the highest level of perceived quality among examined mobile banking applications belongs to m-zaba (M = 4.63, SD = 0.305), followed by PBZ mobile banking (M = 4.59, SD = 0.369), Erste George (M = 4.54, SD = 0.469), and OTP m-banking (M = 4.49, SD = 0.459) that appeared to have the lowest level of perceived quality.
For the second comparison, study respondents were split into three age groups: 19–24 years, 25–49 years, and 50–65 years. Group 1 (age 19–24) consisted of 85 subjects, group 2 (age 25–49) was composed of 25 participants, and group 3 (age 50–65) comprised 19 respondents. The composite measure of perceived quality was used here in the same manner as in the first user group comparison. The outcome of the Kruskal–Wallis H test suggests that there is a statistically significant difference in the perceived quality of mobile banking applications among three age groups of users (χ2(2) = 8.685, p = 0.13), thus rejecting the H11 hypothesis. To follow up on this finding, post hoc analysis with a Bonferroni pairwise comparison in which the significance level was set at p < 0.0167 was applied. We, in particular, discovered that a significant difference in perceived quality (Z = −2.705, p = 0.007) exists between study participants who belong to the first (19–24 years) and the third (50–65 years) age groups of mobile banking applications users while differences in remaining pairwise comparisons were not significant. The box plot, which depicts composite perceived quality per three age groups of mobile banking application users, is shown in Figure 4. Note that dots in the box plot represent mild outliers while the extreme outlier is marked with an asterisk.
The analysis of the composite measure uncovered that the third (50–65 years) age group of users is the least demanding (M = 4.74, SD = 0.335) when the quality of mobile banking applications is considered since they gave them the highest scores, followed by the second (25–49 years) group of study participants (M = 4.64, SD = 0.429), while the evaluated mobile banking applications received the lowest ratings (M = 4.52, SD = 0.392) from users belonging to the first (19–24 years) age group of respondents.
4.3. Pros and Cons of Mobile Banking Applications
The analysis of responses to two open-ended questionnaire items uncovered that efficiency, ease of use, and usefulness are the most relevant advantages of the most commonly used mobile banking applications in Croatia since aspects of these quality constructs were reported by 46, 26, and 18 respondents, respectively. Only two study participants have singled out the security of personal data as the strength of mobile banking applications. On the other hand, lack of relevant functionalities (15), security concerns (8), issues with responsiveness (7), difficulties in use (4), and various technical problems, including common updates (3), were recognized by clients of mobile banking applications as their biggest shortcomings.
5. Discussion
This paper offers several contributions to the extant body of knowledge. Researchers can use the reported findings as a foundation for further advances in the field by employing the introduced post-use questionnaire for evaluating the quality of mobile banking applications in their countries and financial ecosystems. They can also extend the proposed research framework with additional dimensions of perceived quality and examine their interplay with the existing constructs in the conceptual model as well as their impact on the satisfaction and behavioral intentions of mobile banking application users. Banks can employ study results as a set of recommendations for increasing the quality of mobile banking applications by reducing the number of unnecessary features and improving or keeping the good ones. Outcomes of the literature review and our empirical study indicate that people use mobile banking applications because of their efficiency and usefulness, but some are still concerned with security issues and a lack of relevant functionalities. The proposed conceptual model evaluation results have shown that responsiveness represents an important quality determinant when mobile banking applications are considered since it affects their efficiency and ease of use. Users perceive mobile banking applications as responsive even when the real performance (e.g., transaction execution) is not that efficient. According to the reported study findings, if mobile banking applications respond to clients’ requests and actions in the blink of an eye, they will enable clients to commit multiple transactions in a short amount of time and be perceived by them as easy-to-use pieces of software, which is in line with conclusions drawn by Jun and Palacios [19]. We also discovered that if a mobile banking application enables the user to execute financial transactions quickly, they will perceive it as a beneficial and suitable replacement for internet banking which complies with the results of a study conducted by Laukkanen [41]. It also appeared that feedback quality significantly contributes to the ease of using mobile banking applications, which is consistent with the results of a study carried out by Zhou [34], who found that clear and complete feedback from mobile banking applications gives the user an easy insight into account balance changes. The findings of our empirical study also indicate that users will perceive mobile banking applications as useful if the execution of their services is effortless, which supports the results of a study completed by Raza et al. [44]. We also found that consumers will be happy to use a mobile banking application if it enables them to easily perform financial transactions, which is in line with the results of a study carried out by Metlo et al. [46]. Moreover, outcomes of the research framework analysis confirmed that perceived benefits offered by mobile banking applications have a significant impact on customer satisfaction which confirms the findings of Sampaio et al. [47]. Shankar et al. [2] emphasized that security is one of the most important dimensions of quality when mobile banking applications are tackled. The analysis of the conceptual model revealed that if users feel safe while conducting financial transactions with a mobile banking application, they will enjoy using it. We also discovered that if a mobile banking application has met users’ expectations, they would like to continue to use it and recommend it to people who are relevant to them, which complies with the findings of current studies [49,50]. Merhi et al. [51] revealed that age has a significant moderating effect on the adoption of mobile banking. As a follow-up, we found that there is a significant difference in the perceived quality of mobile banking applications among different age groups of their users. This suggests that during the design of mobile banking applications, particularities of different age groups of users, especially youth and elderly clients, should be taken into consideration since they might affect how the quality of mobile banking applications will be perceived. However, no significant difference was uncovered when the perceived quality among different mobile banking applications was examined. The reason for the set forth could be that all mobile banking applications offer a similar set of features and services to their clients and share the same context of use. When we evaluated the single-score composite measures of mobile banking applications that were involved in the study, we uncovered that m-zaba has the highest while OTP m-banking has the lowest level of perceived quality in that respect. We also confirmed that consumers from Croatia, just like clients from the United States [12], are most commonly using mobile banking applications to check their bank account balances. Finally, efficiency, ease of use, and usefulness were recognized as the most relevant advantages of examined mobile banking applications, while a lack of features (particularly the ones related to the personalization of provided services) and security concerns were reported as their main flaws.
6. Limitations
As is the case in all empirical studies, this one also has its limitations that need to be acknowledged. First, there is a homogeneity of the study participants. Although the sample was comprised of bank clients that differed by their occupation, the majority of them were students aged 20–25 years. Given that the demographic heterogeneity of study participants could result in completely different responses to post-use questionnaire items, the reported findings should be interpreted cautiously. The second limitation is that the presented results cannot be generalized to all mobile banking applications but only to those that were involved in the study and are used in Croatia. Namely, every mobile banking application has its peculiarities that could affect the perception of some or all dimensions of quality. In addition, the relevance of particular quality aspects may depend on the cultural background of mobile banking application consumers. In light of this, further studies are necessary to assess the robustness of reported findings and to draw sound generalizable conclusions.
7. Conclusions
Bank clients will be eager to regularly use the features of mobile banking applications and recommend them to anyone who requires conducting financial transactions if the peculiarities of mobile banking applications comply with their expectations and needs. The extent to which bank clients will enjoy interaction with mobile banking applications depends greatly on the degree to which they feel that mobile banking applications facilitate the management of their finances, prevent unauthorized access to their accounts, and execute financial transactions without requiring too much effort. If interaction with mobile banking applications is straightforward to bank clients and the use of services they provide requires a small amount of time, they will find them beneficial for conducting financial transactions. The mobile banking applications will be perceived by bank clients as easy to use if they promptly respond to their requests and if they provide them with clear and understandable notifications. Finally, bank clients will be able to perform immediate financial transactions if mobile banking applications respond quickly to their requests. The age of users significantly affects the perceived quality of mobile banking applications, while banks, as their providers, appeared to be irrelevant in that respect. Therefore, requirements of all age groups of users need to be considered during the development of mobile banking applications. Efficiency, ease of use, and usefulness are dimensions of perceived quality whose requirements are met by mobile banking applications that were involved in our empirical study and which therefore reflect their main strengths. However, to improve the perceived quality of mobile banking applications that are commonly used in Croatia, banks need to address security concerns reported by their clients and enhance the set of functionalities each of these applications offers. All of the aforementioned can be used as a set of recommendations and guidelines when designing novel and upgrading existing mobile banking applications.
As a part of our future work, we will explore differences in the perceived quality among examined mobile banking applications at all levels of granularity in the proposed research model, not just from the perspective of the single-score composite measure as we performed in our current study. We are also planning to extend the introduced research framework with additional subjective and objective dimensions of quality relevant to the context of mobile banking applications, which might have a significant impact on customers’ satisfaction and their behavioral intentions, thus increasing the predictive power of the current conceptual model. Finally, in our further studies, we will employ different methods for collecting data and enhance the sample with participants from various countries to determine if and to what extent their origin plays an important role in the perception of quality when mobile banking applications are considered.
Author Contributions
Conceptualization, T.O., L.B. and M.K.; methodology, T.O., L.B. and M.K.; software, T.O., L.B. and M.K.; validation, T.O., L.B. and M.K.; formal analysis, T.O.; investigation, L.B. and M.K.; resources, T.O.; data curation, T.O., L.B. and M.K.; writing—original draft preparation, L.B. and M.K.; writing—review and editing, T.O.; visualization, T.O., L.B. and M.K.; supervision, T.O.; project administration, T.O.; funding acquisition, T.O. All authors have read and agreed to the published version of the manuscript.
Funding
This work has been supported by the Croatian Science Foundation (grant number IRP-2017-05-7625).
Institutional Review Board Statement
The study was conducted in accordance with the Declaration of Helsinki, and approved by the Research Ethics Committee of Juraj Dobrila University of Pula (23 December 2022).
Informed Consent Statement
Informed consent was obtained from all subjects involved in the study.
Data Availability Statement
The data presented in this study are available on request from the corresponding author. The data are not publicly available due to privacy restrictions.
Conflicts of Interest
The authors declare no conflict of interest.
Appendix A
- Responsiveness (RES)
RES1. Response time during the execution of services offered by a mobile banking application is acceptable.
RES2. The time required for authentication when launching a mobile banking application is acceptable.
RES3. Response time when refreshing the mobile banking application is acceptable.
- Efficiency (EFF)
EFF1. Mobile banking application enables me to quickly perform actions related to managing my finances [19].
EFF2. Mobile banking application enables fast execution of financial transactions.
EFF3. The services provided by a mobile banking application can be performed in a small number of steps.
EFF4. Executing financial transactions through a mobile banking application saves time.
EFF5. Mobile banking application allows me to conduct financial transactions efficiently [26].
- Ease of use (EASE)
EASE1. Mobile banking application allows me to easily perform actions related to managing my finances.
EASE2. I do not put much effort into using the services provided by a mobile banking application.
EASE3. It is easy to conduct financial transactions using a mobile banking application.
EASE4. The mobile banking application is easy to use [19].
EASE5. Mobile banking application gives me easy insight into account balances.
- Usefulness (USE)
USE1. Using the mobile banking application contributes to a higher quality of performing bank services [19].
USE2. I find the mobile banking application appropriate for performing financial transactions.
USE3. I believe that the mobile banking application is suitable for checking account balances.
USE4. The use of a mobile banking application increases the performance of users in conducting financial transactions.
USE5. I believe that the mobile banking application facilitates the management of personal finances.
- Feedback Quality (FEDQ)
FEDQ1. Mobile banking application gives me clear feedback.
FEDQ2. The mobile banking application offers me complete feedback.
FEDQ3. Mobile banking application provides me with timely feedback [77].
FEDQ4. Mobile banking application gives me relevant feedback.
- Security of Personal Data (SEC)
SEC1. I believe that mobile banking application protects my personal information [78].
SEC2. I feel safe while working with the mobile banking application.
SEC3. I believe that mobile banking application protects my privacy.
SEC4. I feel safe when submitting personal data to a mobile banking application.
- Customer satisfaction (SAT)
SAT1. I am satisfied with the quality of services offered by a mobile banking application [79].
SAT2. I am happy with the way financial transactions are executed using the mobile banking application.
SAT3. The mobile banking application has met all my expectations.
SAT4. It is pleasant to use a mobile banking application.
- Behavioral Intention (BEH)
BEH1. I intend to continue to use a mobile banking application [80].
BEH2. I will use a mobile banking application often in the future.
BEH3. I would recommend the use of a mobile banking application to people that are important to me [80].
BEH4. I would recommend the use of a mobile banking application to anyone who needs to carry out financial transactions.
- Note that items in italic are removed from the research framework because they failed to meet the requirements of reliability indices.
References
- Shaikh, A.A.; Karjaluoto, H. Mobile banking adoption: A literature review. Telemat. Inform. 2015, 32, 129–142. [Google Scholar] [CrossRef] [Green Version]
- Shankar, A.; Datta, B.; Jebarajakirthy, C.; Mukherjee, S. Exploring Mobile Banking Service Quality: A Qualitative Approach. Serv. Mark. Q. 2020, 41, 182–204. [Google Scholar] [CrossRef]
- Arcand, M.; PromTep, S.; Brun, I.; Rajaobelina, L. Mobile banking service quality and customer relationships. Int. J. Bank Mark. 2017, 35, 1068–1089. [Google Scholar] [CrossRef]
- Laukkanen, T. Mobile banking. Int. J. Bank Mark. 2017, 35, 1042–1043. [Google Scholar] [CrossRef] [Green Version]
- Meola, A. Mobile Payments Technology and Contactless Payments Explained. Business Insider. Available online: http://uk.businessinsider.com/mobile-payment-technology-contactless-payments-explained-2016-11 (accessed on 14 November 2022).
- Aker, J.C.; Mbiti, I.M. Mobile Phones and Economic Development in Africa. J. Econ. Perspect. 2010, 24, 207–232. [Google Scholar] [CrossRef] [Green Version]
- Chaouali, W.; Souiden, N. The role of cognitive age in explaining mobile banking resistance among elderly people. J. Retail. Consum. Serv. 2019, 50, 342–350. [Google Scholar] [CrossRef]
- Mihovilić, A.; Hunjet, A.; Vuković, D. Identification and motives of mobile banking users. CroDiM Int. J. Mark. Sci. 2021, 4, 17–34. [Google Scholar]
- Wazid, M.; Zeadally, S.; Das, A.K. Mobile Banking: Evolution and Threats: Malware Threats and Security Solutions. IEEE Consum. Electron. Mag. 2019, 8, 56–60. [Google Scholar] [CrossRef]
- Ali, A.; Hameed, A.; Moin, M.F.; Khan, N.A. Exploring factors affecting mobile-banking app adoption: A perspective from adaptive structuration theory. Aslib J. Inf. Manag. 2022, in press. [Google Scholar] [CrossRef]
- Schindler, E. One Year Later: How COVID-19 Is Impacting Mobile Banking Trends. Available online: https://www.fisglobal.com/en/insights/what-we-know/2021/march/one-year-on-the-impact-of-covid-19-on-mobile-banking (accessed on 14 November 2022).
- Statista. Mobile Banking in the U.S.—Statistics & Facts. Available online: https://www.statista.com/topics/2614/mobile-banking/ (accessed on 14 November 2022).
- Purohit, S.; Arora, R. The benefits and challenges of mobile banking at the Bottom of the pyramid. J. Contemp. Issues Bus. Gov. 2021, 27, 2222–2229. [Google Scholar]
- Khemiri, M.; Jallouli, R. Technology-enabled Personalization for Mobile Banking Services. Aust. J. Telecommun. Digit. Econ. 2022, 10, 173–194. [Google Scholar] [CrossRef]
- Bui, N.; Moore, Z.; Wimmer, H.; Pham, L. Predicting Customer Loyalty in the Mobile Banking Setting. Int. J. E-Serv. Mob. Appl. 2022, 14, 1–22. [Google Scholar] [CrossRef]
- Parasuraman, A.; Ziethaml, V.; Berry, L.L. SERVQUAL: A Multiple- Item Scale for Measuring Consumer Perceptions of Service Quality. J. Retail. 1985, 64, 12–40. [Google Scholar]
- Amiri Aghdaie, S.F.; Faghani, F. Mobile Banking Service Quality and Customer Satisfaction (Application of SERVQUAL Model). Int. J. Manag. Bus. Res. 2012, 2, 351–361. [Google Scholar]
- Pejić Bach, M.; Starešinić, B.; Omazić, M.A.; Aleksić, A.; Seljan, S. m-Banking Quality and Bank Reputation. Sustainability 2020, 12, 4315. [Google Scholar] [CrossRef]
- Jun, M.; Palacios, S. Examining the key dimensions of mobile banking service quality: An exploratory study. Int. J. Bank Mark. 2016, 34, 307–326. [Google Scholar] [CrossRef]
- Rejman Petrović, D.; Nedeljković, I.; Marinković, V. The role of the hedonistic and utilitarian quality dimensions in enhancing user satisfaction in mobile banking. Int. J. Bank Mark. 2022, 40, 1610–1631. [Google Scholar] [CrossRef]
- Naeem, M.; Ozuem, W.; Ward, P. Understanding the accessibility of retail mobile banking during the COVID-19 pandemic. Int. J. Retail. Distrib. Manag. 2022, 50, 860–879. [Google Scholar] [CrossRef]
- Lin, H.H.; Wang, Y.S. An examination of the determinants of customer loyalty in mobile commerce contexts. Inf. Manag. 2006, 43, 271–282. [Google Scholar] [CrossRef]
- Zhou, T. Examining mobile banking user adoption from the perspectives of trust and flow experience. Inf. Technol. Manag. 2011, 13, 27–37. [Google Scholar] [CrossRef]
- Abdus Salam, M.; Saha, T.; Habibur Rahman, M.; Mutsuddi, P. Challenges to Mobile Banking Adaptation in COVID-19 Pandemic. Int. J. Bus. Manag. Sci. 2021, 9, 101–113. [Google Scholar] [CrossRef]
- Msweli, N.T.; Mawela, T. Financial Inclusion of the Elderly: Exploring the Role of Mobile Banking Adoption. Acta Inform. Pragensia 2021, 10, 1–21. [Google Scholar] [CrossRef]
- Saprikis, V.; Avlogiaris, G.; Katarachia, A. A Comparative Study of Users versus Non-Users’ Behavioral Intention towards M-Banking Apps’ Adoption. Information 2022, 13, 30. [Google Scholar] [CrossRef]
- Kumar, A.; Dhingra, S.; Batra, V.; Purohit, H. A Framework of Mobile Banking Adoption in India. J. Open Innov. Technol. Mark. Complex. 2020, 6, 40. [Google Scholar] [CrossRef]
- Abu-Taieh, E.M.; AlHadid, I.; Abu-Tayeh, S.; Masa’deh, R.; Alkhawaldeh, R.S.; Khwaldeh, S.; Alrowwad, A. Continued Intention to Use of M-Banking in Jordan by Integrating UTAUT, TPB, TAM and Service Quality with ML. J. Open Innov. Technol. Mark. Complex. 2022, 8, 120. [Google Scholar] [CrossRef]
- Hanafizadeh, P.; Behboudi, M.; Abedini Koshksaray, A.; Jalilvand Shirkhani Tabar, M. Mobile-banking adoption by Iranian bank clients. Telemat. Inform. 2014, 31, 62–78. [Google Scholar] [CrossRef]
- Bankole, F.O.; Bankole, O.O.; Brown, I. Mobile Banking Adoption in Nigeria. Electron. J. Inf. Syst. Dev. Ctries. 2011, 47, 1–23. [Google Scholar] [CrossRef]
- Shankar, A.; Tiwari, A.K.; Gupta, M. Sustainable mobile banking application: A text mining approach to explore critical success factors. J. Enterp. Inf. Manag. 2021, 35, 414–428. [Google Scholar] [CrossRef]
- Ghobakhloo, M.; Fathi, M. Modeling the Success of Application-Based Mobile Banking. Economies 2019, 7, 114. [Google Scholar] [CrossRef] [Green Version]
- Chung, N.; Kwon, S.J. Effect of trust level on mobile banking satisfaction: A multi-group analysis of information system success instruments. Behav. Inf. Technol. 2009, 28, 549–562. [Google Scholar] [CrossRef]
- Zhou, T. An empirical examination of initial trust in mobile banking. Internet Res. 2011, 21, 527–540. [Google Scholar] [CrossRef]
- Lee, K.C.; Chung, N. Understanding factors affecting trust in and satisfaction with mobile banking in Korea: A modified DeLone and McLean’s model perspective. Interact. Comput. 2009, 21, 385–392. [Google Scholar] [CrossRef]
- Tam, C.; Oliveira, T. Understanding mobile banking individual performance: The DeLone & McLean model and the moderating effects of individual culture. Internet Res. 2017, 27, 538–562. [Google Scholar] [CrossRef]
- Koo, C.; Wati, Y.; Chung, N. A Study of Mobile and Internet Banking Service: Applying for IS Success Model. Asia Pac. J. Inf. Syst. 2013, 23, 65–86. [Google Scholar]
- Damabi, M.; Firoozbakht, M.; Ahmadyan, A. A Model for Customers Satisfaction and Trust for Mobile Banking Using DeLone and McLean Model of Information Systems Success. J. Soft Comput. Decis. Support Syst. 2018, 5, 21–28. [Google Scholar]
- Orehovački, T.; Babić, S. Identifying the Relevance of Quality Dimensions Contributing to Universal Access of Social Web Applications for Collaborative Writing on Mobile Devices: An Empirical Study. Univers. Access Inf. Soc. 2018, 17, 453–473. [Google Scholar] [CrossRef]
- Orehovački, T.; Granić, A.; Kermek, D. Evaluating the Perceived and Estimated Quality in Use of Web 2.0 Applications. J. Syst. Softw. 2013, 86, 3039–3059. [Google Scholar] [CrossRef]
- Laukkanen, T. Internet vs mobile banking: Comparing customer value perceptions. Bus. Process. Manag. J. 2007, 13, 788–797. [Google Scholar] [CrossRef]
- Orehovački, T.; Babić, S. Mobile Quality of Social Web Applications Designed for Collaborative Writing. In Learning and Collaboration Technologies; LCT, 2016; Zaphiris, P., Ioannou, A., Eds.; Lecture Notes in Computer Science; Springer: Cham, Switzerland, 2016; Volume 9753, pp. 368–379. [Google Scholar] [CrossRef]
- Orehovački, T.; Babić, S.; Jadrić, M. Exploring the Validity of an Instrument to Measure the Perceived Quality in Use of Web 2.0 Applications with Educational Potential. In Proceedings of the Learning and Collaboration Technologies. Designing and Developing Novel Learning Experiences, LCT 2014, Crete, Greece, 22–27 June 2014; Zaphiris, P., Ioannou, A., Eds.; Lecture Notes in Computer Science. Springer: Cham, Switzerland, 2014; Volume 8523, pp. 192–203. [Google Scholar] [CrossRef]
- Raza, S.A.; Umer, A.; Shah, N. New determinants of ease of use and perceived usefulness for mobile banking adoption. Int. J. Electron. Cust. Relatsh. Manag. 2017, 11, 44–65. [Google Scholar] [CrossRef]
- Orehovački, T. Proposal for a Set of Quality Attributes Relevant for Web 2.0 Application Success. In Proceedings of the 32nd International Conference on Information Technology Interfaces, Cavtat, Croatia, 21–24 June 2010; Lužar-Stiffler, V., Jarec, I., Bekić, Z., Eds.; University of Zagreb Computing Centre: Zagreb, Croatia, 2010; pp. 319–326. [Google Scholar]
- Metlo, M.; Sanaullah, A.; Nazar, H.; Ghulam, S.; Kamran, P. Impact of Mobile Banking on Customers’ Satisfaction. Int. J. Manag. Pract. 2021, 12, 1263–1271. [Google Scholar] [CrossRef]
- Sampaio, C.H.; Ladeira, W.J.; Santini, F.D.O. Apps for mobile banking and customer satisfaction: A cross-cultural study. Int. J. Bank Mark. 2017, 35, 1133–1153. [Google Scholar] [CrossRef]
- Orehovački, T. Perceived Quality of Cloud Based Applications for Collaborative Writing. In Information Systems Development—Business Systems and Services: Modeling and Development; Pokorny, J., Repa, V., Richta, K., Wojtkowski, W., Linger, H., Barry, C., Lang, M., Eds.; Springer: New York, NY, USA, 2011; pp. 575–586. [Google Scholar] [CrossRef]
- Barsky, J.D. Customer Satisfaction in the Hotel Industry. Hosp. Res. J. 1992, 16, 51–73. [Google Scholar] [CrossRef]
- Ryu, K.; Lee, H.-R.; Kim, W.G. The influence of the quality of the physical environment, food, and service on restaurant image, customer perceived value, customer satisfaction, and behavioral intentions. Int. J. Contemp. Hosp. Manag. 2012, 24, 200–223. [Google Scholar] [CrossRef]
- Merhi, M.; Hone, K.; Tarhini, A.; Ameen, N. An empirical examination of the moderating role of age and gender in consumer mobile banking use: A cross-national, quantitative study. J. Enterp. Inf. Manag. 2020, 34, 1144–1168. [Google Scholar] [CrossRef]
- Hair, J.F.; Sarstedt, M.; Ringle, C.M.; Mena, J.A. An assessment of the use of partial least squares structural equation modeling in marketing research. J. Acad. Mark. Sci. 2012, 40, 414–433. [Google Scholar] [CrossRef]
- Henseler, J.; Ringle, C.M.; Sinkovics, R.R. The use of partial least squares path modeling in international marketing. Adv. Int. Mark. 2009, 20, 277–319. [Google Scholar] [CrossRef] [Green Version]
- Tenenhaus, M.; Esposito Vinzi, V.; Chatelin, Y.-M.; Lauro, C. PLS path modeling. Comput. Stat. Data Anal. 2005, 48, 159–205. [Google Scholar] [CrossRef]
- Hair, J.F.; Ringle, C.M.; Sarstedt, M. PLS-SEM: Indeed a silver bullet. J. Mark. Theory Pract. 2011, 19, 139–151. [Google Scholar] [CrossRef]
- Gefen, D.; Straub, D.; Boudreau, M.C. Structural equation modeling and regression: Guidelines for research practice. Commun. Assoc. Inf. Syst. 2000, 4, 2–77. [Google Scholar] [CrossRef] [Green Version]
- Ringle, C.M.; Wende, S.; Becker, J.-M. SmartPLS 4. Oststeinbek: SmartPLS GmbH. 2022. Available online: http://www.smartpls.com (accessed on 14 November 2022).
- Kruskal, W.H.; Wallis, W.A. Use of Ranks in One-Criterion Variance Analysis. J. Am. Stat. Assoc. 1952, 47, 583–621. [Google Scholar] [CrossRef]
- Ostertagová, E.; Ostertag, O.; Kováč, J. Methodology and Application of the Kruskal-Wallis Test. Appl. Mech. Mater. 2014, 611, 115–120. [Google Scholar] [CrossRef]
- IBM SPSS Statistics for Windows, Version 26.0; IBM Corp: Armonk, NY, USA, 2019.
- Esposito Vinzi, V.; Trinchera, L.; Amato, S. PLS path modeling: From foundations to recent developments and open issues for model assessment and improvement. In Handbook of Partial Least Squares; Esposito Vinzi, V., Chin, W.W., Henseler, J., Wang, H., Eds.; Springer: Berlin/Heidelberg, Germany, 2010; pp. 47–82. [Google Scholar] [CrossRef]
- Hulland, J. Use of partial least squares (PLS) in strategic management research: A review of four recent studies. Strateg. Manag. J. 1999, 20, 195–204. [Google Scholar] [CrossRef]
- Cronbach, L.J. Coefficient alpha and the internal structure of tests. Psychometrika 1951, 16, 297–334. [Google Scholar] [CrossRef] [Green Version]
- Werts, C.E.; Linn, R.L.; Jöreskog, K.G. Intraclass Reliability Estimates: Testing Structural Assumptions. Educ. Psychol. Meas. 1974, 34, 25–33. [Google Scholar] [CrossRef]
- Dijkstra, T.K.; Henseler, J. Consistent partial least squares path modeling. MIS Q. 2015, 39, 297–316. [Google Scholar] [CrossRef]
- Hair, J.F.; Risher, J.J.; Sarstedt, M.; Ringle, C.M. When to use and how to report the results of PLS-SEM. Eur. Bus. Rev. 2019, 31, 2–24. [Google Scholar] [CrossRef]
- Russo, D.; Stol, K.-J. PLS-SEM for Software Engineering Research: An Introduction and Survey. ACM Comput. Surv. 2022, 54, 1–38. [Google Scholar] [CrossRef]
- Fornell, C.; Larcker, D.F. Evaluating Structural Equation Models with Unobservable Variables and Measurement Error. J. Mark. Res. 1981, 18, 39–50. [Google Scholar] [CrossRef]
- Henseler, J.; Ringle, C.M.; Sarstedt, M. A new criterion for assessing discriminant validity in variance-based structural equation modeling. J. Acad. Mark. Sci. 2015, 43, 115–135. [Google Scholar] [CrossRef] [Green Version]
- Götz, O.; Liehr-Gobbers, K.; Krafft, M. Evaluation of structural equation models using the Partial Least Squares (PLS) approach. In Handbook of Partial Least Squares; Esposito Vinzi, V., Chin, W.W., Henseler, J., Wang, H., Eds.; Springer: Berlin/Heidelberg, Germany, 2010; pp. 691–711. [Google Scholar] [CrossRef]
- Orehovački, T. Methodology for Evaluating the Quality in Use of Web 2.0 Applications. Ph.D. Thesis, University of Zagreb, Faculty of Organization and Informatics, Varaždin, Croatia, 2013. [Google Scholar]
- Cohen, J. Statistical Power Analysis for the Behavioral Sciences; Lawrence Erlbaum Associates: Hillsdale, MI, USA, 1988. [Google Scholar]
- Stone, M. Cross-validatory choice and assessment of statistical predictions. J. R. Stat. Soc. B 1974, 36, 111–147. [Google Scholar] [CrossRef]
- Geisser, S. The predictive sample reuse method with applications. J. Am. Stat. Assoc. 1975, 70, 320–328. [Google Scholar] [CrossRef]
- Shmueli, G.; Ray, S.; Estrada, J.M.V.; Chatla, S.B. The elephant in the room: Predictive performance of PLS models. J. Bus. Res. 2016, 69, 4552–4564. [Google Scholar] [CrossRef]
- Shmueli, G.; Sarstedt, M.; Hair, J.F.; Cheah, J.-H.; Ting, H.; Vaithilingam, S.; Ringle, C.M. Predictive model assessment in PLS-SEM: Guidelines for using PLSpredict. Eur. J. Mark. 2019, 53, 2322–2347. [Google Scholar] [CrossRef]
- Sun, B.; Sun, C.; Liu, C.; Gui, C. Research on Initial Trust Model of Mobile Banking Users. J. Risk Anal. Crisis Response 2017, 7, 13–20. [Google Scholar] [CrossRef] [Green Version]
- Wulfert, T. Mobile App Service Quality Dimensions and Requirements for Mobile Shopping Companion Apps. Jr. Manag. Sci. 2019, 4, 339–391. [Google Scholar] [CrossRef]
- Angelova, B.; Zekiri, J. Measuring Customer Satisfaction with Service Quality Using American Customer Satisfaction Model (ACSI Model). Int. J. Acad. Res. Bus. Soc. Sci. 2011, 1, 232–258. [Google Scholar] [CrossRef]
- Luarn, P.; Lin, H.H. Toward an understanding of the behavioral intention to use mobile banking. Comput. Hum. Behav. 2005, 21, 873–891. [Google Scholar] [CrossRef]
Figure 1.
Research model with corresponding hypotheses.

Figure 2.
Login screens of evaluated mobile banking applications (from left to right: PBZ Mobile banking, Erste George, m-zaba, OTP m-banking).
Figure 2.
Login screens of evaluated mobile banking applications (from left to right: PBZ Mobile banking, Erste George, m-zaba, OTP m-banking).

Figure 3.
Comparison of item means per mobile banking applications.

Figure 4.
Comparison of item means per age groups of users.


Table 1.
Standardized factor loadings and cross-loadings of items.
| BEH | EASE | EFF | FEDQ | RES | SAT | SEC | USE | |
|---|---|---|---|---|---|---|---|---|
| BEH1 | 0.810 | 0.215 | 0.328 | 0.301 | 0.315 | 0.498 | 0.342 | 0.355 |
| BEH2 | 0.883 | 0.368 | 0.455 | 0.444 | 0.387 | 0.589 | 0.398 | 0.374 |
| BEH3 | 0.893 | 0.261 | 0.496 | 0.275 | 0.337 | 0.522 | 0.268 | 0.419 |
| BEH4 | 0.708 | 0.367 | 0.526 | 0.294 | 0.311 | 0.476 | 0.230 | 0.514 |
| EASE2 | 0.363 | 0.726 | 0.616 | 0.338 | 0.456 | 0.406 | 0.230 | 0.430 |
| EASE3 | 0.302 | 0.836 | 0.545 | 0.386 | 0.530 | 0.561 | 0.341 | 0.627 |
| EASE4 | 0.268 | 0.778 | 0.429 | 0.451 | 0.454 | 0.535 | 0.418 | 0.455 |
| EASE5 | 0.197 | 0.734 | 0.408 | 0.376 | 0.379 | 0.485 | 0.154 | 0.342 |
| EFF1 | 0.476 | 0.485 | 0.863 | 0.468 | 0.352 | 0.473 | 0.258 | 0.494 |
| EFF3 | 0.332 | 0.570 | 0.775 | 0.424 | 0.381 | 0.457 | 0.176 | 0.505 |
| EFF5 | 0.560 | 0.578 | 0.891 | 0.461 | 0.426 | 0.571 | 0.357 | 0.564 |
| FEDQ1 | 0.371 | 0.446 | 0.496 | 0.835 | 0.352 | 0.489 | 0.376 | 0.377 |
| FEDQ2 | 0.318 | 0.475 | 0.476 | 0.869 | 0.395 | 0.485 | 0.522 | 0.349 |
| FEDQ3 | 0.336 | 0.388 | 0.405 | 0.836 | 0.411 | 0.526 | 0.386 | 0.357 |
| FEDQ4 | 0.303 | 0.329 | 0.367 | 0.752 | 0.462 | 0.504 | 0.375 | 0.514 |
| RES1 | 0.198 | 0.412 | 0.331 | 0.372 | 0.710 | 0.473 | 0.366 | 0.537 |
| RES2 | 0.445 | 0.556 | 0.458 | 0.459 | 0.907 | 0.666 | 0.332 | 0.527 |
| RES3 | 0.328 | 0.475 | 0.318 | 0.341 | 0.812 | 0.510 | 0.191 | 0.406 |
| SAT1 | 0.493 | 0.594 | 0.514 | 0.503 | 0.667 | 0.858 | 0.345 | 0.622 |
| SAT2 | 0.532 | 0.662 | 0.639 | 0.517 | 0.680 | 0.906 | 0.389 | 0.664 |
| SAT3 | 0.481 | 0.439 | 0.419 | 0.502 | 0.482 | 0.793 | 0.464 | 0.496 |
| SAT4 | 0.628 | 0.494 | 0.436 | 0.520 | 0.480 | 0.824 | 0.456 | 0.611 |
| SEC1 | 0.323 | 0.257 | 0.171 | 0.480 | 0.233 | 0.355 | 0.926 | 0.193 |
| SEC2 | 0.354 | 0.346 | 0.344 | 0.490 | 0.406 | 0.465 | 0.923 | 0.322 |
| SEC4 | 0.370 | 0.429 | 0.334 | 0.448 | 0.347 | 0.510 | 0.937 | 0.373 |
| USE1 | 0.318 | 0.453 | 0.305 | 0.407 | 0.430 | 0.425 | 0.283 | 0.710 |
| USE2 | 0.471 | 0.574 | 0.616 | 0.386 | 0.514 | 0.655 | 0.297 | 0.831 |
| USE4 | 0.293 | 0.362 | 0.374 | 0.281 | 0.440 | 0.438 | 0.183 | 0.728 |
| USE5 | 0.419 | 0.484 | 0.545 | 0.388 | 0.469 | 0.622 | 0.253 | 0.818 |
Note that bold values on the diagonal represent standardized factor loadings.
Table 2.
Convergent validity and internal consistency of constructs.
| Constructs | Cronbach’s Alpha | rho_A | rho_C | AVE |
|---|---|---|---|---|
| Behavioral Intention (BEH) | 0.842 | 0.852 | 0.896 | 0.684 |
| Ease of Use (EASE) | 0.771 | 0.785 | 0.853 | 0.592 |
| Efficiency (EFF) | 0.796 | 0.802 | 0.881 | 0.712 |
| Feedback Quality (FEDQ) | 0.843 | 0.858 | 0.894 | 0.679 |
| Responsiveness (RES) | 0.740 | 0.773 | 0.854 | 0.662 |
| Satisfaction (SAT) | 0.867 | 0.873 | 0.910 | 0.716 |
| Security of Personal Data (SEC) | 0.921 | 0.944 | 0.949 | 0.862 |
| Usefulness (USE) | 0.778 | 0.807 | 0.856 | 0.598 |
Table 3.
Fornell–Larcker criterion.
| BEH | EASE | EFF | FEDQ | RES | SAT | SEC | USE | |
|---|---|---|---|---|---|---|---|---|
| BEH | 0.827 | |||||||
| EASE | 0.367 | 0.770 | ||||||
| EFF | 0.545 | 0.647 | 0.844 | |||||
| FEDQ | 0.403 | 0.504 | 0.534 | 0.824 | ||||
| RES | 0.410 | 0.596 | 0.460 | 0.483 | 0.814 | |||
| SAT | 0.634 | 0.650 | 0.596 | 0.603 | 0.684 | 0.846 | ||
| SEC | 0.379 | 0.381 | 0.317 | 0.508 | 0.363 | 0.487 | 0.928 | |
| USE | 0.498 | 0.616 | 0.619 | 0.473 | 0.600 | 0.711 | 0.331 | 0.773 |
Note that bold values on the diagonal represent the square root of AVE of each construct.
Table 4.
Heterotrait–Monotrait ratio of correlations (HTMT).
| BEH | EASE | EFF | FEDQ | RES | SAT | SEC | USE | |
|---|---|---|---|---|---|---|---|---|
| BEH | ||||||||
| EASE | 0.455 | |||||||
| EFF | 0.664 | 0.826 | ||||||
| FEDQ | 0.474 | 0.617 | 0.647 | |||||
| RES | 0.505 | 0.777 | 0.590 | 0.619 | ||||
| SAT | 0.737 | 0.786 | 0.711 | 0.711 | 0.844 | |||
| SEC | 0.423 | 0.428 | 0.352 | 0.573 | 0.431 | 0.536 | ||
| USE | 0.606 | 0.762 | 0.753 | 0.597 | 0.793 | 0.836 | 0.374 |
Table 5.
Results of testing collinearity among exogenous constructs in the structural model.
| BEH | EASE | EFF | FEDQ | RES | SAT | SEC | USE | |
|---|---|---|---|---|---|---|---|---|
| BEH | ||||||||
| EASE | 1.708 | 1.721 | ||||||
| EFF | 1.721 | |||||||
| FEDQ | 1.305 | |||||||
| RES | 1.305 | 1.000 | ||||||
| SAT | 1.000 | |||||||
| SEC | 1.191 | |||||||
| USE | 1.638 |
Note that endogenous constructs are in the columns while exogenous constructs are in the rows.
Table 6.
Results of testing the explanatory power of the research model.
| Endogenous Constructs | ||
|---|---|---|
| Behavioral Intention (BEH) | 0.401 | 0.395 |
| Ease of Use (EASE) | 0.416 | 0.403 |
| Efficiency (EFF) | 0.212 | 0.203 |
| Customer Satisfaction (SAT) | 0.621 | 0.609 |
| Usefulness (USE) | 0.463 | 0.452 |
Table 7.
Results of hypotheses testing.
| Hypotheses | Path Coefficients | T Statistics | p-Value | Supported? |
|---|---|---|---|---|
| H1. RES -> EFF | 0.460 | 6.530 | 0.000 | Yes |
| H2. RES -> EASE | 0.459 | 6.080 | 0.000 | Yes |
| H3. EFF -> USE | 0.380 | 4.299 | 0.000 | Yes |
| H4. FEDQ -> EASE | 0.282 | 3.735 | 0.000 | Yes |
| H5. EASE -> USE | 0.369 | 3.585 | 0.000 | Yes |
| H6. EASE -> SAT | 0.277 | 2.389 | 0.017 | Yes |
| H7. USE -> SAT | 0.465 | 4.766 | 0.000 | Yes |
| H8. SEC -> SAT | 0.228 | 2.337 | 0.019 | Yes |
| H9. SAT -> BEH | 0.634 | 10.666 | 0.000 | Yes |
Table 8.
Results of testing the effect size.
| BEH | EASE | EFF | FEDQ | RES | SAT | SEC | USE | |
|---|---|---|---|---|---|---|---|---|
| BEH | ||||||||
| EASE | 0.119 | 0.148 | ||||||
| EFF | 0.157 | |||||||
| FEDQ | 0.104 | |||||||
| RES | 0.277 | 0.268 | ||||||
| SAT | 0.671 | |||||||
| SEC | 0.115 | |||||||
| USE | 0.348 |
Note that endogenous constructs are in the columns while exogenous constructs are in the rows.
Table 9.
Results of testing the predictive power of the research model.
| Items | PLS-SEM_RMSE | PLS-SEM_MAE | LM_RMSE | LM_MAE | |
|---|---|---|---|---|---|
| BEH1 | 0.108 | 0.436 | 0.241 | 0.482 | 0.299 |
| BEH2 | 0.183 | 0.552 | 0.387 | 0.580 | 0.403 |
| BEH3 | 0.108 | 0.586 | 0.384 | 0.664 | 0.415 |
| BEH4 | 0.093 | 0.633 | 0.432 | 0.666 | 0.433 |
| EASE2 | 0.199 | 0.630 | 0.453 | 0.646 | 0.462 |
| EASE3 | 0.274 | 0.487 | 0.339 | 0.480 | 0.340 |
| EASE4 | 0.247 | 0.515 | 0.414 | 0.570 | 0.431 |
| EASE5 | 0.150 | 0.405 | 0.245 | 0.437 | 0.281 |
| EFF1 | 0.094 | 0.380 | 0.241 | 0.384 | 0.253 |
| EFF3 | 0.130 | 0.660 | 0.532 | 0.669 | 0.504 |
| EFF5 | 0.161 | 0.406 | 0.292 | 0.384 | 0.270 |
| SAT1 | 0.357 | 0.454 | 0.368 | 0.444 | 0.309 |
| SAT2 | 0.388 | 0.422 | 0.335 | 0.395 | 0.282 |
| SAT3 | 0.299 | 0.577 | 0.491 | 0.626 | 0.490 |
| SAT4 | 0.298 | 0.535 | 0.423 | 0.552 | 0.403 |
| USE1 | 0.178 | 0.603 | 0.503 | 0.641 | 0.470 |
| USE2 | 0.229 | 0.459 | 0.366 | 0.471 | 0.348 |
| USE4 | 0.168 | 0.620 | 0.502 | 0.632 | 0.469 |
| USE5 | 0.212 | 0.457 | 0.378 | 0.458 | 0.354 |
Note that bold values in the rows indicate that endogenous construct items have higher prediction errors in terms of RMSE or MAE when compared to the naïve LM benchmark.
Table 10.
Results of testing the predictive relevance of exogenous constructs.
| BEH | EASE | EFF | FEDQ | RES | SAT | SEC | USE | |
|---|---|---|---|---|---|---|---|---|
| BEH | ||||||||
| EASE | 0.242 | 0.119 | ||||||
| EFF | 0.005 | |||||||
| FEDQ | 0.075 | |||||||
| RES | 0.252 | 0.224 | ||||||
| SAT | 0.227 | |||||||
| SEC | 0.062 | |||||||
| USE | 0.013 |
Note that endogenous constructs are in the columns while exogenous constructs are in the rows.
Disclaimer/Publisher’s Note: The statements, opinions and data contained in all publications are solely those of the individual author(s) and contributor(s) and not of MDPI and/or the editor(s). MDPI and/or the editor(s) disclaim responsibility for any injury to people or property resulting from any ideas, methods, instructions or products referred to in the content. |
© 2022 by the authors. Licensee MDPI, Basel, Switzerland. This article is an open access article distributed under the terms and conditions of the Creative Commons Attribution (CC BY) license (https://creativecommons.org/licenses/by/4.0/).
Share and Cite
MDPI and ACS Style
Orehovački, T.; Blašković, L.; Kurevija, M. Evaluating the Perceived Quality of Mobile Banking Applications in Croatia: An Empirical Study. Future Internet 2023, 15, 8. https://doi.org/10.3390/fi15010008
AMA Style
Orehovački T, Blašković L, Kurevija M. Evaluating the Perceived Quality of Mobile Banking Applications in Croatia: An Empirical Study. Future Internet. 2023; 15(1):8. https://doi.org/10.3390/fi15010008
Chicago/Turabian StyleOrehovački, Tihomir, Luka Blašković, and Matej Kurevija. 2023. "Evaluating the Perceived Quality of Mobile Banking Applications in Croatia: An Empirical Study" Future Internet 15, no. 1: 8. https://doi.org/10.3390/fi15010008
Note that from the first issue of 2016, this journal uses article numbers instead of page numbers. See further details here.