Article

A New Generation of Collaborative Immersive Analytics on the Web: Open-Source Services to Capture, Process and Inspect Users’ Sessions in 3D Environments

CNR ISPC (National Research Council—Institute of Heritage Science), Area della Ricerca Roma 1, SP35d, 9, 00010 Montelibretti, Italy
*
Author to whom correspondence should be addressed.
Future Internet 2024, 16(5), 147; https://doi.org/10.3390/fi16050147
Submission received: 22 March 2024 / Revised: 19 April 2024 / Accepted: 20 April 2024 / Published: 25 April 2024

Abstract

:
Recording large amounts of users’ sessions performed through 3D applications may provide crucial insights into interaction patterns. Such data can be captured from interactive experiences in public exhibits, remote motion tracking equipment, immersive XR devices, lab installations or online web applications. Immersive analytics (IA) deals with the benefits and challenges of using immersive environments for data analysis and related design solutions to improve the quality and efficiency of the analysis process. Today, web technologies allow us to craft complex applications accessible through common browsers, and APIs like WebXR allow us to interact with and explore virtual 3D environments using immersive devices. These technologies can be used to access rich, immersive spaces but present new challenges related to performance, network bottlenecks and interface design. WebXR IA tools are still quite new in the literature: they present several challenges and leave quite unexplored the possibility of synchronous collaborative inspection. The opportunity to share the virtual space with remote analysts in fact improves sense-making tasks and offers new ways to discuss interaction patterns together, while inspecting captured records or data aggregates. Furthermore, with proper collaborative approaches, analysts are able to share machine learning (ML) pipelines and constructively discuss the outcomes and insights through tailored data visualization, directly inside immersive 3D spaces, using a web browser. Under the H2IOSC project, we present the first results of an open-source pipeline involving tools and services aimed at capturing, processing and inspecting interactive sessions collaboratively in WebXR with other analysts. The modular pipeline can be easily deployed in research infrastructures (RIs), remote dedicated hubs or local scenarios. The developed WebXR immersive analytics tool specifically offers advanced features for volumetric data inspection, query, annotation and discovery, alongside spatial interfaces. We assess the pipeline through users’ sessions captured during two remote public exhibits, by a WebXR application presenting generative AI content to visitors. We deployed the pipeline to assess the different services and to better understand how people interact with generative AI environments. The obtained results can be easily adopted for a multitude of case studies, interactive applications, remote equipment or online applications, to support or accelerate the detection of interaction patterns among remote analysts collaborating in the same 3D space.

1. Introduction

Recording large amounts of users’ sessions performed through 3D applications in public exhibits, research infrastructures (RIs), laboratories or through online web applications may provide crucial insights into interaction patterns and support the discovery of unexpected behaviors. Such valuable data, once captured, can be inspected and analyzed—but, especially within the 3D realm, visual tools are necessary to discover and improve the data understanding, while accelerating the analysis process itself. In order to support such tasks, immersive analytics (IA) systems have become a major topic of investigation and immediately presented specific benefits and challenges. Immersive spaces improve the quality and efficiency of the analysis process, when proper design solutions are provided to interact with volumetric data. The recent literature shows how the additional opportunity to share the virtual environment with other remote analysts improves the sense-making task and further accelerates the detection of interaction patterns.
The H2IOSC project’s (https://www.h2iosc.cnr.it/, accessed on 22 April 2024) goal is to create a federated and inclusive cluster of research infrastructures targeting researchers from various disciplines. The services already offered by the involved RIs are being refactored to improve access, as well as to provide strong alignment with the FAIR principles and with international best practices. Within the E-RIHS RI specifically, different tools and services are offered to researchers to deal with interaction in 3D spaces (virtual or physical), including the scientific visualization and presentation of 3D/4D data targeting the heritage sector. Their deployment in different facilities, and their use in public contexts and among remote researchers, can provide massive and valuable interaction records to be collected, studied, analyzed and investigated among RI nodes. Specialized capture tools can equip interactive applications to collect session records in remote server nodes, offering scientific communities access to dedicated hubs with associated web services for advanced analysis. Capturing such data in remote locations (including worldwide scenarios) and collecting such records over internet connections in dedicated hubs already presents several challenges. Advanced head-mounted displays (HMDs), eye tracking devices, brain–computer interface (BCI) headsets and motion tracking equipment, as well as wearable sensors or devices, may in fact require complex attributes in order to perform in-depth or ad hoc interaction analyses. Within H2IOSC, the pilot, “Immersive Analytics and Spatial Interfaces ”, has the objective of designing and creating open-source immersive analytics (IA) cross-domain services to capture, process and inspect interaction data, using innovative interfaces and novel visualization models for XR inspection. Another goal of the pilot is to explore collaborative, online XR spaces, enabling remote analysts to discuss the captured data records and interaction patterns together.
Web technologies allow us to craft complex and rich applications accessible through common browsers universally, without any installation required. Advancements within Web3D nowadays allow us to interact with and explore complex 3D environments, also through the use of immersive devices (via WebXR). These technologies can be used to access rich, immersive spaces but introduce new challenges related to performance, network bottlenecks and interface design. Web3D IA tools are in fact still quite new in the literature and present several challenges, especially when combining such solutions with fully immersive presentations (WebXR) and synchronous collaborative spaces (collaborative IA).
In this paper, we present the first results of the H2IOSC pilot “Immersive Analytics and Spatial Interfaces”: an open-source web-based pipeline offering open-source tools and services to capture, process and inspect (immersively and collaboratively) recorded interactive sessions. The main contributions of our presented work are as follows.
  • A fully web-based, collaborative, modular, open-source pipeline to capture, process and inspect remote interactive sessions. The pipeline components can be deployed on single or multiple dedicated hubs.
  • A scalable and flexible capture service designed and developed to allow remote nodes to request session recording with custom attributes, also offering an accessible REST API for easy integration in other platforms, pilots or federated scenarios (Section 3.1).
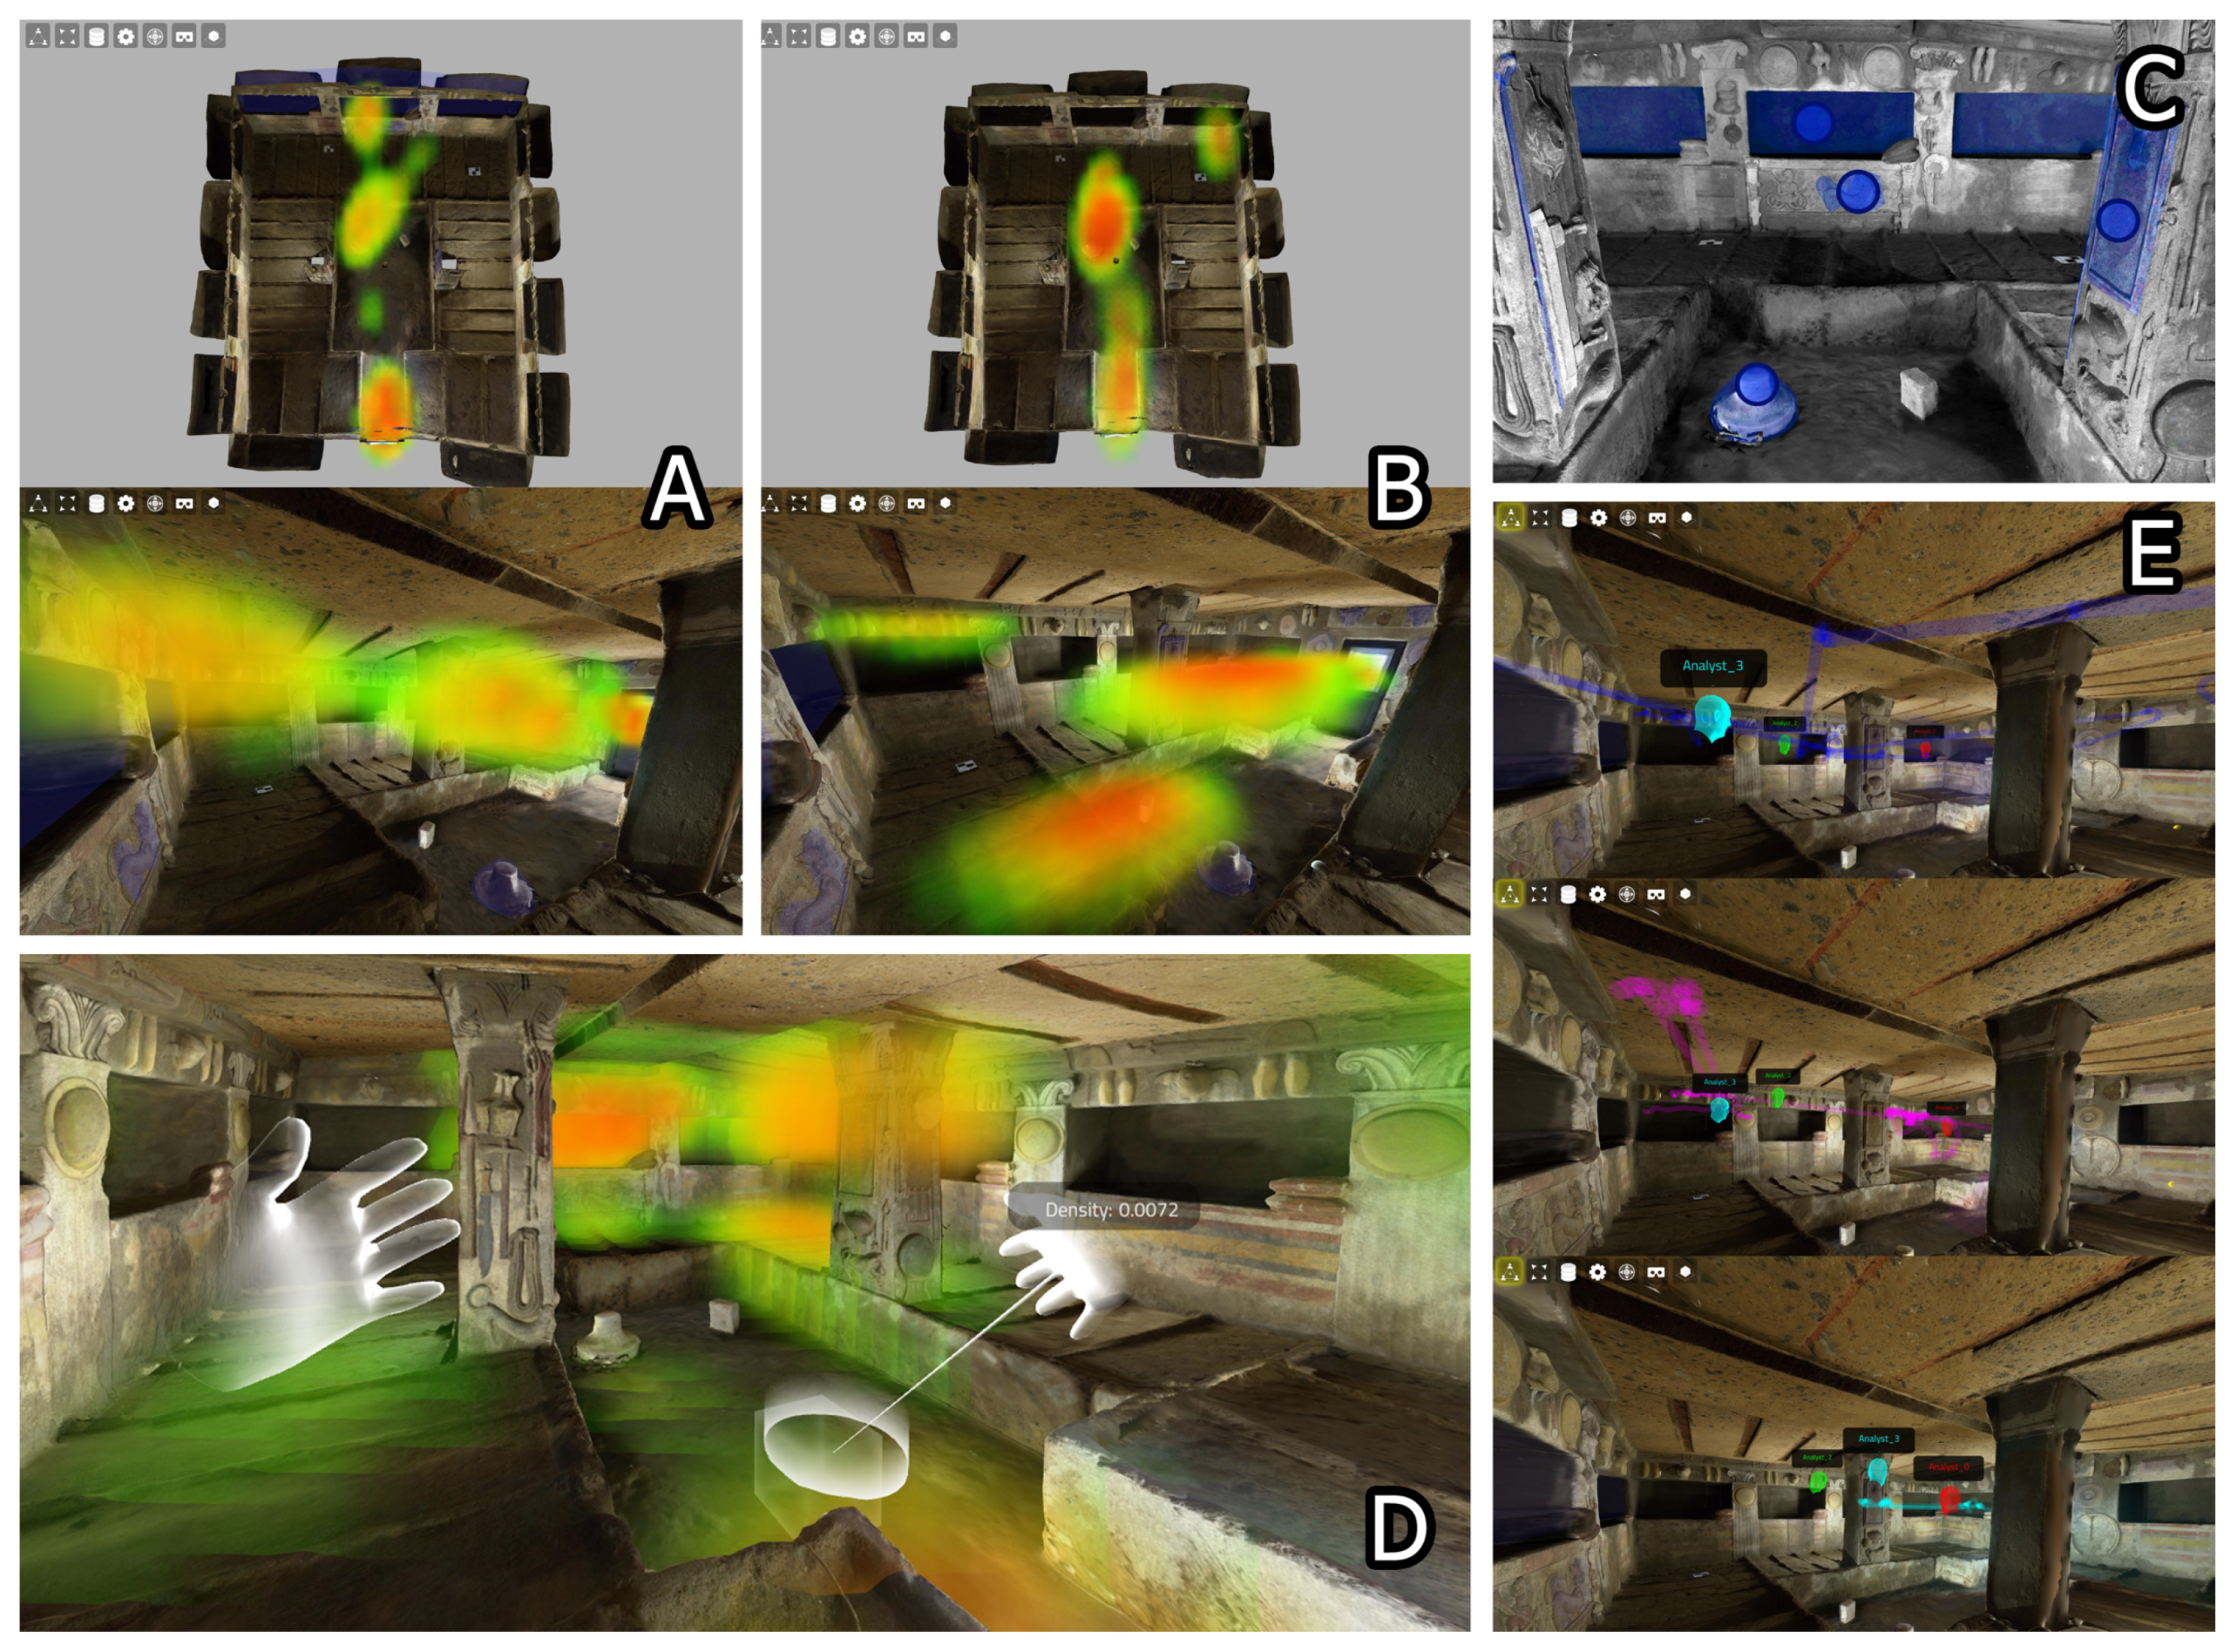
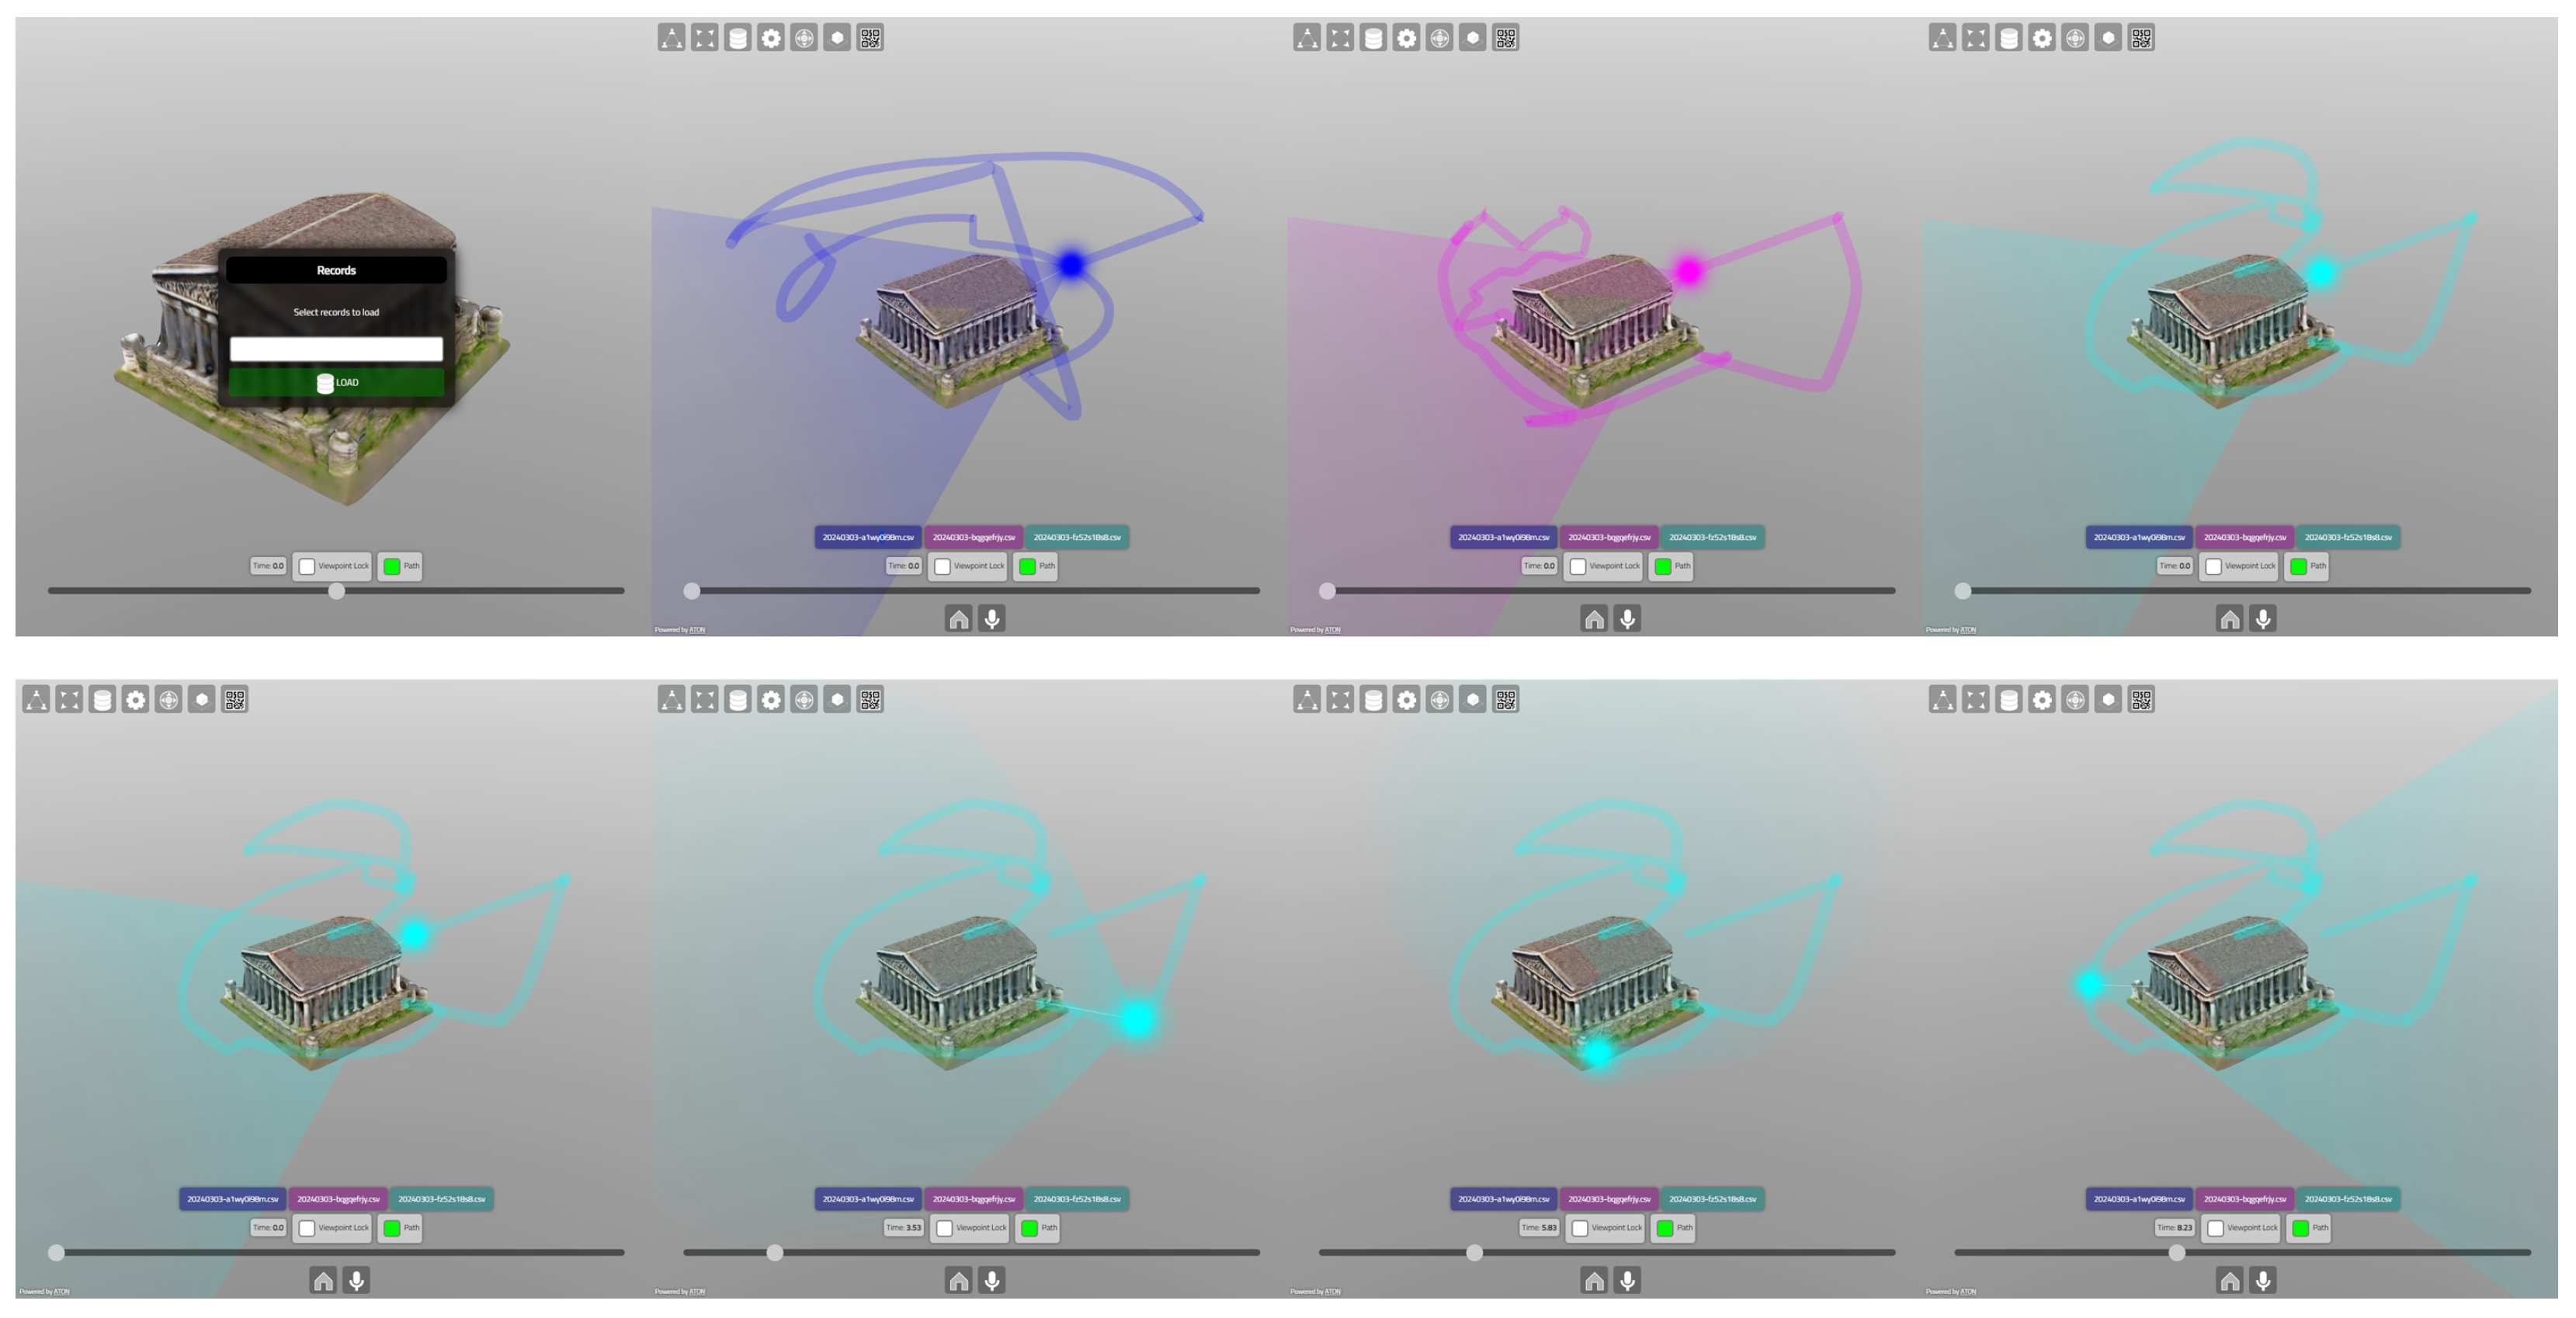
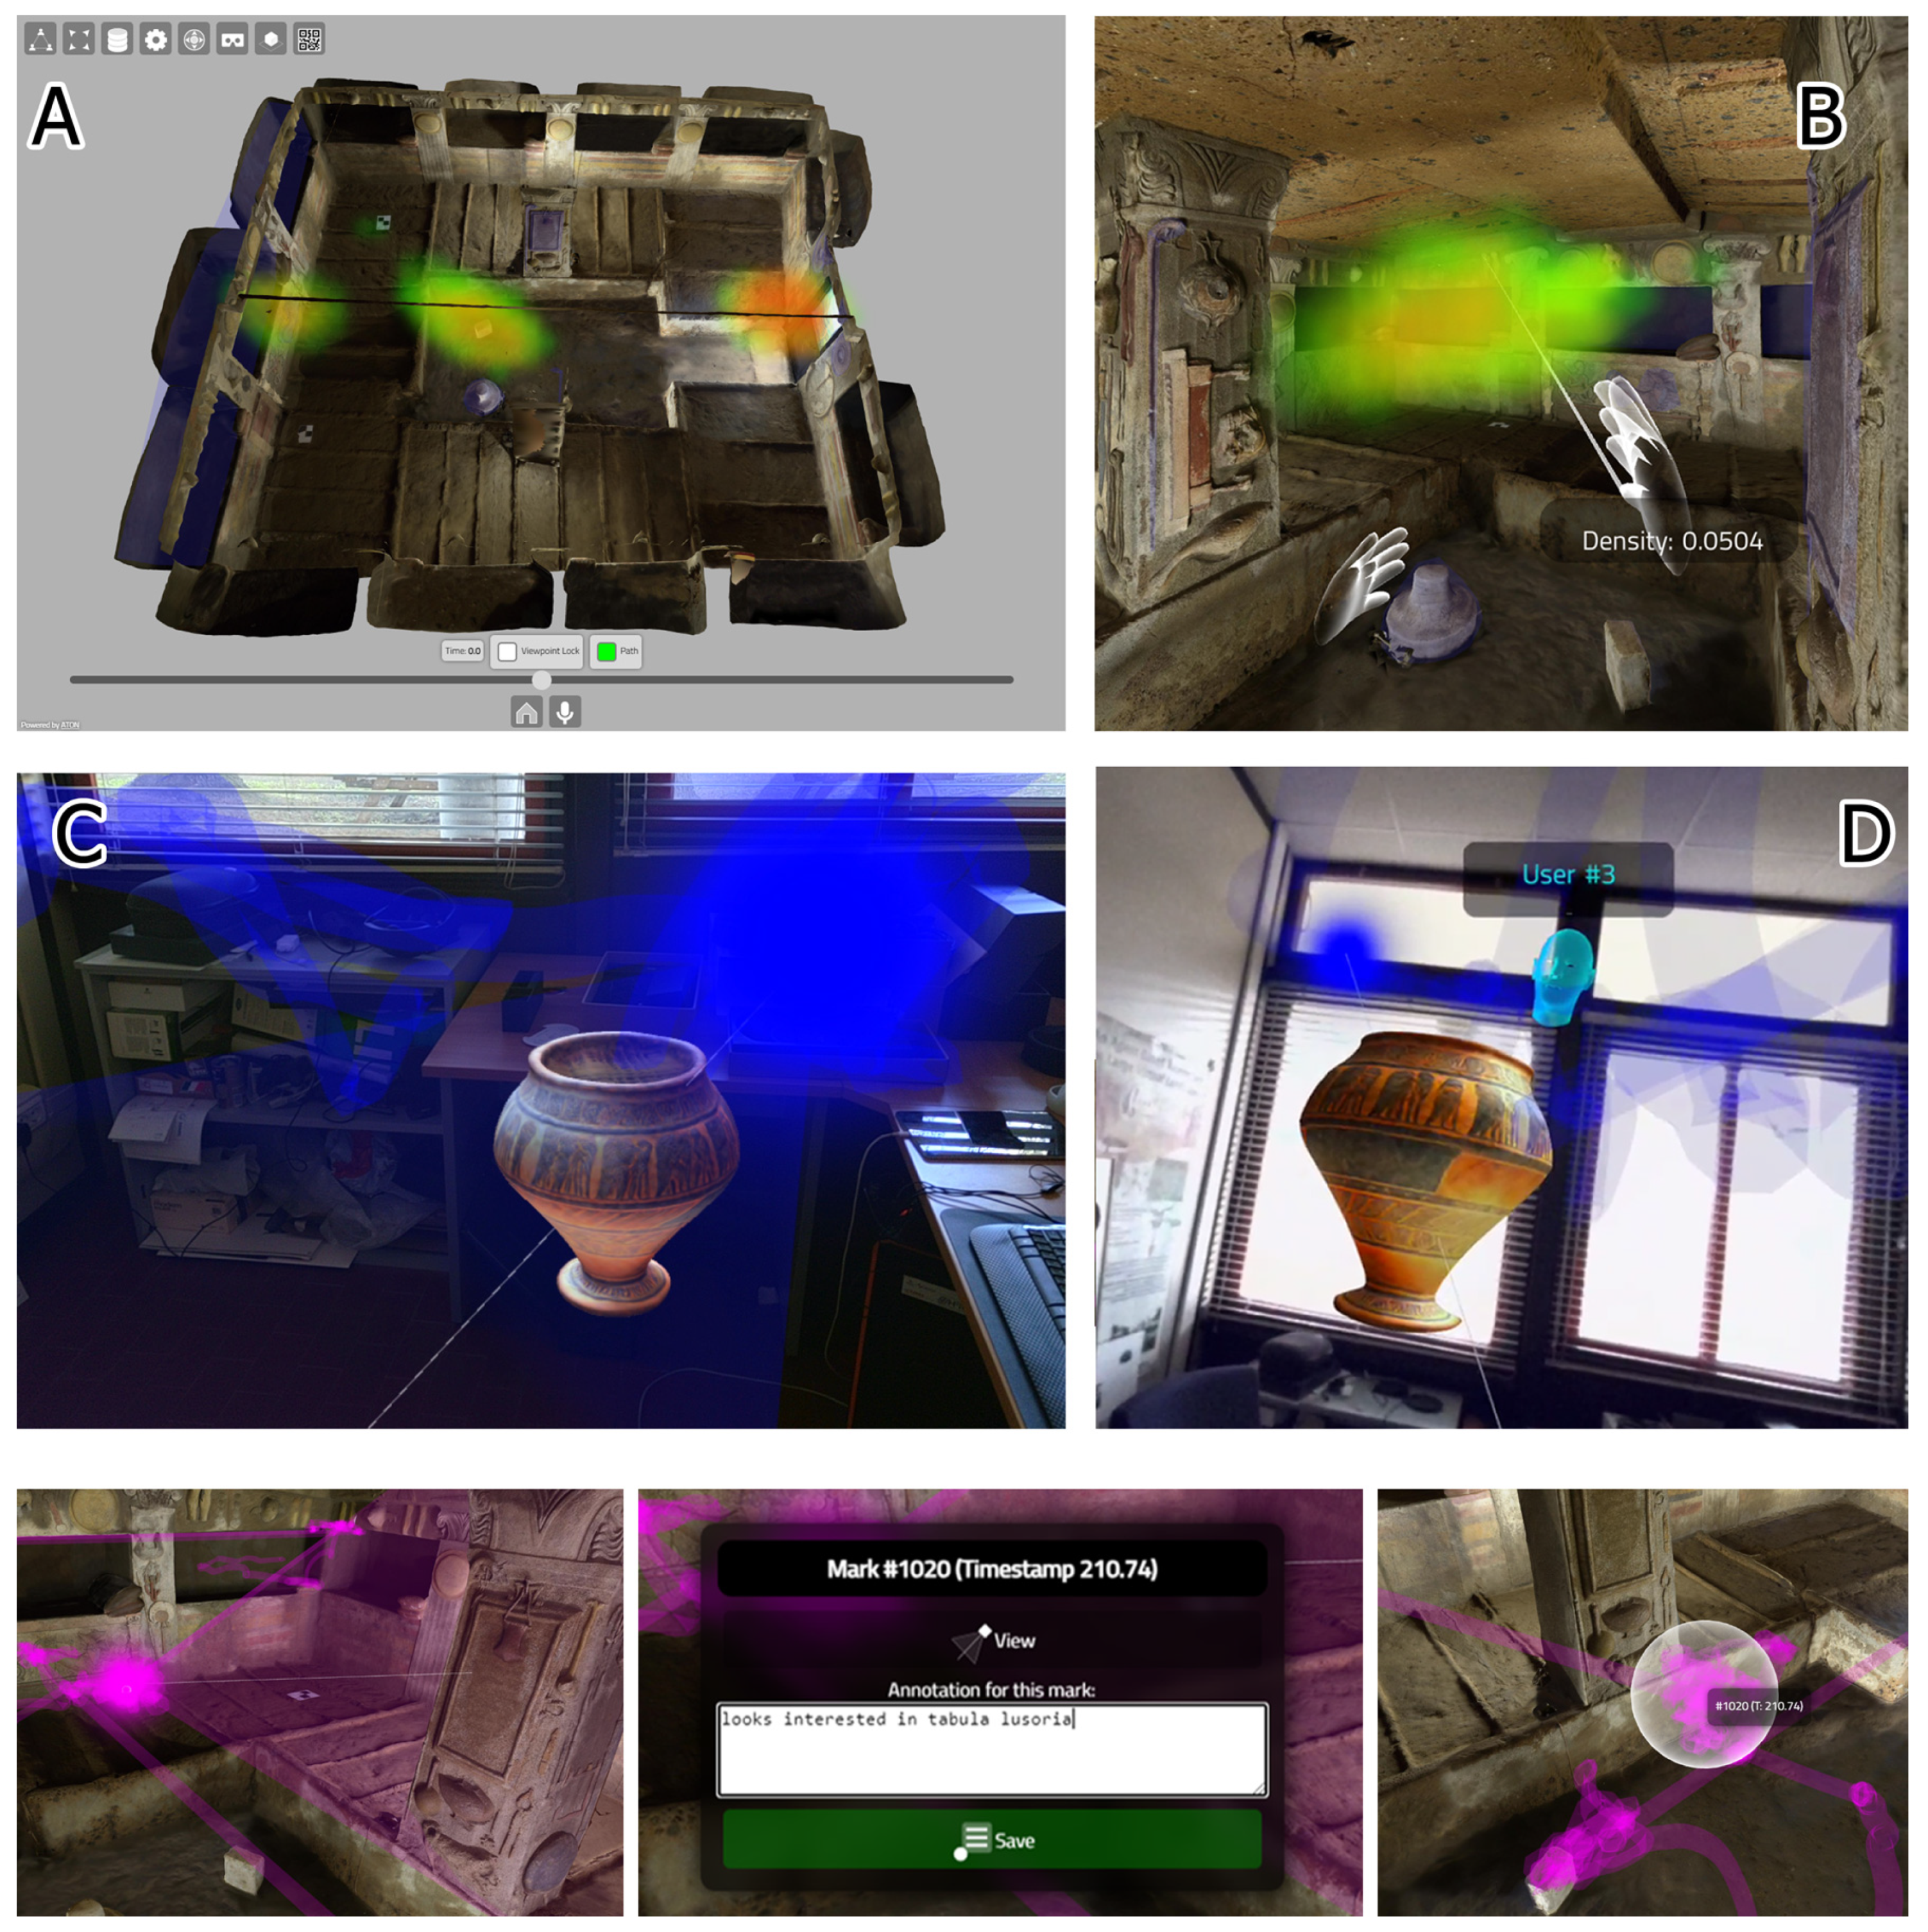
  • An advanced WebXR immersive analytics tool (“Merkhet”) to inspect records and data aggregates collected on remote hubs (Section 3.3), offering (A) spatial interfaces and elements to access, visualize and annotate spatio-temporal data records and aggregates, using immersive VR or augmented/mixed reality devices; (B) synchronous collaboration among multiple online analysts to discuss volumetric data records/aggregates together; (C) cross-device inspection using mobile devices, desktop devices and XR devices, through a standard web browser.
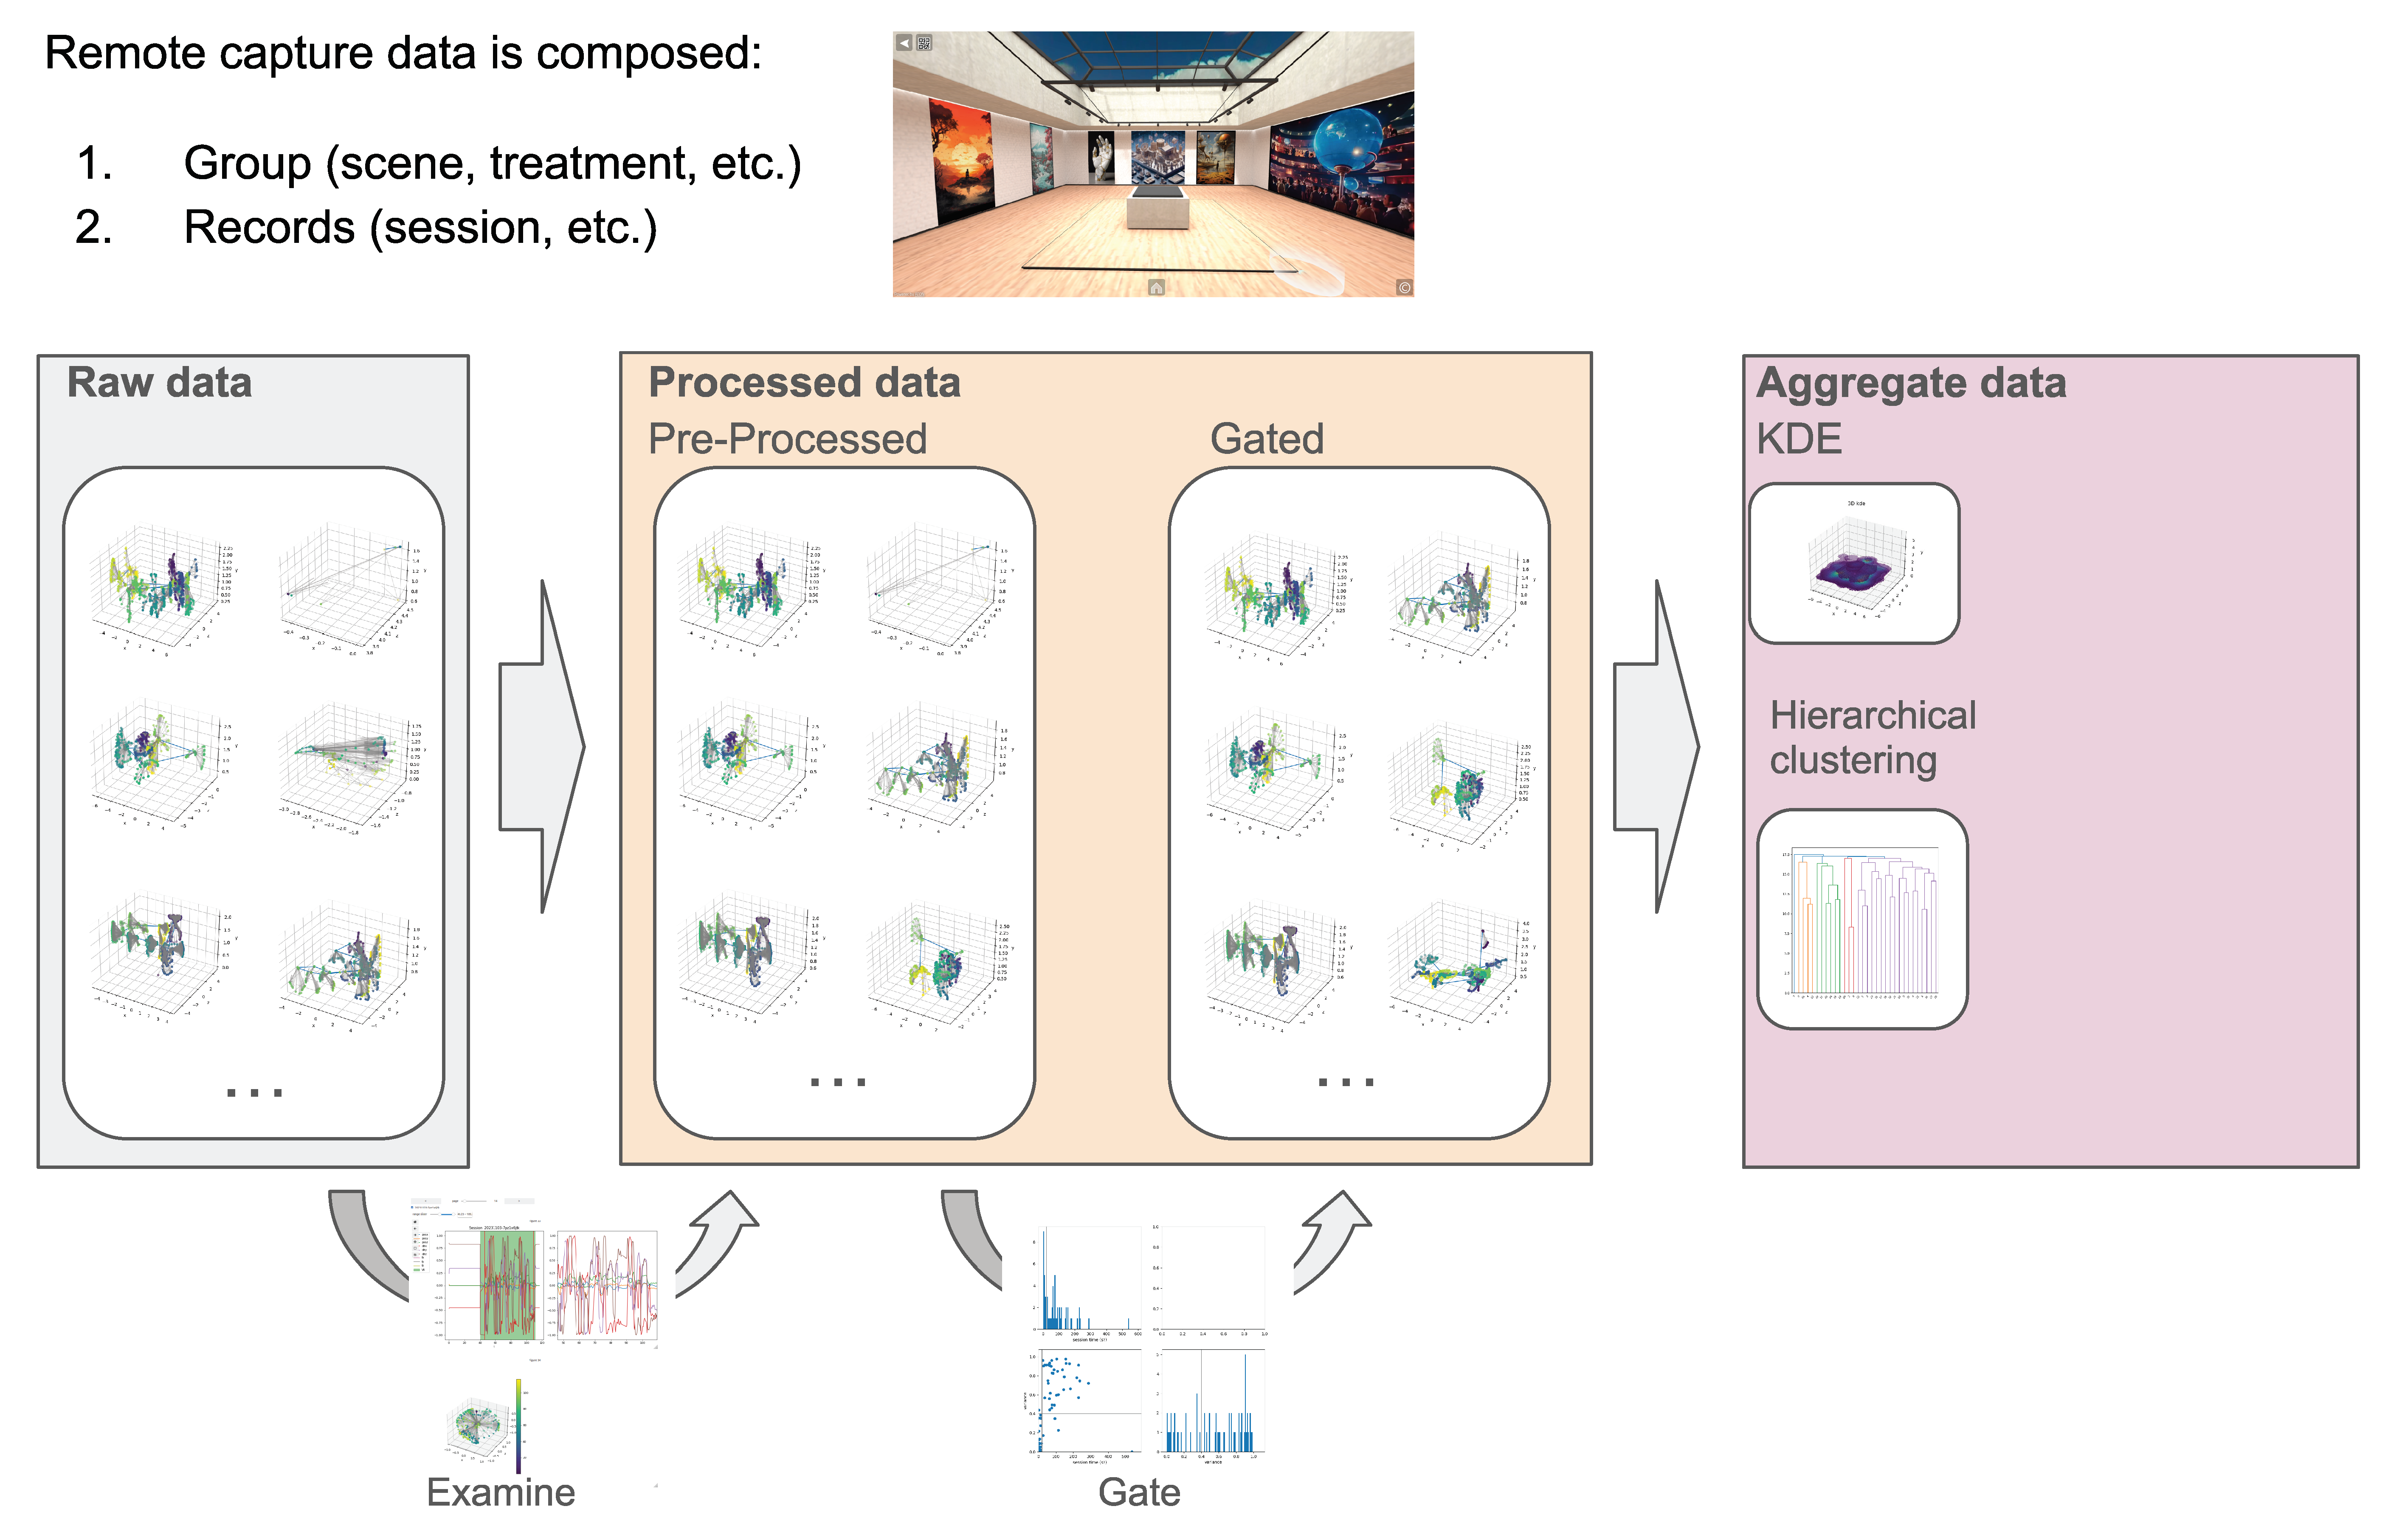
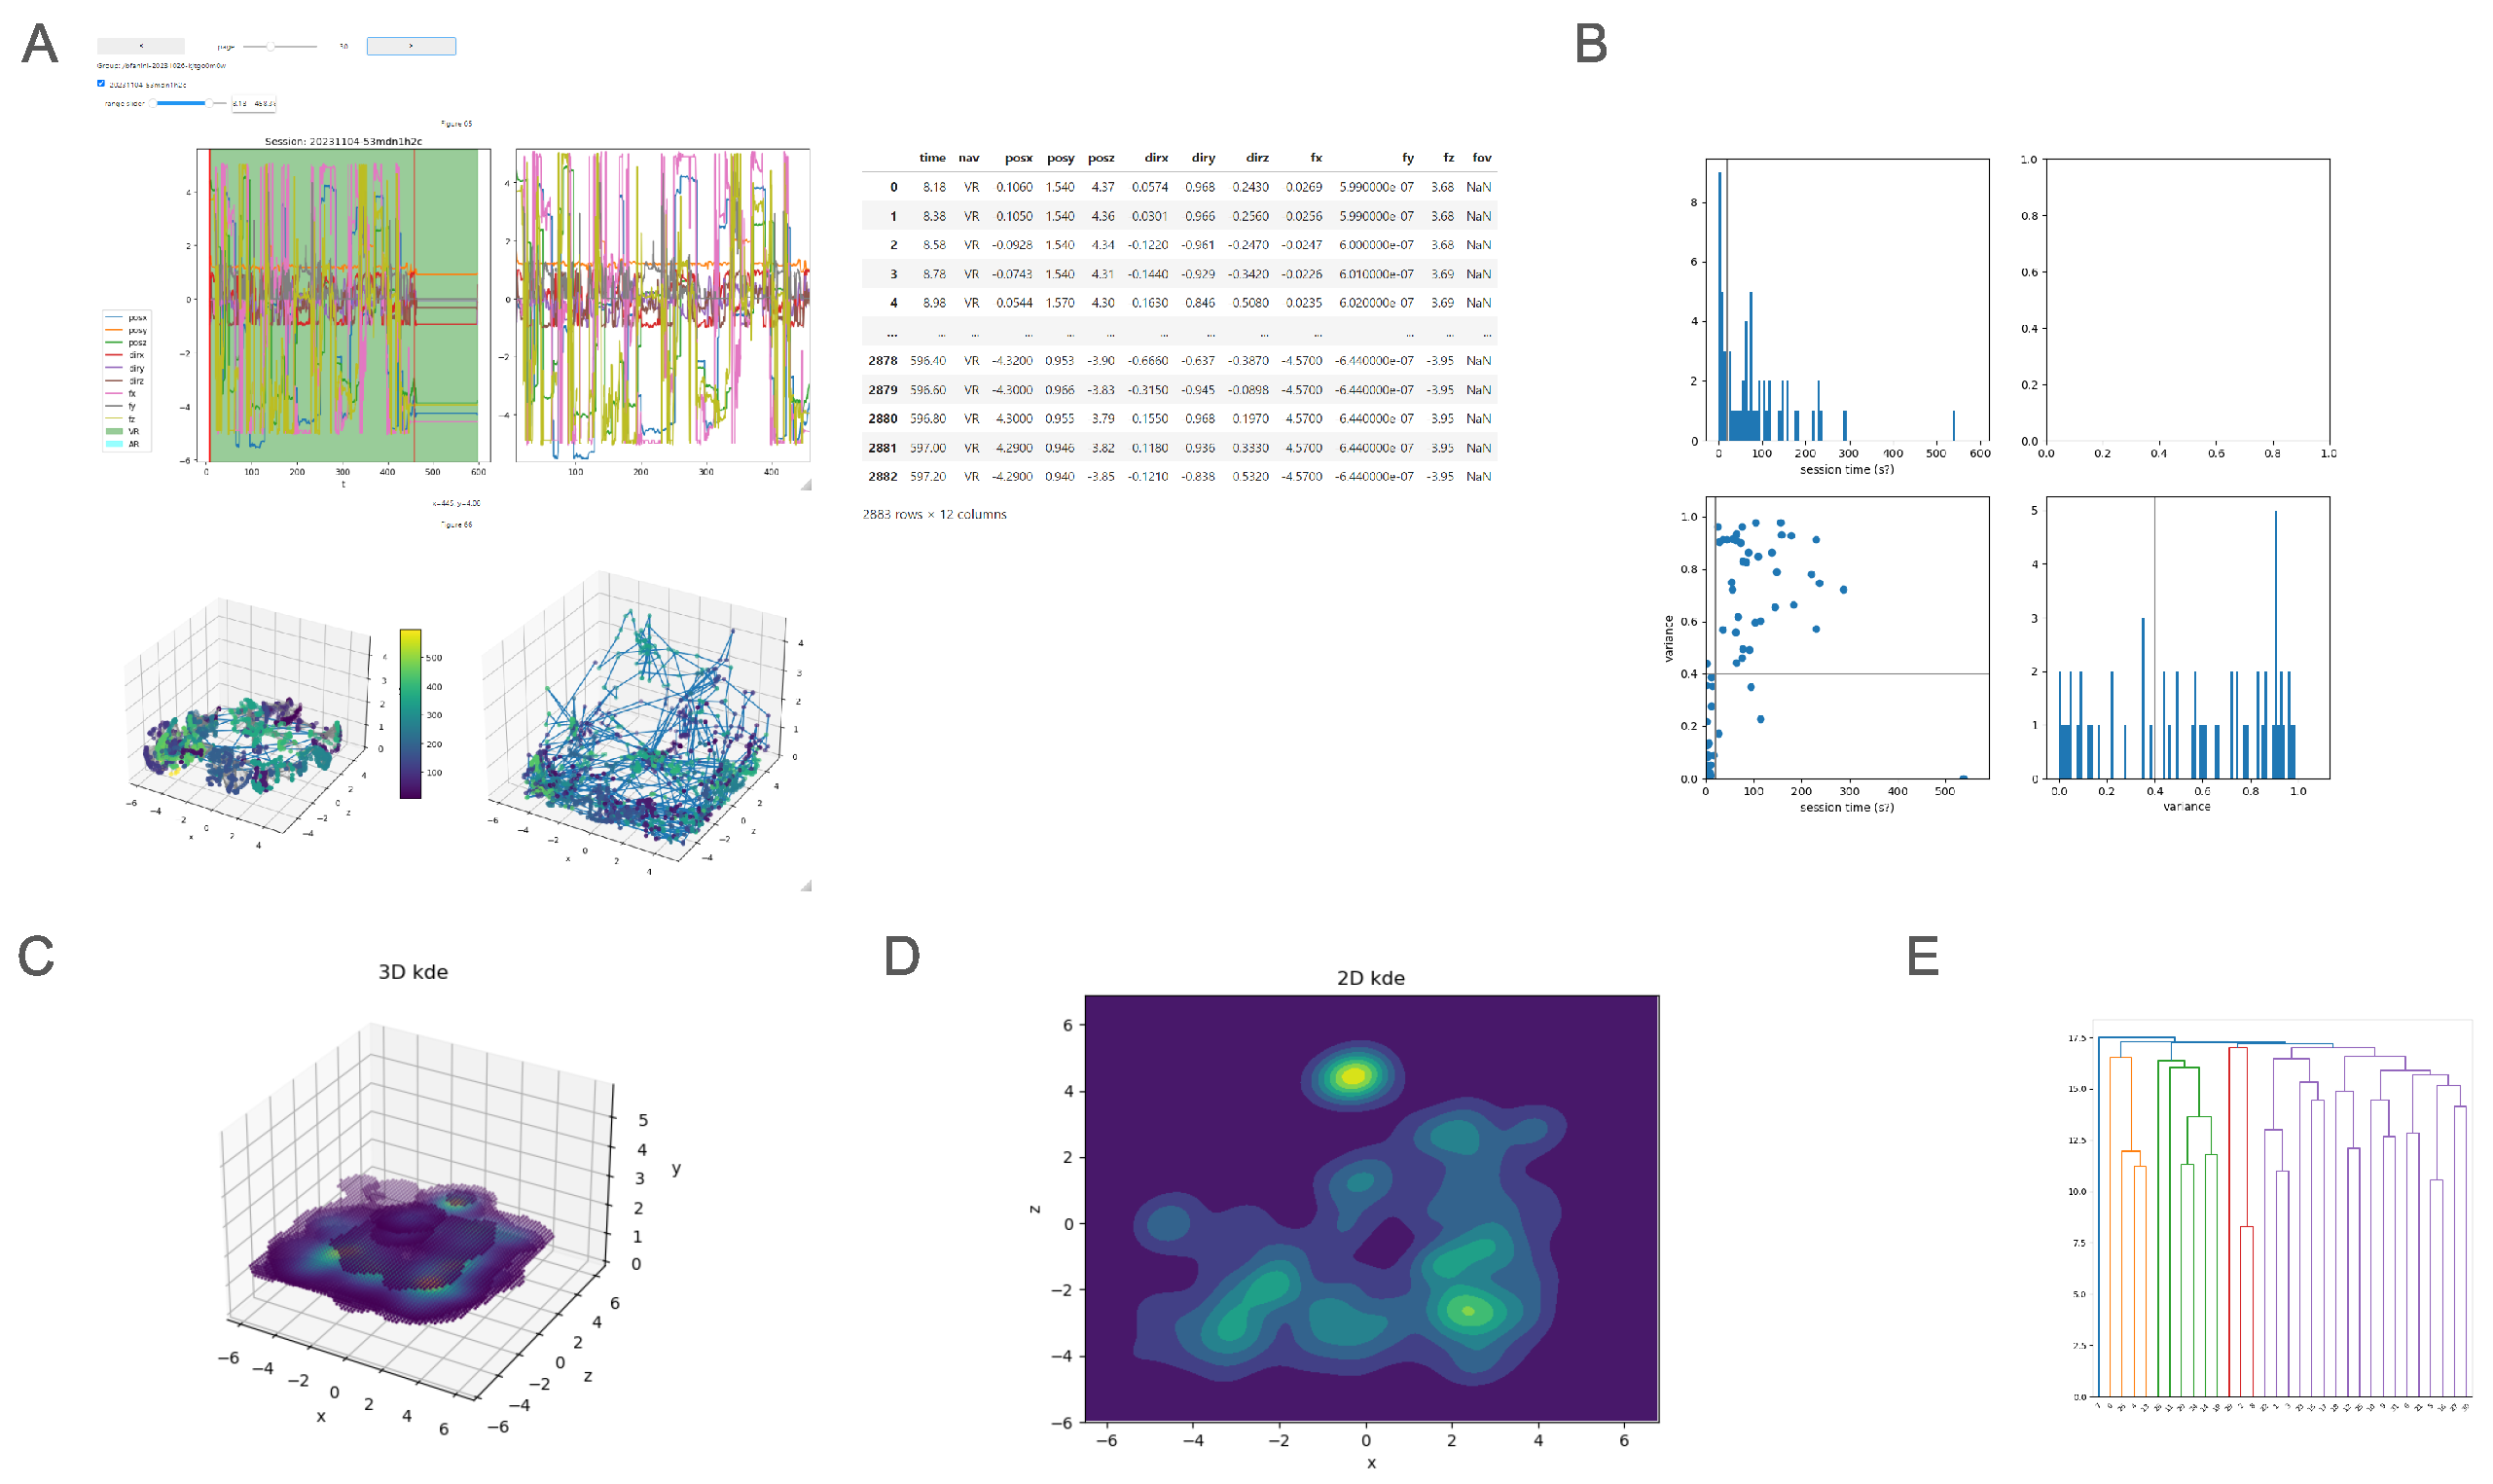
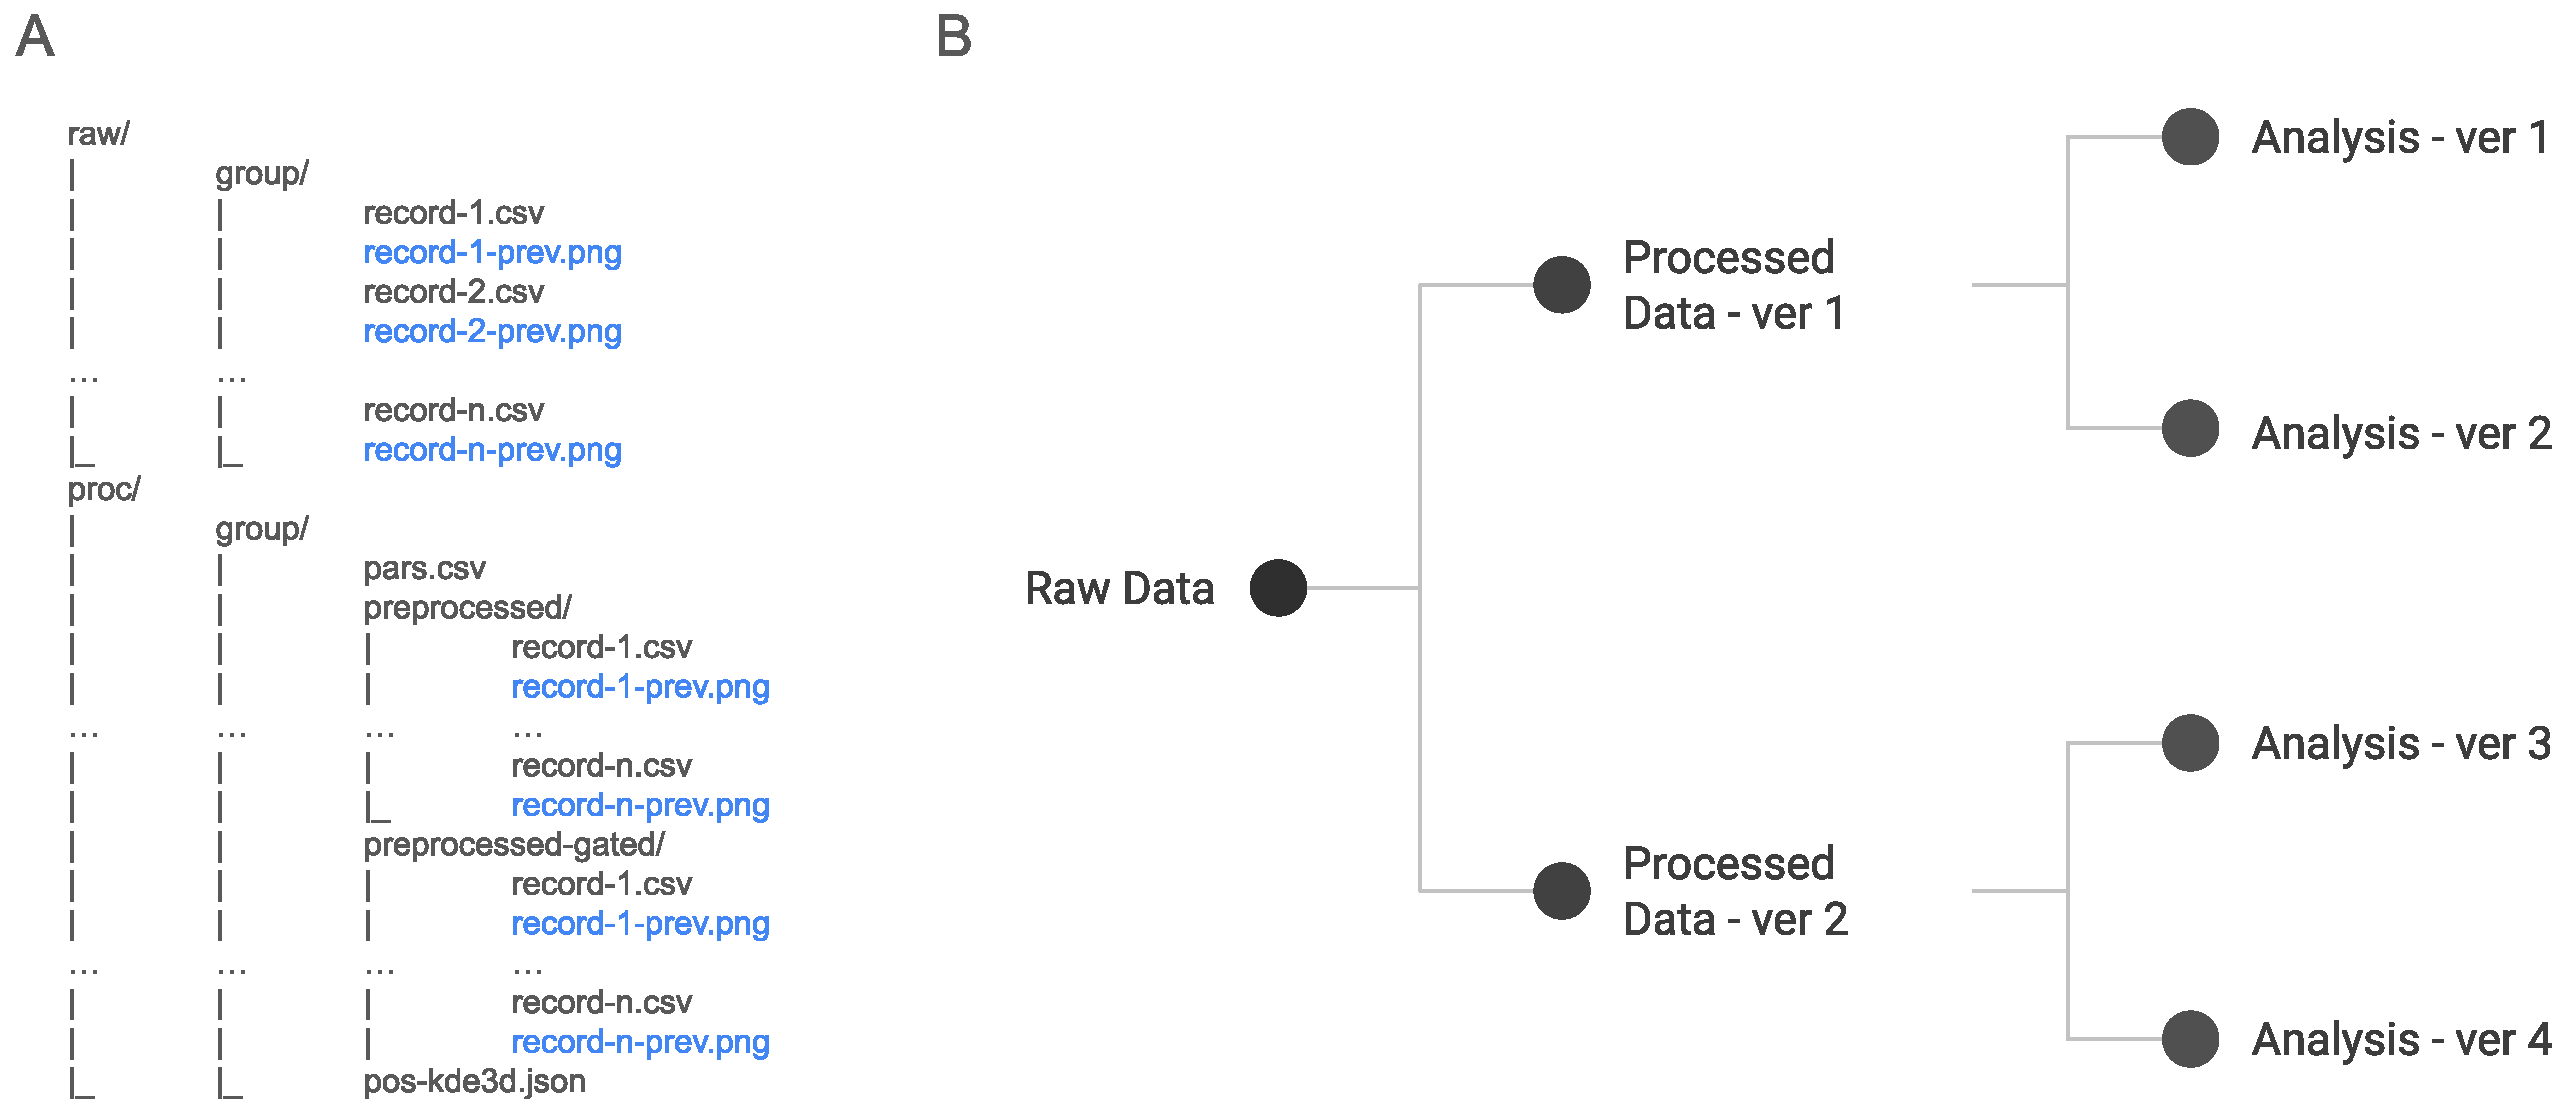
  • A suite of web-based services to develop analytics workflows, which will allow us first to examine and filter incoming raw data (Section 3.2) and then process the data using machine learning models. This stage is also designed to integrate novel encoding models specifically targeting massive data.
Next, Section 2 will introduce the state of the art in the involved topics; in Section 3, our proposed pipeline and its stages will be presented; finally, Section 4 will present the experimental results obtained with an interactive WebXR application (“/imagine”) in two different remote exhibits, presenting generative AI content to visitors.

2. Related Work

Immersive analytics (IA) is a recent field of study focusing on the exploitation of emerging XR technologies to bring visual data analysis into a physical or virtual space [1,2]. The effectiveness of IA for such tasks, and its comparison with traditional systems, has been widely studied in past works, usually leading to the conclusion that immersive approaches are superior [3,4], especially in the sense making of large and multifaceted datasets [5]. However, performing data inspection tasks in such spatial contexts requires new data visualization metaphors and interaction models. Recent surveys on suitable interaction paradigms, current trends and challenges in such a direction [6] highlight the importance of such topics for IA. Regarding the inspection and filtering of large/complex data, there is great interest in the potential of 3D visualization applied to IA, leading to novel approaches for immersive VR to inspect such data through overview and detail navigation models [7]. Indeed, the interaction with such data requires novel spatial interfaces [8], well-established guidelines and published best practices to achieve a robust and effective inspection. New 3D layouts and organizational schemes that are meaningful to the user and beneficial for data analysis must be adopted [9,10,11]. Regarding spatio-temporal data and their manipulation through IA systems, for instance, we require the ad hoc design of 3D timeline models to perform efficient explorations [12].
Regarding collaborative immersive analytics and its comparison with single-user IA, the literature is quite lacking in terms of user studies on the impact of combining both immersion and synchronous collaboration in the data analysis process. Indeed, in comparison with traditional single-user IA systems, collaborative IA faces additional challenges, as highlighted in [13] (challenges C10–C14). Previous works [14] show how collaboration is beneficial for data interaction tasks, especially when it is combined with immersive spaces for data analysis [15]. Research has also focused on collaborative data visualization through co-location, where multiple analysts carry out visual analytics tasks on multivariate datasets, reporting its usefulness in maintaining workspace awareness and sharing the findings between each other within the space [16].
Web technologies and their recent advancements offer a great opportunity to build cross-platform and universal applications or tools, accessible via a standard web browser, with no installation required. Regarding the development and consumption of web-based XR tools, we witnessed huge progress after the introduction of WebXR [17,18,19]. The WebXR API nowadays allows rich functionalities to access XR device capabilities and presentation modes targeting augmented reality (AR), mixed reality (MR) and virtual reality (VR). Web3D indeed introduces additional challenges related to 3D graphics and network performance to create tools that support analytical reasoning and decision-making for IA [20,21], although the building blocks to craft them are being developed [22,23]. Furthermore, in order to address specific challenges in collaborative IA, like C12 ([13], “Supporting Cross-Platform Collaboration”), open-source frameworks like ATON [24] may offer a strong foundation for the rapid crafting of such advanced WebXR tools.
Collaboration among analysts has greatly improved since a series of tools were made available. Versioning control systems such as Git [25] or SVN [26] allow computer scientists to share machine learning (ML) models and databases asynchronously. Jupyter Notebook is a web-based interactive computing platform that allows users to develop and run code [27]. When used together with versioning control systems, Jupyter Notebook greatly facilitates the collaborative development of new machine learning methods and knowledge generation. Cloud-based platforms such as Google Colab [28] effectively enable asynchronous collaboration among analysts, by allowing users to access powerful hardware (e.g., GPUs), develop Jupyter notebooks and share databases. These platforms often implement third-party machine learning libraries; among the most popular, there are Python Scikit-learn [29], TensorFlow [30] or PyTorch [31]. These tools allow users to implement several machine learning models and methods, ranging from non-parametric estimation and forecasting to clustering and regression. Nevertheless, they are unable to support synchronous collaboration in shared environments, because, at each version, the code must be committed to common repositories for other users to upload changes. Furthermore, simultaneous data inspection is not allowed, and the potential benefits of virtual co-localization in shared representations are restricted.
Kernel density estimation (KDE) is a non-parametric method for the probability density function (pdf) estimation of random variables [32,33]. KDE is particularly useful when the random variables are too irregular to be approximated by well-known common probability distributions, such as normal, exponential or Cauchy distributions. From a visual point of view, KDE provides a statistically reasonable and synthetic way to show the data distribution, in which the likeliness of random variable outcomes is represented with a color map in the random variable space.
In machine learning and statistics, hierarchical clustering algorithms are popular clustering methods. In hierarchical clustering, the similarity or dissimilarity among the data entries is used to form a hierarchical structure of clusters [34]. Hierarchical clustering is applied in several different fields [35,36].

3. Proposed Pipeline

This section describes the three different stages of our proposed pipeline targeting web-based immersive analytics: capture (Section 3.1), process (Section 3.2) and inspect (Section 3.3). For each stage, we describe the associated open-source tools and services that we have designed and developed, accessible via standard browsers and leveraging modern web technologies. Regarding the last stage (inspect), we present a developed WebXR IA tool (“Merkhet”) that allows remote analysts to perform collaborative inspection tasks on complex data in virtual 3D spaces, using a web browser.
We derived these three stages from the observation and analysis of the most common formal and informal data mining and machine learning workflows. Among the most studied data mining workflow models, the CRISP-DM methodology is a well-known reference that describes the typical steps of a data mining or machine learning workflow [37]. Even if CRISP-DM does not consider all the possibilities involved in an analytics project, it is an industry-proven methodology [38] that identifies the six steps that most formal methodologies share. The first step is problem definition, in which scientists and analysts define the scientific/business question. Second, data relevant to the question are collected. Third, the data are prepared or modified to remove invalid entries and comply with the analysis input format. Fourth, the prepared data are analyzed with statistics and machine learning tools. Fifth, the data are evaluated. Sixth, the pipeline is deployed. Each stage will be described in the following sections (Section 3.1, Section 3.2 and Section 3.3). In the Data Availability section, we provide links to the corresponding open-source GitHub repositories with detailed deployment instructions.

3.1. Capture

The first goal of the pipeline is to record large amounts of users’ interactions performed using remote applications or equipment (e.g., interactive 3D applications in public exhibits, immersive devices in research infrastructures or labs, etc.). This involves the development of a scalable service able to handle and track incoming interaction states via network connection, while storing them on a dedicated hub (or multiple hubs). The first challenge was thus to properly design a flexible architecture in terms of session tracking and retrieval, state variable definitions (e.g., custom attributes to track), reliability and an on-demand model. The designed protocol between the client application and the hub is as follows:
  • The client application requests a new session, including the intended attributes to record;
  • If the capture service responds successfully, a new session is initiated on the hub and the unique ID is sent to the client;
  • The client is now able to send progressive data chunks to the hub, with custom policies.
When requesting a new session, the client application formalizes a list of attributes that will be tracked during the session. This includes, for instance, spatial attributes (like virtual/physical 3D locations, eye movements, focal points, HMD location in physical space, GPS coordinates, etc.), interaction states related to the application logic or equipment (like BCI headsets’ EEG voltages for each channel, wearable device signals, etc.) or other attributes. Although, within this work, we are mainly interested in virtual or physical spaces, such abstraction allows clients to independently define and formalize a frame with custom variables to track during a session, offering huge flexibility to monitor specific interactions, equipment or application states.
The request includes also an optional g r o u p I D that allows us to capture multiple sessions under a common set; for example, in 3D applications, this may refer to a scene or object ID, while, in EEG sessions, g r o u p I D may refer to an experiment or trial.
Once the service responds successfully (the session is initiated), the client application receives a unique ID (string) referring to the session. Defined attributes are collected locally and sent as progressive data chunks; this ensures that the hub maintains a valid stored record in the event that the network connection is dropped. Interaction attributes can be recorded by the client application based on a fixed time interval policy (e.g., 0.1 s) or based on custom event-driven policies. If the session does not exist, is expired or reaches the configured limitations (duration, storage, etc.), the data chunk is dropped and the client is notified.
The open-source capture service was developed under the H2IOSC project (under E-RIHS services) on top of Node.js (https://nodejs.org/, accessed on 22 April 2024), using the micro-service architectural style [39] to provide a modular and scalable approach for deployment in research infrastructures (RIs) that are part of the H2IOSC federation or in external infrastructures.
In order to facilitate integration and provide access to the scientific community, a REST API has been designed for the open-source capture service under the H2IOSC project, following the guidelines established in Work Package 6, based on existing best practices [40,41,42]. The OpenAPI specification (https://www.openapis.org/, accessed on 22 April 2024) was also embraced to provide a formal description and documentation [43] for all exposed functionalities, targeting developers willing to access or integrate the capture service for interactive applications or remote devices.
Within the presented work, the capture service was used to monitor a set of attributes in virtual 3D spaces over time, including users’ 3D locations, orientations, view directions, navigation modes and fields of view. Furthermore, the g r o u p I D for our sessions represents a given 3D scene (or object) explored by users, resulting in multiple records associated with each 3D scene/object. This is realized by equipping the client interactive 3D application with a component able to track the set of attributes and send raw captured data to the remote capture hub, using the aforementioned REST API.

3.2. Process

In the process stage, we mostly focused on the data acquisition, preparation and analysis steps. The other aspect that we wished to incorporate by design into the process block was mechanisms that allowed analysts with different skills to work collaboratively. The process block software is open-source (GPL v3) and it is a collaborative analytics tool that can be operated on a single workstation or in a cloud infrastructure as a service with more analysts actively manipulating the shared data.
As mentioned in the previous section, given a remote capture dataset that may be continuously updated, we have a g r o u p I D variable that refers to a specific scene, an experimental treatment or some general groping condition. Then, we have the records, which, for example, may be user sessions or records of any variable that can be tracked. Figure 1 shows a process block schema. In this schema, the recorded data obtained from the capture session are referred to as raw data. After a preliminary filtering step, in which the data are directly inspected and gated, the data become processed data. In the final step, we implement statistics and machine learning methods. The outputs of these methods and algorithms are named aggregated data. Eventually, the interpretation of the aggregated data allows the analyst to elaborate insights into the analytic question.
For the first data processing step, we developed two tools: a data inspection tool and a gating tool. The data inspection tool is a web application developed with Voila and Jupyter. This web application allows the direct exploration of the raw data records through tables and graph representations, which show the evolution in time of the records. Figure 2A shows the evolution in time of the captured variables. Some variables are floating point or integer variables, since they refer to spatial coordinates or directions, and other variables are binary or nominal variables, such as the navigation mode (e.g., VR, AR). Furthermore, the tool allows the analyst to crop a specific time interval of the record or to drop the entire record if necessary. In the pilot case that we consider in this manuscript, the analysis can crop the CSV tables to the relevant parts of the records and discard records that were captured by error. This feature was used when different navigation modes were present in a single record and we were interested in studying only one mode. In general, data should be discarded only with well-defined criteria to avoid bias in the statistical outcomes; see Figure 2A. Another set of graphs shows 3D representations of the variable’s trajectories in space. In the case of user sessions exploring a virtual room, the 3D representations of the variables are the trajectories of the positions of the user, and, attached to each position recorded in the trajectory, there are arrows pointing in the direction of the user VR camera. In the gating step, we examine global metrics regarding the records, such as the total elapsed time or the variables’ total variance to exclude gross outliers, by gating the values that are greater or lower than certain thresholds (Figure 2B). To give a practical example, gross outliers could be records that last only a few seconds compared to an average of minutes or that have very low total variance because the user was not interacting with the environment for the entire time.
For the data analysis and insight extraction, we tested two machine learning methods, KDE and hierarchical clustering. Nevertheless, the toolkit is preconfigured to be extended to a range of different machine learning methods. Figure 2C,D show the KDE pdf estimation for the 3D trajectories and 2D trajectories, respectively. These representations show the focal points that correspond to the more common positions of the users. Figure 2E shows an example of an agglomerative clustering dendrogram.
Gaussian KDE generates an estimation of the probability density function (pdf). Given a sample ( X 0 , X 1 , , X n ) , the pdf f estimation is obtained with the expression
f ^ h ( X ) = 1 n h i = 0 n K ( X X i h )
where K ( X ) is a normal kernel, and h is the bandwidth. We used the Python Scipy (version 1.2.2, see [29] and https://github.com/scikit-learn/scikit-learn, accessed on 23 April 2024, for details on the software development team and location) implementation of Gaussian KDE [44].
For hierarchical clustering, we considered agglomerative clustering [45,46], in which the data entries start in a single item cluster, and the clusters are merged at each step in an iterative cycle. Each time two clusters are merged, a level in the hierarchy is added. Hierarchical clustering generates a dendrogram that is the graphical representation of a binary tree whose leaves are the initial single-entry clusters, and the successive nodes correspond to the cluster obtained by merging couples of clusters. Clusters are merged in order following a linkage clustering criterion. The linkage condition is determined by selecting the smallest distance measure among the current cluster, merging the clusters and updating the cluster list after the merge. For instance, a common distance measure among entries is the Cartesian distance. Given the distance measure, we can define a clustering linkage criterion, or within-cluster distance (WCD), which may be, for example, the complete criterion
d ( U , V ) = max u U , v V d ( u , v )
where U and V are two clusters and u and v are two data entries from each cluster, respectively [34]. Thus, the clusters are merged in order according to a greedy algorithm, starting from the clusters with lower linkage values. In particular, we used the Python Scikit-learn implementation of agglomerative clustering [29].
We set the file system to take into account the asynchronicity of the service requests. For this reason, we set a ‘raw/’ folder that could be written only by the capture service (see previous section); in this way, the capture block service can write only in this folder, while the process block can only read from this folder. This guarantees that the raw data are not changed by the processing block. Then, the processed data are saved in a separate folder called ‘proc/’. Suffixes are used to indicate different versions and intermediate steps of the processed data (see Figure 3).
In order to allow collaboration among different analysts, we have to keep track of the different versions that branch out, as different analysts implement different decisions. Tracking the different processed data versions, the analysts can collaborate and set up evaluation metrics that allow a comparison among different branches (see Figure 3).

3.3. Inspect

Large amounts of collected records, especially related to the spatial motions of 6-degree-of-freedom (6DoF) actors—like virtual cameras, HMD controllers, hands, etc.—in virtual or physical 3D spaces, even when filtered or processed, raise several challenges in terms of data presentation and inspection for sense-making and analysis. Novel ways to visualize, present and interpret such data can offer huge support to decode interaction patterns and provide analysts with advanced interfaces to interact with records and gather insights about users’ sessions.
The third stage of our pipeline thus consists of a collaborative immersive analytics tool, targeting the inspection of captured interactive sessions in virtual (or physical) 3D spaces. The resulting open-source tool (called “Merkhet”) is being developed under the H2IOSC project (pilot 7.7) on top of the ATON framework [24]. Thus, it is fully web-based and accessible by remote analysts using standard browsers, without any installation required. The tool indeed inherits the XR functionalities and spatial UIs offered by the underlying framework [22] through the WebXR protocol, but also benefits from the plug-and-play architecture for progressive web applications (or PWA [47]), improved through H2IOSC in the servification Work Package.
The first piece of information that the tool requires is the ATON scene ID (see [24], Section 3.2), representing the 3D space (or a digital replica of a physical space) where the users performed their interactions. The scene may contain a single object or a more complex virtual space with a large spatial extent. Such an ID corresponds indeed to the g r o u p I D described in Section 3.1.
Once the virtual 3D space is loaded, the tool can load the associated records (captured users’ sessions or aggregates processed in previous stage) via a user interface (see Figure 4, top row). This provides the direct visual mapping of volumetric data with the original virtual space. Analysts can request either raw data (see Section 3.1) or processed/filtered records (see Section 3.2) from the remote hub. Once a spatio-temporal record is loaded, a volumetric trajectory is realized with the associated data, suitable for standard or XR inspection. Multiple records can be loaded at once for comparison, in-depth inspection or to study more advanced interaction patterns.
Merkhet’s non-immersive interface presents a slider to control the time in the active record (see Figure 4, bottom row), thus enabling playback functionalities for the analyst while inspecting the captured session. Given the location, view direction and field-of-view attributes, it is also possible to recreate the original virtual camera settings and align the analyst’s view, thus constructing the history of the session from the same perspective as the participant.
It is also possible to load the aggregate data generated in the previous stage (Section 3.2): this generally involves single or multiple records per scene, enabling the analysts to inspect volumetric data supporting the detection of interaction patterns. Such data can be explored interactively by the remote analyst through standard or immersive VR devices, and numeric information—such as KDE density values (see Figure 5A,B)—can be included.
It also employs the renewed “Photon” component (see [24], Section 3.7), enabling synchronous collaboration among remote participants—in this case, analysts. This allows two or more remote analysts to not only operate synchronously in the same virtual 3D space using VR equipment, but also to discuss together the data that they are inspecting, directly from a standard web browser. This section describes the Merkhet functionalities offered to remote analysts on the web, accessible on mobile devices, desktop devices or XR devices. Through the base functions of the collaborative component, it is possible to see other analysts in the 3D space (as avatars), talk (spatialized audio streaming) or chat and use a shared pointer (e.g., to direct the attention of other analysts to specific areas). Furthermore, such a component, offered by ATON, allows one to build custom distributed logic for the IA tool, to additionally broadcast custom events to other connected analysts. For Merkhet specifically, we designed a set of collaborative events regarding the loading of records, aggregates and time synchronization for records (e.g., when one analyst changes the current time of the active record, all remote analysts are synchronized).
Thanks to WebXR, Merkhet allows augmented/mixed reality inspections, to perform the in-depth, 6DoF exploration of volumetric data in physical spaces. Immersive VR headsets can be used, for instance, to load volumetric data aggregates and inspect and query them in the virtual space (see Figure 5A,B). Mobile devices such as smartphones can also be used to inspect user sessions in AR (see Figure 5C), moving around the virtual object and user record in the physical space. It is also possible to use mixed reality (for instance, using devices such as Meta Quest) while discussing with other remote analysts online (see Figure 5D), through the collaborative functionalities offered by the ATON framework. This offers novel ways to visualize, inspect and discuss data records and interaction patterns together with remote experts in the same virtual space, using standard web browsers.
It is useful during analysts’ reasoning and sense-making related to data records and/or aggregates to keep track of the process directly in the virtual 3D space. In order to provide such a functionality and maintain a consistent process with other remote analysts in the same collaborative session, Merkhet exploits a few core ATON routines. The web app model of the framework in fact offers, through the API (https://aton.ispc.cnr.it/apidoc/client/App.html, accessed on 22 April 2024), the possibility to access dedicated, basic app storage (maintained on server side). Such a feature allows us to store generic data associated with the app, like custom data structures including add/update/delete operations, using the JSON patch approach (see [24], Section 3.5). We exploit such routines to store per-record or per-aggregate 3D annotations (bookmarks) made by analysts; this can be used by them to annotate specific moments (e.g., session records) with generic observations (see Figure 5, bottom row). In our pipeline, we investigated standard text content and audio content (vocal annotations), the latter being particularly useful for immersive or mixed reality sessions. For session records, bookmarks are linked to specific temporal marks, with corresponding attributes (view direction, location, etc.). Once the annotation is accessed by the analyst, the original captured viewpoint of the participant can be recalled (e.g., to discuss or focus on specific details/areas from the same perspective, etc.). The tool also provides voxel-based routines and classes to locally compute basic data aggregates alternatively to those generated by the hub (see previous section). Thanks to the accelerated spatial structures [48] and the bounding volume hierarchy (BVH) trees offered by the ATON framework (see [24], Section 3.6.4), several ray-casting processes involving visibility, focal points, etc., can be computed locally. For instance, it is possible to compute focal fixations in a 3D space for a given record from specific spatial attributes, exploiting internal voxel structures to produce and render a new data aggregate in the same space.

4. Experimental Results

In order to assess our pipeline, we applied the described workflow to a WebXR application developed by CNR ISPC (named “/imagine”), comprising several virtual environments populated by generative AI content. The web application tracked anonymous spatial data on the general public during two different exhibits in Italy: ArcheoVirtual 2023 in Paestum (3 days) and TourismA 2024 in Florence (2 days). This setup was particularly interesting for our assessment for multiple reasons:
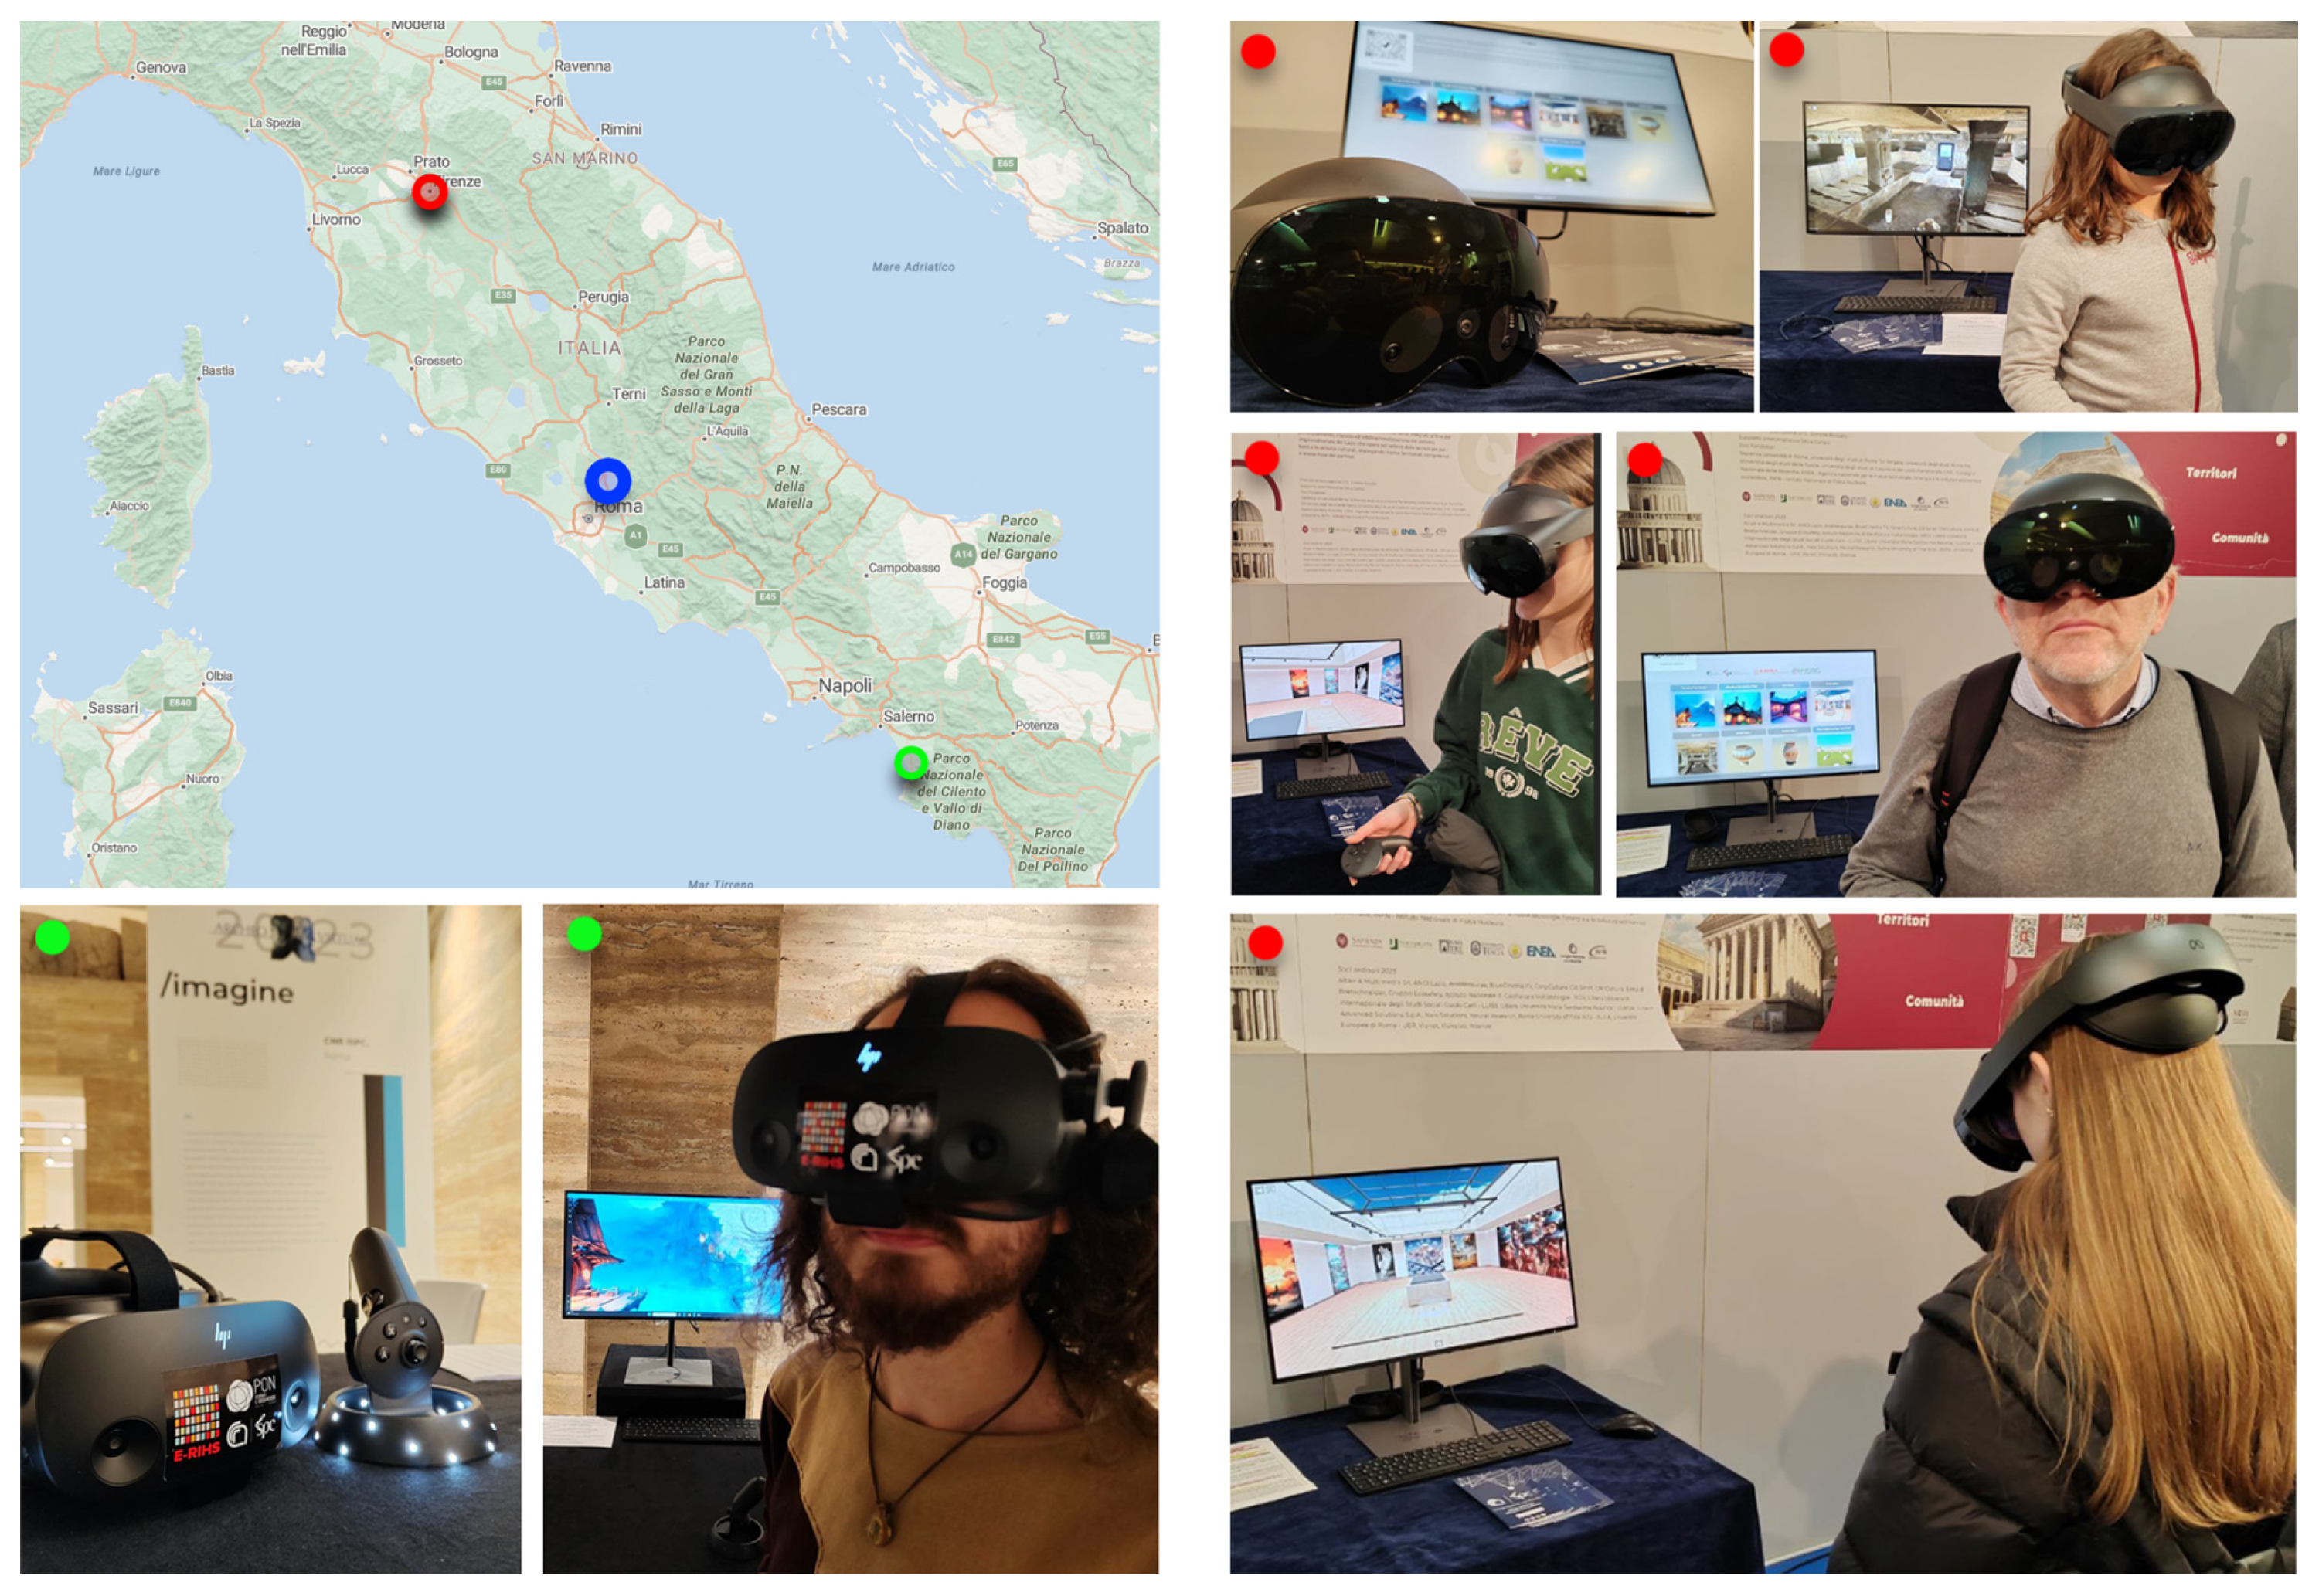
  • the physical distance between the public hub (server located in main CNR research area, in Rome) and the actual location where users performed their sessions, thus involving an internet connection for data transmission;
  • the number of visitors attending both events, with exhibit spaces focused on heritage and AI;
  • the opportunity to study and investigate how people respond to and interact with generative AI content, using HMDs (immersive VR and MR).

4.1. Service Setup and Exhibit Equipment

Regarding the pipeline setup for both events, we employed two server nodes with public access (services accessible over an internet connection).
  • Analytics hub: this dedicated server hosted the stages described in Section 3.1 (capture) and Section 3.2 (process), under the H2IOSC project.
  • ATON server: this dedicated server hosted the main instance of the ATON framework, providing web applications and 3D content. In this case, this was the “/imagine” WebXR application and its generative AI content, as well as the “Merkhet” WebXR tool (inspect stage, described in Section 3.3).
Both servers involved were based on the Linux OS (Ubuntu Server 20.04.6 LTS) with the Node.js and PM2 setups for the cluster deployment of micro-services, located in Rome (main CNR area).
In terms of equipment, the onsite physical installations were composed of the following:
  • A single workstation and one HMD (HP Reverb G2 Headset) were used to experience an immersive VR mode for the ArcheoVirtual event;
  • A standalone HMD (Meta Quest PRO) was used to experience both the VR and MR modes (see Figure 6) for the TourismA event.
Indeed, due to the transmission of anonymous data (sessions) to the capture service deployed in the Rome hub, an internet connection was required for both setups.

4.2. The WebXR App “/Imagine”

The WebXR application (“/imagine”) allows visitors to explore and interact with different generative AI scenes online through a standard browser, including both purely panoramic content (360) and 3D models. Different generative AI services were used and combined for visual, narrative and aural content: this allowed us to accelerate the content creation pipeline for immersive 3D scenes. AI translators and text-to-speech services were also employed to aurally enrich the semantically annotated 3D scenes by professionals. For each generative scene (created and published using the ATON framework), we describe the content creation pipeline alongside the interaction patterns detected using the tools described in Section 3.
We equipped the “/imagine” app with a capture component able to track a well-defined set of attributes in 3D spaces using a fixed sample time (interval) of 0.2 s (see Section 3.1). Such a sample time demonstrated a good trade-off between the file size of the session records and the trajectory resolution. More precisely, through previous tracking experiences and preliminary tests, we found that sample times over 0.5 s gave inadequate trajectory resolutions. Attributes included the user’s location P (3D vector), orientation O (Quaternion), view/head direction V (3D normalized vector), navigation mode (string) and field-of-view (float). Since no eye tracking was employed in the HMDs, we adopted [49]’s model, offering a good approximation from V, and obtained fixations with the ray-casting process. Visitors were informed before the experience by onsite personnel about the ongoing anonymous tracking of such spatial attributes. During the two exhibits combined, the WebXR application generated a total of 387 raw records (immersive sessions) on the remote hub for all scenes, with variable durations. In both cases, the onsite experience was supervised by dedicated personnel: the initial explanation of the experience and the start/end of session recording.
Regarding the navigation model used by visitors to explore the immersive VR scenes, we used a static location for purely panoramic content (only orientation), while, for the 3D models or environments, a standard teleport technique [50] to minimize motion sickness was offered. For the AR/MR exploration of generative 3D objects, a real walking model was used to move around the virtual item in the physical space available.
The following sections describe selected scenes experienced by visitors of both exhibits using HMDs, with a brief introduction to the content creation process, an explanation of the immersive analytics tasks (using the presented pipeline) and some discussion of the results.

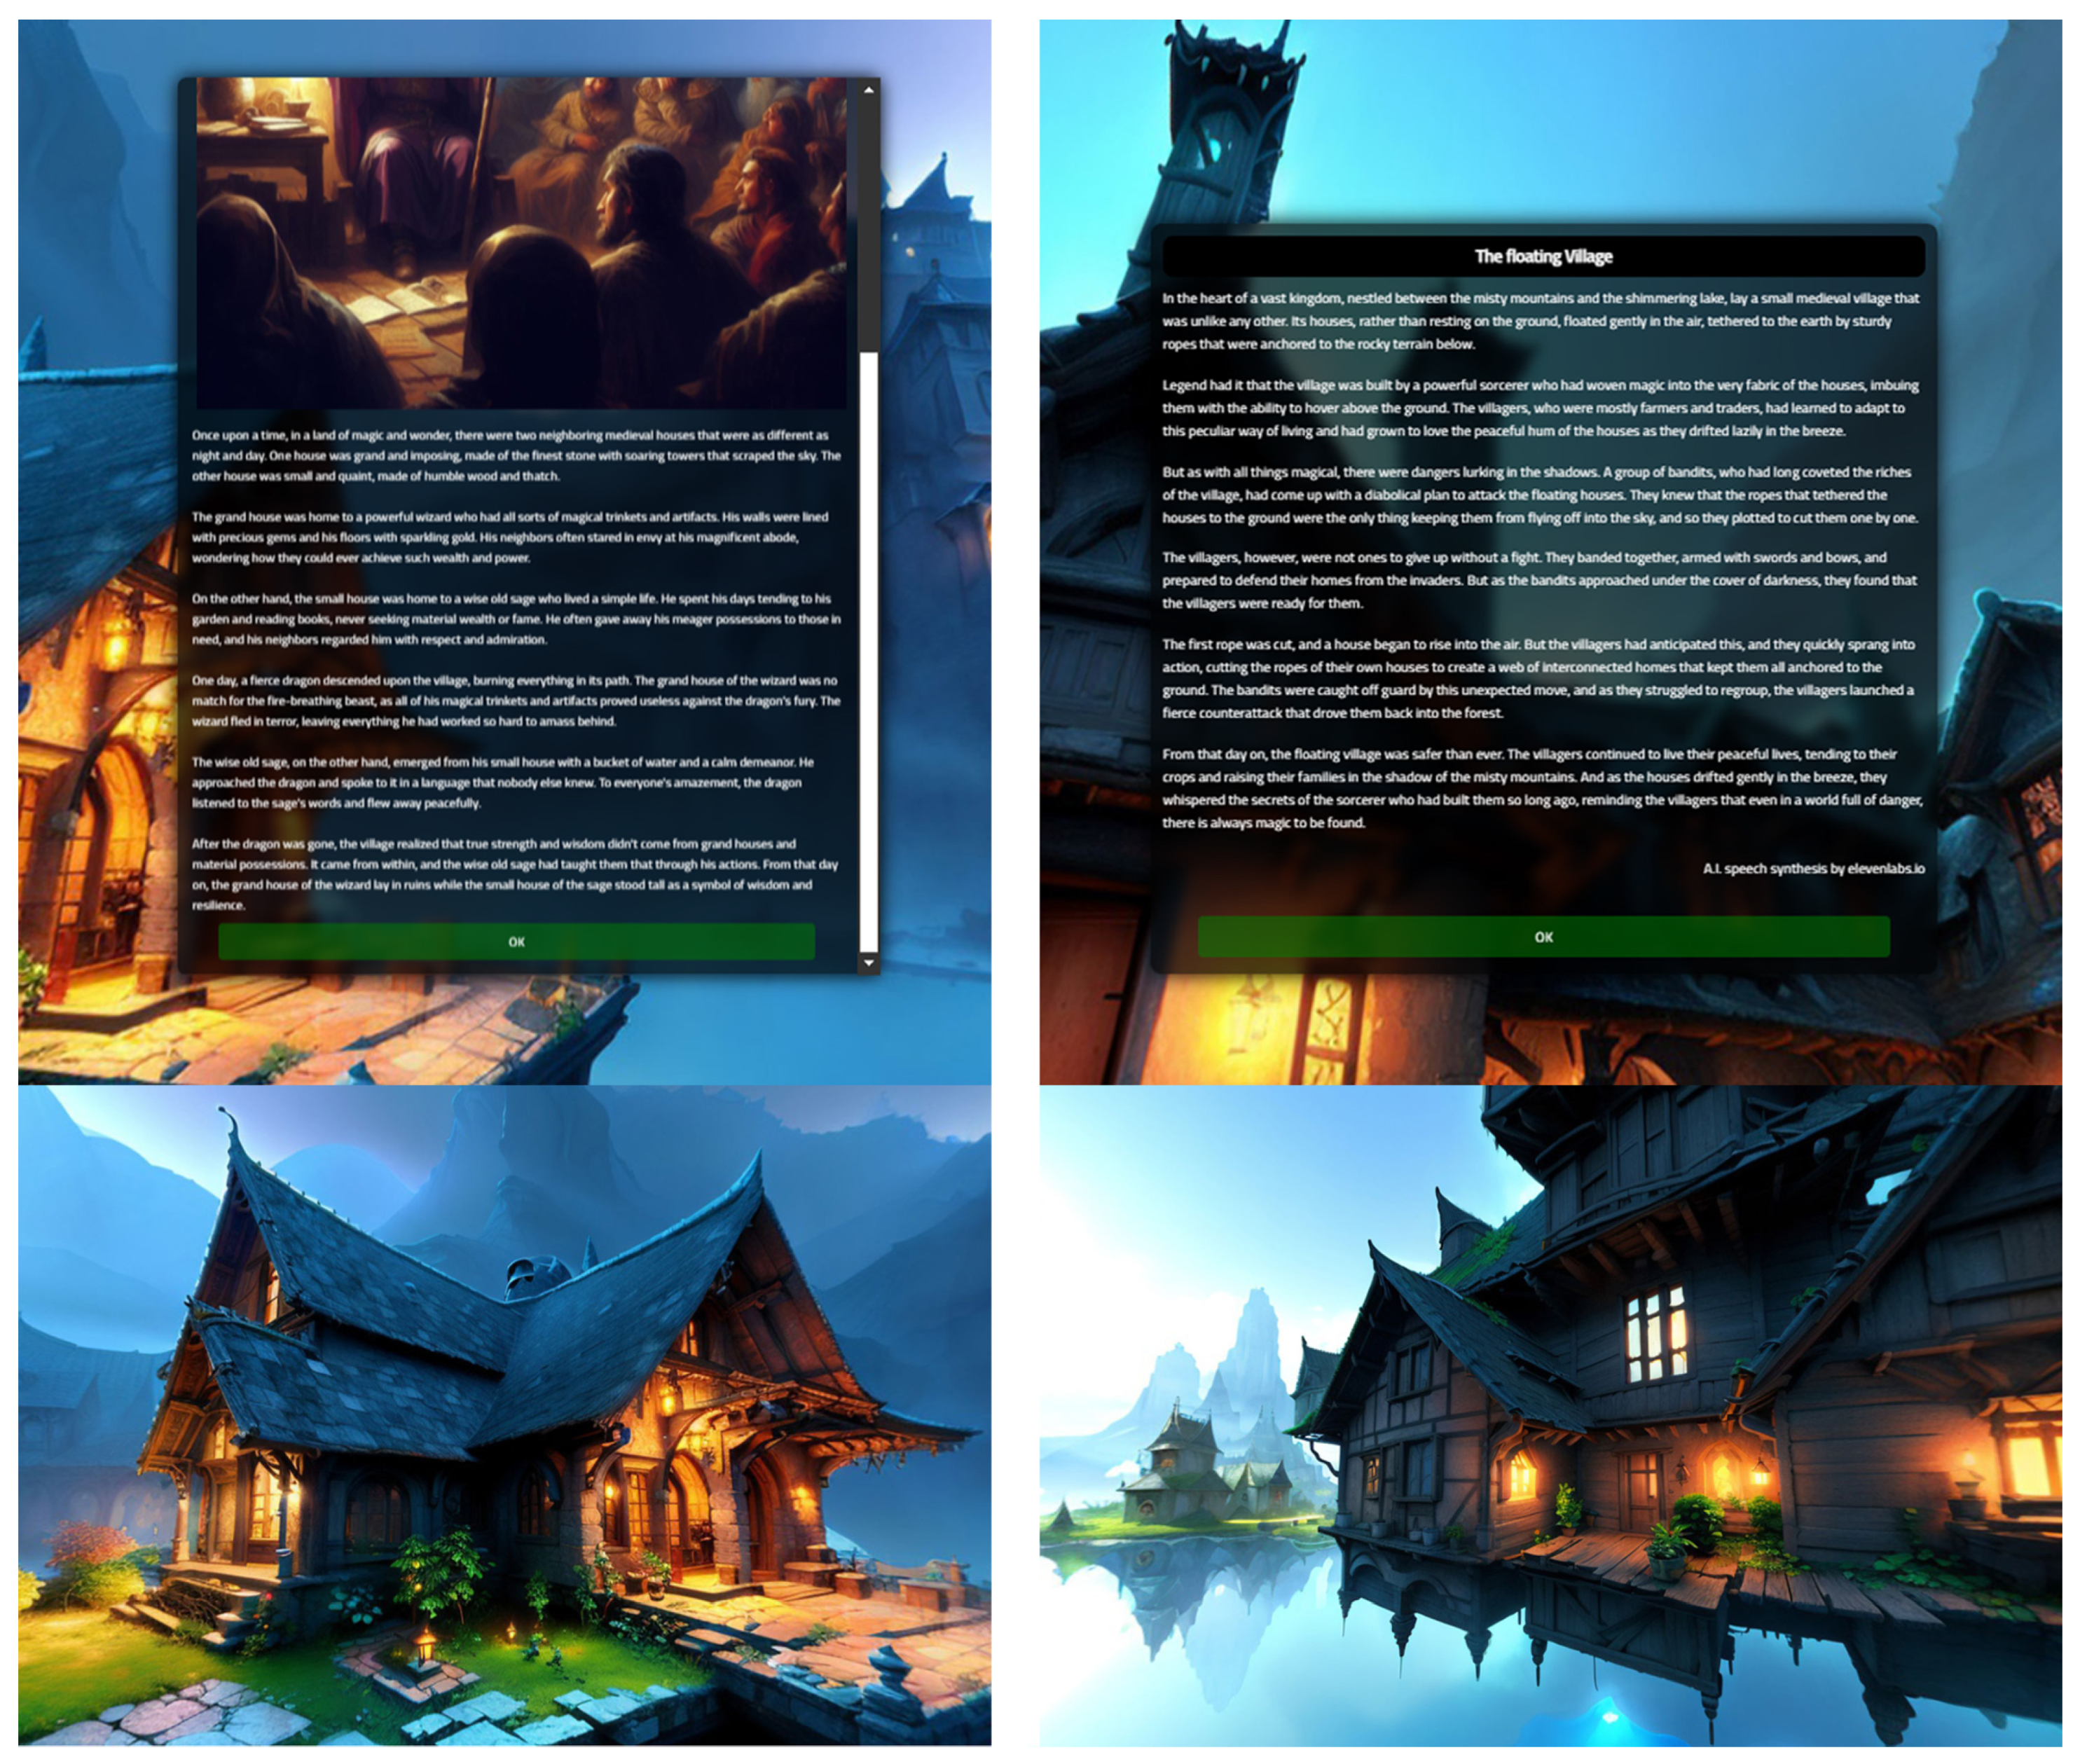
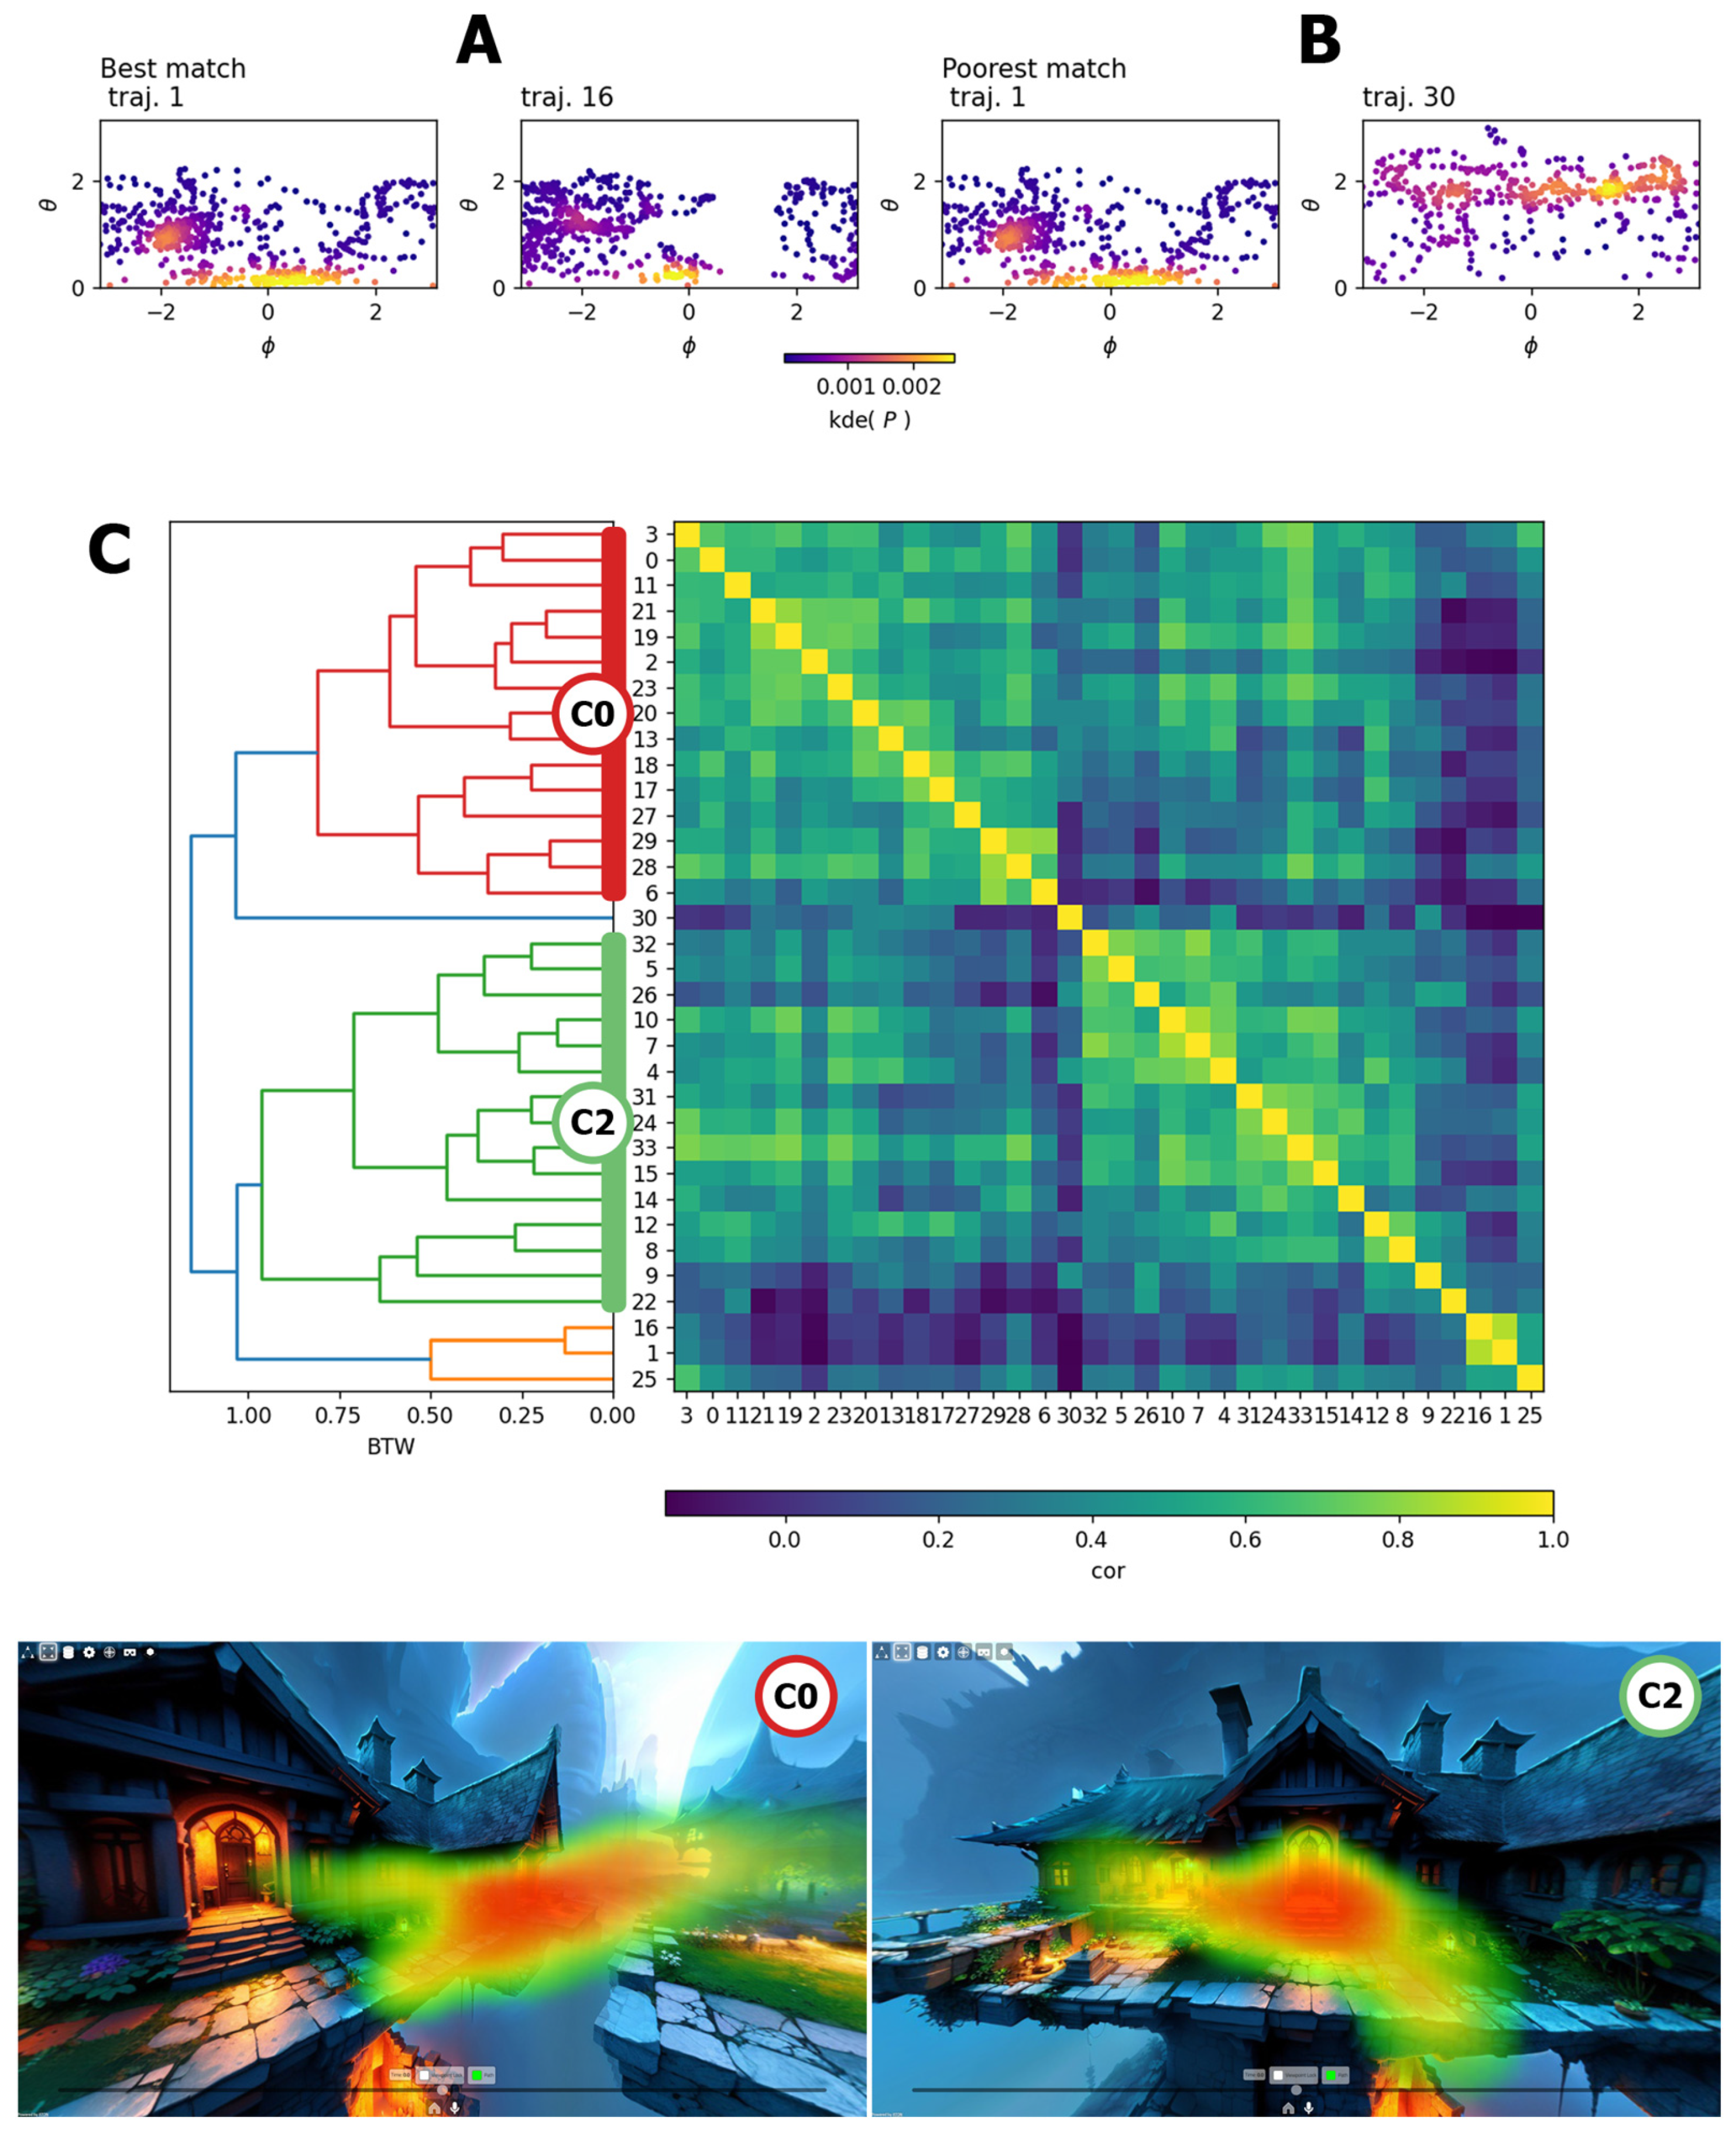
4.3. Panoramic Generative Tales

This set of scenes (short immersive tales), including visual, aural and narrative content, was generated by a single prompt through multiple AI services. Such a prompt was used to generate the immersive panoramic environment, using Blockade Labs’ Skybox AI service https://www.blockadelabs.com/ (accessed on 22 April 2024). The same prompt was used in ChatGPT to generate a short tale; the resulting text was also used in a few text-to-speech AI services to create aural content suitable for immersive VR consumption (see Figure 7). The overall time required to generate the two immersive 3D scenes was about 15 min.
For panoramic scenes specifically (equirectangular data), we focused our analysis only on view direction attributes (V), since 360 content in ATON is assumed with an “infinite” distance; thus, local variations in P were not useful for our study. The Merkhet tool automatically detects whether the scene presents pure panoramic content, adjusting how the visual trajectories are computed and rendered—in this case, they were re-projected using V attributes (see Figure 8A,B).
After the processing step on the collected raw data (see Section 3.2), Merkhet was used to remotely access, inspect and annotate the sessions and data aggregates (Section 3.3. Standard visualization allowed us to load single or multiple records (see Figure 8A) to analyze the view direction trajectories of the ArcheoVirual participants. Figure 8B shows an immersive inspection (Meta Quest 2) of one record from TourismA, with a bookmark on the house entrance from another analyst. As described in Section 3.3, Merkhet allows one to locally compute basic aggregates, such as location fixations (Figure 8C–F), that can be inspected through bot-immersive or non-immersive modes. It was thus possible to inspect single records and compute fixations directly inside the browser, using voxel-based routines (each computation assumes a 3D space). Through the tool, it was possible to compare also sessions from the two different exhibits, as well as data aggregates. Two view direction KDEs were computed per exhibit and compared through the tool (Figure 8G,H). The results show only a few differences between the respective visitors, although they all seemed to focus mainly on one of the two houses narrated in the story.
To determine whether the users clustered in different groups according to the trajectories of their view direction attributes, V, in the “The Two Houses” panoramic view, we implemented an agglomerative clustering model (Figure 9). Let a view direction trajectory be a sequence of view directions V u = ( V 1 , V 2 , V n u ) . To compute the agglomerative clustering model, we selected the Pearson correlation between pairs of view trajectory 2D KDEs as the metric. Thus, we computed the view direction KDEs, f ^ σ ( V | V u ) , for each trajectory V u , with Equation (1), and used Scott’s rule [51] for bandwidth selection. Finally, we computed the Pearson correlation between the view trajectory KDE couples.
ρ ( u , v ) = ρ ( f ^ σ ( V | V u ) , f ^ σ ( V | V v ) ) = x , z ( f ^ σ ( V | V u ) M u ) ( f ^ σ ( V | V v ) M v ) x , z ( f ^ σ ( V | V u ) M u ) 2 x , z ( f ^ σ ( V | V v ) M v ) 2
where M u = x , z f ^ σ ( P | P u ) . Given the Pearson correlation definition, we obtained the Pearson correlation matrix shown in Figure 9C. Figure 9A,B show the pair of view trajectories with the highest and lowest Pearson correlations computed on the corresponding 2D KDEs. Thus, we computed the agglomerative clustering model, with d ( u , v ) = 1 ρ ( u , v ) and the complete linkage criterion, and obtained the dendrogram in Figure 9C. With a WCD threshold of 0.98 , the dendrogram in Figure 9C gives two larger clusters (C0 and C2) and two smaller clusters. Figure 9 (bottom row) shows where the users in cluster C0 and cluster C2, respectively, focused the most in the Merkhet tool, elucidating how the two clusters were differentiated by their focus on two different portions of the larger house.

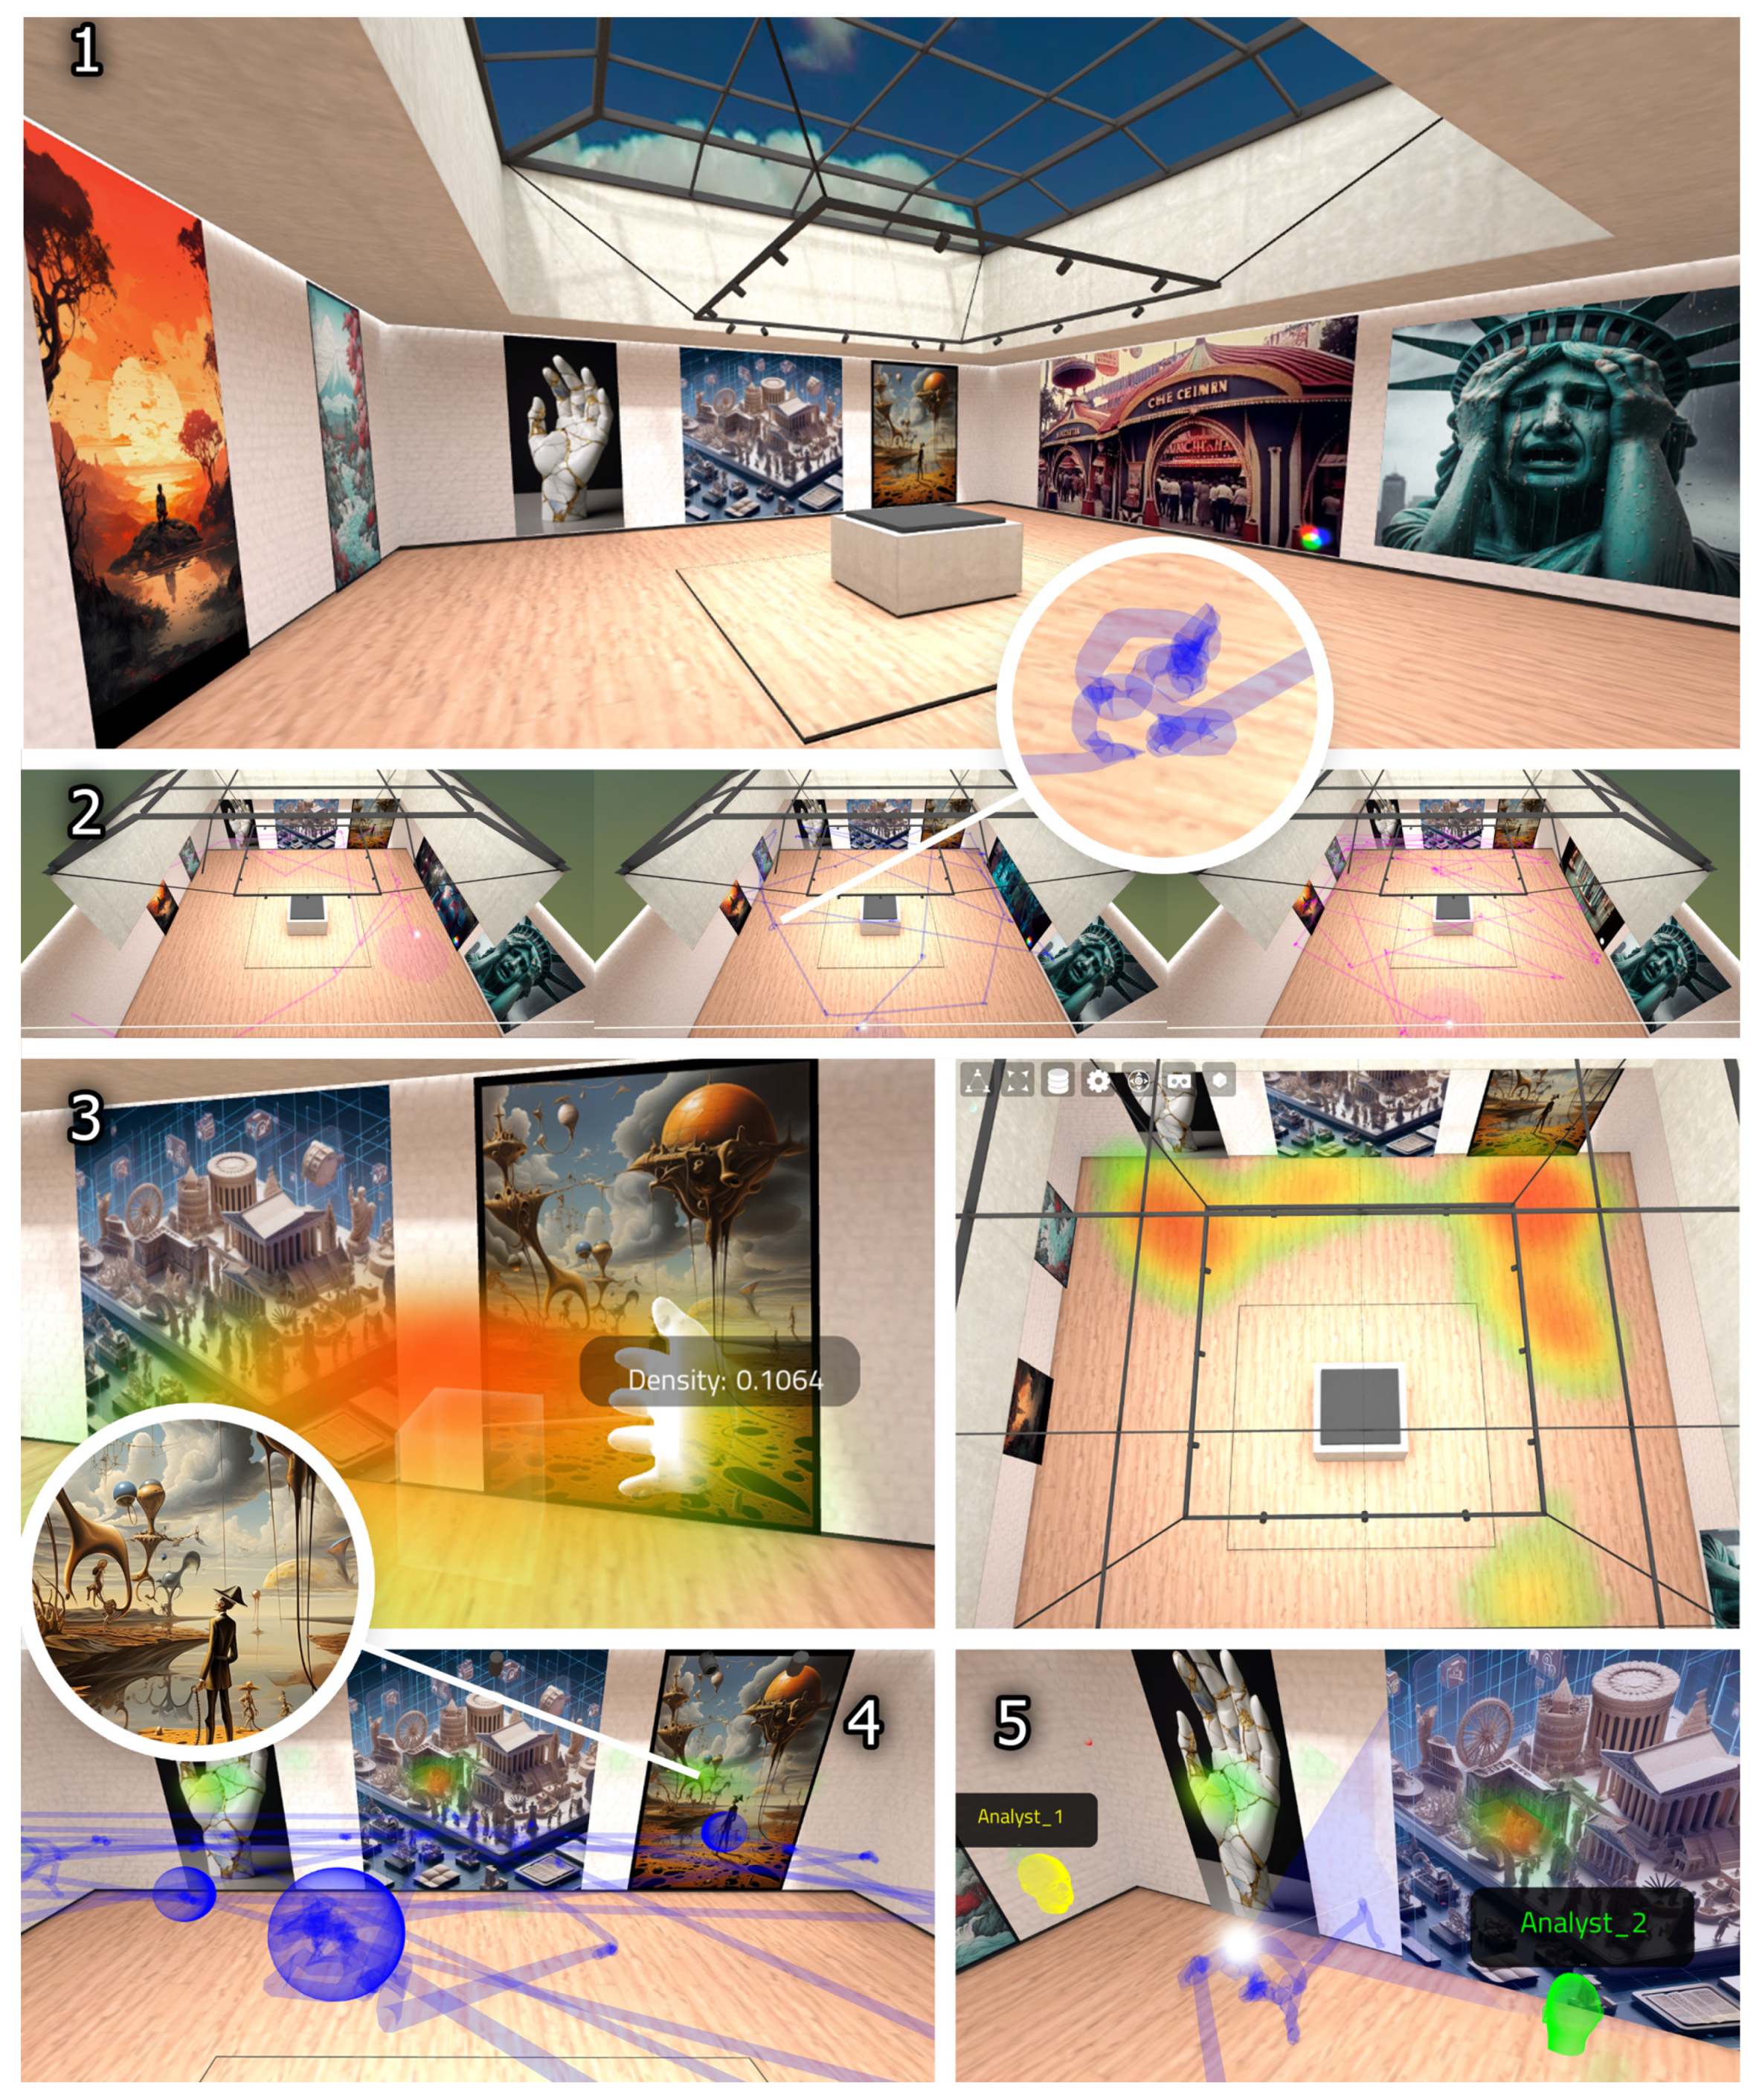
4.4. Generative Art Gallery

This scene presented a gallery of generative AI art. The content was fetched by multiple services, including mainly Midjourney (https://www.midjourney.com/showcase, accessed on 22 April 2024), a generative AI video (“Carnival of the Ages” by the RealDreams AI studio) and some content generated by the Microsoft Bing image creator (Dall-E 3). An initial setup for all images was chosen, and this was not changed during both exhibit events (see Figure 10(1)).
This scene proved to be particularly interesting for visitors, especially for the detailed, high-resolution generative images and the dynamic content including audio (the movie) placed on different walls. Users were free to move around and inspect each piece using a teleport model activated by their controllers. When loading and comparing different session records in the 3D space, we can clearly discern (also visually) the zig-zag pattern displayed by all visitors (see Figure 10(2)). The main reason is indeed the teleport model and how they used it to move closer to specific AI pieces. Furthermore, after closer inspection through immersive VR headsets, the trajectories present a few stopovers (or 3D “knots”), including minimal shifts also involving the vertical axis (see Figure 10(2), circle). This can be explained by the 6DoF motions in the physical tracked area to explore the piece—for instance, visitors squatting to observe the lower details of an image. Specific data aggregates—for instance, the computed KDEs on P (position) attributes—could be explored and inspected by the analysts through immersive VR (see Figure 10(3)). Such data highlight specific areas where users stopped for short periods to observe specific pieces.
A few sessions in the ArcheoVirtual event were particularly prolonged (see Figure 10(4)) since the visitors were interested in exploring the gallery space and inspecting each piece. Multiple analysts used bookmarks to take notes about specific users’ behaviors, including stops, unusual motions while inspecting a piece, unusual locomotion behaviors, a better understanding of physical motions (tracked HMD area) to inspect hard-to-reach details, etc. Furthermore, locally computed fixations were used by the remote analysts to support such processes and also to identify the pieces that captured the users’ attention the most.
Using the collaborative features of the tool (see Figure 10(5)), the remote analysts were able to discuss their observations of the volumetric data and bookmark salient areas while exploiting the time synchronization feature for records (see Section 3.3), leading to faster analytic processes through a standard web browser. For instance, it supported the correlation of observations gathered onsite during the event and the patterns emerging from the captured sessions—more specifically, two pieces that were particularly interesting for visitors (the Dali-like image and the crying Statue of Liberty).
As in the previous case (Section 4.3), to further investigate the users’ data, we applied the agglomerative clustering algorithm to understand their explorative sessions in the AI gallery. Figure 11 shows the results of the agglomerative clustering model on the users’ trajectories. To perform agglomerative clustering, we selected the Pearson correlation between pairs of trajectory KDEs as the distance metric. Given that, in this case, we considered each recorded trajectory u to be a sequence of positions, P u = ( P 1 , P 2 , , P n u ) . First, we computed the positions’ 2D KDEs, f ^ σ ( P | P u ) , for each trajectory u, using Equation (1) and Scott’s rule [51] for bandwidth selection. This KDE was 2D because, given the yup coordinate system, we computed the marginal distribution on the x z coordinates. Then, for each recorded trajectory pair, ( u , v ) , we computed the Pearson correlation between the KDEs. This gave the Pearson correlation matrix in Figure 11C. Figure 11A shows the two trajectories with the highest Pearson correlations, ρ ( a , b ) = 0.83 . Figure 11B shows the two trajectories with the lowest Pearson correlations, ρ ( a , b ) = 0.12 . To compute the WCD between two clusters, we used the complete condition in Equation (2) with d ( a , b ) = 1 ρ ( a , b ) . Given these assumptions, we ran the agglomerative clustering algorithm and obtained the dendrogram in Figure 11C.
If we stop the clustering process at WCD under 0.87, we find seven clusters. Cluster 1 is composed of trajectories of users that mostly stopped in front of the hand and Dali-like artwork, very close to the wall. By inspecting the single users’ trajectories with the inspection service, we found that this group mostly focused on the hand and the Dali-like artwork. The users also focused on the crying Statue of Liberty and the generated video from a distance, without moving closer. The users in Cluster 2 stopped in front of most of the artwork. These users tended to position themselves further from the artwork, obtaining a more comfortable view. By inspecting the single users’ trajectories with the inspection service, we found that these users observed the artwork more systematically, observing all pieces evenly. Cluster 3 mostly stopped slightly above the center and used the teleport less frequently. By inspecting the single users’ trajectories with the inspection service, we noticed that they mostly observed the hand and the Dali-like artwork together with the crying Statue of Liberty. Cluster 4 spent more time in front of the sunset artwork. This group tended to observe the Dali-like artwork and the crying Statue of Liberty as in the other groups but spent more time observing the sunset artwork on the left side of the room. Cluster 5 is the second largest cluster, and the users in this cluster spent more time on the side in front of the “Carnival of the Ages”. This group tended to observe the Dali-like artwork but, in comparison to the others, spent more time observing the "Carnival of the Ages" video and the crying Statue of Liberty. Cluster 6 is composed of only two records; the users of this cluster positioned themselves in the center of the room for most of the time and observed most of the artwork from there. Cluster 7 comprises users who used the teleport less frequently and mostly stopped in positions near the center. They tended to observe most of the artwork evenly, with particular attention to the “Carnival of the Ages” video and the crying Statue of Liberty.
Furthermore, if we stop the clustering process before the last merge, we find two distinct clusters of people. One cluster is composed of people who mostly spent time in the top portion of the room, observing the hand and the Dali-like picture, and the second cluster is composed of people who mostly spent their time on the right side of the room, observing the “Carnival of the Ages” video and the crying Statue of Liberty. These clusters indicate that there were distinctive modalities in the exploration of the room, with some users who wished to be very close to the artwork and focused more on the details that captured their attention and some users who observed the artwork from further away and tended to observe the artwork more evenly.

4.5. The Tomb

For this scene, we used a previously published 3D model of the Cerveteri tomb (Italy). In this case, semantic annotations already validated by professionals were exploited as input to AI services (translators and text-to-speech). Annotation texts were first automatically translated and then converted into narrating voices, thus augmenting the semantic graph already in place with aural content. Visitors could explore the 3D model using a head-mounted display and activate translated audio content associated with the 3D annotations.
Figure 12C shows the arrangement of the semantic annotations (blue) with the narrating generative voices, activated by the users via VR controllers. The usual teleport technique (the same as for the art gallery—Section 4.4) was used by the visitors to explore the tomb with the headset.
We processed and compared (through the tool Merkhet) two KDE data aggregates taking into account the users’ positions for all sessions captured during ArcheoVirtual (see Figure 12A) and TourismA (see Figure 12B), respectively. Apart from a few differences in terms of the density peaks and volumetric distribution, it is clear that, at the locomotion level, the exploration was partially driven by semantic annotations (visible through pulsating hints). Another KDE data aggregate, this time on focal points, was also computed (see Figure 12D) to be immersively inspected by the analysts for the quick detection of the most attractive areas for visitors.
Moreover, in this case, it was possible to start the discussion of the session records directly in the virtual space: Figure 12E shows multiple online analysts switching between different TourismA records to initiate the annotation process (bookmarks).

4.6. Generative 3D Models with Mixed Reality

In order to investigate our immersive analytics pipeline on 3D objects, we used the Luma AI generative service “genie” (https://lumalabs.ai/genie, accessed on 22 April 2024) to generate a collection of items starting from a single prompt. The controlled extents and sizes of such generative 3D objects allowed us to experiment with augmented and mixed reality presentation modes (already offered by ATON) during the TourismA event (see Figure 13A). Figure 13B shows a sample AR presentation of two generative objects on top of a table. For scale reference, the objects were actually placed in the center of the physical space during the experience, to allow visitors to walk around and inspect them in mixed reality using the Meta Quest PRO (passthrough mode). User were thus free to explore the virtual items by moving physically in the real space, a designated area.
As for previous experiments, the analysts were able to inspect the captured sessions through a standard desktop (Figure 13C), but also via augmented reality using a standard smartphone (Figure 13D), moving around the item and its data in the physical space. Immersive VR was used by the analysts to query the KDEs computed on the physical motions in the real space, to better understand the volumetric usage around the item itself and understand where people stopped the most.
Using the collaborative mode, it was possible to inspect the captured data once again through a Meta Quest PRO. This allowed us to inspect the objects and TourismA sessions in another physical location (Rome) in mixed reality (Figure 13F). Furthermore, such analyses were carried out with another analyst (with another Meta Quest PRO) located in a different building and connected through the internet (Figure 13G). The two analysts discussed the captured data in their lab rooms via audio streaming and using collaborative tools such as shared pointers to highlight how some generative details influenced visitors’ explorations (see dual view in Figure 13H). Mixed reality in this experiment offered a natural way to walk around the item and discuss it, alongside its captured data and 3D annotations floating in real space. Such a presentation indeed proved to be more effective for the analysts when the 3D scene had a limited size extent (as in this case, with small objects) to exploit the real walking technique.

5. Conclusions

We presented and discussed a web-based, collaborative, open-source pipeline to capture (Section 3.1), process (Section 3.2) and inspect (Section 3.3) remote interactive sessions, providing a modular immersive analytics system to accelerate the detection of interaction patterns among remote analysts and support sense-making tasks. The pipeline components can be deployed on a dedicated hub (or multiple hubs) targeting public exhibits, research infrastructures, lab facilities, interactive 3D/XR applications or advanced equipment (e.g., HMDs, motion-tracking devices or sensors, BCI headsets, etc.).
We assessed the pipeline and its advantages through a WebXR application presenting generative AI content to visitors in two remote public exhibits (Section 4), transmitting anonymous spatial data to a remote hub via an internet connection. Generative AI services gave us the possibility to greatly accelerate the content creation workflows and study the impact on visitors through a set of immersive experiences.
Although, in this work, we focused on the spatial interaction in virtual 3D scenes, the capture service that we developed (Section 3.1) offers full abstraction in terms of state attributes, alongside a formalized REST API (following the guidelines developed in H2IOSC). This makes it suitable for a wide range of scenarios, including the tracking of custom properties for remote devices, remote infrastructure equipment, online applications or motion tracking sensors. Tracking actors’ attributes in physical spaces is also possible if proper equipment is employed—for instance, in museums [52], CAVEs, motion tracking suits, GPs-based location tracking in web applications and much more.
The central processing stage (Section 3.2) offers a suite of web-based services for analytics workflows to examine and filter incoming raw data and then process them on the hub using machine learning models. This workflow is designed for teams that collaborate in implementing and comparing different machine learning models, and it allows a natural extension to deep neural network models and other cutting-edge machine learning methods. The next step for this stage will be to integrate compact image-based encoding models such as “PRISMIN” [53,54], in order to improve the exchange, transfer, manipulation and comparison of data records and aggregates among different peers/hubs over the network, also facilitating new machine learning approaches.
We designed and developed “Merkhet” (Section 3.3), a WebXR immersive analytics tool offering advanced features to inspect, query and annotate data records and aggregates. Thanks to the underlying ATON framework, the tool can be accessed anywhere on mobile devices, desktop devices and especially immersive headsets, providing spatial interfaces to interact with data in XR modes. Furthermore, the tool offers synchronous collaborative inspection among remote analysts, allowing remote professionals to discuss, together in the same virtual space, session records or data aggregates.
Through the assessments that we carried out in Section 4, the tool was demonstrated (1) to accelerate the detection of interaction patterns and support insights; (2) to facilitate inspection and correlation tasks due to the volumetric overlay of session data and the original virtual space where the visitors were recorded; (3) to accelerate sense-making tasks thanks to the collaborative mode, with multiple analysts discussing and annotating the data in real time; (4) to offer augmented/mixed reality inspections carried out in different physical spaces by multiple online analysts on the same virtual scene (see Section 4.6), using only a standard web browser. The next development steps will equip the Merkhet tool with more advanced functionalities, related to spatial interfaces, local computation routines (e.g., ray-tracing for visibility) and the automatic generation of locomotion graphs or nav meshes based on the captured data. Such routines identifying optimal locations (e.g., combining positional KDEs and focal fixation data) will be particularly interesting to investigate the automation of constrained/guided navigation models. We also foresee, for future works, an in-depth investigation of the collaborative reasoning and sense-making efficacy using the proposed pipeline and tools.
The pipeline has a highly modular design; scientific communities can thus deploy the three stages in different server nodes (e.g., H2IOSC data centers) or single stages (e.g., the capture service alone). We foresee the potential integration of these services in other pilots, as well as international collaborations (already starting) to capture remote sessions involving physical or virtual spaces happening outside the national territory or in remote locations.

Author Contributions

Conceptualization, B.F. and G.G.; methodology, B.F. and G.G.; software, B.F. and G.G.; validation, B.F. and G.G.; data curation, G.G.; writing—original draft preparation, B.F.; writing—review and editing, B.F. and G.G.; visualization, B.F. and G.G.; supervision, B.F. All authors have read and agreed to the published version of the manuscript.

Funding

This research is funded by the H2IOSC Project—Humanities and Cultural Heritage Italian Open Science Cloud (https://www.h2iosc.cnr.it/, accessed on 22 April 2024), funded by the European Union NextGenerationEU—National Recovery and Resilience Plan (NRRP)—Mission 4 “Education and Research” Component 2 “From research to business” Investment 3.1, “Fund for the realization of an integrated system of research and innovation infrastructures”, Action 3.1.1 “Creation of new research infrastructures strengthening of existing ones and their networking for Scientific Excellence under Horizon Europe”—Project code IR0000029-CUP-B63C22000730005. Implementing Entity CNR. The results of the presented work refer to the H2IOSC pilot 7.7 (“Immersive Analytics and Spatial Interfaces”) following the WP6 servification guidelines and architectural advancements from task 6.3.

Data Availability Statement

All open-source tools and services developed by the authors for the pipeline can be found on GitHub: ATON framework (https://github.com/phoenixbf/aton, accessed on 22 April 2024); capture service (https://github.com/phoenixbf/capturehub, accessed on 22 April 2024); Time series insight toolkit (https://github.com/ggosti/TimeSeriesInsightToolkit, accessed on 22 April 2024); Merkhet tool (https://github.com/phoenixbf/merkhet-app, accessed on 22 April 2024); Merkhet plugin for ATON (https://github.com/phoenixbf/merkhet-plugin, accessed on 22 April 2024).

Acknowledgments

The authors wish to thank the teams involved in the organization and supervision of the two exhibits in Paestum (ArcheoVirtual 2023 by CNR ISPC) and Florence (TourismA 2024, NOVa space by DTC Lazio—with CNR ISPC and DigiLab Sapienza), where the “/imagine” WebXR experience was available to the public.

Conflicts of Interest

The authors declare no conflicts of interest.

Abbreviations

The following abbreviations are used in this manuscript:
IAImmersive analytics
HMDHead-mounted display
BCIBrain–computer interface
RIResearch Infrastructure
DoFDegrees of freedom
AIArtificial intelligence
MLMachine learning
KDEKernel density estimation
WCDWithin-cluster distance

References

  1. Klein, K.; Sedlmair, M.; Schreiber, F. Immersive analytics: An overview. It-Inf. Technol. 2022, 64, 155–168. [Google Scholar] [CrossRef]
  2. Dwyer, T.; Marriott, K.; Isenberg, T.; Klein, K.; Riche, N.; Schreiber, F.; Stuerzlinger, W.; Thomas, B.H. Immersive Analytics: An Introduction. In Immersive Analytics; Springer: Cham, Switzerland, 2018; pp. 1–23. [Google Scholar]
  3. Saffo, D.; Di Bartolomeo, S.; Crnovrsanin, T.; South, L.; Raynor, J.; Yildirim, C.; Dunne, C. Unraveling the design space of immersive analytics: A systematic review. IEEE Trans. Vis. Comput. Graph. 2023, 30. [Google Scholar] [CrossRef]
  4. Fonnet, A.; Prie, Y. Survey of immersive analytics. IEEE Trans. Vis. Comput. Graph. 2019, 27, 2101–2122. [Google Scholar] [CrossRef] [PubMed]
  5. Marai, G.E.; Leigh, J.; Johnson, A. Immersive analytics lessons from the electronic visualization laboratory: A 25-year perspective. IEEE Comput. Graph. Appl. 2019, 39, 54–66. [Google Scholar] [CrossRef] [PubMed]
  6. Kraus, M.; Fuchs, J.; Sommer, B.; Klein, K.; Engelke, U.; Keim, D.; Schreiber, F. Immersive analytics with abstract 3D visualizations: A survey. Comput. Graph. Forum 2022, 41, 201–229. [Google Scholar] [CrossRef]
  7. Sorger, J.; Waldner, M.; Knecht, W.; Arleo, A. Immersive analytics of large dynamic networks via overview and detail navigation. In Proceedings of the 2019 IEEE International Conference on Artificial Intelligence and Virtual Reality (AIVR), San Diego, CA, USA, 9–11 December 2019; IEEE: Piscataway, NJ, USA, 2019; pp. 144–1447. [Google Scholar]
  8. Riecke, B.E.; LaViola, J.J., Jr.; Kruijff, E. 3D user interfaces for virtual reality and games: 3D selection, manipulation, and spatial navigation. In Proceedings of the ACM SIGGRAPH 2018 Courses: Special Interest Group on Computer Graphics and Interactive Techniques Conference, Vancouver, BC, Canada, 12–16 August 2018; pp. 1–94. [Google Scholar]
  9. Hayatpur, D.; Xia, H.; Wigdor, D. Datahop: Spatial data exploration in virtual reality. In Proceedings of the 33rd Annual ACM Symposium on User Interface Software and Technology, Virtual, 20–23 October 2020; pp. 818–828. [Google Scholar]
  10. Liu, J.; Ens, B.; Prouzeau, A.; Smiley, J.; Nixon, I.K.; Goodwin, S.; Dwyer, T. Datadancing: An exploration of the design space for visualisation view management for 3d surfaces and spaces. In Proceedings of the 2023 CHI Conference on Human Factors in Computing Systems, Hamburg, Germany, 23–28 April 2023; pp. 1–17. [Google Scholar]
  11. Satriadi, K.A.; Ens, B.; Cordeil, M.; Czauderna, T.; Jenny, B. Maps around me: 3d multiview layouts in immersive spaces. Proc. ACM Hum.-Comput. Interact. 2020, 4, 1–20. [Google Scholar] [CrossRef]
  12. Fouché, G.; Argelaguet Sanz, F.; Faure, E.; Kervrann, C. Timeline design space for immersive exploration of time-varying spatial 3d data. In Proceedings of the 28th ACM Symposium on Virtual Reality Software and Technology, Tsukuba, Japan, 29 November–1 December 2022; pp. 1–11. [Google Scholar]
  13. Ens, B.; Bach, B.; Cordeil, M.; Engelke, U.; Serrano, M.; Willett, W.; Prouzeau, A.; Anthes, C.; Büschel, W.; Dunne, C.; et al. Grand challenges in immersive analytics. In Proceedings of the 2021 CHI Conference on Human Factors in Computing Systems, Online, 8–13 May 2021; pp. 1–17. [Google Scholar]
  14. Garrido, D.; Jacob, J.; Silva, D.C. Performance Impact of Immersion and Collaboration in Visual Data Analysis. In Proceedings of the 2023 IEEE International Symposium on Mixed and Augmented Reality (ISMAR), Sydney, Australia, 16–20 October 2023; IEEE: Piscataway, NJ, USA, 2023; pp. 780–789. [Google Scholar]
  15. Billinghurst, M.; Cordeil, M.; Bezerianos, A.; Margolis, T. Collaborative Immersive Analytics. In Immersive Analytics; Springer: Cham, Switzerland, 2018; pp. 221–257. [Google Scholar]
  16. Lee, B.; Hu, X.; Cordeil, M.; Prouzeau, A.; Jenny, B.; Dwyer, T. Shared surfaces and spaces: Collaborative data visualisation in a co-located immersive environment. IEEE Trans. Vis. Comput. Graph. 2020, 27, 1171–1181. [Google Scholar] [CrossRef] [PubMed]
  17. González-Zúñiga, L.D.; O’Shaughnessy, P. Virtual Reality… in the Browser. In VR Developer Gems; CRC Press: Boca Raton, FL, USA, 2019; p. 101. [Google Scholar]
  18. Maclntyre, B.; Smith, T.F. Thoughts on the Future of WebXR and the Immersive Web. In Proceedings of the 2018 IEEE International Symposium on Mixed and Augmented Reality Adjunct (ISMAR-Adjunct), Munich, Germany, 16–20 October 2018; IEEE: Piscataway, NJ, USA, 2018; pp. 338–342. [Google Scholar]
  19. Rodríguez, F.C.; Dal Peraro, M.; Abriata, L.A. Democratizing interactive, immersive experiences for science education with WebXR. Nat. Comput. Sci. 2021, 1, 631–632. [Google Scholar] [CrossRef] [PubMed]
  20. Rivas Pagador, H.; Cabrero Barros, S.; Pacho Rodríguez, G.; Zorrilla, M. HiruXR: A Web library for Collaborative and Interactive Data Visualizations in XR and 2D. In Proceedings of the 2022 ACM International Conference on Interactive Media Experiences, Aveiro, Portugal, 22–24 June 2022; pp. 319–324. [Google Scholar]
  21. Butcher, P.; John, N.W.; Ritsos, P.D. Towards a framework for immersive analytics on the web. In Proceedings of the Posters of the IEEE Conference on Visualization (IEEE VIS 2018), Berlin, Germany, 21–26 October 2018; pp. 9–100. [Google Scholar]
  22. Fanini, B.; Demetrescu, E.; Bucciero, A.; Chirivi, A.; Giuri, F.; Ferrari, I.; Delbarba, N. Building blocks for multi-dimensional WebXR inspection tools targeting cultural heritage. In Proceedings of the International Conference on Extended Reality, Lecce, Italy, 6–8 July 2022; Springer: Cham, Switzerland, 2022; pp. 373–390. [Google Scholar]
  23. Salazar, M.; Louka, M.N. CoEditAR: A Framework for Collaborative Interaction in WebXR-enabled Spatial Computing. In Proceedings of the 28th International ACM Conference on 3D Web Technology, San Sebastian, Spain, 9–11 October 2023; pp. 1–2. [Google Scholar]
  24. Fanini, B.; Ferdani, D.; Demetrescu, E.; Berto, S.; d’Annibale, E. ATON: An open-source framework for creating immersive, collaborative and liquid web-apps for cultural heritage. Appl. Sci. 2021, 11, 11062. [Google Scholar] [CrossRef]
  25. Chacon, S.; Straub, B. Pro Git; Apress: New York, NY, USA, 2014. [Google Scholar]
  26. Zandstra, M. Version Control with Subversion. In PHP Objects, Patterns, and Practice; Apress: New York, NY, USA, 2010. [Google Scholar] [CrossRef]
  27. Kluyver, T.; Ragan-Kelley, B.; Pérez, F.; Granger, B.; Bussonnier, M.; Frederic, J.; Kelley, K.; Hamrick, J.; Grout, J.; Corlay, S.; et al. Jupyter Notebooks—A Publishing Format for Reproducible Computational Workflows. In Positioning and Power in Academic Publishing: Players, Agents and Agendas; Loizides, F., Schmidt, B., Eds.; IOS Press: Amsterdam, The Netherlands, 2016; pp. 87–90. [Google Scholar]
  28. Bisong, E. Google Colaboratory. In Building Machine Learning and Deep Learning Models on Google Cloud Platform; Apress: Berkeley, CA, USA, 2019. [Google Scholar] [CrossRef]
  29. Pedregosa, F.; Varoquaux, G.; Gramfort, A.; Michel, V.; Thirion, B.; Grisel, O.; Blondel, M.; Prettenhofer, P.; Weiss, R.; Dubourg, V.; et al. Scikit-learn: Machine Learning in Python. J. Mach. Learn. Res. 2011, 12, 2825–2830. [Google Scholar]
  30. Abadi, M.; Agarwal, A.; Barham, P.; Brevdo, E.; Chen, Z.; Citro, C.; Corrado, G.S.; Davis, A.; Dean, J.; Devin, M.; et al. TensorFlow: Large-Scale Machine Learning on Heterogeneous Systems. 2015. Available online: https://tensorflow.org (accessed on 22 April 2024).
  31. Paszke, A.; Gross, S.; Chintala, S.; Chanan, G.; Yang, E.; DeVito, Z.; Lin, Z.; Desmaison, A.; Antiga, L.; Lerer, A. Automatic differentiation in PyTorch. In Proceedings of the NIPS-W, Long Beach, CA, USA, 9 December 2017. [Google Scholar]
  32. Rosenblatt, M. Remarks on Some Nonparametric Estimates of a Density Function. Ann. Math. Stat. 1956, 27, 832–837. [Google Scholar] [CrossRef]
  33. Parzen, E. On Estimation of a Probability Density Function and Mode. Ann. Math. Stat. 1962, 33, 1065–1076. [Google Scholar] [CrossRef]
  34. Nielsen, F. Introduction to HPC with MPI for Data Science; Springer: Cham, Switzerland, 2016. [Google Scholar]
  35. Freeman, L.; Freeman, S.; Michaelson, A. On human social intelligence. J. Soc. Biol. Syst. 1988, 11, 415–425. [Google Scholar] [CrossRef]
  36. Wei, D.; Jiang, Q.; Wei, Y.; Wang, S. A novel hierarchical clustering algorithm for gene sequences. BMC Bioinform. 2012, 13, 174. [Google Scholar] [CrossRef] [PubMed]
  37. Chapman, P.; Clinton, J.; Kerber, R.; Khabaza, T.; Reinartz, T.; Shearer, C.; Wirth, R. CRISP-DM 1.0: Step-by-Step Data Mining Guide: SPSS, USA. 2000. Available online: https://www.kde.cs.uni-kassel.de/lehre/ws2012-13/kdd/files/CRISPWP-0800.pdf (accessed on 23 April 2024).
  38. Martinez-Plumed, F.; Contreras-Ochando, L.; Ferri, C.; Hernandez-Orallo, J.; Kull, M.; Lachiche, N.; Ramirez-Quintana, M.J.; Flach, P. CRISP-DM Twenty Years Later: From Data Mining Processes to Data Science Trajectories. IEEE Trans. Knowl. Data Eng. 2021, 33, 3048–3061. [Google Scholar] [CrossRef]
  39. Bucchiarone, A.; Dragoni, N.; Dustdar, S.; Lago, P.; Mazzara, M.; Rivera, V.; Sadovykh, A. Microservices. In Science and Engineering; Springer: Cham, Switzerland, 2020. [Google Scholar]
  40. Rodríguez, C.; Baez, M.; Daniel, F.; Casati, F.; Trabucco, J.C.; Canali, L.; Percannella, G. REST APIs: A large-scale analysis of compliance with principles and best practices. In Proceedings of the Web Engineering: 16th International Conference, ICWE 2016, Lugano, Switzerland, 6–9 June 2016; Proceedings 16. Springer: Cham, Switzerland, 2016; pp. 21–39. [Google Scholar]
  41. Subramanian, H.; Raj, P. Hands-On RESTful API Design Patterns and Best Practices: Design, Develop, and Deploy Highly Adaptable, Scalable, and Secure RESTful Web APIs; Packt Publishing Ltd.: Birmingham, UK, 2019. [Google Scholar]
  42. Doglio, F.; Doglio; Corrigan. REST API Development with Node. js; Springer: Berkeley, CA, USA, 2018; Volume 331. [Google Scholar]
  43. Tzavaras, A.; Mainas, N.; Petrakis, E.G. OpenAPI framework for the Web of Things. Internet Things 2023, 21, 100675. [Google Scholar] [CrossRef]
  44. Virtanen, P.; Gommers, R.; Oliphant, T.E.; Haberland, M.; Reddy, T.; Cournapeau, D.; Burovski, E.; Peterson, P.; Weckesser, W.; Bright, J.; et al. SciPy 1.0: Fundamental Algorithms for Scientific Computing in Python. Nat. Methods 2020, 17, 261–272. [Google Scholar] [CrossRef]
  45. Bar-Joseph, Z.; Gifford, D.K.; Jaakkola, T.S. Fast optimal leaf ordering for hierarchical clustering. Bioinformatics 2001, 17, S22–S29. [Google Scholar] [CrossRef]
  46. Lance, G.N.; Williams, W.T. A General Theory of Classificatory Sorting Strategies: 1. Hierarchical Systems. Comput. J. 1967, 9, 373–380. [Google Scholar] [CrossRef]
  47. Tandel, S.; Jamadar, A. Impact of progressive web apps on web app development. Int. J. Innov. Res. Sci. Eng. Technol. 2018, 7, 9439–9444. [Google Scholar]
  48. Stein, C.; Limper, M.; Kuijper, A. Spatial data structures for accelerated 3D visibility computation to enable large model visualization on the web. In Proceedings of the 19th International ACM Conference on 3D Web Technologies, Vancouver, BC, Canada, 8–10 August 2014; pp. 53–61. [Google Scholar]
  49. Upenik, E.; Ebrahimi, T. A simple method to obtain visual attention data in head mounted virtual reality. In Proceedings of the 2017 IEEE International Conference on Multimedia & Expo Workshops (ICMEW), Hong Kong, China, 10–14 July 2017; IEEE: Piscataway, NJ, USA, 2017; pp. 73–78. [Google Scholar]
  50. Boletsis, C. The new era of virtual reality locomotion: A systematic literature review of techniques and a proposed typology. Multimodal Technol. Interact. 2017, 1, 24. [Google Scholar] [CrossRef]
  51. Scott, D.W. Multivariate Density Estimation; Wiley: Hoboken, NJ, USA, 2015. [Google Scholar] [CrossRef]
  52. Ceccarelli, S.; Cesta, A.; Cortellessa, G.; De Benedictis, R.; Fracasso, F.; Leopardi, L.; Ligios, L.; Lombardi, E.; Malatesta, S.G.; Oddi, A.; et al. Artificial Intelligence Algorithms for the Analysis of User Experience in Palazzo Braschi Museum. In Proceedings of the GCH 2023—Eurographics Workshop on Graphics and Cultural Heritage, Lecce, Italy, 4–6 September 2023. [Google Scholar]
  53. Fanini, B.; Cinque, L. Encoding immersive sessions for online, interactive VR analytics. Virtual Real. 2020, 24, 423–438. [Google Scholar] [CrossRef]
  54. Fanini, B.; Cinque, L. Encoding, exchange and manipulation of captured Immersive VR sessions for learning environments: The PRISMIN framework. Appl. Sci. 2020, 10, 2026. [Google Scholar] [CrossRef]
Figure 1. Process block schema. Remote capture data are composed of a group variable and a session variable. The group variable may identify a scene or an experimental treatment. The record variable may identify specific user sessions or sensor acquisitions that belong to the group. We refer to the data acquired with the capture block as raw data. These data are filtered through a sequence of direct inspections and gating procedures; thus, they become processed data. Finally, we implement machine learning and eventually AI methods to generate aggregate data and extract insights.
Futureinternet 16 00147 g001
Figure 2. Processing and analysis step. (A) Screenshot of the raw data inspection web application developed with Voila and Jupyter. (B) Gating graph, showing the generated scatter plot and the marginal histograms, with the threshold values used to gate the outliers. (C,D) The 3D and 2D density functions, respectively, estimated with KDE. (E) Dendrogram produced with an agglomeration clustering model.
Futureinternet 16 00147 g002
Figure 3. (A) File system structure enabling asynchronous capture block service and process block service. (B) Branching of processed and analyzed data versions due to collaborating analysts.
Futureinternet 16 00147 g003
Figure 4. Sample inspection in the Web3D tool “Merkhet”. Top row: loading of 3 different records (users’ sessions on single 3D object, three different colors) from hub via user interface; bottom row: time slider on active record.
Futureinternet 16 00147 g004
Figure 5. (A) Loading of sample 3D KDE computed from users’ camera locations; (B) 6DoF inspection of KDE data via immersive VR device; (C) AR inspection of user session through smartphone device; (D) collaborative inspection together with another remote analyst of the same record through mixed reality (Meta Quest passthrough). Bottom row: adding persistent bookmarks for analysts’ observation of specific moments and records.
Futureinternet 16 00147 g005
Figure 6. Setup: main servers in Rome hosting 3D services and analytics hub (blue), TourismA exhibit (red) and ArcheoVirtual exhibit (green).
Futureinternet 16 00147 g006
Figure 7. The two generative tales: “The Two Houses” (left) and “The Floating Village” (right), with welcome popups introducing the story (top) while a voice narrates the immersive panoramic content (using a HMD).
Futureinternet 16 00147 g007
Figure 8. Data records and aggregates from ArcheoVirtual (left) and TourismA (right). (A) Re-projected view trajectories into the panoramic space; (B) analyst using VR headset to inspect a TourismA session, with a bookmark created by another analyst; (CF) per-session locally computed fixations and immersive inspection (F); (G,H) server-side computed KDE for view directions.
Futureinternet 16 00147 g008
Figure 9. Agglomerative clustering of “The Two Houses” users’ view trajectories from ArcheoVirtual. View trajectories are sequences of users’ V recorded with a 0.2 s sample time. (A) shows the two view trajectories with the highest correlation (best match) in the spherical coordinates ϕ and θ ; we assumed r to be constant. (B) shows the two trajectories with the lowest correlation (poorest match). The color of the markers indicates the density value estimated by the KDE on the single trajectory at this point, and it allows us to visualize how much time the user spent observing this area. (C) Agglomerative clustering dendrogram, obtained using d ( x , y ) = 1 c o r r ( x , y ) as a metric (where c o r r ( x , y ) is the Pearson correlation between the KDE of two trajectories), and the complete linking condition. The y-axis is the WCD, the linking condition value at which the clusters merge. We obtained four clusters by stopping the agglomerative clustering at the WCD = 0.98 . To the right of the dendrogram, we present the Pearson correlation matrix between all view trajectory KDE couples. Bottom row: inspection of KDE clusters C0 and C2.
Futureinternet 16 00147 g009
Figure 10. (1) The art gallery scene; (2) a comparison of three different sessions from the Paestum event with zig-zag patterns and trajectory knots; (3) an immersive inspection of the KDE computed on users’ locations; (4) an inspection of a complex record annotated by analysts and focal fixations; (5) remote analysts discussing fixations with synchronized time.
Futureinternet 16 00147 g010
Figure 11. Agglomerative clustering of generative art gallery users’ trajectories. Trajectories are sequences of users’ positions P recorded with a 0.2 s sample time. (A) shows the two trajectories with the highest correlation (best match). (B) shows the two trajectories with the lowest correlation (poorest match). The color of the marker indicates the density value estimated by the KDE on the single trajectory at this point, and it allows us to visualize how much time the user spent in this area. (C) Agglomerative clustering dendrogram, obtained using d ( x , y ) = 1 c o r r ( x , y ) as a metric (where c o r r ( x , y ) is the Pearson correlation between the KDEs of two trajectories), and the complete linking condition. The y-axis is the WCD, the linking condition value at which the clusters merge. We obtained seven clusters by stopping the agglomerative clustering at the WCD = 0.87 . To the right of the dendrogram, we present the Pearson correlation matrix between all trajectory KDE couples. (D) The user trajectories are divided into seven clusters labeled from 1 to 7. The last column shows the 2D KDE obtained from the agglomeration of the trajectories in each cluster.
Futureinternet 16 00147 g011
Figure 12. (A) KDE for positions from all ArcheoVirtual sessions; (B) KDE for positions from all TourismA sessions; (C) arrangement of semantic annotations with narrating voices (blue); (D) KDE on focal points from TourismA; (E) multiple online analysts start to discuss different processed records from TourismA.
Futureinternet 16 00147 g012
Figure 13. (A) Two generative 3D items; (B) sample AR presentation during TourismA exhibit on the table; (C) inspection of a session captured on one object; (D) AR inspection through a smartphone; (E) inspection of KDE for users’ motions in the physical space; (FH) mixed reality inspection through Meta Quest PRO with a remote analyst.
Futureinternet 16 00147 g013
Disclaimer/Publisher’s Note: The statements, opinions and data contained in all publications are solely those of the individual author(s) and contributor(s) and not of MDPI and/or the editor(s). MDPI and/or the editor(s) disclaim responsibility for any injury to people or property resulting from any ideas, methods, instructions or products referred to in the content.

