Article

iNUIT: Internet of Things for Urban Innovation

1
HumanTech Institute, University of Applied Sciences and Arts Western Switzerland, Fribourg 1705, Switzerland
2
Haute Ecole Arc Ing., University of Applied Sciences and Arts Western Switzerland, Neuchâtel 2000, Switzerland
3
Institute for Information and Communication Technologies, Haute Ecole d’Ingénierie et de Gestion du Canton de Vaud, University of Applied Sciences and Arts Western Switzerland, Yverdon-les-Bains 1401, Switzerland
*
Author to whom correspondence should be addressed.
Future Internet 2016, 8(2), 18; https://doi.org/10.3390/fi8020018
Submission received: 13 March 2016 / Revised: 21 April 2016 / Accepted: 3 May 2016 / Published: 11 May 2016
(This article belongs to the Special Issue Ecosystemic Evolution Feeded by Smart Systems)

Abstract

:
Internet of Things (IoT) seems a viable way to enable the Smart Cities of the future. iNUIT (Internet of Things for Urban Innovation) is a multi-year research program that aims to create an ecosystem that exploits the variety of data coming from multiple sensors and connected objects installed on the scale of a city, in order to meet specific needs in terms of development of new services (physical security, resource management, etc.). Among the multiple research activities within iNUIT, we present two projects: SmartCrowd and OpEc. SmartCrowd aims at monitoring the crowd’s movement during large events. It focuses on real-time tracking using sensors available in smartphones and on the use of a crowd simulator to detect possible dangerous scenarios. A proof-of-concept of the application has been tested at the Paléo Festival (Switzerland) showing the feasibility of the approach. OpEc (Optimisation de l’Eclairage public) aims at using IoT to implement dynamic street light management and control with the goal of reducing street light energy consumption while guaranteeing the same level of security of traditional illumination. The system has been tested during two months in a street in St-Imier (Switzerland) without interruption, validating its stability and resulting in an overall energy saving of about 56%.

Graphical Abstract

1. Introduction

According to current forecasts [1], in 2050 about 86% of the European population will live in cities. This increase is a major challenge for our society that will require the development of new infrastructures and the reorganization of the urban space of tomorrow. However, the overlap between the physical territory and the digital networks along with the development of new technologies may be used to create a smart living space, cooperative, dynamic, connected and interactive, that will have an increasing impact on the economy. For instance, such an ecosystem will allow small and medium size enterprises, which usually have limited resources and skills, to create collaborative networked organizations in order to surmount their limitations through collaboration. The enormous quantity of data that will be created by this environment can be used to develop new services for the welfare and needs of its citizens with a transparent and secure access to information.
These “Smart Cities” will have to deal with issues such as the optimization of mobility, physical security, resources and waste management and urban development. As modern cities are extremely rich and complex environments, we also turned our attention towards major events (festivals, political summits, sport events, etc.). They offer an ideal occasion for research as they have the same features as cities but they are easier to observe since they are limited in time and space. The organization and management of big events creates many challenges that can appear as antagonists: maximizing the pleasure of the audience while ensuring the security of the event; maximizing the number of participants while providing a smooth and quick access.
Among the many issues, two areas can be considered as critical topics to manage: physical security and mobility. Physical security will probably be the major issue of our cities of the future: no activity can be developed if the security of its inhabitants is not assured. To be successful, major events must guarantee the safety of its participants through the organization of various aspects of security such as crowd management, management of panic situation, monitoring abnormal behaviors, etc.
Considering mobility, nowadays mobility’s needs show steady growth in cities and they must be managed in terms of infrastructure and resources. When organizing a public event, proper management of the infrastructures is essential; in fact, the transportation of people and materials needs to be as quick and fluid as possible. This requires the optimization of the event topography, the distribution of relevant information in the right place for the participants, the geolocation of vehicles, intelligent parking management, etc.
The issues mentioned above concerning safety and mobility raise new challenges and require the development of systems easily accessible, reliable, adaptive, and that preserve privacy. The first requirement to achieve this goal is to guarantee access to sources of rich, multimedia information that can be processed and interpreted to enable reliable decision-making in real-time. The Internet of Things (IoT) is an emerging paradigm that aims to provide reliable access to heterogeneous and distributed data and may represent a good solution for the smart cities of the future. However, this new paradigm raises a number of scientific and technological challenges related to security and data protection that must be addressed comprehensively. In addition, a number of supplementary issues must be faced, such as the integration of heterogeneous data, the processing of large amounts of data, the reliability of data and of the data processing system, and the realization of an intelligent knowledge process extraction.
In this article, we present the Internet of Things for Urban Innovation (iNUIT) program. The goal of this program is to develop, through various projects, the technological “backbone” of this new urban space to improve citizens’ quality of life using a multidisciplinary approach and, in particular, developing an “ecosystem” able to integrate multiple technologies, concepts and work methodologies, such as IoT, cloud computing, ubiquitous and mobile computing, decision-support systems, etc.
The main idea of the program is to create an ecosystem that exploits the variety of data coming from multiple sensors and connected objects installed or that will be installed on the scale of a city, in order to meet specific needs in terms of development of new services in fields such as physical security, mobility, resource management and recreation (tourism, culture, etc.). The vision of the program is described in Figure 1.
In summary, the iNUIT ecosystem aims to:
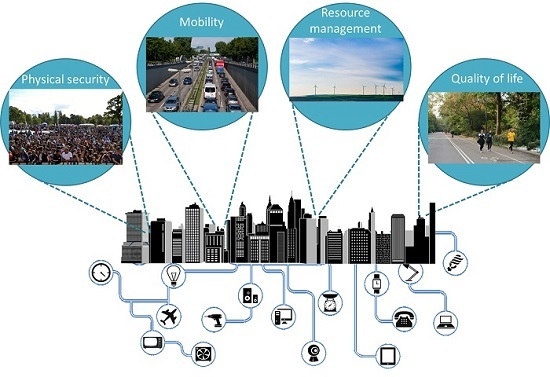
  • Provide citizens with services allowing the interaction with the urban environment and the interaction with their fellow citizens. Such a system could help citizens to receive the right information at the right time (e.g., to avoid traffic congestion), to provide relevant information to other citizens (e.g., in crisis situations), etc.
  • Support the politicians through the development of methods and tools for decision-support to optimize the management of resources and waste, to improve citizen physical security, and take into account requirements of people with specific needs (e.g., older adults, disabilities), etc.
  • Support service suppliers (such as the organizers of sport or cultural events) providing to them new ways to provide and assure their services (e.g., to better manage the flow of crowds, the traffic, and increase safety of the event).
In order to achieve these goals, iNUIT uses technologies related to IoT in specific and concrete application cases relevant for urban areas. The applications considered are distributed and involve several components (e.g., processors, sensors, actuators, computers, etc.) connected in networks. The iNUIT program treats the whole integration chain: acquisition, communication, processing, intelligent data analysis and presentation of results. However, scientific and technological challenges are found in all elements of this chain:
  • In terms of data collection, the system should be able to support the diversity of data and the large number of “objects” to integrate: sensors, cameras, mobile phones, actuators, etc. The main challenge is to manage a large number of heterogeneous sensors and standardize their use to extract reliably useful data.
  • The network infrastructure should consist of wireless objects that compose a self-organizing network able to convey data between the sensors and the processing infrastructure. The network infrastructure should be as generic as possible to take into account the heterogeneity of data as described in the previous point. In addition, the security of this infrastructure is critical given the confidentiality of the involved information. Finally, the infrastructure should implement complex features such as autonomous reconfiguration of the network while minimizing energy consumption.
  • The massive data collection made possible by IoT raises many challenges on how to integrate, synchronize, process and recover this heterogeneous data. To do this, it is important to adopt or develop new methods for modeling these “Big Data”, new techniques of information retrieval to extract meaningful information as well as new machine learning algorithms to classify data.
Finally, given that the IoT paradigm imply collecting information from objects used in everyday life, data security and protection of privacy is of paramount importance and should be treated at all levels: from the data acquisition and the communication to the their processing that should integrate privacy preserving techniques.
Given the magnitude of the iNUIT extent, in this article, after an overview about the program’s architecture, we will focus on two particular projects developed within the iNUIT vision to test the proposed architecture. The first project, called SmartCrowd, aims at monitoring the crowd’s movements during large events. It focuses on the real-time tracking using GPS sensors available in smartphones and on the use of a crowd simulator to take into account topographic information to detect possible dangerous scenarios. The second project is called OpEc, which stands for “Optmisation de l’Eclairage public”, the French title of the project that means “Optimization of Street Lighting”. This project contributes to the resource management part of the iNUIT vision. The main objective of the project is to use IoT to implement dynamic street light management with the final goal of reducing street light energy consumption while assuring the same level of security of traditional illumination.

2. iNUIT Architecture

In Figure 1, we described the vision behind the iNUIT program in which different kinds of services (e.g., physical security, mobility, resource management, etc.) relay on a bottom layer of connected objects (e.g., sensors, actuators, etc.). A more complete vision of the iNUIT architecture is provided in Figure 2.
The iNUIT program is structured in five layers. Security and privacy approaches are envisaged for each layer. The first layer (bottom) is the sensor layer. It contains the heterogeneous connected objects that collect and transmit data in real-time. Some of these objects may be “smarter” then others permitting the first data processing step and working as interface with the users. The chosen sensors should allow a secure and reliable data acquisition to respect security and privacy constraints (for instance, anonymizing the sent data). The network represents the second layer. It is composed of technologies and protocols that allow the transmission of the different types of data from the sensors to the cloud layer. As well as the sensors, the hardware required for the network is also distributed in the environment and therefore should have features to guarantee low electric consumption and a secure and reliable data transmission. The Cloud layer aims to make the iNUIT architecture as generic, open and flexible as possible. The “client” that will install the iNUIT system across a city (or for a particular event) should not worry about the IT infrastructure that will support the different processes (acquisition of equipment, maintenance, logistics, etc.). In this context, we opted to adopt a cloud solution, which supports treatment, data analysis and representation of results. Above the cloud layer, there is the layer in which are grouped the systems and algorithms that manage the data analysis (classification, knowledge extraction, etc.) and storage. Big data techniques should be used to take into account the large volume of data and their heterogeneity. In order to respect the users’ privacy, these algorithms should be based on privacy preserving techniques (i.e., techniques that do not allow the identification of a user form the available data). Finally, on the top of the pile, there is the services and applications layer that actually provides the services to the user. This layer covers also the role of interface towards the user; therefore, it should help to build the trust towards the system providing to the user the control of privacy settings (e.g., which information to share with the system and other users). Each layers of the iNUIT architecture is composed of several modules that implement the different functionalities required to provide the different services on the top layer. Figure 3 shows a more detailed view of the iNUIT architecture in which it is possible to see the modules that we implemented to develop the two projects presented in this paper: SmartCrowd and OpEc.
It is worth noting that the iNUIT architecture permits the implementation of very different systems to provide different services. While the Cloud layer is the core of the system flexibility, also other modules may offer functionalities that may be used by different applications. Section 4 and Section 5 describe with more detail the structure of SmartCrowd and OpEc.

3. Related Works

What is a Smart City? The concept of Smart City is quite broad. Several definitions exist. Branchi et al. [2] studied several definitions and provided a more comprehensive formulation defining a Smart City as: “A space for coexistence among people who, based on the available technologies, can thrive and develop, while taking into account economic, social and environmental sustainability”. From this definition, it appears that the two essential elements that constitute a Smart City are “people” and “technology”. A city cannot be detached from its citizens. They are the main actors that produce and consume all the services of the city and they are also part of the institutional factors (e.g., governance, policy, etc.) that should guarantee the smart growth of the community. While the citizens contribute to make the city “smart” providing these institutional and human dimensions, often the forefront role is attributed to the technology dimension and the use of “Smart Computing technologies” [3,4]. In this work, we focused more on this technological aspect.
Smart Computing Technologies are defined by Forrester [5] as “A new generation of integrated hardware, software, and network technologies that provide IT systems with real-time awareness of the real world and advanced analytics to help people make more intelligent decisions about alternatives and actions that will optimize business processes and business balance sheet results.” In the Internet of Things (IoT) paradigm, many of the objects that we use daily and that surround us are connected to each other and the information and communication systems are invisibly integrated in the environment [6]. In many works, the IoT paradigm has been chosen as the ideal candidate for the implementation of the smart computing technologies needed to take into account, transparently and seamlessly, a large number of heterogeneous systems and, therefore, enabling Smart Cities. For instance, Zannella et al. [7] focused their analysis on Urban IoTs (i.e., IoT designed to support the Smart City vision) and presented the technical solutions and best-practice guidelines used in the Padova Smart City project, in which they demonstrated its feasibility in the city of Padova, Italy. Other works have highlighted the open challenges of using IoT for Smart Cities proposing different approach or model such as hub-centric approach to the IoT [8], or a cognitive management framework for IoT (in which “cognitive” represents “the ability to dynamically select behavior through self-management, taking into account information and knowledge on the context of operation as well as policies”) [9].
Similar to what was presented in the previous works, iNUIT proposes an approach based on the IoT to enable Smart Cities. iNUIT has the main goal of establishing the technological backbone for the future Smart Cities tackling concrete problems concerning its implementations: from the heterogeneous nature of the collected data to the protection of citizens’ privacy. In order to do that, we attacked the problem from two different directions proposing two proof-of-concepts for two well-defined application scenarios: improving “physical security and mobility” during large events and “resource management” and, in particular, smart public illumination.
The SmartCrowd project concretizes the first direction. The goal of this project is to detect groups and dangerous situations during large events by monitoring the crowd’s movement. We focused on the GPS data collected through an application running on the participants’ smartphones. Since a city cannot be detached from its citizens, the idea is to change the citizens’ role from passive service consumers to active and interactive actors in which they voluntarily share their information (e.g., location) in order to get new valuable services (e.g., increased safety).
The OpEc project concretizes the second direction. The goal of this project is to implement dynamic street light management using an IoT-based approach. Obviously, in this case, the citizens have a more passive role than in the previous project. Given that the goal is to manage more efficiently street lighting without reducing the safety, from the citizen point of view, the effects of the application should be as invisible as possible.

3.1. Crowd Monitoring

Large events may be seen as a “concentrate of urbanity”. The number of participants at top world events can reach more than a million people and issues such as mobility and physical security are of paramount importance to guarantee the success of the event and to avoid serious problems. Planning the pedestrian flows and capacity plays a key role to prevent major troubles. Various techniques of estimation are used to plan pedestrian flows and capacities [10]. The required level of security can be achieved combining a precise study of the arrangement of the natural and artificial physical features of the event (i.e., the topography of the event), for instance using a simulator, and real-time monitoring of the crowd [11].
Common sense suggests that the first rule should be to avoid as much as possible architectural barriers on the event site (such as obstacles, bottlenecks, hairpin turn, etc.), with particular attention to the emergency routes. Crowd simulators may help to detect flows in the topography of the event otherwise difficult to notice. Many types of simulators exist. Depending on the level of the detail that they take into account, simulators may be based on three different modeling approaches: microscopic, mesoscopic, and macroscopic. Macroscopic and mesoscopic approaches remove certain complexities from the equation to lower computational costs and speed up computations. On the contrary, microscopic approaches try to provide a very detailed simulation to the individuals’ behavior and, even, psychological phenomena that may link each other.
An example of a macroscopic crowd simulator is represented by the use of the cellular automaton approach [12]. A cellular automaton represents the scene using a grid of cells that can be either occupied by one individual or they can be empty. Burstedde et al. [12] used this approach by defining a “static” floor field to direct the general movement towards an area of the grid and a “dynamic” floor field left by the pedestrians. The dynamic field was used to simulate the “herding” phenomenon [13] in which, during evacuation situations, individuals follow others individuals before them. They found that this type of simulation can recreate real pedestrian’s behavior but the grid overlay may generate lockups. Due to the abstraction and restriction of movement to a grid, the computational load is low.
Example of the mesoscopic approach may be found in the works of Helbing et al. Helbing used “hydrodynamics” to describe the crowd’s movement [14]. Then, in later work, he investigated social forces as a modeling approach for pedestrian crowd simulation and its use in normal and evacuation situations [15,16]. Essentially, considering social forces means taking into account that all individuals want to reach their destination as comfortable as possible and other social factors such as: the individuals’ preference to keep a certain distance from one another (e.g., to avoid collision but also to respect the private sphere), the friends preference to move as a group, etc. Another interesting mesoscopic approach is described by the work of Narain et al. [17]. They presented a hybrid system consisting of a single-agent and fluid dynamics. In their algorithm, they overlaid a grid on the simulation scene and they used a crowd flow mechanism (called “unilateral incompressibility constraint”) that calculated the flow in the grid modeling the crowd as a combination of compressible and incompressible fluid. Solving the flow for all cells of the grid provided a flow field that was used to model the velocity vector of the agents in the direction allowed by the system. This approach permitted to avoid collisions and to make the individual agents respect a minimal distance from each other. This simulation approach proved to be very performing, running a simulation with one million agents at three frames per second on an Intel Core i7 standard home computer.
Finally, using the microscopic modeling approach is possible to achieve very detailed simulation. An example is the simulator ESCAPES (Evacuation Simulation with Children, Authorities, Parents, Emotions, and Social comparison) [18]. ESCAPES was developed to simulate evacuation scenarios within buildings combining multi-agent approach (i.e., individuals, families and authorities) while considering several psychological phenomena (e.g., fear, knowledge/certitude about occurred events, etc.). This allowed the simulation of complicated behaviors, such as: families tend to gather all family members before looking for an exit; authority agents do not exit until all the other people (families and individuals) left. They also considered that only a part of the people involved (typically, the authority agents) might be immediately aware of the danger and hold all the knowledge about the surroundings. The others may learn (and forget) facts about the environment. Finally, as knowledge, also other feelings like fear may be transmitted among people. Due to the complex nature of the model, the ESCAPES simulator allowed only a limited number of agents.
To summarize, among the several systems, a multi-agent system (microscopic approach) would probably provide the most realistic approach for crowd simulation. The more macroscopic approaches (e.g., based on fluid-dynamics paradigm) do not consider the different nuances of which a crowd of different people is composed. However, they allow the detection of potential bottlenecks or other architectural barriers and they may be usable to simulate events with a much larger number of participants with a lower computational cost. Therefore, the choice of the simulation approach should be considered depending on the aimed goal. In this work, we used the Jülich Pedestrian Simulator (JuPedSim) [19] an open framework for simulating and analyzing pedestrians’ motion at a microscopic level. It allows the modeling of events (e.g., doors that open or close), the transmission of knowledge among the agents, and the measurement of the simulation in terms of density, velocity, etc. In terms, of adopted model, JuPedSim makes available two options: the Generalized Centrifugal Force Model (GCFM) and the Gompertz model. GCFM is a spatially continuous force-based model to simulate pedestrian dynamics, which includes an elliptical volume exclusion of pedestrians [20]. The Gompertz model is based on a continuous physical force and it may simulate social as well as physical forces in a continuous way [19]. The second approach is much more expensive in terms of processing requirements.
We extended the JuPedSim simulator to integrate a module to easily provide the topography of an event to the simulator and to calculate other parameters from the simulation able to indicate dangerous situations. In particular, we looked for the estimation of the crowd pressure, as defined by Helbing et al. [10]. Crowd pressure depends in local density and local speed and it takes into account the main differences among fluid dynamics and human behavior. For instance, people instead of filling all the available area tends to overcrowd some areas while leaving empty others areas.
Crowd pressure is an aspect to consider also when dealing with real-time crowd monitoring. SmartCrowd aimed to automatically detect dangerous situation (e.g., too high crowd pressure) as well as recognize groups within a crowd. Real-time crowd monitoring is usually performed using vision-based techniques. In fact, cameras provide a reliable and constant flow of video that may be analyzed by security agents or by computer-vision approaches that can assist security agents. Vision-based monitoring has several advantages such the independence (i.e., it does not rely on the collaboration of the crowd) and the real-time feedback. However, it has also some important drawbacks: it depends on environmental conditions (e.g., good lighting is essential to have a clear vision of the crowd), it should consider occlusion and it suffer from poor scalability (larger spaces require a larger number of cameras and more resources to monitoring the videos [11,21]). In order to overcome these limitations, other technologies can be used to achieve real-rime crowd monitoring. With the approaching of IoT and the universalization of smartphones, new possibilities are provided by their communication properties and the use of sensors embedded in smartphones. This technology allows two different approaches to monitor crowd in real-time: in-network and on-device. In-network approaches use call data records to track the user’s position by locating the cell tower who logged the phone call or message. The accuracy is about 300 m and it depends in whether the user uses the phone for activities like making a call or sending an SMS [22]. On-device approaches use the GPS sensor on the smartphone and the Wi-Fi/GSM-fingerprinting [23]. The accuracy can go up to 5 m for the GPS and around 20 m for the Wi-Fi-based technique. Along the greater precision, another advantage of the on-device method is the capability of recording data on selected, periodic basis. In addition, it permits the collection of additional information such as speed, direction and, if required, data captured by accelerometers and gyroscope. Another method that relies on the use of smartphones involves the use of Bluetooth beacons distributed in the events environment to track users positions [24]. This method provides good performance in term of precision of the localization but as well as the camera-based approach it is limited to the availability and diffusion of beacons on the area of the event.
Some studies already presented some results of crowd-monitor using smartphones-based techniques. Wirz et al. monitored the crowd movements during the Lord Mayors Show 2011 in London [25] using participants’ smartphones. They were able to calculate the density of the crowd even if only a limited number of attendees (828 of around half a billion spectators) shared their location. Comparing their results with ground truth information obtained from video cameras used by the authorities, they were able to confirm their assumption that that walking speed is affected directly by the crowd density. A second study was made during the Züri Fäscht 2013 [26] in which around 28,000 people contributed. The authors then used the collected data to visualize information such as crowd density, crowd flow, and mobility and shared the best practices to acquire as many contributing users as possible for this kind of events.
However, the use of smartphones for real-time crowd monitoring has some challenges to face. First, it requires the active participation of the user: the installation of a specific application, the consent to share location information, etc. This is a veritable paradigm shift. Participants are no more mere service consumers. They become active actors that voluntarily and interactively contribute to the event, share their information with the organizers and, therefore, expect new high value-added services. Second, it suffers of some technological limitations such as batteries duration and the availability of an Internet connection. This second group of limitations can be overcome loosening the real-time constraint, for instance, reducing the frequency with which the smartphone shares the location.
Concerning the recognition of groups within a crowd many approaches exist. Being able to identify groups within the crowd may result very helpful to propose evacuation solutions according to nearest exits and to the social forces that relate people (for instance, avoiding imparting commands that may separate family and friends). This may prove to be advantageous also in terms of communications. If a given alert reach one member of a group it is probable that the information will be quickly shared. People tend to attend events in small groups rather than coming alone [27]. Ruback et al. [28] showed that people are likely to attend sport events in groups and they provided an overview of related works reporting that between 70% and 90% of all people present during an event came with the company of at least another person. Similar statistics are found also in other type of event or, more simply, in people walking in commercial street [29]. McPhail et al. [30] provided a formal definition of group in terms of proximity, direction and speed. However, it is possible to use people’s location data within machine learning and clustering algorithms in order to automatically detect groups that may vary in number and size. El Mallah et al. [31] compared several density-based cluster algorithms in terms of accuracy and computational efficiency on a simulated database. They achieved the best result using the DBSCAN algorithm [32].
In summary, many ways to detect dangerous situations during large event exist, going from the use of simulators to the use of machine learning techniques for the real-time monitoring of the crowd. The SmartCrowd projects aims to show the possibility provided for the crowd management using an approach going in the direction of IoT. In particular, we focused our work, in the detection of dangerous situations using sensors on the smartphone, for the real-time monitoring, and a crowd simulator to detect obstacles or architectural barriers that may be present in the event location. In this article, we extend the work of El Mallah et al. [31] presenting the structure of iNUIT, the IoT-oriented framework that contains SmartCrowd and the first results achieved with the use of SmartCrowd during the Paleo Festival Nyon 2015.

3.2. OpEc–Dynamic Street Light Control

Street lighting is an essential service provided by municipalities and communities to assure the citizens and goods in public spaces. However, this essential service has non-negligible economic cost economic and also a certain ecological footprint. Regarding the economic cost of street lightening, the European cities are spending up to 60% of their electricity budget to assure this service [33]. Therefore, mastering the energy consumption of street lights is becoming an important priority for European municipalities. Leveraging Information and Communication Technologies (ICT) in managing street lights has been identified as a serious and promising approach. Dynamic street lighting (DSL) refers to allowing the adjustment of the light intensity level to a real and measured need. Different research papers on DSL have been published [34,35,36]. Most of the solution proposed in previous works are based on a sensor network to sense relevant ambient-related indicators like luminosity and visibility, which permits the estimation of the need for lighting intensity. Further, other previous works include presence detectors as additional sensors with the objective to consider pedestrian and road traffic activities as complementary cue for the estimation of lighting needs. Further concepts involving the citizens as main stakeholder providing feedback on lighting quality have been also proposed [37].
As for the control of light intensity, the light-emitting diode (LED) technology has allowed the conception and the implementation of numerous light control and dimming solutions. The most known technologies for dimming solutions are (1) DALI (Digital Addressable Lighting Interface), which is a protocol that permits dynamic control of luminaires; (2) “0–10 V” which is an electronic lighting control signaling system where the control signal is a Direct Current (DC) voltage that takes values between zero and ten volts. Our project takes advantage of these evolutions.
The main objective of the project is to use IoT concepts in order to implement dynamic street light management with the final goal to reduce street light energy consumption while assuring the same level of security.

4. SmartCrowd

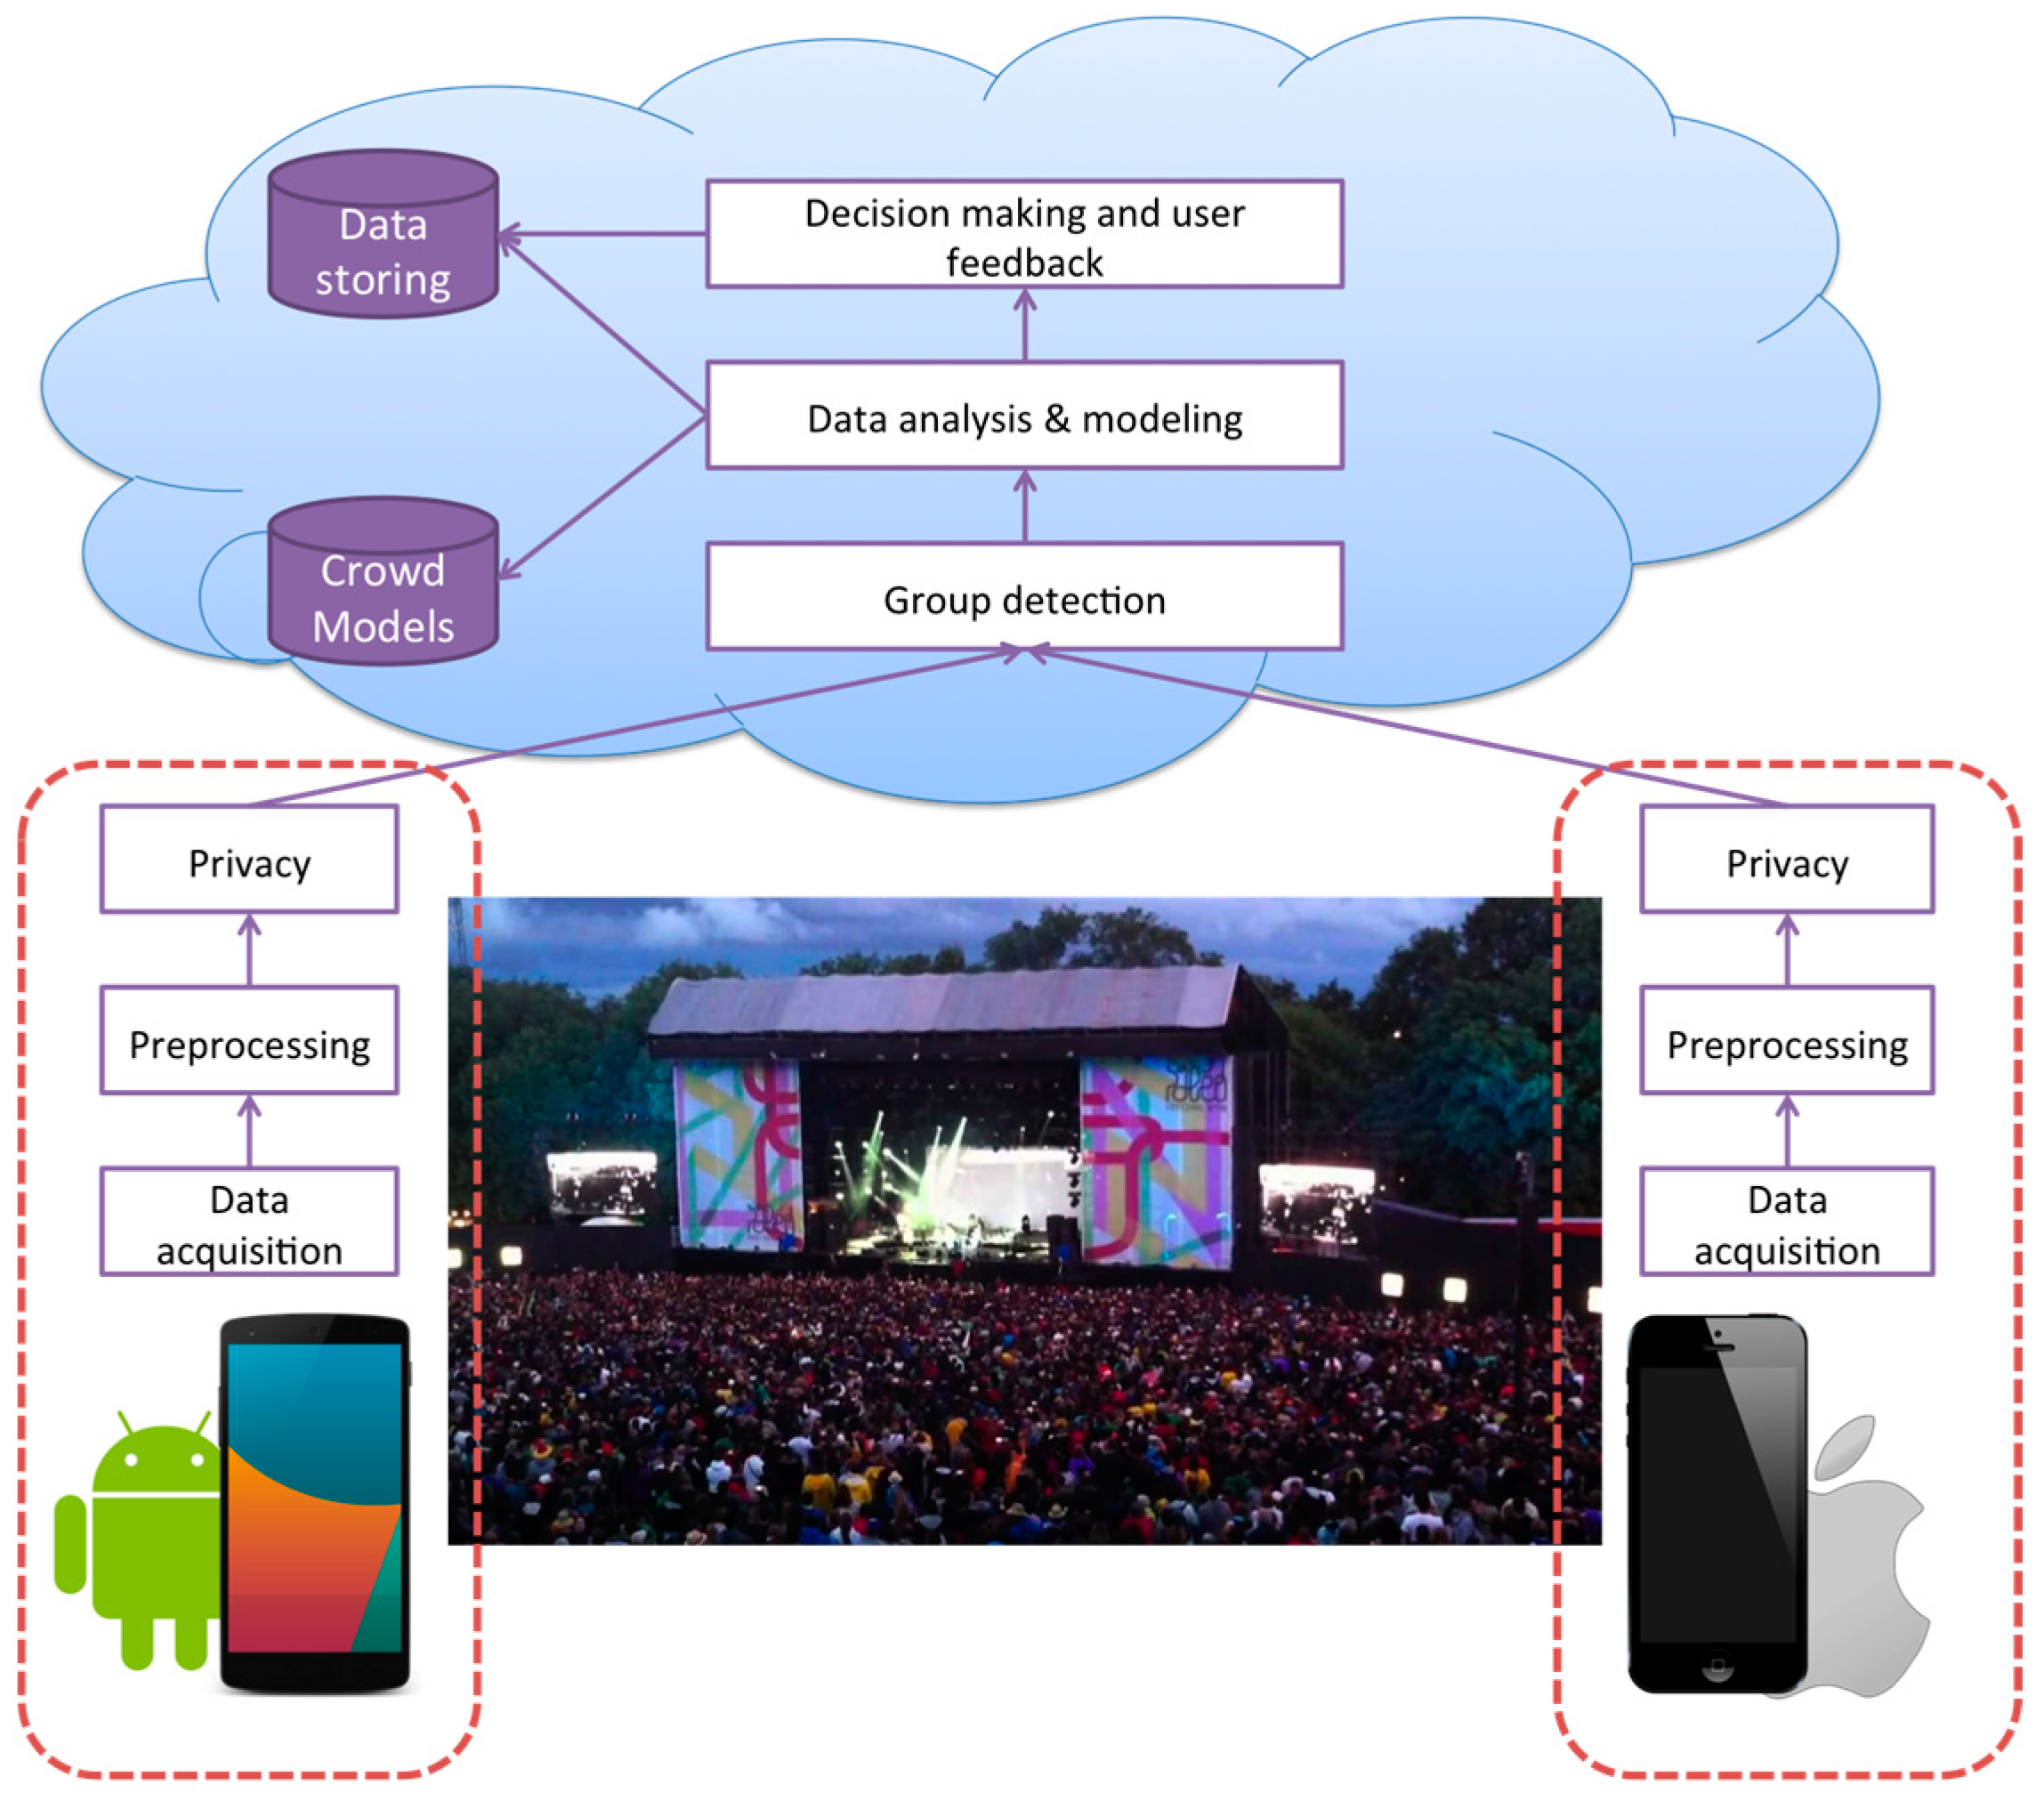
4.1. SmartCrowd Architecture

SmartCrowd, first of all, is a proof-of-concept of iNUIT applied in a specific scenario, i.e., the detection of dangerous situations during large events using data coming from the participants’ smartphones and, in particular, their GPS locations. Therefore, SmartCrowd’s architecture implements some modules of the iNUIT architecture, as we saw in Figure 3.
In order to make possible to monitor in real-time the crowd behavior, we developed an application for smartphone. Therefore, the smartphone represented our element in the sensors layer as well the interface towards the user in the services and applications layer. At the sensor level, the application performed the first processing step anonymizing the data, and processing them in order to transmit the information (location, speed and bearing) in the desired format. In addition, in the case of limited connection, it permitted to store the data on the smartphone to send them later when a connection was available. The data were then sent directly using a secured connection to the cloud layer. The cloud system was not developed within the SmartCrowd project but in another project related to iNUIT, therefore we do not describe here this module in detail. However, we exploited this module trough an Application Program Interface (API) that permitted to collect heterogeneous data from different smart objects. The smartphones connected to the server using this interface, they transmitted the location data and recuperated the elaborated information (such as the information to visualize in a heat map of the event). On the server side, we implemented the algorithms to calculate the crowd pressure and to recognize groups. The details of these algorithms are described in [31]. In this first prototype, the mobile app was quite simple. We developed two applications, one for iOS systems and one for Android systems. The two applications had the same structure and a very similar behavior. The application is described in the Section 4.2.
The SmartCrowd mobile app represents a service provided to the participants of the event. Obviously, the same data could be used to provide services to the organizers. In addition, also data coming from camera could be considered to enrich the results. However, we limited this first prototype to the participants’ side, using only GPS as transmitted by the smartphones. Concerning information more interesting for the organizer, we developed a simulator able to take topographic information of the event and test escape situations. The SmartCrowd simulator is presented in Section 4.3.

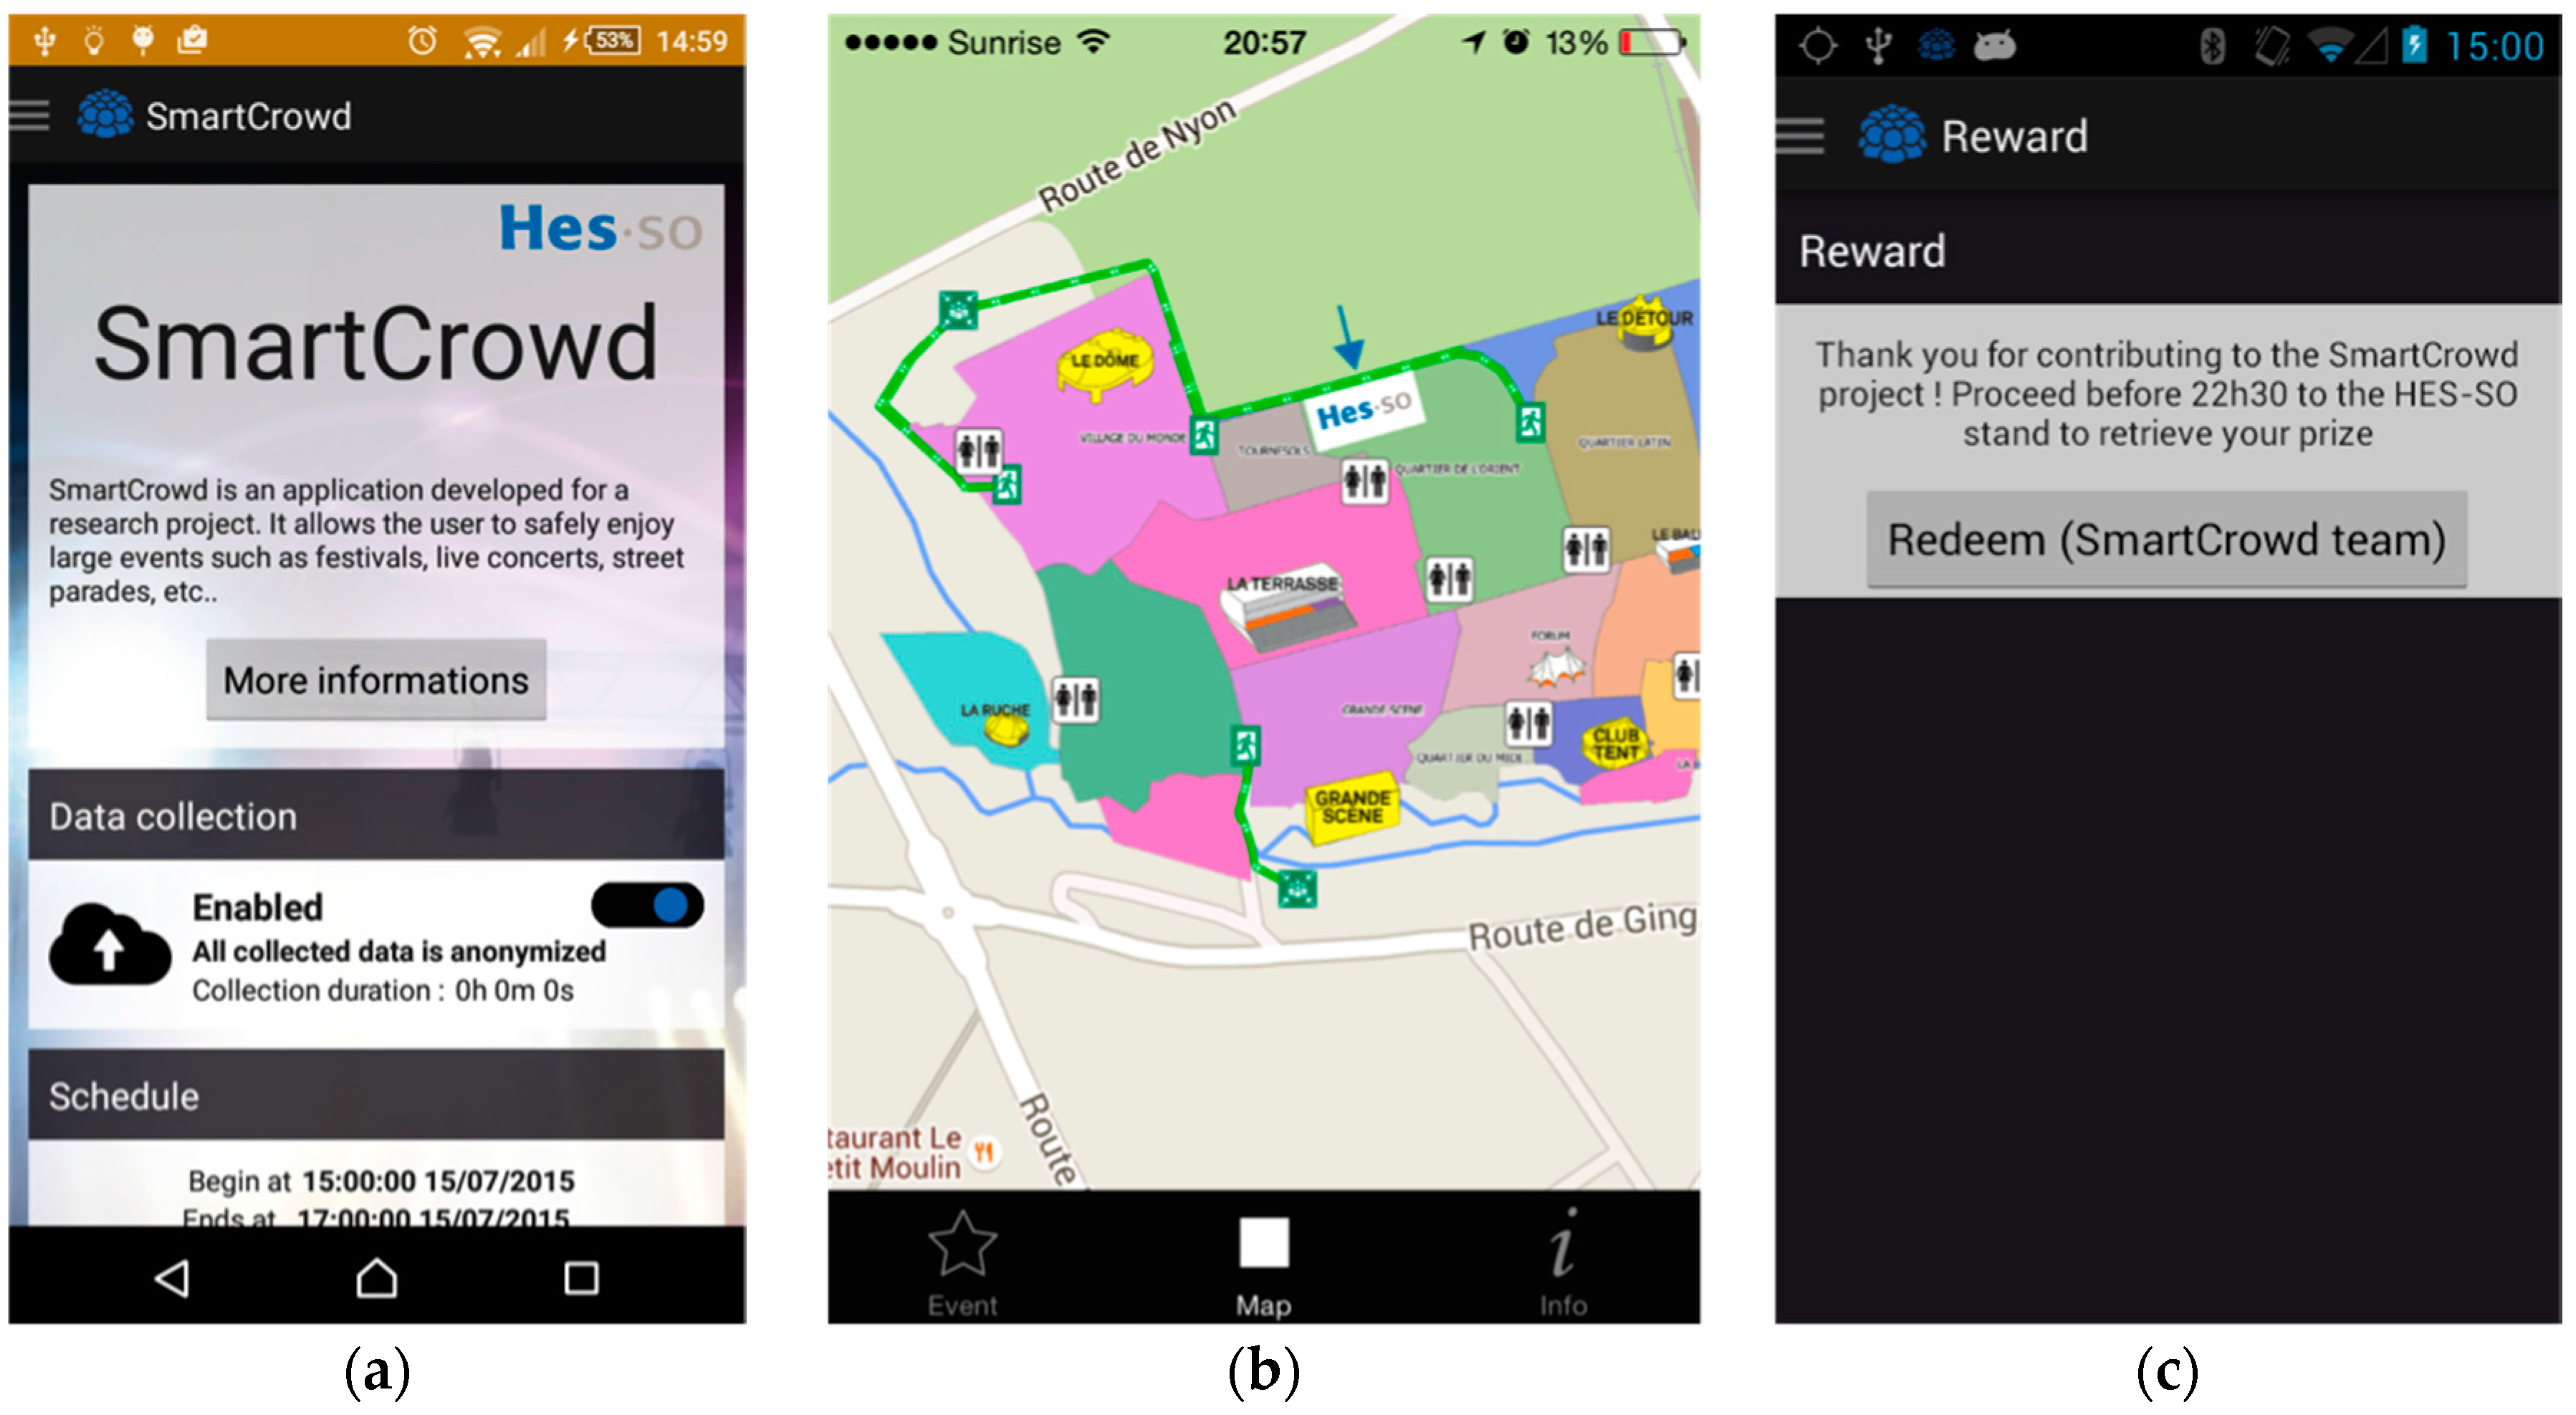
4.2. SmartCrowd Mobile Application

The SmartCrowd app had the main role to implement the interface towards the users and to preprocess and send the data according to event configurations. Figure 4 shows the modules developed within the app running on the client side (regrouped by the red dashed line) and the modules running on the server side (“on the cloud”) for the data analysis and management.
From the point of view of the interface, the two applications (Android and iOS) presented a very similar and simple design. Figure 5 shows three screenshots of the developed applications. Concerning the functionalities, this first prototype was quite simple. First of all, after the installation, the application showed information about the privacy management and required the consent of the user to start collecting data. To reinforce the privacy and trust aspects, the main activity of the application showed clearly the period in which the information will be collected (e.g., the duration of the event). Outside this period of time, the application stopped collecting data. The second main activity of the application offered the possibility to visualize a map of the event with the user’s position, the location of the other participants that chose to share their position and the information related to the event (mainly, the location of scenes and stands position and the escape routes). Finally, a third activity showed information related to the reward. In fact, in order to foster participation in our study, we offered a reward to the participants that accepted to share (anonymously) their position information.

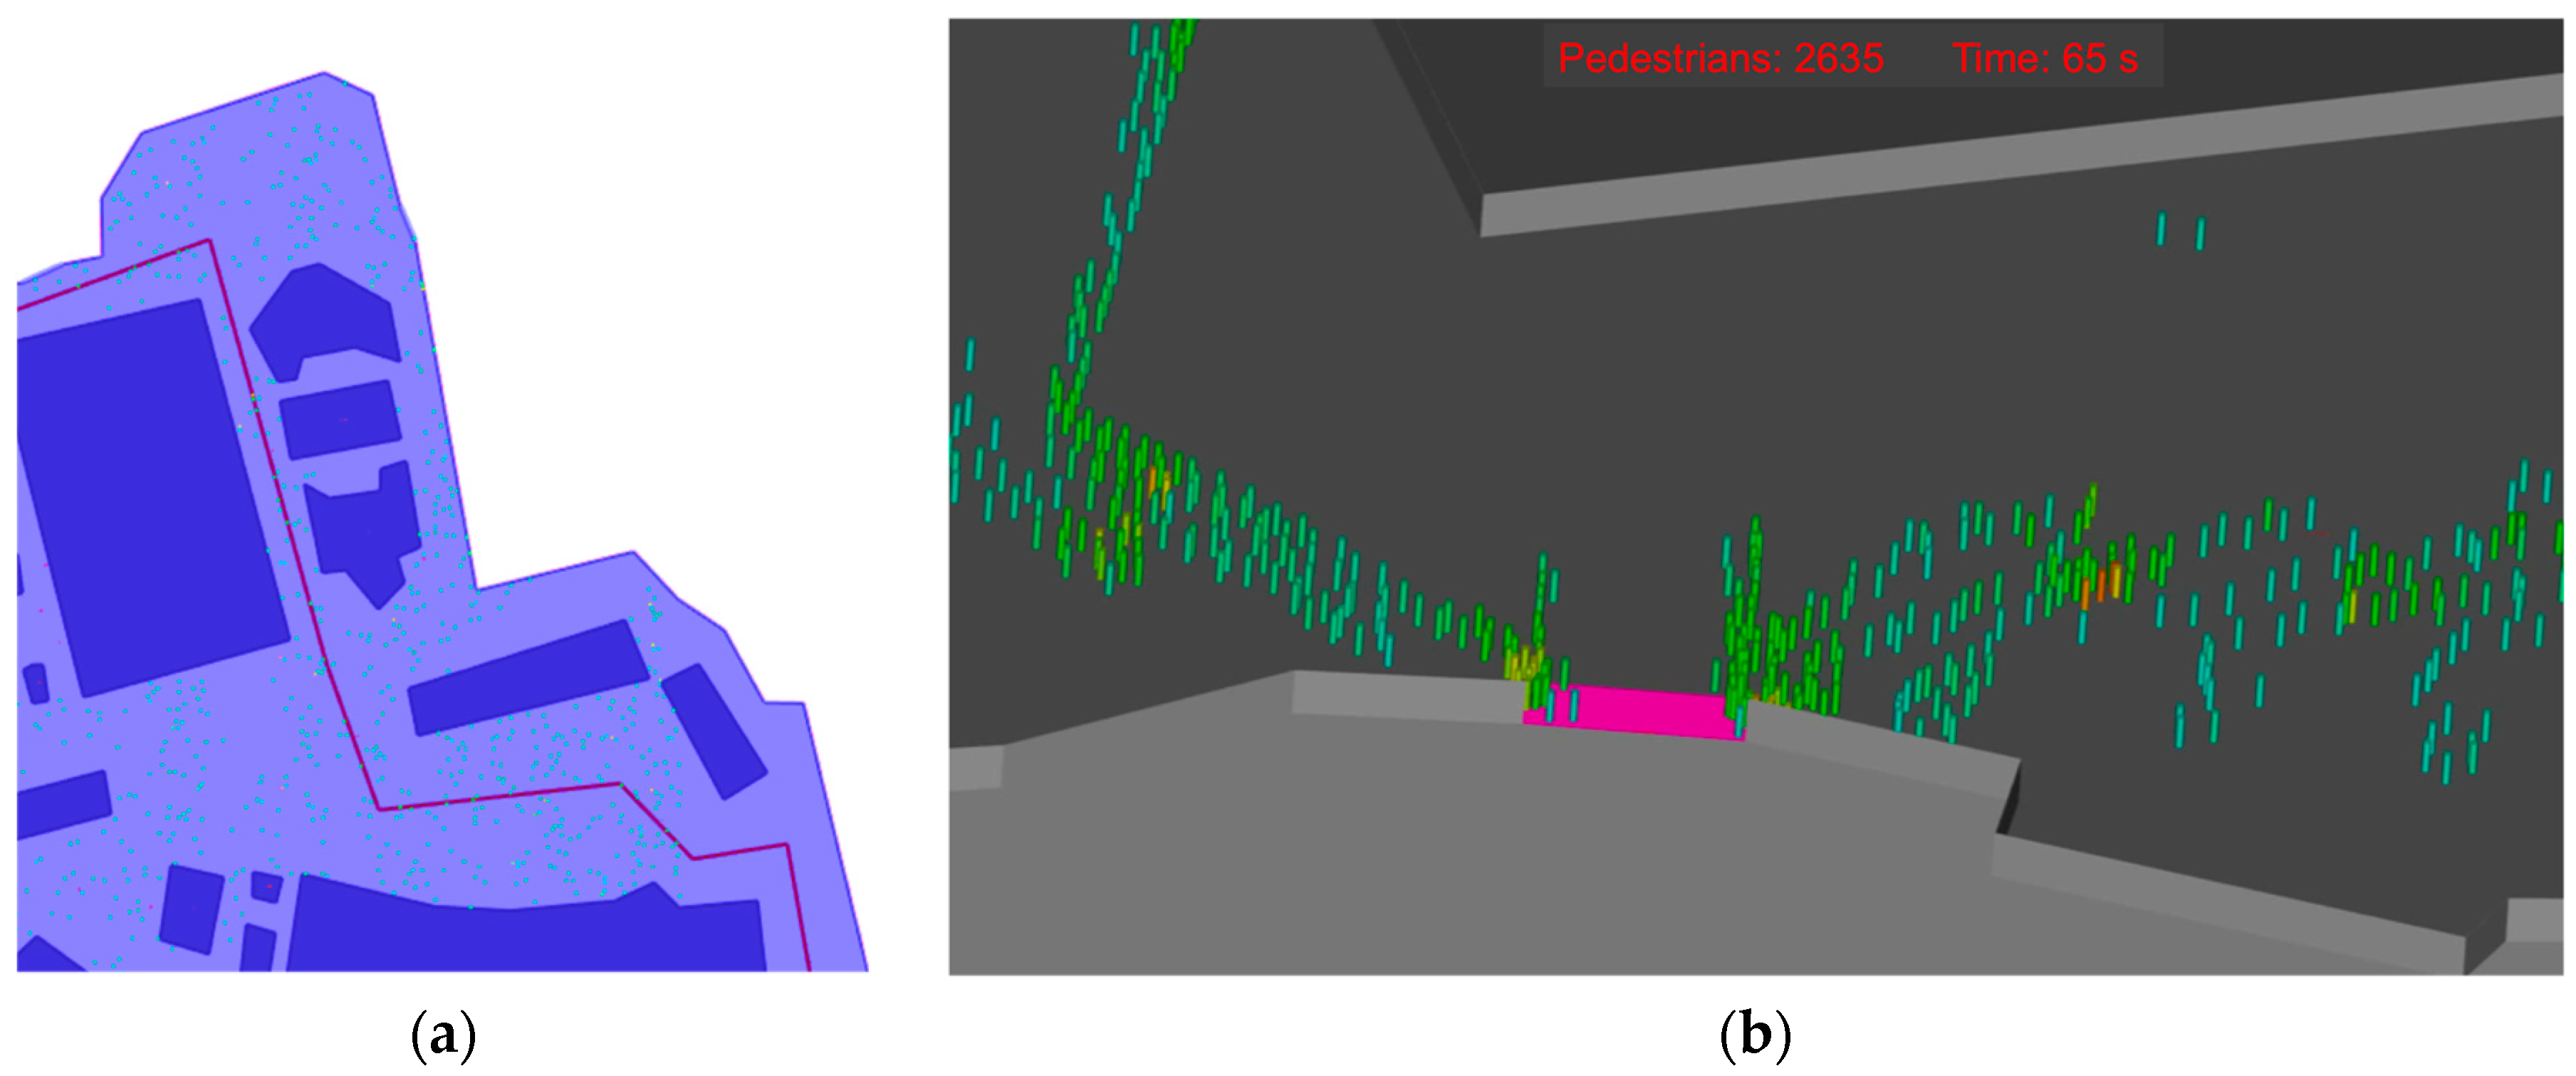
4.3. SmartCrowd Simulator

Our simulator extended the functionalities of the simulator JuPedSim (introduced in Section 3.1). JuPedSim is composed of three modules: JPScore, JPSvis and JPSreport. JPScore is the basic module. It calculates the trajectories considering the map configurations (walls, doors, rooms, etc.). JPSvis is the tool used to visualize the trajectories. Finally, JPSreport analyzes the trajectories created by the simulations and calculates the measures like density, speed, etc.
In order to provide to the simulator the topographical information of the event, we choose to use an online tool called Scribble Map (52 Stairs Studio Inc., Windsor, ON, Canada) [38]. This tool permitted to directly annotate in a geo-referenced map architectural elements, points of interest, gates, etc. simply tracking lines and polygons. Different colors corresponded to different types of elements. Moreover, it is possible to overlap an image to facilitate the annotation task. Figure 6 shows the annotation operation using Scribble Map and a map of the Paléo Festival.
The goal of this operation was to produce a .gpx file containing geo-referenced information about the event topography and then to translate it to the format required by the simulator with size expressed in meters. In order to do that, we developed a module able to convert the ScribbleMap’s output in the right format. In particular, we used the color of the annotations to convert the physical elements to corresponding elements of the simulation; then, we converted the coordinates from the WGS84 format used in smartphones (expressed in degrees) to CH1903 (expressed in meters) and then we normalized them to avoid too large numbers. The same approach can be used to define waypoints for the agents allowing the simulation of specific paths such as escape routes (i.e., routing information).
From the output point of view, JuPedSim generates a text file with the simulation results (e.g., density, velocity, etc.) and a Voronoi diagram to visualize these data. In addition, we added a module to visualize a heat map based on the agents’ trajectories. An example of Voronoi diagrams and the heat map are shown in Figure 7.
The simulation also permitted seeing the displacement of the agents accordingly to one or more defined escape routes. Each person was modeled as an elliptic cylinder. Figure 8 shows two details of a running simulation.

4.4. Paléo Festival Nyon

The Paléo Festival Nyon is an annual rock festival held in Nyon, Switzerland. In 2015 it had about 270,000 attendees distributed over seven days (i.e., around 38,000 people per day). During this event, we participated in the festival by providing to volunteers the possibility of installing the SmartCrowd application.
It is worth noting that an official Paléo app existed. This application offered some static information such as the festival schedule, scenes emplacements, etc. and a real-time news and weather service alerts. Unfortunately, we could not integrate the SmartCrowd app within the official Paléo app. Therefore, to foster contributions to our study, we provided a reward to the participants that accepted to install the app and share their location information. In order to limit the consumption of battery, we limited the duration of the data collection to an hour. We performed our test on three days during the festival.
  • First day. Period: 8:30–9:30 p.m. Apps downloaded: 18 iOS, 10 Android. 140,765 points collected.
  • Second day. Period: 7:30–8:30 p.m. Apps downloaded: 21 iOS, 14 Android. 109,962 points collected.
  • Third day. Period: 8:30–9:30 p.m. Apps downloaded: 25 iOS, 12 Android; 331,218 points collected.
Figure 9 shows some data and statistics about the information collected during the third day.
Even if the number of the applications download was quite limited, this study permitted us to get a first evaluation of the proposed approach. The use of smartphones may provide quite accurate data. Around 73% of the data had an accuracy estimated at 5–10 m while 22% was 10–15 m. This permitted reconstructing the displacement during the event as shown in Figure 9.
Unfortunately, the number of participants was too limited to be used to compute measures such as crowd pressure or groups detection.
To complete these data, during the event we interviewed 172 participants. Almost all the interviewed people had a smartphone even if some of them could not install our application for “technical” reasons (e.g., unavailable 3G or 4G connections, incompatible phone, lost account password, battery limitations, etc.). The main result from the survey was that “security” was not perceived as sufficient motivation to install the application. Most of the participants justified this answer explaining that they were “Paléo experts” (i.e., with several previous participations in the festival) and, therefore, they did not need an application to help them in case of danger. Other participants did not consider the application useful for “their case”, since they planned to participate in just one day of the festival.
Each user had a quite personal vision about privacy and confidentiality. Someone defined himself as almost “paranoid”, claiming to not install any application that can access to his or her data. On the contrary, other participants claimed not caring at all about privacy since “we are all spied on anyway”. However, most of people claimed to be sensitive to the problem but also to be open to reduce their privacy in exchange for services perceived as useful.
Regarding the Paléo official application, 48% of the interviewed participants had it installed, mainly to be informed about schedules and concert locations and alert services in case of bad weather and changes in show times. Given that the official application already requires the consent of the users to share location information for some of its features, it seems that a viable way to use smartphone’ data to increase the event security could be to integrate the SmartCrowd functionalities in the event official app.
Concerning the people that did not install the official app, 83% of them justified their choice with the lack of perceived usefulness (“the same information are available on the paper pamphlet”), 10% were not aware of the existence of the application, and 7% did not install it for technical reasons. In addition, we tried to investigate which motivations could encourage them to install the application but there was not a clear answer. They expressed interest towards “context aware” features (e.g., find the nearest bar or the toilette with lower waiting time) while they almost completely discarded safety features and “find-my-friends”-like features (“we have whatsapp for that”). These results are in line with previous research, such as [26], in which they found that the main interest to install the festival application was to get the event’s map and program, followed by a collection game. Similar to the results of our survey, they found that participants largely overlooked the safety-related concepts of the app. This seems to confirm that a “gamification” approach might encourage the users to share their data more than safety-oriented applications that are perceived as too “abstract” to grasp. For what concerns context aware functionalities, a deeper study is required. Participants seemed interested to the concept but only the actual use of such features could prove if they respond to actual needs.
A second phase of tests is scheduled for the 2016 festival edition in which we are working to integrate the SmartCrowd application with the official Paléo app.

5. OpEc

5.1. OpEc Architecture

The system view of the dynamic street light control and management solution is illustrated on Figure 10. The solution takes advantage of the IoT paradigm in order to collect sensor data, analyze them, make a decision on the needs of street light intensity and send commands to an actuator that control the light intensity of luminaires. The system is composed of the following parts.
  • Central platform: Analyzes the data sensed by the sensors and relayed to a central platform. Its main objective is to “understand” the environmental context and, thus, to determine the real needs for lighting intensity, i.e. intense/low activity, good/bad visibility, etc.
  • Sensors that deliver:
    environmental indicators, e.g., luminosity, weather forecast; and
    activity indicators, e.g., pedestrian, traffic;
  • Luminaires: Receive the command to regulate the light intensity according to the determined needs.
The different parts will be presented in detail below.
The proposed light management and control solution is based on technological components inspired from the Internet of Things (IoT) paradigm, presented in [39]. A set of sensors are deployed in the field to measure street light relevant indicators which are processed and analyzed with the objective to accurately estimate the real need related to light intensity for a given context. Finally, a command is sent to an individual or a group of luminaires for dynamically setting the needed light intensity. The IoT platform built around a set of building blocks for each layer of the IoT technological stack is used to integrate the DSL solution.
The platform is conceived and built to flexibly and seamlessly integrate new communicating objects with minimal effort. Indeed, the platform addresses the IoT fragmentation challenge, which is caused the lack of standards in communication protocols and data format to conceive and build IoT solutions. Our platform is implemented around the following modules.
Communicating Devices. The sensors and actuators are integrated on a single embedded device able to forward the measured values and to receive the commands.
Gateway. A ubiquitous processing unit capable of communicating with the end devices and to push the measured values to the central platform. Further, the gateway is able to pull the commands to the end devices. In order to facilitate the connection and the integration of different devices that use different communication protocol, the Gateway relies on communication agents that are able to understand various protocols and extract relevant sensor data from the protocol’s payload. These communication agents allow the seamless integration of communicating devices. On top of the Java VM, the framework Open Services Gateway initiative (OSGi) [40] has been installed. OSGi is a java-based execution environment suitable for deploying and running modular and loosely coupled services implemented in the form of bundles. Further, OSGi allows the realization and the execution of applications, which are conform to the Service Oriented Architecture (SOA) principles and able to run on a resources-constrained hardware. In order to avoid the manual implementation and management of low-level services like device abstraction, connectivity management, etc., the proposed solution makes extensive use of the Kura framework [41].
Broker. It is a message broker capable of forwarding the data between the gateway and the central platform based on the «publish/subscribe» principle. The underlying asynchronous communication mechanism assures a high performance of the data transfer.
Rules engine. The dynamic street light application relies on an engine based on Drools (Red Hat Inc. or third-party contributors, Raleigh, NC, USA). It combines the different sensor data and infers a decision regarding the light intensity to configure on the luminaire. Figure 11 illustrates the implemented sensor fusion algorithms using a decision tree.
Zigbee-based Outdoor Light Controller (OLC). In order to dynamically and remotely control the intensity of the luminaires using the central IoT platform and the associated Gateway, we need an OLC that receives, on one side, via ZigBee protocol, the intensity percentage that has been calculated by the decision making module of the platform, and sends on the other side, via a wired DALI or 0–10 V interface, the regulation signal to the luminaire.

5.2. OpEc Result

After several tests carried out in a lab environment to tune the different modules of the dynamic street light control solution, we have deployed the solution at the city of St-Imier in Switzerland. We have chosen a street located near our Lab, which name is “Rue de la Cible”. The deployed instance of the solution is composed of the following elements:
  • IoT Platform installed on a virtual server at our lab and the Gateway installed on a Rasberry Pi (Raspberry Pi Foundation, Caldecote, United Kingdom) running Ubuntu linux.
  • The ZigBee enabled Outdoor Light Controller with the DALI converter activated.
  • A luminaire equipped with a DALI slave and connected to a 24/7 power supply of the street lighting electric network of the city.
  • A camera connected to a Raspberry Pi that detects the activities on the street based on motion detection.
  • A weather station connected to a Raspberry Pi measuring mainly the ambient luminosity.
Table 1 shows the parameters used for the configuration of the decision tree that combines the different sensor data and infers the needed light intensity.
The test has been run for two months during November and December 2015. The system has run without any interruption and the stability has been validated.
Further, the overall energy saving for the instrumented luminaire is around 56%. As shown in Figure 12, the intensity of the luminaire is set to 30% during 80% of the nighttime. Only 20% of the time the luminaire operates at 100% of its maximal capacity.
In addition to this quantitative evaluation, qualitative tests have also been run by our team in order to validate the reliability of the motion detectors and the reactivity of the light intensity to road activities (pedestrians and cars). These tests have clearly shown that the level of security perception offered by the dynamic light solution is comparable to continuous maximal illumination situations.

6. Conclusions

In this article, we presented the iNUIT program and its architecture. The goal of the project is to use the Internet of Thing paradigm to enable the idea of Smart City offering new services in the direction of physical security, resource management, mobility, and quality of life. To validate the idea, we presented two projects developed within the context of the iNUIT vision: SmartCrowd and OpEc.
SmartCrowd implemented a part of the iNUIT infrastructure with the goal of monitoring crowd’s movement during large events. In particular, the projects used sensor embedded in users’ smartphones to detected groups in the crowd and estimate parameters such as crowd pressure to detect possible dangerous situations in real-time. In addition, we extended an existing simulator to analyze offline the impact of event topography (i.e., the arrangement of the natural and artificial physical features) site on security. The system was tested during the Paléo Festival Nyon 2015. The test showed that is possible to use smartphones’ sensors to anonymously monitor the crowd’s movement in real-time with a precision up to 5 m. However, in order to get an exhaustive vision of the crowd’s behavior (such as groups recognition or a precise estimation of crowd pressure), it is necessary the contribution of a large part of the participants. According to a survey that involved 172 participants, a good solution could be represented by the integration of the services offered by SmartCrowd within the event’s official application. In the future, it will be interesting to study the possibilities offered by such an application in terms of contextualized services and services offered to the event organizers and law enforcement. Videos about the simulation and the data tracked during the festival are available online [42].
Regarding the OpEc project, the current system relies mainly on environmental and traffic indicators to estimate the needs for street light intensity. It then controls the luminaires accordingly. Quantitative tests have been carried out on real world scenario using real street light luminaires deployed on one street of a Swiss city. These tests clearly showed the relevance of the solution. The overall energy saving when using our solution is measured and it amounts to 56% for the considered scenario. Qualitative tests have been also run with humans and no major impact on the security perception of the light intensity dynamic have been reported, which reinforces the potential of such systems to bring part of the solution towards low carbon cities of the future.

Acknowledgments

The research program iNUIT is part of the large-scale thematic research programs of the University of Applied Sciences and Arts of Western Switzerland (HES-SO). The authors gratefully acknowledge funding from HES-SO during the period of 2013–2020. In addition, the authors would like to thank Andres Perez-Uribe and Julien Rebetez for the valuable contribution in the development and data analysis activities during the SmartCrowd project.

Author Contributions

J.E., E.M. and N.O. participated to the conception of the iNUIT architecture; F.C., E.M. and O.A.K. managed the SmartCrowd project, performed the experiment and analyzed the data; N.U. managed the OpEc project, performed the experiment and analyzed the data; and all the authors contributed to the writing of the paper.

Conflicts of Interest

The authors declare no conflict of interest.

Abbreviations

The following abbreviations are used in this manuscript:
APIApplication Program Interface
DALIDigital Addressable Lighting Interface
DCDirect Current
ESCAPESEvacuation Simulation with Children, Authorities, Parents, Emotions, and Social comparison
GCFMGeneralized Centrifugal Force Model
iNUITInternet of Things for Urban Innovation
IoTInternet of Things
OLCOutdoor Light Controller
OpEcOptmisation de l’Eclairage public
OSGiOpen Services Gateway initiative
SOAService Oriented Architecture

References

  1. Caragliu, A.; del Bo, C.; Nijkamp, P. Smart Cities in Europe. J. Urban Technol. 2011, 18, 65–82. [Google Scholar] [CrossRef]
  2. Branchi, P.; Fernández-Valdivielso, C.; Matias, I. Analysis Matrix for Smart Cities. Future Internet 2014, 6, 61–75. [Google Scholar] [CrossRef]
  3. Nam, T.; Pardo, T.A. Conceptualizing smart city with dimensions of technology, people, and institutions. In Proceedings of the 12th Annual International Digital Government Research Conference on Digital Government Innovation in Challenging Times—dg.o ’11, College Park, MD, USA, 12–15 June 2011; ACM Press: New York, NY, USA, 2011. [Google Scholar]
  4. Chourabi, H.; Nam, T.; Walker, S.; Gil-Garcia, J.R.; Mellouli, S.; Nahon, K.; Pardo, T.A.; Scholl, H.J. Understanding Smart Cities: An Integrative Framework. In Proceedings of the 2012 45th Hawaii International Conference on System, Maui, HI, USA, 4–7 January 2012; pp. 2289–2297.
  5. Washburn, D.; Sindhu, U. Helping CIOs Understand “Smart City” Initiatives. Growth 2009, 17, 1–16. [Google Scholar]
  6. Gubbi, J.; Buyya, R.; Marusic, S.; Palaniswami, M. Internet of Things (IoT): A vision, architectural elements, and future directions. Future Gener. Comput. Syst. 2013, 29, 1645–1660. [Google Scholar] [CrossRef]
  7. Zanella, A.; Bui, N.; Castellani, A.; Vangelista, L.; Zorzi, M. Internet of Things for Smart Cities. IEEE Internet Things J. 2014, 1, 22–32. [Google Scholar] [CrossRef]
  8. Lea, R.; Blackstock, M. Smart Cities: An IoT-centric Approach. In Proceedings of the 2014 International Workshop on Web Intelligence and Smart Sensing—IWWISS ’14, Saint Etienne, France, 1–2 September 2014; ACM Press: New York, NY, USA, 2014; pp. 1–2. [Google Scholar]
  9. Vlacheas, P.; Giaffreda, R.; Stavroulaki, V.; Kelaidonis, D.; Foteinos, V.; Poulios, G.; Demestichas, P.; Somov, A.; Biswas, A.; Moessner, K. Enabling smart cities through a cognitive management framework for the internet of things. IEEE Commun. Mag. 2013, 51, 102–111. [Google Scholar] [CrossRef]
  10. Helbing, D.; Johansson, A.; Al-Abideen, H.Z. Dynamics of crowd disasters: An empirical study. Phys. Rev. E 2007, 75. [Google Scholar] [CrossRef] [PubMed]
  11. Zhan, B.; Monekosso, D.N.; Remagnino, P.; Velastin, S.A.; Xu, L.-Q. Crowd analysis: A survey. Mach. Vis. Appl. 2008, 19, 345–357. [Google Scholar] [CrossRef]
  12. Schadschneider, A. Cellular Automaton Approach to Pedestrian Dynamics—Theory. Pedestr. Evacu. Dyn. 2001, 11, 75–86. [Google Scholar]
  13. Stroehle, J. How do pedestrian crowds react when they are in an emergency situation–models and software Pedestrian behavior. Available online: http://guava.physics.uiuc.edu/~nigel/courses/569/Essays_Fall2008/files/Stroehle.pdf (accessed on 10 May 2016).
  14. Helbing, D. A fluid dynamic model for the movement of pedestrians. Complex Syst. 1992, 6, 391–415. [Google Scholar]
  15. Helbing, D.; Molnár, P. Social Force Model for Pedestrian Dynamics. Phys. Rev. E 1995, 51. [Google Scholar] [CrossRef]
  16. Helbing, D.; Farkas, I. Simulation of pedestrian crowds in normal and evacuation situations. Pedestr. Evacu. Dyn. 2002, 21, 21–58. [Google Scholar]
  17. Narain, R.; Golas, A.; Curtis, S.; Lin, M.C. Aggregate dynamics for dense crowd simulation. ACM Trans. Graph. 2009, 28. [Google Scholar] [CrossRef]
  18. Tsai, J.; Fridman, N.; Bowring, E.; Brown, M.; Epstein, S.; Kaminka, G.; Marsella, S.; Ogden, A.; Rika, I.; Sheel, A.; et al. ESCAPES: Evacuation simulation with children, authorities, parents, emotions, and social comparison. In Proceedings of the 10th International Conference Auton, Taipei, Taiwan, 2–6 May 2011; Volume 2, pp. 457–464.
  19. Ulrich, A.U.K.; Chraibi, M.; Zhang, J.; Lammel, G. JuPedSim: An open framework for simulating and analyzing the dynamics of pedestrians. In Proceedings of the 3rd Conference of Transportation Research Group of India, Kolkata, India, 17–20 December 2015.
  20. Chraibi, M.; Seyfried, A.; Schadschneider, A. Generalized centrifugal-force model for pedestrian dynamics. Phys. Rev. E 2010, 82. [Google Scholar] [CrossRef] [PubMed]
  21. Gong, S.; Loy, C.C.; Xiang, T. Security and Surveillance. In Visual Analysis of Humans; Moeslund, T.B., Hilton, A., Krüger, V., Sigal, L., Eds.; Springer London: London, UK, 2011; pp. 455–472. [Google Scholar]
  22. Becker, R.A.; Caceres, R.; Hanson, K.; Loh, J.M.; Urbanek, S.; Varshavsky, A.; Volinsky, C. A Tale of One City: Using Cellular Network Data for Urban Planning. IEEE Pervas. Comput. 2011, 10, 18–26. [Google Scholar] [CrossRef]
  23. Kim, D.H.; Kim, Y.; Estrin, D.; Srivastava, M.B. SensLoc. In Proceedings of the 8th ACM Conference on Embedded Networked Sensor Systems—SenSys ’10, Zurich, Switzerland, 3–5 November 2010; ACM Press: New York, NY, USA, 2010; p. 43. [Google Scholar]
  24. Versichele, M.; Neutens, T.; Delafontaine, M.; van de Weghe, N. The use of Bluetooth for analysing spatiotemporal dynamics of human movement at mass events: A case study of the Ghent Festivities. Appl. Geogr. 2012, 32, 208–220. [Google Scholar] [CrossRef]
  25. Wirz, M.; Franke, T.; Roggen, D.; Mitleton-Kelly, E.; Lukowicz, P.; Tröster, G. Probing crowd density through smartphones in city-scale mass gatherings. EPJ Data Sci. 2013, 2. [Google Scholar] [CrossRef]
  26. Blanke, U.; Troster, G.; Franke, T.; Lukowicz, P. Capturing crowd dynamics at large scale events using participatory GPS-localization. In Proceedings of the 2014 IEEE Ninth International Conference on Intelligent Sensors, Sensor Networks and Information Processing (ISSNIP), Singapore, 21–24 April 2014; pp. 1–7.
  27. Johnson, N.R. Panic at “The Who Concert Stampede”: An Empirical Assessment. Soc. Probl. 1987, 34, 362–373. [Google Scholar] [CrossRef]
  28. Ruback, R.B.; Collins, R.T.; Koon-Magnin, S.; Ge, W.; Bonkiewicz, L.; Lutz, C.E. People Transitioning Across Places: A Multimethod Investigation of How People Go to Football Games. Environ. Behav. 2013, 45, 239–266. [Google Scholar] [CrossRef]
  29. Moussaïd, M.; Perozo, N.; Garnier, S.; Helbing, D.; Theraulaz, G. The Walking Behaviour of Pedestrian Social Groups and Its Impact on Crowd Dynamics. PLoS ONE 2010, 5, e10047. [Google Scholar] [CrossRef] [PubMed]
  30. McPhail, C.; Wohlstein, R.T. Using Film to Analyze Pedestrian Behavior. Sociol. Methods Res. 1982, 10, 347–375. [Google Scholar] [CrossRef]
  31. Mallah, J.E.; Carrino, F.; Abou Khaled, O.; Mugellini, E. Crowd Monitoring—Critical situations prevention using smartphones. In Distributed, Ambient, and Pervasive Interactions; Springer International Publishing: Cham, Switzerland, 2015; Volume 9189, pp. 496–505. [Google Scholar]
  32. Ester, M.; Kriegel, H.-P.; Sander, J.; Xiaowei, X. A density-based algorithm for discovering clusters in large spatial databases with noise. InKdd 1996, 96, 226–231. [Google Scholar]
  33. European Commission. Lighting the Cities: Accelerating the Deployment of Innovative Lighting in European Cities. Available online: https://ec.europa.eu/digital-single-market/en/news/new-commission-report-lighting-cities-accelerating-deployment-innovative-lighting-european (accessed on 10 May 2016).
  34. Husin, R.; Al Junid, S.A.M.; Majid, Z.A. Automatic Street Lighting System for Energy Efficiency based on Low Cost Microcontroller. Int. J. Simul. Syst. Sci. Technol. 2012, 13, 29–34. [Google Scholar]
  35. Sung, W.-T.; Lin, J.-S. Design and Implementation of a Smart LED Lighting System Using a Self Adaptive Weighted Data Fusion Algorithm. Sensors 2013, 13, 16915–16939. [Google Scholar] [CrossRef]
  36. Kapgate, D. Wireless Streetlight Control System. Int. J. Comput. Appl. 2012, 41, 1–7. [Google Scholar] [CrossRef]
  37. Ouerhani, N.; Pazos, N.; Aeberli, M.; Senn, J.; Gobron, S. Dynamic Street Light Management–Towards a citizen centered approach. In Proceedings of the 3rd International Conference on Hybrid City, Athens, Greece, 17–19 September 2015.
  38. 52 Stairs Studio Inc. Scribble Map. Available online: http://www.scribblemaps.com/ (accessed on 2 March 2016).
  39. Final architectural reference model for the IoT, version 3.0. Available online: http://www.iot-a.eu/public/public-documents/d1.5/at_download/file (accessed on 6 May 2016).
  40. OSGi Alliance. Available online: http://www.osgi.org (accessed on 7 March 2016).
  41. Kura. Available online: https://eclipse.org/kura/ (accessed on 7 March 2016).
  42. SmartCrowd video playlist. Available online: https://goo.gl/gvVX5x (accessed on 6 May 2016).
Figure 1. A graphic representation of the vision within the Internet of Things for Urban Innovation (iNUIT) program with main services based on a network of connected objects (Internet of Things paradigm).
Futureinternet 08 00018 g001
Figure 2. iNUIT architecture divided in five layers from the sensors (bottom) to the services (up).
Futureinternet 08 00018 g002
Figure 3. The iNUIT architecture with the modules developed within the SmartCrowd and OpEC (Optmisation de l’Eclairage public) projects tinted in purple and orange, respectively. The modules in white have been developed during other projects within the iNUIT program.
Futureinternet 08 00018 g003
Figure 4. SmartCrowd app structure. The red dashed lines regroup the modules developed within the mobile app.
Futureinternet 08 00018 g004
Figure 5. Three screenshots of the SmartCrowd application showing: (a) The main screen; (b) The map; (c) The reward information.
Futureinternet 08 00018 g005
Figure 6. A picture from the manual annotation operation.
Futureinternet 08 00018 g006
Figure 7. The output generated by the simulator: (a) two Voronoi diagrams for density and velocity of a portion of the map; and (b) the heat map generated by the simulation of an evacuation on the Paléo site (the orange circles indicate the exits).
Futureinternet 08 00018 g007
Figure 8. (a) A screenshot of the simulation scene seen form above; the red line represents the defined escaping route. (b) A closer look at the crowd moving toward a gate during a simulated evacuation. The color of the agent is related to the local density calculated by the simulator.
Futureinternet 08 00018 g008
Figure 9. (a) Two users’ location points during the one-hour collect time. (b) The accuracy distribution and (c) the time distribution of data collected during the event.
Futureinternet 08 00018 g009
Figure 10. Dynamic street lighting system overview.
Futureinternet 08 00018 g010
Figure 11. Decision tree implemented in Drools.
Futureinternet 08 00018 g011
Figure 12. Luminaire intensity level variation during one night.
Futureinternet 08 00018 g012
Table 1. Configuration of the intensity variation rule.
Intensity variation rulesLuminosity
BrightDark
ActivityNo0%30%
Yes0%100%

