
Using Financial Instruments to Transfer the Information Security Risks

Norwegian Information Security Lab., Gjøvik University College, Teknologivn 22, 2815 Gjøvik, Norway
*
Author to whom correspondence should be addressed.
Future Internet 2016, 8(2), 20; https://doi.org/10.3390/fi8020020
Submission received: 5 November 2015
/
Revised: 22 April 2016
/
Accepted: 27 April 2016
/
Published: 17 May 2016
Abstract
:For many individuals and organizations, cyber-insurance is the most practical and only way of handling a major financial impact of an information security event. However, the cyber-insurance market suffers from the problem of information asymmetry, lack of product diversity, illiquidity, high transaction cost, and so on. On the other hand, in theory, capital market-based financial instruments can provide a risk transfer mechanism with the ability to absorb the adverse impact of an information security event. Thus, this article addresses the limitations in the cyber-(re)insurance markets with a set of capital market-based financial instruments. This article presents a set of information security derivatives, namely options, vanilla options, swap, and futures that can be traded at an information security prediction market. Furthermore, this article demonstrates the usefulness of information security derivatives in a given scenario and presents an evaluation of the same in comparison with cyber-insurance. In our analysis, we found that the information security derivatives can at least be a partial solution to the problems in the cyber-insurance markets. The information security derivatives can be used as an effective tool for information elicitation and aggregation, cyber risk pricing, risk hedging, and strategic decision making for information security risk management.

1. Introduction
In today’s hyper-connected world, currently cyber-insurance products are the only way of handling the residual information security risks. Recent incidents of cyber-attacks on various organizations [1] prove that even the most sophisticated technical defense systems are not sufficient to mitigate the residual (adverse financial) impact of cyber-security events. Thus, cyber-insurance products provide an opportunity to individuals and organizations to spread their risks. This ensures that no single entity receives a financial burden that is too large for it to bear. However, cyber-insurance markets are susceptible to information asymmetry between buyers and insurers, and between insurers and re-insurers; thus raising the cost of the transaction and inhibits transparency. Furthermore, due to interdependent and correlated nature of information security risks, the uncertainty about the quantum of risk exposure leads to the fear of systemic and huge losses for cyber-(re)insurance providers. This difficulty in quantifying the information security risks leads to underestimation of future losses, thus cyber-(re)insurance providers are incapable in underwriting the catastrophic impact of cyber risks [2]. Thus, in absence of adequate market mechanisms for risk acceptance, the interest of information security stakeholders who wish to transfer their risks and those who are willing to accept the risk are reduced. Furthermore, the World Economic Forum in its annual risk report stated that “A critical element in advancing this (on cyber risk management) discussion will be improving the collective ability to measure the economic impact of cyber risks, at all levels—within individual businesses, nationally and globally. Effective methods for measuring and pricing cyber risks may even lead to new market-based risk management structures, which would help in understanding the systemic inter-dependencies in the multiple domains that now depend on cyberspace” [3].
In theory, capital markets can be an effective mechanism to undertake a high impact and correlated information security risks. Capital market-based financial instruments can be developed as a risk transfer mechanism with the ability to absorb the risk of catastrophes and their potential to add liquidity and transparency to the risk transfer market [4,5,6,7,8,9]. Thus, the task of creating an information security risk market for risk transfer (hedging) faces two key challenges. The first is to design the market where various information security related financial instruments can be traded, and, second, the specification of financial instruments (derivatives/contracts) to address various information security risks. This article deals with the second problem, i.e., the specification of information security derivatives to allow hedging of risk exposure to the underlying information security event. The first challenge of designing an Information Security Prediction Market (ISPM) to allow the trading of such financial instruments has been addressed in [10,11,12].
The primary goal of a prediction market is to elicit and aggregate information about the trading contracts’ underlying events. Like other prediction markets, ISPM will allow traders to express their probability assessment for the possible outcome(s) of the underlying event. This is achieved by the trading of financial instruments (contracts), and the traders with more accurate predictions than others are compensated for the same. Thus, the participants have an economic incentive to improve the market accuracy by revealing any relevant information they may have. Therefore, in addition to the goal of achieving information elicitation and information aggregation, financial instruments trading at ISPM can be used as a mechanism for measuring and pricing of cyber risks and as a mechanism to transfer/hedge the underlying cyber (information) security risks. The market (ISPM) observers and participants can use the market information for strategic level cyber (information) security risk management decisions. Such decisions (to invest in security controls, deployment of necessary security tools, formulate organizational security policy, implementing regulatory compliance requirements, etc.) can benefit from the knowledge and perspectives of a large and diverse group of people participating in ISPM.
This article presents a set of specifications for Information Security Derivatives (ISD) that can be traded at an information security prediction market, to be used as a mechanism for risk hedging. The article presents a design for a set of ISD, namely Information Security Options (ISO), Information Security Vanilla Options (ISVO), Information Security Swaps (ISS), and Information Security Futures (ISF) that could be used to transfer the risk associated with the underlying information security event. An information security event is a potential source of peril that would cause a loss to the organization when it happens at anytime in the future. The loss (adverse impact) would be a result of damage, destruction, or unavailability of a resource that is critical for the normal operation of the organization. Furthermore, the article demonstrates the application of ISD in a given scenario and presents an evaluation of the same in comparison with cyber-insurance products.
The remainder of the article is structured as follows: Section 2 explains the research method followed for the article. Section 3 presents an overview of the related work. Section 4 explains the research problem addressed in the article. Section 5 identifies the functional requirements for ISD. Section 6 presents the design and development of the ISD. Section 7 demonstrates the application of ISD in hedging the financial impact of information security risks in the given scenario. Section 8 presents an evaluation of the ISD. Section 9 concludes the article with conclusion and directions for future work.
2. Research Method
We followed the Design Science Research Approach (DSRA) for this article [13]. DSRA is used when innovations and ideas are created to develop technical capabilities and products for effective and efficient process development for artifacts [13]. Design science research leads to the creation of “knowledge and understanding of a design problem, and its solution are acquired in the building and application of an artifact” [14]. Design science research consists of “analysis of the use and performance of designed artifacts to understand, explain and very frequently to improve the behavior of aspects of information systems” [15]. A process flow model for DSRA is shown in Figure 1.
2.1. Explicate Problem
The DSRA process starts with the formulation of the initial problem, justifying the importance of the problem and investigating the underlying causes of the problem [13]. To explicate the problem, we started with reviewing the literature on information security economics, currently available market methods and financial instruments developed for the management of information security risks. We also reviewed the literature on various financial instruments that are used to manage risks in other domains. This enabled us in identifying the gaps in the literature on the management of financial impact of information security risks in the information security domain. The identified problem is explained in Section 4.
2.2. Define Requirements
The next step in DSRA is to identify and outline an artifact that solves the problem explicated in the previous step. The artifacts include but are not limited to algorithms, languages, human-computer interfaces, and system design methodologies. Rossi and Sein [16] and Purao [17] presented a list of outputs in DSRA. The list includes all the four output types proposed by March and Smith [18], namely “Constructs”, “Models”, “Methods” and “Instantiations”, and a new element in the list is “Better Theories”, as shown in Table 1.
Furthermore, this step elicits the requirements for the artifact [13]. An artifact requirement is defined as the characteristic of the artifact that is to be used for design and development of the artifact. The artifact requirement can be functional, structural, or environmental in nature. To solve the problem identified in the previous step, the functional requirements identified for the artifact are explained in Section 5.
2.3. Design and Development of the Artifact
Design and development of the artifact is the third step in DSRA. This step leads to the creation of an artifact to fulfill the requirements that were identified in the previous step. This step leads to the design of the functionality and structure of the artifact [13]. Section 6 explains the functionality and structure of the artifact.
2.4. Demonstration of the Artifact
The feasibility of the artifact is demonstrated in the fourth step in DSRA. Primarily, it consists of explaining the application of the artifact in one situation [13]. The demonstration is a weak form of evaluation to show that the artifact can, in fact, solve the problem (or some aspects of it) in the given scenario. This demonstration indicates that if the artifact can solve the problem in the given situation, then it might be able to address the problem in other similar situations as well [13]. Section 7 demonstrates the use of the artifact designed and developed in the previous steps.
2.5. Evaluation of the Artifact
The fifth and the final step in DSRA is to evaluate the artifact. The evaluation is to determine the extent to which the artifact designed and demonstrated in the previous steps can solve the explicated problem and meets the artifact’s requirements [13]. Under the DSRA, the evaluation strategy can be an ex-ante or ex-post on the one hand and naturalistic or artificial on the other [13]. The strategy of evaluating the artifact when it is being fully developed or used is called an ex-ante evaluation. When the artifact is evaluated after its implementation, the evaluation strategy is called an ex-post evaluation. The naturalistic evaluation means that the artifact is evaluated in practice to assess to what extent it meets the desired objective. On the other hand, when the artifact is evaluated in an artificial and contrived setting, the evaluation strategy is termed as artificial evaluation.
The artifacts are evaluated using the methodologies available in the knowledge base. The evaluation of artifacts can be based on the accuracy, completeness, consistency, functionality, performance, reliability, usability, and other relevant quality attributes. A summary of evaluation methodologies is presented in Table 2.
Section 8 presents an evaluation of the artifact that was designed, developed and demonstrated to address the problems and requirements identified in the previous steps. The evaluation is based on the “descriptive” form of analysis [19]. This consists of constructing “scenarios” around the artifact and using “informed argument” from the knowledge base to demonstrate the usefulness of the artifact [19]. Vaishnavi and Kuechler[20] have called this form of evaluation as “Logical Reasoning”. According to them, the strength of the logical reasoning form of evaluation “depends on the strength and preciseness of its arguments and assumptions” [20].
Informed argument form of evaluation is an ex-ante, artificial evaluation method, and it consists of arguments to evaluate the performance of the artifact [13]. In the informed argument or descriptive analysis form of evaluation, researchers evaluate the artifact by reasoning and arguments for its usefulness in meeting the defined requirements and solving the explicated problem. This form of evaluation is often used to evaluate the artifacts that are highly innovative and are still immature [13]. Furthermore, wherever required, we have used the “comparison” form of evaluation [21], to compare our artifact with the only existing financial mechanism of cyber-insurance to mitigate the information security risks.
3. Related Work
This section is divided into three subsections, one on information security risk management, second on the financial engineering in risk management, and third on the financial instruments designed to hedge a variety of risks.
3.1. Information Security Risk Management
An information security risk management process is an iterative process. It should lead to continuous improvement in the security strength of the organization. An information security risk management process is shown in Figure 2.
The key steps in the risk management process are discussed as follows.
3.1.1. Risk Identification
The risk identification process starts with the identification of assets (tangible and intangible) in the organization, that needs to be protected from a potential threat. Thus, the identification of possible cyber-threats to the organization plays a vital role in strengthening the security strategies. A cyber-threat taxonomy can be helpful in identifying the relevant cyber-threats to the organization. A cyber-threat taxonomy is shown in Figure 3.
After completing the risk identification process, the next step is to estimate (quantify) the risk exposure.
3.1.2. Risk Estimation
Risk estimation is the process of determining the potential impact of a risk. The estimation involves estimation of potential loss and probability of occurrence of an adverse event. The risk estimation is useful in formulating the organization’s risk management strategy, deciding on investments in security controls and minimizing the impact of residual risk. The risk estimation method can be categorized into quantitative and qualitative method. Quantitative method assigns numeric values to the likelihood and impact of the risk. Also, the numeric values are assigned to the costs and benefits related to the implementation of security controls. On the other hand, the qualitative method calculates the relative values. Unlike the assignment of exact values to assets, potential losses, and cost of control in the quantitative methods, the qualitative method is usually a combination of questionnaire and workshops. The problem with the quantitative method is a lack of a standard method to effectively calculate the various numerical values. The advantage of a qualitative method is that the accurate values for the asset and cost of controls are not required. However, this non-precise (vague) values may lead to inaccurate (far from real) risk estimates.
3.1.3. Risk Response
The risk response strategies can broadly be categorized into four, as follows:
- Avoidance: This strategy involves avoiding the possible threats and attacks. The source of risk or the asset’s exposure to the risk is eliminated. This strategy is usually used in the cases where the impact of the risk is more than the benefit of having that particular asset, such as full internet connectivity to all the computer systems in the company.
- Acceptance: This strategy involves accepting the security risk and its potential impact as a cost of doing the business. This strategy is applied in the cases where the cost of implementing the security control is likely to be higher than the potential impact of the risk materialization.
- Reduction (Mitigation): This strategy aims to reduce the risk exposure by implementing the appropriate security controls, security policies and compliance with regulatory requirements. It is a primary and commonly applied risk management strategy.
- Transference: Risk transferring strategy is applied to partially transfer the risk exposure to a third party by outsourcing the security services or purchasing a cyber-insurance or taking an appropriate position in the information security financial instruments. In the light of various cyber security incidents where technical defenses failed to prevent the attacks, risk-transference strategy can play a vital role in mitigating the residual risk.
Risk response objectives and strategies are shown in Table 3.
3.2. Financial Engineering and Risk Management
The discipline that deals with the design and development of innovative financial products (instruments) is called financial engineering [23]. The financial engineering attempts to satisfy the needs of the market participants to eliminate, transfer or manage financial and/or business risks [23]. Ross et al. introduced the process of financial engineering as the one which is followed to hedge the specific identified risks that may impact the organization [24]. Thus, “Financial engineering is the process of designing and manufacturing financial products using applicable structured system processes so as to satisfy a stated need relating principally, but not exclusively, to the management of financial risks” [23]. In the last two decades, a variety of financial instruments such as interest rate future and interest rate options, stock index future, stock-index options, weather derivatives, and catastrophe derivatives, have been introduced to allow risk management.
Various researchers such as Silber [25], Van Horne [26], Ross [27], Merton [28], Allen and Gale [29], have presented frameworks for the analysis of financial innovations. The theory of financial innovations should fulfill a set of criteria [30]. Firstly, the innovation must demonstrate that the innovation is able to satisfy the particular needs, and it provides an opportunity for profit earning. Secondly, the theory should explain the cause of innovation, i.e., why did the innovation occur?
3.3. Financial Derivatives to Hedge Risks
In the following subsections several capital market based financial instruments are presented. These innovative financial instruments were proposed or developed to hedge a variety of risks. As these exotic financial instruments were either proposed or developed with the core idea of risk hedging, they closely resemble our idea of capital market based financial instruments to hedge the information security risks.
3.3.1. Macro Market
A large international trading market called “macro market” was proposed by Shiller in 1993 [31]. The objective of macro-market was to allow trading of “futures” contract on long-term claims on major components of income shared by a large number of people or by an organization. The claims in the macro-market can be compared to the “equity” in an organization. Furthermore, the dividend in macro-market would be equal to the share of national income which is comparable to the share in the profit of the company. Traders could participate in the macro-market to invest in the claims on the countries or regions and to hedge the risk in their own national income.
3.3.2. Economic Derivatives
A new type of financial instrument called “Economic Derivatives” were developed to let the people bet on the release of macro-economic data [4]. Economic derivatives are different from the macro-market contracts, as they were designed to let the market participants hedge the risk exposure to the changes in macro-economic conditions. Goldman Sachs and Deutsche Bank introduced the economic derivatives to the market in October 2002 [4]. The Commodity Futures Trading Commission of USA, in 2004, issued an exchange license to a company called “HedgeStreet” to launch the public trading in economic derivatives [5]. Hedgestreet offered the trading in capped futures and options contracts. These options were binary options contract on a variety of variables such as inflation, hurricane, mortgage rate, etc.
3.3.3. Weather Derivatives
Weather derivatives emerged as a new class of risk hedging instrument in the mid 1990’s. For the first time, the weather derivatives were publicly (over-the-counter) traded in 1997 between the Koch Industries (Wichita, KS, USA) and Enron Corporation (Houston, TX, USA) [32]. Since then the weather derivatives market have grown remarkably to the size of multibillion dollars. The weather derivatives are used to hedge the risks associated with weather events, such as temperature, rainfall, etc. [6]. The Chicago Mercantile Exchange (CME) facilitates trading in a derivatives with variety of weather events (variables) such as temperature, frost, snowfall and hurricane [33]. The entities participating in the trading of weather derivatives include a number of energy companies, ski resorts, companies in the agriculture sector, insurers, re-insurers, banks and hedge funds.
3.3.4. Electricity Derivatives
Today, electricity is bought and sold at trading exchanges by numerous market participants such as electricity generators, suppliers and marketers. The prices in the market are set by the demand and supply equilibrium. As a consequence of competition, the market participants are exposed to a variety of risks such as price risk and volumetric risks. Thus, a wide variety of financial derivatives have emerged to facilitate hedging of risks in the electricity markets [34]. These electricity derivatives allow sharing and reduction of undesired consequences through hedging strategies. Ghosh & Ramesh [35] proposed a market for the trading of electricity options. Zhang & Zhou [36] proved that options can reduce the price risk. Oum et al. [37] Oum & Oren [38] argued on the possibility of using electricity options to hedge the risks faced by the retailers. Bhanot [39] explored the use of an electricity option by large consumers to mitigate the price increase risk. Chung et al. [40] proposed a design of forward contracts bundled with options contract to mitigate electricity risks. Oren [41] developed a model to use options for the demand side risk of electricity. Spinler et al. [42] proposed an analytical framework to value the electricity options contract.
3.3.5. Cloud Computing Derivatives
Market based approach for cloud computing systems has received significant attention in the research community [43,44,45,46,47,48]. The idea of cloud services management in a market arises from the concept of variable pricing of services, such as Amazon’s Spot Instances market [49] facilitates bidding on spare CPU-hour resources. The idea of market mechanisms for cloud services is not limited to academic research indeed companies like 6fusion [50], Virtustream [50], and Zimory [50] have taken the idea to the level of commercialization.
Some researchers such as Song et al. [51], Mihailescu and Teo [52], Gomes et al. [53], and Vanmechelen et al. [54], have presented mechanisms for creation of markets and trading of resources. However, with the commodification of cloud services, comes the risk of heavy price fluctuation in the market. To address the risk of price fluctuation, Rahman [55] proposed an approach based on the financial option theory to address the risk of price variation. Bossenbroek et al. [56] proposed an option contracts based approach to deal with the price volatility in the grid resources market. Toosi et al. [57] proposed a financial option based approach to hedge the critical and risky situation in cloud resources allocation. Further, Du et al. [58] proposed an option pricing mechanism to facilitate hedging against the price risk and evaluated the effectiveness of the mechanism with respect to forward contracts. Du et al. [59] proposed a new model of dynamic forward contracts to allow efficient risk hedging in cloud computing markets. Furthermore, in an analysis of financification of cloud computing services, Kauffman et al. [60] analyzed the cloud computing services market based on the concepts and theories of financial market. Also, they identified the key elements for future development of cloud services markets on the lines of financial markets.
3.3.6. Natural Disaster Risk Management Instruments
A variety of financial instruments have been designed to mitigate the risk exposure to natural disasters. The financial instruments such as catastrophe futures, catastrophe swaps, catastrophe options, catastrophe bonds, insurance derivatives and others [7,61], are widely used to transfer (hedge) the natural disaster risk.
3.3.7. Terrorism Risk Management Instruments
4. Problem Elicitation
Currently, cyber-insurance products are the only financial instruments available in the market that facilitate transferring of information security risks to some extent. However, the cyber-insurance products come with various problems. An empirical analysis of insurability of cyber-risks is presented in [65], summarized in Table 4.
The problems in the existing cyber risk management market that are relevant to this article are discussed as follows:
- Limited Efficiency and Effectiveness of Cyber-Insurance: Cyber-insurance is the “statistical” approach to hedge the risks, and it relies on the law of large numbers. For the mechanism to work successfully, the risks covered must be reasonably independent to each other and the frequencies (estimation) must be known. All that is required for the success of insurance products is a reliable actuarial table, and a large pool of insureds to distribute the risk. However, unlike other insurance products, cyber-insurance products are designed in absence of proven actuarial tables. There is a lack of historical cyber-incidents data which limits the variety of cyber-insurance products and cyber-insurer’s are exposed to a risk of insolvency due to interconnected and high impact nature of cyber-risks. Thus, the correlated nature of cyber-risks negatively affects the efficiency and effectiveness of cyber-insurance products. The overall problem of inefficiency and ineffectiveness can be better understood in the light of following problems in the cyber-insurance products.
- Information Asymmetry: Cyber-insurance markets are inefficient and incur additional costs due to information asymmetry. The cyber-insurance products are often customized to address the specific requirements of the client, however, if the cyber-insurance buyer does not know all about the product coverage, then there is an information asymmetry between the client and the provider. This can be explained with the theory of “The Market for Lemons” proposed by George A. Akerlof [66]. Akerlof introduced “The Market for Lemons” with the question of why there is a “large price difference between new cars and those which have just left the showroom” [66]. It suggests that cyber-insurance products are a trust good, and all the coverage details are not visible to the buyer. As a buyer cannot differentiate between a “good” coverage and “less” coverage products, the product is traded at the price of “less” coverage products (and high risk) (lemons). The famous case of Sony and Zurich Insurance is a relevant example [67].In addition to the problem of lemons market, the cyber-insurance domain suffers from the problem of “adverse selection”. An adverse selection arises when the client has some relevant information and the information is not disclosed to the cyber-insurance provider, i.e., the client knows about the risk for which it wants to acquire a cyber-insurance policy. The adverse selection can be explained with the theory of “The Market for Insurance” [68].The third type of information asymmetry in the cyber-insurance field is “moral hazard”. A moral hazard arises when the buyer is purchasing a coverage based on the experience of losses. Thus, the buyer of the insurance product may have no or less incentive in mitigating the risk, instead the buyer prefers to transfer the risk to the insurer.
- Incomplete Markets: Cyber-insurance products available in the market are very limited in terms of variety of risks and their coverage [69,70]. In other words, the cyber-insurance markets do not provide an opportunity to hedge “all” (wide variety) of risks for which hedging mechanisms are required. In such a scenario, information security stakeholders have to bear the risk, or they use the less optimal mechanisms to transfer/hedge the risks [69]. This discrepancy in risk exposure and actual risk coverage is usually termed as “Basis Risk”.
- Lack of Liquidity: It is crucial to have liquid markets to achieve effective risk hedging. However, once a cyber-insurance policy is purchased, the client has no mechanism during the contract period to adjust (buy or sell) his position according to the latest risk scenario.
- High Transaction Cost: Currently, transaction costs are high in cyber-insurance and reinsurance markets. Typically, the risk is transferred through contracts, credit risk of counterparties is evaluated, and risk management systems are deployed and maintained. However, due to the interdependent and correlated nature of information security risks, the capitalization levels to support the insurance liabilities may be dramatically out of equilibrium [69,70,71].
- Regulatory Capital Requirements: Regulatory requirements, such as Solvency-II [72] require (re-)insurers to meet the capital requirements. These capital requirements and requirements to maintain a risk management system increases the cost of capital. Also, this creates barriers to entry for new entrants into the cyber-(re)insurance market.
- Counterparty Credit Risk: A counterparty to an insurance contract is exposed to the risk that its counterparty will go bankrupt during the life of the contract. In other words, an insurance cover can only be realized if the insurer is solvent when the risk is materialized. However, due to inefficient risk estimation [69,71], failure to comply with regulatory requirements [72], and simultaneous claims filed by multiple clients due to interdependent nature/materialization of risk [69,70,71], the insurer may not be able to settle all the claims.
- Lack of Data: The cyber-(re)insurance industry faces a unique challenge of lack of actuarial data. In absence of relevant historical data cyber-(re)insurer’s may not be close to actual risk probabilities and their risk assessment may either be an overestimate or an underestimate of the risk exposure, and its impact [69,71].
Thus, there is a need for novel financial instruments to address the problems mentioned above in the cyber-insurance products. Furthermore, the World Economic Forum has recognized the need of new financial products and markets, and one of its report states that “Opportunities will emerge for new businesses in insurance or risk markets to help businesses mitigate the potential downside from cyber risks” [76].
5. Requirements for Information Security Derivatives
World Economic Forum identified that risk markets were one of the two ways to deal with systemic risk in information security domain [77], shown in Figure 4. Risk markets can provide a variety of financial instruments such as indemnification, insurance, and structured risk-transfer solutions for an organization to address the information security risks [76].
An alternative to “statistical” approach of cyber-insurance is to hedge the cyber risks through an “economic” approach. The economic approach is most suited for correlated risks. The principle behind the economic hedge mechanism is the concept of negative correlation. The hedger takes a position that is correlated with the risk but in the opposite direction (negatively correlated). The economic hedge mechanism is different from the statistical hedge mechanism in a way that it does not require a large number of people. Furthermore, there is no need of an actuarial table with the frequency of the underlying event (risk). Thus instead of pooling (insurance) the risks, the risks are traded in a market (exchange or over-the-counter).
Thus, based on the problems identified in Section 4, and the review of literature on risk-hedging financial instruments [4,5,6,7,31,32,61,62,63,64,78,79] we have identified the following fourteen requirements for the information security derivatives:
- The financial instrument should allow an effective and efficient hedging mechanism for the risk exposure to the underlying information security event.The information security derivatives should perform better than the cyber-insurance products on the following properties.
- Increased information elicitation and aggregation
- Strong manipulation resistance
- Increased market products and size
- Increased scalability
- Rapid implementation
- Increased liquidity
- Reduced transaction cost
- Increased price transparency
- Reduced cost of capital
- Reduced risk to the issuer or market operator
- Reduced settlement and clearing costs
- Diversification of counterparty credit risk
- Increased data generation
A mapping of problems in cyber-insurance products and corresponding functional requirements in ISD to address the aforementioned problems is shown in Table 5.
6. Design Specifications for Information Security Derivatives
Financial economists treat the real-world financial instruments as a combination of simpler, hypothetical financial instruments [80]. These hypothetical financial instruments are designed to pay a unit of currency to the trader or investor if a particular “state” (outcome) among a set of possible “states” (outcomes) occur. These set of states are exhaustive i.e., cover all possible outcomes and the chosen states are mutually exclusive. These financial instruments are designed to isolate and break-down complex risks into distinct states. The usefulness of these hypothetical instruments is that the returns from complicated financial products can be modeled as a linear combination of the returns of these hypothetical instruments.
The traders or investors participating in the market where trading of such financial instruments takes place, can bet on the state of the product for which they may have some relevant information. Thus, a variety of such financial instruments can be traded in an ISPM to provide the fundamental building blocks for information aggregation, analysis of risks and their impact and to hedge the underlying risk.
Information security derivatives would provide a financial protection to the hedgers against the negative impact of the underlying information security event. An application scenario of ISD is shown in Figure 5.
The individuals or organizations exposed to an information security event risk would purchase a corresponding derivative with the said event being the underlying of the derivative contract. The market participants who are participating in the market to reduce their exposure to the negative impact of the occurrence of the underlying information security event are called hedgers. Apart from the individuals and organizations who are exposed to an information security risk, cyber-insurers are likely to be a major participant in ISD trading to transfer their risk to the capital market and thus enhance their insurance capacity. Traditionally, insurers purchase derivatives as a vehicle to re-insure their risk exposure. Participation in capital markets allows the insurers to adjust their risk position than with traditional reinsurance companies rapidly. Furthermore, insurers and re-insurers can also be a seller in the market. The sellers of the ISD would rely on their premiums exceeding their payouts. To achieve this, sellers write a large number of different derivatives on many low-correlated and probabilistically diverse types of information security events. This allows the sellers to hedge their risk of making a big payout on multiple high impact information security events at the same time. Furthermore, the more likely an event is to occur; higher will be the premium for the corresponding contract. Other market participants (speculators) would be attracted to the opportunity of earning profit by anticipating the direction and timing of price changes in ISD. The speculators are essential for the functioning of ISPM, as they would provide liquidity- the ability to buy and sell the contracts quickly, easily and efficiently. The category of speculators may consist of a variety of participants such as hedge funds, proprietary trading firms, banks and individual traders.
6.1. Risk Mitigation with ISD
The ISD contracts are the financial instruments that derive their values from the probability of occurrence or non-occurrence of the underlying event. Therefore, their value depends on the future events. They are a form of contractual agreement between the buyer and the seller to exchange the privileges and liabilities linked to the underlying event. There are at least two parties involved in the trading of ISD. Therefore, the accounting gains made by one party are exactly equal to the accounting losses suffered by the counterparty. This is similar to the cash settled traditional derivatives.
Let us consider an ISD contract that has two “states”, State-1 and State-2 denoted as “s1” and “s2” respectively. The total investment in the state s1 is “Ts1” and in the state s2 is“Ts2”. If the state s1 occurs then the unit payout for the same is, “Us1” as expressed in Equation (1).
Similarly, if the state s2 occurs then the unit payout for the same is, “Us2”, as expressed in Equation (2).
The unit payout for the occurrence of an event with more than two states can be calculated as expressed in Equation (3).
In the Equation (3), the state si is the state for which the unit payout “Usi” is calculated. “n” is any positive number indicating the highest number of possible states (outcomes) for the given event. The total investment in any given state is represented as “Tsi”. “Tsj” is the total investment in all the states other than the state “i”.
In the above scenario of an event with two states, if a trader invests an amount of “Is1” in state s1 and if the said state occurs, then the total payout received by the trader is, “Ps1”, as expressed in Equation (4).
If the state 2 “s2” occurs then the payout is, “Ps2”, as expressed in Equation (5).
If the trader wants to hedge his risk exposure to the occurrence of state “s2”, then the investment required for “s2” can be calculated by equating the payouts in both the states with the planned hedge trade, as expressed in Equation (6).
Solving the above equation gives the investment which the trader is required to do in state “s2”, as expressed in Equation (7).
As shown in above equations, compared to traditional derivative instruments, the calculation and implementation of hedge trades using ISD is relatively straight forward. The hedge ratio Is2 computed for a simple two state instrument can be extended for the instruments with more than two states. Further, as the set of states in ISD consist of all the possible and mutually exclusive states, the states that can occur other than in which an investment has been made by a trader can be termed as “complementary states”. The process of hedging for a multi-state event consists of two steps, as follows:
- Determine the hedge amount to be invested in the complementary states
- Distribution of the said amount among the complementary states
The first step, determining the amount of investment required in complementary states is calculated as in Equation (8).
where, IC is the amount of investment in complementary state; IH is the amount of the existing investment in states to be hedged; EIC is the existing amount invested in complementary states; and EH is the amount invested in the states that need to be hedged, exclusive of IH.
The second step, allocation of hedge investment among the complementary states is achieved by allocating IC in proportion to the existing amount already invested in each of those states.
Let us consider a four state ISD contract with the following specifications:
- There are four possible states (outcomes) of the underlying event, namely s1, s2, s3, and s4.
- The states to be hedged are s1 and s2. Thus, the complementary states are s3 and s4.
- Existing investment in each state is $40, $50, $30, and $60 respectively.
- A trader has previously invested $10 (IH) in s1 and s2.
- Allocation of $10 in s1 and s2 is proportionate to existing investment in respective states. s1 is allocated $4.444 (=10 * (40/(40 + 50))) and s2 is allocated $5.555 (=10 * (50/(40 + 50))).
- Therefore, the amounts invested in each state minus the trader’s investment is $35.555, $44.444, $30, and $60 for the states s1, s2, s3, and s4, respectively.
The investment in states s1 and s2 minus the trader’s investment, i.e., ($35.555 + $44.444) is the quantity EH defined above. Thus, according to Equation (8), the amount of investment required for complementary states (s3 and s4) is computed as in Equation (9).
The second step is to proportionately distribute the above amount between the states s3 and s4. Thus, s3 is allocated $3.749 (=11.25 * (30/(30 + 60))) and s4 is allocated $7.499 (=11.25 * (60/(30 + 60))).
Thus, the trader’s investment in the four states s1, s2, s3, and s4 is $4.444, $5.555, $3.749, and $7.499, respectively. This implies that, the total investment in each state stands at $40, $50, $33.749, and $67.499, respectively.
The unit payout for each of the four states is calculated using the Equation (3), as shown in the following equations, Equations (10) to (13).
If the state s1 occurs, then according to Equation (4) the payout to the trader is computed as in Equation (14).
If the state s2 occurs, then according to Equation (4) the payout to the trader is computed as in Equation (15).
If the state s3 occurs, then according to Equation (4) the payout to the trader is computed as in Equation (16).
If the state s4 occurs, then according to Equation (4) the payout to the trader is computed as in Equation (17).
Thus, the trader in this case is fully hedged against all the possible outcomes (states). However, with the arrival of any new relevant information during the trading period, the consensus belief (probability of event and price of contract) of traders with respect to the possible outcomes may change and thus the payouts will change. Therefore, the trader would need to re-balance his hedge position.
6.2. ISD Design Process
The process of designing and using ISDs is shown in Figure 6.
6.2.1. Identification of Security Events
The design of useful and effective ISD depends on the identification of the underlying events or conditions. The risk-hedging mechanism will depend on the occurrence of one or combination of predefined states of the underlying event. The underlying information security events that pose risk to an organization can be identified from the threat taxonomy presented in Section 3.1. Furthermore, the potential losses arising from cyber attacks and non-malicious IT failures could be categorized into 11 categories, as shown in Table 6. These loss categories can be used to identify the high impact risk events.
6.2.2. Defining States
In ISD a distribution of possible outcomes for the underlying event or conditions are partitioned into a defined range or states. In some forms of ISD, the states are mutually exclusive and collectively exhaustive, thus one state will always occur in these instruments. In ISD, the states are defined in such a way that the states form the basis of a probability distribution, such as the sum of the probabilities of all the possible outcomes is unity.
6.2.3. Types of ISD
The ISDs can be designed in at least four forms: (i) Information Security Options (ISO); (ii) Information Security Vanilla Options (ISVO); (iii) Information Security Futures (ISF); (iv) Information Security Swaps (ISS).
(i) Information Security Options: ISO are designed such that the buyer and seller agree to exchange a fixed payout linked to the occurrence of the underlying information security event or condition. In other words, the buyer of ISO is in money if the event occurs, and the seller is in money if the event does not occurs. Thus, there are only two possible outcomes (states). The payout received by the buyer and seller is same, however the price paid by the buyer and seller may be different. The difference in investment price depends on the event’s probability estimate by the market forces.
(ii) Information Security Vanilla Options: ISVO are designed as a variable payout instrument. The payment by the seller to the buyer depend on how far the underlying event results are from the payout trigger. ISVO are different from ISO in a way that the buyer pays a premium to the seller in exchange of a variable payment. However, the seller only gets the premium and is not entitled for a reciprocal right to receive a payment from the buyer in case of non-occurrence of the underlying event.
(iii) Information Security Future: ISF is a contract between two counterparties. In ISF, one counterparty pays a variable amount to the other if the underlying event occurs. For the future contract the payout will vary with the degree by which the actual result falls short or surpasses the trigger. The payout varies like in case of the ISVO, however in case of a future contract a payment from the buyer to seller is required if the underlying event does not occurs.
(iv) Information Security Swaps: A traditional swap agreement between the counterparties fixes the obligation to exchange the predefined payments over a predefined time frame in future. Similarly, the ISS would require a payment(s) to the buyer if the underlying event occurs in exchange of a payment(s) from the buyer. The amount of the payment can be variable or fixed.
(v) Bundled Information Security Derivatives: This would be a group of fixed or variable payout information security derivatives, each of which represents a mutually exclusive range of states of the underlying event, and only some of the “states” of the underlying event can occur. Furthermore, a bundle of derivatives can be designed, where the occurrence of one or more states in one or more of derivatives in the bundle is conditional upon the occurrence of one or more states in the bundle contract.
6.2.4. Pricing of ISD
The pricing of ISD would be more like the pricing of weather derivatives and economic derivatives than the standard pricing models such as Black-Scholes pricing model [82]. Like economic derivatives, the payout formula for an ISD would depend on the occurrence or non-occurrence of the underlying event, instead of variance in price of an underlying asset. Thus, the price modeling would not be based on a continuous variable with a standard distribution. In other words, the probability of (non-)occurrence of the underlying event is not a tradeable asset nor it can be linked to one. The payout from the ISD cannot be hedged through a dynamic trading strategy. Thus, the key issue in the pricing of ISD is the non-hedgeability of the payout trigger, such as a discovery of a vulnerability in a piece of software.
These issues are well-known to the option modelers. It is common to find options in exotic fixed income and credit derivatives that are modeled on directly unhedgeable variables. Some of these methods can be applied in pricing of ISD on variables that can be postulated to have known statistical or functional relationship to the underlying risk. In general, there can be three approaches to price the ISD, however they are yet to be explored by research, and briefly discussed as follows:
(i) Business Pricing: Business pricing requires the organization interested in using an ISD, to model the financial impact of an information security event across a variety of outcomes (states). Then the organization can determine the amount it is willing to pay (as premium) to protect the business against those adverse conditions (states) in case they occurred based on the output of CVaR model [83] and risk appetite of the organization. In this way, an organization can obtain a “guaranteed security” for the desired period, greatly reducing the variations in revenue and/or expenses due to an information security event. Alternatively, the counterparty seeking a certain level of return for assuming a certain level of risk can determine the price (premium) that it wants to charge to bear the expected outcome of the underlying information security event.
(ii) Actuarial (Historical) Pricing: The historical pricing method is based on the computation of future expectations. Like economic derivatives [5], the actuarial pricing method can be applied to the underlying information security variables that can be observed over time. Similar to economic variables, the information security variables cannot be bought or sold to hedge against the future payout of the derivative contract with the said variable as underlying.
Like an inflation index for economic derivatives, an information security index can be treated as a continuous variable, however as the hedge argument for the complete market does not apply, the martingale transformation cannot be used to calculate the present value of the hedge cost.
The properties of an information security variable is empirically researched to come up with parametric or numerical distribution of possible outcomes. In other words, the objective is to estimate subjective or historical means and variances, and solve for the in-the-money probability using the untransformed distribution. This would result in the following equation [5]:
where, PB is the price of the binary option (with two states), VO is the value of the option (expected payout), r is the interest rate, t is the time to expiry of the contract, Pr is the untransformed probability distribution (subjective cumulative probability of exceeding the strike), and K is the strike level.
The price is not equal to the present value of the hedge. It is the discounted value of a statistical expectation of the payoff. It is only good on average, and to the level that the distribution assumptions are right. Thus, the historical pricing mechanism may sometimes fail when there is a weak link between the probability of the underlying event and historical data or actuarial probability.
(iii) Odds-Maker Pricing: An organization might not have faced an information security event that it needs to hedge and thus the price of corresponding ISD based on an historical data is bound to be flawed. Furthermore, the counterparty may be wrong in its probabilistic estimate due to lack of relevant historical data. In such a scenario, like in economic derivatives [5], the price of the ISD would be far from the hedge considerations and it would be biased towards the odds-making balance of market forces (buyers and sellers). Thus, an informed or a near-monopolist market participant or the market-maker can use a subjective probability estimation to set the initial buy and sell prices.
This leads to price setting by the position inventory control mechanism. Sidney [84] explained the art of odds making. In his approach, the main principle is that the expected value of the “take” (net of cash received and paid for contracts sell and purchase, respectively) for the market-maker should exceed the expected liability at the expiry of the contract. This is expressed as:
where, nti is the number of contracts purchased or sold at time ti (positive if purchased and negative if sold), pti is the cash paid or received at ti. The left-hand side of the above equation is equal to the expiry value of the total payment obtained from the net options’ sales. On the other hand, the right-hand side of the equation equals to the expected total payout which the market-maker would earn at the options expiry, conditional to option being in-the-money. Since the market-maker cannot evaluate this payout expectation, inequality in the equation is purely a inventory control mechanism, without considering the market-maker’s subjective probability estimates.
6.2.5. Payout Trigger
In general, structuring an information security hedge would comprise of two components: the selection of the trigger (index) and the payoff structure for the given index. Particularly, the hedge effectiveness of information security derivatives would depend on the quality of the index in predicting losses and on the factors, such as trigger, tick size, and cap, defining the payout function. Thus, the challenge is to develop an index that meets the needs of the market participants. Ideally, the index should be easily understandable, easy to calculate, and based on verifiable data. In other words, the index should be transparent. Furthermore, the index must be calculated and settled within the shortest span of time if the underlying event occurs.
Designing a suitable information security risk index involves identification of source of the risk that the derivative contract is intended to hedge. The objective is to create information security risk indices that posses a high correlation with the risk event as this would affect the hedge effectiveness. The index must posses a high correlation with the financial impact of the information security event to be hedged. This is required to minimize the basis risk. An imperfect correlation of the index and financial impact of risk event may lead to inadequate hedging of risk impact.
An objective, consistent, transparent and rule-based computational index for information security risks can be designed in the same manner as the index for weather derivatives and stock market indices for macroeconomic models represent the market risk exposure correlation to other enterprise risks [85]. The information security risk index can be created from the data patterns of the organization’s Cyber-Value-at-Risk (Cyber-VaR) models [83] paired with the historical information, such as type of security event, frequency, loss and so on, to predict the probability and financial impact of the corresponding information security event. Furthermore, the historical information about the security event may include intra-organizational as well as industry wide information. The information security risk index can then be used as a threshold to trigger the derivatives payout.
The Gumbel’s method of exceedances [86] can be useful in predicting the number of future information security events or incidents (values) that would exceed the past values. The Gumbel method assumes that a hypergeometric stochastic process is followed for the frequency of events as expressed in Equation (20).
where, τ is the threshold (index strike), n is the total number of (information security) events, j is the total number of events above the threshold, and r is the number of future observations, Xn+1, ..., Xn+r, i.e., number of periods it would go ahead. Therefore, we can express the number of exceedances of Xτ,n among the next r observations, Xn+1, ..., Xn+r, as in Equation (21).
Let us say, the total (successful and unsuccessful) number of vulnerability exploitation in a particular smart grid system in the last one year stands at 31. Now, we need to know the probability of an event which is higher than the threshold and that would not happen in the next year. For this case, we consider the threshold as the event with highest impact. Therefore, for the software vulnerability exploitation in the given smart grid we have n = 31 (number of events recorded in the last one year), r = 1 (one year ahead), τ = 1 (number of highest impact event as threshold), and j = 0 (number of events above the threshold, i.e., the events with an impact higher than the impact of the event chosen as threshold). Using the Equation (21) and inputting the variable data we get the Equation (22).
Thus, the probability of an information security event in relation to the given smart grid system with an impact of higher than the previously recorded event in the next year is 1%. This information is critical for the pricing of ISD and setting a payout trigger for the underlying information security event.
The payout trigger in ISD must be clearly defined, correspond to a measurable or impact observable, transparent, and verifiable outcomes which occur at one of an upper and/or lower point of the defined range or state. Apart from the company specific information security risk index, other forms of payout triggers that can be used for ISDs are shown in Table 7.
6.2.6. Payout Structure
For the hedge to be most effective, all the available information about the company’s risk exposure should be considered when structuring an information security derivative to allow hedging of the underlying risk. In the structuring of derivative contract, the buyers (hedgers) and sellers both have high interest in the relationship between the premium and maximum payout. To hedge the information security risk effectively, the maximum payout is to be structured in such a way that it is adequate to cover the potential losses if the underlying information security event occurs. On the other hand, the sellers are compensated by premium payment for assuming the risk.
The payouts on ISD can be structured in a variety of ways. The payout structure depends on the underlying event or condition and on the type of ISD. A set of payout structures for ISDs are shown in Table 8.
6.2.7. Decision Criteria
The identification and specification of “standard” decision criteria and/or data sources is a critical element for the settlement and payout of contracts. The clearing house of ISPM will act as a definitive authority on the results and the decision by the authority would be based on the source(s) specified in the contracts specification. Depending upon the type of derivative contract and the underlying event or condition the source of decision could be a news article published in a previously specified media, an individual-such as security researchers or red teams, documents submitted in court of law or other legal documents, government sources/documents-such as reports or notifications from CERT, reports published by reputed consulting organizations-such as PWC, McKinsey, etc., reports published by research organizations-such as universities, etc., industry consortium, reputed organizations, regulatory bodies, and reporting made by the company to various regulatory bodies-such as securities and exchange commission, etc.
6.2.8. Specification of Derivatives
For the successful implementation and acceptance of ISD, it is must to avoid all sorts of confusion and disputes with respect to trading and settlement of contracts. Thus, the ISD contract’s specification should clearly define the underlying event or condition, trading period, payout trigger criteria, decision criteria, etc. Thus, we have identified a set of specification required for ISD, as shown in Table 9.
6.2.9. Trading of ISD
Once the ISDs are designed they can be either traded OTC or at ISPM. Trading at ISPM is the desired mode of trading to achieve market efficiency, information elicitation, transparency, lower transaction cost, higher liquidity, regulatory compliance, and manipulation resistance.
The hedger would need to estimate the dollar value of risk exposure if the underlying event of the corresponding derivative occurs. This information is crucial for the hedger to determine the number of contracts that are to be purchased to adequately hedge the risk.
7. Demonstration: An Example Application
This section is divided into four sub-sections. The first subsection demonstrates the application of an information security options contract. The second sub-section demonstrates the application of an information security vanilla options. The third sub-section demonstrates the application of an information security swap contract, and the fourth sub-section demonstrates the application of an information security futures contract.
In the following sub-sections several probabilistic estimates of information security events have been used, however the section does not attempts to compute the probability of the scenarios. Rather, it demonstrates how the financial impact of such a scenario can be hedged with information security derivatives.
7.1. Information Security Options
This subsection is divided into four parts to explain the application of ISO in hedging the impact of risk arising out of an information security event. The first part describes the scenario, second part presents the ISO specifications, third part identifies the potential market participants and their incentive to participate. Lastly in the fourth part the process of hedging with an ISO is explained.
7.1.1. Scenario
Let us consider an oil drilling and services company “O”. The company has four business units. The daily oil production at its unit-1 “U1” earns it a revenue of $20,000 per day. The company “O” has deployed sophisticated computer systems for the operation, maintenance, and security of the unit. However, if the technical defenses fail and the unit-1 suffers a major cyber-attack, such as [91,92,93,94,95,96], and the normal operations of the unit are adversely affected leading to loss of one full day’s revenue, then the company may lose upto $40,000. This potential loss of $40,000 includes one day’s revenue loss of $20,000 plus additional $20,000 in system recovery, forensics, and legal expenses. In such a scenario, the company “O” would like to reduce (mitigate) the adverse impact of a cyber-attack, through an ISO contract as explained below.
7.1.2. Contract Specification
The specifications of the ISO contract to address the risk in the given scenario is shown in Table 10.
7.1.3. Participants and Incentives
The prospective participants, their motivation and incentives for participation in trading of ISO at ISPM is shown in Table 11.
7.1.4. Risk Hedging
In the given scenario, there are two possible states of the underlying information security event for the given ISO. Thus, the event set of cyber-attack at the unit-1 consists of following two states:
- S1 = Unit-1 suffers a (pre-specified type of) cyber-attack and production at the unit is adversely affected.
- S2 = Unit-1 suffers no cyber-attack or the production at the unit is not affected.
(1) Risk Analysis and Impact Estimation
In order to devise a risk response strategy and to use the ISO contracts for impact hedging, we assume that the oil production company has done its risk analysis and impact estimation using a standard risk assessment model, such as CVaR Model [83]. The output of the CVaR model for the unit-1 of the company is as: “Given a successful cyber-attack, the unit-1 of the organization O would lose not more than $40,000 per day, for total of one day, with 50% probability during the three months period of 1 October 2015 to 31 December 2015”. Thus, if S1 occurs the company may lose upto $40,000. If S2 occurs the company continues its usual business and earns a revenue of $20,000 per day.
(2) Risk Response
Let us say, the ISO contract for the occurrence of cyber-attack at unit-1 of the company “O” is currently trading at $20 (buy) and $80 (sell). The buy and sell price of the contract indicates the market participant’s probabilistic estimate of the occurrence and non-occurrence of the underlying event [98]. Therefore, the buy price of $20 indicates that the market participants have estimated the probability of occurrence of the cyber-attack at unit-1 within the trading period as 20%. On the other hand, the market estimates 80% probability for the non-occurrence of the cyber-attack at the unit-1 during the contract trading period. This estimate is based on all the information known to the market participants (as per the efficient market hypothesis [99]). This market estimate is different from the output of CVaR model, i.e., 50% probability of cyber-attack and 50% probability of no cyber-attack at the unit-1 during the contract trading period.
In such a scenario, the first question that needs to be answered is if it is worth to hedge the risk exposure or not? This decision to hedge or not to hedge the risk can be based on the “Marking-to-Future” method [100]. The marking-to-future method gives the expected future value of the value at risk. The expected future value of the value at risk can be calculated as in Equation (23).
where, ρ is the probability of the risk event and µ is the impact value of the event.
(2.1) Unhedged Scenario
Based on the market participant’s estimate, if the oil company remains unhedged to the risk exposure to U1 then the expected future value is calculated as in Equation (24).
where, αm is the market’s expected future value (unhedged), ρs1 is the probability of s1, µu1 is the impact value (unhedged) for state 1, ρs2 is the probability of s2, µu2 is the impact value (unhedged) for state 2.
The expected future value from the market’s perspective in an unhedged scenario is shown in Figure 7, and calculated as shown in Equation (25).
On the other hand, the expected future value based on the company’s CVaR model in an unhedged scenario can be calculated as shown in Equation (26).
where, αc is the expected future value (unhedged) based on the CVaR model, ρs1 is the probability of s1, µu1 is the impact value (unhedged) for state 1, ρs2 is the probability of s2, and µu2 is the impact value (unhedged) for state 2.
The expected future value from the company’s perspective in an unhedged scenario is shown in Figure 8, and calculated as shown in Equation (27).
Thus, in the unhedged scenario there is a large variance between the expected future value by market participants (+$8000) and the expected future value as per the CVaR model (−$10,000).
(2.2) Hedged Scenario
If the company decides to hedge its maximum risk exposure of $40,000, then the company needs to determine the number of ISO contracts they need to purchase. This can be determined by hedge ratio [83], expressed as in Equation (28).
where, θ denotes the hedge ratio. λ is the risk exposure due to an information security event, this risk exposure is estimated from the Cyber-VaR model. ω is the number of contracts of the financial instrument that are to be purchased to hedge the estimated risk. These financial instruments have the corresponding (that needs to be hedged) information security event as the underlying. ϕ is the payout per contract that will be received by the hedger when the underlying information security event occurs. γ is the transaction cost incurred (estimated) on the purchase of hedge position. This transaction cost also includes other indirect costs, such as cost of capital, interest rates, etc.
Thus, to perfectly hedge the risk exposure of $40,000, number of ISO contracts required are computed as shown in Equation (29).
For the sake of simple demonstration, we ignore the cost of transaction (interest rate, exchange fee, cost of capital, etc.).
As shown in Equation (30), with the payout of $100 per contract, the company needs to purchase 400 ISO contracts to perfectly hedge its risk of $40,000.
In the given scenario, to hedge the risk exposure with ISO contracts, an ex-ante assessment of effectiveness of the hedge is computed as shown in Equation (31) [83].
where, εd denotes the hedge effectiveness of information security derivatives, λ is the estimated or materialized risk impact, γ is the estimated or actual cost of hedging, and ηd is the expected or actual total payout from the information security derivative contracts.
As computed in Equation (32), the above hedge strategy with ISO is expected to be 83.34% effective in mitigating the underlying information security risk. In the above equation γ is $8000 paid to purchase 400 ISO contracts at the rate of $20 per contract. Other costs such as interest rate, cost of capital, etc. are ignored.
In the perfectly hedged scenario, the expected future value from the market participant’s perspective can be calculated as shown in Equation (33).
where, βm is the market’s expected future value (hedged), ρs1 is the probability of s1, µh1 is the impact value (hedged) for state 1, ρs2 is the probability of s2, and µh2 is the impact value (hedged) for state 2.
In the perfectly hedged scenario, the expected future value from the market participant’s perspective is shown in Figure 9, and calculated as in Equation (34).
- µh1 = −$8000 (=−$40,000 loss + $40,000 payout from 400 ISO contracts − $8000 paid to purchase 400 ISO contracts).
- µh2 = $12,000 (=$20,000 revenue earned − $8000 (=$20 * 400) cost of 400 ISO contracts)
The hedged expected future value based on the company’s CVaR model can be calculated as shown in Equation (35).
where, βc is the company’s expected future value (hedged), ρs1 is the probability of s1, µh1 is the impact value (hedged) for state 1, ρs2 is the probability of s2, and µh2 is the impact value (hedged) for state 2.
In the perfectly hedged scenario, the expected future value from the company’s perspective is shown in Figure 10, and calculated as in Equation (36).
- µh1 = −$8000 (−$40,000 loss + $40,000 payout from 400 ISO contracts − $8000 paid to purchase 400 ISO contracts).
- µh2 = $12,000 ($20,000 revenue − $8000 (=$20*400) cost of 400 ISO contracts.
So, even if the hedger’s probability estimates are wrong and market’s probability estimates are correct, the hedger may still like to hedge the risk to minimize the variance in the potential impact (expected future value) of the underlying information security event.
In the given scenario, when the risk exposure has been hedged with an ISO contract, the ex-post performance of the hedge strategy (hedge efficiency) can be calculated as shown in Equation (37) [83].
where, Υe is the hedge efficiency, ξ is the expected or materialized impact of the risk event, γ is the expected or actual cost of hedging, and ηd is the expected or actual payout from the information security derivative contracts.
A value above or below the zero for Υe indicates over or under hedging. Since, the Υe obtained from the above equation is −20%, the hedge strategy is 20% less efficient than the perfect hedge strategy.
7.2. Information Security Vanilla Options
This subsection is divided into four parts to explain the application of ISVO in hedging the impact of an information security risk. The first part describes the scenario, second part presents the ISVO specifications, third part identifies the potential market participants and their incentive to do so. Lastly, in the fourth part the process of hedging with an ISVO is explained.
7.2.1. Scenario
Let us say a company “C” is in the business of providing cloud based services to its multinational clients. If the company suffers a cyber-attack (such as DDoS), such as [101,102,103], and its services are unavailable for some time then the company would suffer a major financial and reputational loss. The company estimates that an unavailability of services would cost $10,000 per hour.
7.2.2. Contract Specifications
The specifications of an ISVO contract to address the risk in the given scenario is shown in Table 12.
7.2.3. Participants and Incentives
The prospective participants, their motivation and incentives for participation in trading of ISVO at ISPM is shown in Table 13.
7.2.4. Risk Hedging
To demonstrate the application of ISVO, we consider only three states of the risk event in the given scenario. The three states are as follows:
- S1 = C does not suffers a cyber-attack in the trading period or its services are not adversely affected if attacked.
- S2 = C suffers a cyber-attack and its services are unavailable for 1 h.
- S3 = C suffers a cyber-attack and its services are unavailable for 3 h.
(1) Risk Analysis and Impact Estimation
We assume that the company “C” has completed its risk analysis and impact assessment. The company’s estimate based on the CVaR model is as, probability of no cyber-attack or no adverse impact is 50%, probability of service unavailability for one hour due to a cyber-attack as 30%, and probability of service unavailability for three hours due to a cyber-attack as 20%. Furthermore, if S1 occurs there is no loss to the company “C”. If S2 occurs the company may lose $10,000, as estimated by it. If S3 occurs the company may lose $30,000.
(2) Risk Response
In the given scenario, the cloud service provider may choose to hedge the risk by purchasing ISVO contracts. The buyer can buy an ISVO contract at $30 per option and the contract pays $100 per contract for each one hour of service unavailability and pays nothing if the company’s services are not adversely affected by a cyber-attack.
The current market price for the three states of the ISVO indicate that the market estimates the probability of no cyber-attack or no adverse impact of the attack as 60%, unavailability of the services for one hour as 30%, and unavailability of services for three hours as 10%.
(2.1) Unhedged Scenario
Based on the market’s probability estimate for the three states, the expected future value for the company in an unhedged scenario can be calculated as shown in Equation (39).
where, αm is the market’s expected future value (unhedged), ρs1 is the probability of s1, µu1 is the impact value (unhedged) for state 1, ρs2 is the probability of s2, µu2 is the impact value (unhedged) for state 2, ρs3 is the probability of s3, and µu3 is the impact value (unhedged) for state 3.
The expected future value from the market’s perspective in an unhedged scenario is shown in Figure 11, and calculated as shown in Equation (40).
Based on the company’s risk estimate the expected future value in an unhedged scenario can be calculated as shown in Equation (41).
where, αc is the company’s expected future value (Unhedged), ρs1 is the probability of s1, µu1 is the impact value (unhedged) for state 1, ρs2 is the probability of s2, µu2 is the impact value (unhedged) for state 2, ρs3 is the probability of s3, and µu3 is the impact value (unhedged) for state 3.
The expected future value from the company’s perspective in an unhedged scenario is shown in Figure 12, and calculated as shown in Equation (42).
Thus, if the company remains unhedged then it would suffer a significant loss if the ISVO underlying information security event occurs.
(2.2) Hedged Scenario
If the company decides to hedge its maximum risk exposure of $30,000, then the first step is to determine the number of ISVO contracts that are required to perfectly hedge the risk exposure. We use the Equation (28) to calculate the required number of ISVO contracts. Thus, to perfectly hedge the risk exposure of $30,000, number of ISVO contracts required are computed in Equation (43).
For the sake of clarity and simple demonstration, we ignore the cost of transaction and the Equation (44) gives the number of ISVO contracts required to hedge $30,000 loss.
Thus, the hedger would pay $3000 to purchase 100 ISVO contracts at the rate of $30 per ISVO, ignoring the other costs such as exchange fee, cost of capital, etc.
We use the Equation (31) to do an ex-ante assessment of hedge effectiveness, as shown in Equation (45).
Therefore, the above hedge strategy with ISVO is expected to be 90.91% effective in mitigating the underlying information security risk.
In a perfectly hedged scenario the expected future value from the market’s perspective can be calculated as shown in Equation (46).
where, βm is the market’s expected future value (hedged), ρs1 is the probability of s1, µh1 is the impact value (hedged) for state 1, ρs2 is the probability of s2, µh2 is the impact value (hedged) for state 2, ρs3 is the probability of s3, and µh3 is the impact value (hedged) for state 3.
The expected future value from the market’s perspective in a hedged scenario is shown in Figure 13, and calculated as shown in Equation (47).
- µh1 = $0 loss due to no cyber-attack − $3000 cost to buy 100 ISVO contracts.
- µh2 = −$10,000 loss due to unavailability of services for one hour + $10,000 payout from 100 ISVO contracts − $3000 cost of purchasing 100 ISVO contracts.
- µh3 = −$30,000 loss due to unavailability of services for three hours + $30,000 payout from the 100 ISVO contracts − $3000 cost of purchasing 100 ISVO contracts.
In a perfectly hedged scenario, the expected future value based on the probability estimates obtained from the company’s CVaR model can be calculated with the Equation (48).
where, βc is the company’s expected future value (hedged), ρs1 is the probability of s1, µh1 is the impact value (hedged) for state 1, ρs2 is the probability of s2, µh2 is the impact value (hedged) for state 2, ρs3 is the probability of s3, and µh3 is the impact value (hedged) for state 3.
The expected future value from the company’s perspective in a hedged scenario is shown in Figure 14 and calculated as shown in Equation (49).
- µh1 = $0 loss due to no cyber-attack − $3000 cost to buy 100 ISVO contracts.
- µh2 = −$10,000 loss due to unavailability of services for one hour + $10,000 payout from 100 ISVO contracts − $3000 cost of purchasing 100 ISVO contracts.
- µh3 = −$30,000 loss due to unavailability of services for three hours + $30,000 payout from the 100 ISVO contracts − $3000 cost of purchasing 100 ISVO contract.
Thus, even if the buyer’s probability estimates are wrong and the seller’s probability estimates are correct, the investor may still like to hedge the risk to minimize the variance in the impact. In such a scenario, the maximum possible loss and the variance of actual impact on the company is less with hedging.
The ex-post assessment of ISVO hedge strategy (hedge efficiency) in reducing the loss can be calculated from the Equation (37) as shown in Equation (50).
A hedge efficiency of −10% indicates that the hedge strategy is 10% less efficient than a perfect hedge strategy.
7.3. Information Security Swaps
This subsection is divided into four parts to explain the application of ISS in hedging the adverse impact of an information security event. The first part describes the scenario, second part presents the ISS specifications, third part identifies the potential market participants and their incentive to do so. Lastly in the fourth part the process of hedging with an ISS is explained.
7.3.1. Scenario
Let us say a company “S” is in the business of providing satellite services to a large number of clients in the field of weather statistics, GPS, etc. in one particular country. If the satellite system of the company is attacked by the cyber-army of an enemy nation, such as [104,105,106,107,108,109], and the services offered by the company are unavailable for few days then the company will suffer a major financial and reputational damage. Also, the cyber-attackers may try to hijack the satellite and the company “S” may permanently lose its control over the satellite.
7.3.2. Contract Specification
The ISS specifications for a contract to address the risk in the given scenario is shown in Table 14.
7.3.3. Participants and Incentives
The prospective participants, their motivation and incentives for participation in trading of ISS at ISPM or Over-the-counter (OTC)is shown in Table 15.
7.3.4. Risk Hedging
In the given scenario, the ISS is designed to let the satellite communication company transfer its risk to the counterparties who are willing to take the risk in the expectation of earning some profit. The counterparty in this case is a group of several entities, each with a limited potential liability. In the given scenario, there are two types of risk events, namely service unavailability for a limited period and hijacking of the satellite leading to permanent loss of the same. Thus, the possible states of the events are as shown in Table 16.
The state S1 occurs when there is no cyber-attack or no service disruption. S2 occurs when a cyber-attack occurs and the satellite services are temporarily disrupted but the satellite system is not hijacked. S3 occurs when there is no temporary service disruption but the satellite system is hijacked leading to permanent loss. S4 occurs when the cyber-attack causes temporary service disruption before the system is hijacked leading to permanent loss.
(1) Risk Analysis and Impact Estimation
We assume that these “state” risks have been modeled and the outcome of the CVaR model for the company is as shown in Table 17.
On the other hand, the counterparty’s (seller’s) estimate the risk probability and impact as shown in Table 18.
(2) Risk Response
In the given scenario, the satellite services provider may chose to hedge the risk by purchasing a swap contract. The swap contract is structured such that the counterparty would pay the amount of loss, or $500,000, whichever is lower. If the state S1 occurs, then no payout is required from the seller (counterparties) to the buyer (satellite services company). However, if any of the state S2, S3, S4 occur then the counterparty would pay a fixed amount to the buyer. The satellite services provider is required to pay a premium of 2% of the maximum possible payout ($500,000) to the counterparties. This premium is paid at the time of ISS purchase.
(2.1) Unhedged Scenario
In an unhedged scenario, the company’s expected future value can be calculated as shown in Equation (51).
where, αc is the company’s unhedged expected future value, ρs1 is the probability of s1, µu1 is the impact value (unhedged) for state 1, ρs2 is the probability of s2, µu2 is the impact value (unhedged) for state 2, ρs3 is the probability of s3, µu3 is the impact value (unhedged) for state 3, ρs4 is the probability of s4, and µu4 is the impact value (unhedged) for state 4.
The expected future value from the company’s perspective in an unhedged scenario is shown in Figure 15, and calculated as shown in Equation (52).
The counterparty’s (seller’s) expected future value in an unhedged scenario can be expressed as in Equation (53).
where, αs is the company’s unhedged expected future value, ρs1 is the probability of s1, µu1 is the impact value (unhedged) for state 1, ρs2 is the probability of s2, µu2 is the impact value (unhedged) for state 2, ρs3 is the probability of s3, µu3 is the impact value (unhedged) for state 3, ρs4 is the probability of s4, and µu4 is the impact value (unhedged) for state 4.
The expected future value from the counterparty’s perspective in an unhedged scenario is shown in Figure 16, and calculated as shown in Equation (54).
Thus, if the satellite service provider remains unhedged and the satellite services are interrupted due to a cyber-attack then the company would suffer a significant financial loss, $97,500 (company’s expected future value), $53,000 (counterparty’s expected future value).
(2.2) Hedged Scenario
If the satellite service provider enters into a swap contract to cover the risk upto $500,000, then the company is perfectly hedged for the impact upto $500,000. We demonstrate and assess the application of ISS for an impact of $500,000. Therefore, using Equation 28 the hedge ratio for the company in the given scenario is 1.
In the above equation, we have ignored the premium paid for the ISS to emphasize that the one ISS contract is sufficient to cover the impact upto $500,000. If premium cost, $10,000 (2% of $500,000) is taken into consideration the ω value will be a fractional value, however as the ISS is not divided into several smaller value contract, the ISS can only be purchased as one contract to cover the underlying risk.
Therefore, as shown in Equation (56), with the maximum payout of $500,000 per contract, the company needs to purchase only one ISS contract to perfectly hedge its risk impact of $500,000.
We use the Equation (31) to do an ex-ante assessment of hedge effectiveness, computed as in Equation (57).
Thus, the hedge strategy formed with ISS contract is expected to be 98.04% effective in mitigating the impact of an information security event adversely affecting the services of the satellite company.
In a perfectly hedged scenario, the expected future value (hedged) from the counterparty’s perspective can be calculated as shown in Equation (58).
where, βs is the expected future value (hedged) from the seller’s (counterparty’s) perspective, ρs1 is the probability of s1, µh1 is the impact value (hedged) for state 1, ρs2 is the probability of s2, µh2 is the impact value (hedged) for state 2, ρs3 is the probability of s3, µh3 is the impact value (hedged) for state 3, ρs4 is the probability of s4, and µh4 is the impact value (hedged) for state 4.
The expected future value from the seller’s perspective in a hedged scenario is shown in Figure 17, and calculated as shown in Equation (59).
- µh1 = $0 loss due to no cyber-attack − $10,000 paid for the premium.
- µh2 = −$150,000 loss due to cyber-attack + $150,000 payout from ISS contract − $10,000 paid for the premium.
- µh3 = −$350,000 loss due to cyber-attack + $350,000 payout from ISS contract − $10,000 paid for the premium.
- µh4 = −$500,000 loss due to cyber-attack + $500,000 payout from ISS contract − $10,000 paid for the premium.
In a perfectly hedged scenario, the expected future value from the satellite company’s perspective can be calculated with the Equation (60).
where, βc is the satellite company’s (buyer’s) expected future value (hedged), ρs1 is the probability of s1, µh1 is the impact value (hedged) for state 1, ρs2 is the probability of s2, µh2 is the impact value (hedged) for state 2, ρs3 is the probability of s3, µh3 is the impact value (hedged) for state 3, ρs4 is the probability of s4, and µh4 is the impact value (hedged) for state 4.
The expected future value from the satellite company’s perspective in a hedged scenario is shown in Figure 18, and calculated as shown in Equation (61).
- µh1 = $0 loss due to no cyber-attack − $10,000 paid for the premium.
- µh2 = −$150,000 loss due to cyber-attack + $150,000 payout from ISS contract − $10,000 paid for the premium.
- µh3 = −$350,000 loss due to cyber-attack + $350,000 payout from ISS contract − $10,000 paid for the premium.
- µh4 = −$500,000 loss due to cyber-attack + $500,000 payout from ISS contract − $10,000 paid for the premium.
Thus, even if the buyer’s probability estimates are wrong and the seller’s probability estimates are correct, the investor may still like to hedge the risk to minimize the variance in the impact. In such a scenario, the maximum possible loss and the variance of actual impact on the company is less with hedging.
The ex-post hedge efficiency of ISS in reducing the loss in state S4 (state with maximum possible loss) can be calculated from the Equation (37) as shown in Equation (62).
where, we have considered the premium paid as the cost of hedge and other associated costs, such as interest rate, etc. have been ignored.
A hedge efficiency of −2% indicates that the hedge strategy is 2% less efficient than the perfect hedge strategy.
7.4. Information Security Futures
This subsection is divided into four parts to explain the application of ISF in hedging the impact of an information security risk. The first part describes the scenario, second part presents the ISF specifications, third part identifies the potential market participants and their incentive to do so. Lastly in the fourth part the process of hedging with an ISF is explained.
7.4.1. Scenario
Let us say a car manufacturer “M” has planned to launch a new car with various electronic features such as electronic locks, immobilizers, etc. However, some industry leaders and cyber-security experts some concerns about the software vulnerabilities in the system that may lead to car hacking and hijacking, such as [110,111,112,113]. If the car manufacturer fails to address these security issues than the company would suffer a major reputational and revenue loss. The company expects to sell at least 10,000 cars between the period of 1 January 2016 to 31 December 2016. Furthermore, to break even the company needs to sell at least 10,000 cars. The company is expected to earn a profit of $150,000 for each 1000 cars sold above the 10,000 cars. On the other hand, the company will suffer a loss of $100,000 for each 1000 cars falling short of 10,000 cars.
To address the problems of trust deficit and information asymmetry between the buyer and car manufacturer, and keeping in mind the prospective large market for cars with automatic and electronic features, an industry regulatory body has decided to test the security strength of the electronic lock and immobilizer system in an open environment. The industry regulator has listed a vulnerability discovery contract at ISPM. The car manufacturer contests that the electronic systems in the car has strong security and has no major vulnerabilities. If two or less vulnerabilities are found in the system, then the company can quickly fix the vulnerabilities before the car is launched and the company does not suffer any reputational and revenue loss. On the other hand, if more than two vulnerabilities are found in the system then the company may not be in a position to fix them all before the car launch and thus the company’s reputation will go down. This loss of reputation will be reflected in the number of cars sold and the company may fall short of the target of selling at least 10,000 cars by the end of 31 December 2016.
7.4.2. Contract Specification
The specifications for an ISF contract to address the risk in the given scenario is shown in Table 19.
7.4.3. Participants and Incentives
The prospective participants, their motivation and incentives for participation in trading of ISF at ISPM is shown in Table 20.
7.4.4. Risk Hedging
The car manufacturer can hedge its risk, i.e., the software vulnerabilities leading to car sales falling short of 10,000, by entering into a “futures” contract with a counterparty. In the given scenario, there are many possible state of events, ten events for every 1000 cars falling short of strike of 10,000 cars and “k” number of states for every 1000 cars sold above the strike of 10,000 cars. For the demonstration, we consider the three possible states of events, as shown in Table 21.
(1) Risk Analysis and Impact Estimation
We assume that these “state” risks have been modeled and the outcome of the CVaR model for the company is as shown in Table 22.
On the other hand, the market (other participant’s) estimates the risk probability and impact as shown in Table 23.
(2) Risk Response
In the given scenario, the car manufacturer may decide to hedge the risk by purchasing the futures contracts. The future contract is structured such that the counterparty pays $1000 to the buyer (car manufacturer) for every 1000 cars which fall short of the strike value and the investor pays $1000 to the counterparty for each 1000 cars which exceeds the strike value.
(2.1) Unhedged Scenario
Based on the market’s probability estimate for the three states, the expected future value for the company in an unhedged situation can be calculated as shown in Equation (63).
where, αm is the market’s expected future value (unhedged), ρs1 is the probability of s1, µu1 is the impact value (unhedged) for state 1, ρs2 is the probability of s2, µu2 is the impact value (unhedged) for state 2, ρs3 is the probability of s3, and µu3 is the impact value (unhedged) for state 3.
The expected future value from the market’s perspective in an unhedged scenario is shown in Figure 19, and calculated as in Equation (64).
Based on the company’s risk estimate the expected future value in an unhedged scenario can be calculated as shown in Equation (65).
where, αc is the company’s expected future value (Unhedged), ρs1 is the probability of s1, µu1 is the impact value (unhedged) for state 1, ρs2 is the probability of s2, µu2 is the impact value (unhedged) for state 2, ρs3 is the probability of s3, and µu3 is the impact value (unhedged) for state 3.
The expected future value from the company’s perspective in an unhedged scenario is shown in Figure 20, and calculated as shown in Equation (66).
Thus, in an unhedged scenario the company may suffer significant financial loss due to cyber-attack.
(2.2) Hedged Scenario
If the company decides to hedge its risk exposure to the state S2, i.e., a loss of $100,000. The first step is to determine the number of ISF contracts that are required to perfectly hedge the risk exposure. We use the Equation (28) to calculate the required number of ISF contracts. Thus, to perfectly hedge the risk exposure of $100,000, number of ISF contracts required are as follows:
For the sake of clarity and simple demonstration, we ignore the cost of transaction in the above calculation.
If the current price of the futures contract is $55, the cost to purchase 100 futures contract is $5500. We use the Equation (31) to do an ex-ante assessment of hedge effectiveness, as computed in Equation (69).
Therefore, the above hedge strategy with ISF is expected to be 94.79% effective in mitigating the underlying information security risk.
In a perfectly hedged scenario the expected future value from the market’s perspective can be calculated as shown in Equation (70).
where, βm is the market’s expected future value (hedged), ρs1 is the probability of s1, µh1 is the impact value (hedged) for state 1, ρs2 is the probability of s2, µh2 is the impact value (hedged) for state 2, ρs3 is the probability of s3, and µh3 is the impact value (hedged) for state 3.
The expected future value from the market’s perspective in a hedged scenario is shown in Figure 21, and calculated as shown in Equation (71).
- µh1 = $0 loss − $5500 cost to buy 100 ISF contracts.
- µh2 = −$100,000 loss due to 1000 cars sold less than the strike + $100,000 payout from 100 ISF contracts − $5500 cost of purchasing 100 ISF contracts.
- µh3 = +$150,000 profit due to 1000 cars sold over the strike − $100,000 payout to the counterparty − $5500 cost of purchasing 100 ISF contracts.
In a perfectly hedged scenario, the expected future value based on the probability estimates obtained from the company’s CVaR model can be calculated with Equation (72).
where, βc is the company’s expected future value (hedged), ρs1 is the probability of s1, µh1 is the impact value (hedged) for state 1, ρs2 is the probability of s2, µh2 is the impact value (hedged) for state 2, ρs3 is the probability of s3, and µh3 is the impact value (hedged) for state 3.
The expected future value from the company’s perspective is shown in Figure 22 and calculated in Equation (73).
- µh1 = $0 loss − $5500 cost to buy 100 ISF contracts.
- µh2 = −$100,000 loss due to 1000 cars sold less than the strike + $100,000 payout from 100 ISF contracts − $5500 cost of purchasing 100 ISF contracts.
- µh3 = +$150,000 profit due to 1000 cars sold over the strike − $100,000 payout to the counterparty − $5500 cost of purchasing 100 ISF contracts.
Thus, even if the buyer’s probability estimates are wrong and the seller’s probability estimates are correct, the car manufacturer may still like to hedge the risk to minimize the variance in the impact. In such a scenario, the maximum possible loss and the variance of actual impact on the company is less with hedging.
The ex-post hedge efficiency of ISF in mitigating the risk can be calculated from the Equation (37) as shown in Equation (74).
A hedge efficiency of −5.5% indicates that the hedge strategy is 5.5% less efficient than a perfect hedge strategy.
8. Evaluation
The artifact evaluation consists of three sub-activities [13]. The first activity “analyze context”, analyzes and describes the context of evaluation. The second, “select goals and strategy”, is not only about deciding the goals and strategy for the evaluation but also about the selection of research strategy and methods. The third sub-activity, designs the evaluation study and then executes the same. Figure 23 shows the artifact (ISD) evaluation process.
8.1. Analyze Context
The first sub-activity is “Analyze Context”, and it primarily identifies the constraints in the evaluation environment [13]. The main constraints in the evaluation of ISD are the technological, financial, legal and time constraints.
8.2. Select Goals and Strategy
The second sub-activity “Select Goals and Strategy” is based on the evaluation context. The goals selected are to evaluate the ISD against the identified requirements, and its usefulness in addressing the previously identified problems, using formative evaluation. One of the six evaluation types stated in [21] is “Comparison”. It implies that the artifact is not evaluated in isolation indeed it is studied in comparison to other artifacts meant for the same or similar purpose. Therefore, where necessary, we have compared our artifact with cyber-insurance products. The evaluation strategy selected is artificial and ex-ante. The ISD is evaluated using an “informed argument” (logical reasoning) method. The formative evaluation is chosen because the results of the evaluation may lead to several iterations before the design and implementation of ISD is finalized.
The alternate evaluation methods such as empirical and experimental studies could not be adopted for this paper, primarily for the following reasons:
- Lack of relevant historical data.
- Availability of limited time for this study.
- Availability of limited resources, such as limited availability of vulnerability information, market participants, etc.
- The underlying security events may not occur during the experiment period.
- Participants may not have any information relevant to the underlying event.
- Participants would not have their skin in the game, i.e., they would not suffer the consequences of revealing incorrect information or market manipulation.
- The limited size of participants would lead to very thin markets, i.e., liquidity issues.
- Listed contracts and participants may have a bias due to limited period study.
- Lack of knowledge on legal aspects of running an information security prediction market.
8.3. Carry out Evaluation
This section evaluates the artifact against the requirements identified in Section 5.
8.3.1. Improved Information Aggregation
The ISDs are designed to be traded at ISPM, to provide a risk hedging/management mechanism that facilitates incorporation of any new information available to the traders. The mechanism will allow the traders to dynamically hedge/adjust their positions based on the new information. Thus, the mechanism will provide an efficient aggregation of information related to the underlying event or condition. The implied probability of the possible outcome will be reflected in the market prices. Also, the market prices carry the information from more informed to less informed traders. Thus, the receivers of the new information will revise their positions accordingly. This process leads to the convergence of belief of the trader on the potential outcome of the underlying event. Therefore, the market prices reflect the mean belief of the traders and are interpretable as the probability of the occurrence of the underlying event.
For the efficient and effective functioning of ISPM (trading of ISD), it is desired that the traders truthfully and immediately reveal their private information. However, achievement of information elicitation and aggregation goal in ISPM depends on the strategic behavior of self-interested participants. The behavior of market participants is influenced by their private information, their expectation about other’s private information, and conflicting incentives between the market participants. Specifically, the pricing mechanism of market acts as a coordinator of traders’ actions in the market, leading to the incorporation of the information in the contract prices. The value of the “new” information is time-sensitive in nature, i.e., the potential of making a profit from the information is only until nobody else has traded on the information and signaled the same to other market participants. This creates an incentive for the traders to “quickly” discover new information and trade on that in the market, thus leading to quick aggregation of new information.
Slamka et al. reported that on average the new information was incorporated in less than ninety seconds, leading to increase in predictive accuracy of the market [114]. Wolfers and Zitzewitz also reported that the markets quickly respond to new information, leaving very few arbitrage opportunities [115]. Chen et al. experimentally studied the prediction market equilibrium and reported [116]: (i) prediction markets are guaranteed to converge to an equilibrium price, representing a consensus among the traders; (ii) they converge to equilibrium in at most “n” rounds of trading, where “n” stands for the number of traders; (iii) the best possible predictions it can make is the direct communication equilibrium when contract’s market price is equal to the expectation of the value of the function of all the information of all the market participants; but (iv) a prediction market is not guaranteed to converge to the best possible predictions. Thus, by well-established and proven efficient market hypothesis [117], previously discussed literature and numerous other relevant studies, we expect the ISPM to act as an effective and efficient mechanism of information elicitation and aggregation.
To the best of our knowledge, currently there are three methods to measure information aggregation efficiency. One model compares the transaction prices with the competitive equilibrium price of the contract [118]. The competitive equilibrium price implies to the reward when all the private information is aggregated and is reflected in the contract price. Therefore, the information aggregation efficiency is higher when there is a small difference between the transaction price and the competitive equilibrium price of the contract. Though, the measurement indicates the robust ability of prediction markets in aggregating the information, it cannot be used in a real business environment. In a real business environment, the certainty and availability of private information are not ensured, and the outcome of the future event is unknown.
The second method compares the traders’ average estimation of a future outcome before the market opens with the actual results [119]. The closeness between the two results indicates higher efficiency in information aggregation. As a prediction market forecast reflects the consensus of traders’ belief, the comparison between the two measurements, thus indicates the extent to which the market captures the consensus of traders’ estimates. However, the method ignores the fact that information aggregation is a continuous process, where traders keep learning while trading and they bring new information to the market [119,120,121,122]. Therefore, traders’ current average estimate does not reflect their consensus after learning. Alternatively, the traders’ average estimate of the future outcome can be collected at the end of the trading in the contract, after the learning process. However, practically, it is not ensured that at least most, if not all of the traders will truthfully submit their personal estimates. Secondly, current market participants may leave, and new ones may come to the market. Therefore, it is impossible to measure information aggregation efficiency until the end of the trading in the contract.
The third method is based on the comparison between the transaction price and the dynamic equilibrium price of the contract [123]. A trader’s transaction and orders to buy and sell a contract indicate his/her estimate of the possibility of the future outcome. If there is no difference between traders’ estimated value of a contract, then no contract will be traded. The equilibrium price of a contract obtained from the demand and supply curve of the contract, represent the consensus of market participants on the probability estimate of the future outcome of the underlying event. A demand curve of the contract is obtained from all the buy orders of the contract, and a supply curve is obtained from all the sell orders of the contract. Then, the equilibrium price is identified as the price at which the contract’s demand and supply are equal. Furthermore, the equilibrium price remains unchanged in the absence of any external influence. The equilibrium price keeps evolving with the learnings of traders’ and development of the market. Thus, this is reflected as the dynamic equilibrium price.
8.3.2. Manipulation Resistant
The ultimate aim of information elicitation and aggregation is to assist and improve the decision-making process. However, if the decisions are to be made by the information conveyed by ISPM, some market participants may have incentives to manipulate the ISD prices to achieve their desired outcomes. Shi et al. examined the settings where traders in a prediction market may have an ability to influence the outcome [124]. They showed how to derive scoring rules that do not incentivize the traders to take undesirable actions. However, information elicitation is not explicitly used for decision making. Dimitrov and Sami investigated the incentives problem when there is two markets (contract) for different but related events [125]. They explained the prediction markets manipulations as an effect of conflicting incentives and modeled a situation where a trader’s behavior in one market (contract) could influence the trading decision of another trader in a second market (contract). In the given situation, the payoff from the first market (contract) is not dependent on the decisions made traders in the second market (contract), but the first trader gets the direct benefit from the decisions made by other traders. As similar conflicting incentive situations can occur in ISPM as well; the ISD prices and ISPM are exposed to such manipulations.
Furthermore, like in other prediction markets, the traders trading ISD in ISPM may have “favorite long short bias” and may create “speculative bubbles”. A favorite long short bias occurs when traders overestimate the probability of unlikely event outcomes and underestimate the probability of very likely outcomes, thus reflected in market prices. A speculative bubble may occur when a large size and number of trades drive up the instrument price without any justified information. These bubbles may falsely signal the occurrence or non-occurrence of the underlying event in the future. As this happens in other asset markets, there is no reason to believe that ISD and ISPM will be immune to this. However, strict regulations and adequate compliance policy can minimize its impact.
On the other hand, Rhode and Strumpf reported that attempts to manipulate prediction and betting markets generally failed [126]. Further, they reported that beyond a short period, it becomes different and expensive to manipulate prediction markets. Moreover, Hanson and Opera reported that an attempt to manipulate the market price can create additional liquidity in the market and can be a substitute of traders’ irrationality to produce information (prediction) market equilibrium [127]. As the ISPM will be a regulated market with strict policy of trader verification and fixed trading limits assigned according to their risk profile, the traders in ISPM will have limited capital to attempt price manipulation. This price manipulation attempt will be a source of additional liquidity and rational traders with soon attempt to correct the market price. Thus, the scope and impact of manipulation in ISPM is limited in nature.
8.3.3. Increased Market Products and Size
The trading of ISD at ISPM will enable a well-functioning market for information security risk events. The market will enable the traders to hedge their risk exposure against the underlying events that are not easily hedgeable or where cyber-insurance products are unavailable or inefficient. An ISPM operating by the methods designed for the purpose can in principle cover a vast (if not all) variety of information security events of economic importance for which there is demand for risk hedging instrument.
8.3.4. Increased Scalability
The ISPM will offer a variety of financial instruments to the market participants. The market participants can exchange/signal information related to the underlying event by trading the relevant financial contract. The higher the number of financial instruments available for trading, the market participants will be more expressive with regards to the underlying events. Thus, the traders’ consensus will reveal the likelihood of the underlying event, as if all the private information of all the traders is revealed. In such a scenario, the ISD are easily scalable and can be issued and traded in any size (volume). This is because the ISD are not tied to any physical underlying with limited quantity. Thus, the instruments can be traded in large quantities and at lower costs.
8.3.5. Rapid Implementation
The ISD can be processed like the traditional derivatives, regulated by security and exchange board/commission of the country. Furthermore, considering the security aspect of ISD trading at ISPM additional regulatory requirements may be imposed on the derivatives trading and ISPM. Thus, the ISD provide the features of existing capital and asset markets, as well as they, can be customized to meet the information security objectives. Therefore, it is possible to launch new ISD, fairly quickly compared to cyber-insurance products to allow hedging of underlying information security risks.
8.3.6. Increased Liquidity
Liquidity is an important characteristic for the trading of ISD and is of high importance for market stakeholders. However, as the ISD will facilitate the trading of precisely defined underlying events, all the ISD may not be of interest to all the market participants. Furthermore, the ISD are expected to provide trading opportunity in a wide variety of risk instruments with a wide variety of underlying events, the liquidity in these narrowly defined instruments is expected to be limited. In such a scenario, Automated Market Makers (AMM) can be used to inject additional liquidity in the market and improve the efficiency of the market. AMM’s have been heavily studied in the literature [128,129,130,131,132,133,134,135,136]. The two widely implemented AMM mechanisms in the prediction market domain are Dynamic Pari-mutuel Market (DPM) [135] and Market Scoring Rules (MSR) [133]. These mechanisms can be used in an ISPM to provide virtually infinite liquidity, improve market efficiency and motivate traders to trade at any time without waiting for a corresponding (matching) order.
DPM is a hybrid of a pari-mutuel market and a Continuous Double Auction (CDA) mechanism. DPM allows to place wagers on the exclusive outcomes of the underlying events in the future. After the true outcome is known, all the money lost by the traders who bet on the incorrect outcomes is redistributed to the traders who bet on the correct outcome. DPM provides infinite liquidity and each dollar wagered in a DPM buys a variable share of the payoff based on the state of the market. The automated market-maker in DPM will always quote a price for ISD. Thus, traders can easily purchase contracts at the quoted price. However, automated market-maker will not buy back the derivative contracts, and the contracts can be sold through Continuous Double Auction Mechanism. Thus, despite an unlimited liquidity on the buy side, the liquidity on the sell side is limited. The mechanism allows continuous incorporation of new information and the risk to the market operator is bounded.
MSR combines the scoring rules with CDA. MSR can be used to reward traders in combinatorial information (prediction) markets for incremental improvements in the forecast of the underlying event. MSR acts as a market maker and aggregates the information on the entire probability distribution over a set of variables. If a trader believes that the probability distribution is wrong at any given time, then he can pay off the trader who made the last prediction and replaced the probability distribution with his/her prediction. The payout to the last trader is determined by the scoring rule. In this process, each new trader will be paid off for improving the prediction of the previous trader. However, if the trader makes a worse prediction then s/he stands to lose money. In the end, the final trader is paid out by the market based on how far his/her prediction is from the actual outcome. MSR allows continuous information incorporation and guarantees liquidity at all times and on both sides of the market. Though, the market operator is exposed to some risk, but the risk is bounded. Later, Hanson proposed a logarithmic MSR to act as the market maker[137].
8.3.7. Reduced Transaction Costs
The cyber-insurance products are usually customized to meet the specific requirements and risk profile of the client. This creates an opaqueness in the pricing and transaction of cyber-insurance products. Furthermore, due to concerns of information asymmetry between the buyer and seller and vice-versa, the cost of cyber-(re)insurance goes up. The (re)insurance providers add cost to the product prices to protect against the unhedgeable risk exposure other than those indicated by the actuarial or valuation models. In ISD, the price of an instrument in a defined state is derived directly from the consensus belief of market participants. Thus, complex actuarial or derivatives valuation models are not essential for ISD. Thereby, the price transparency and tractability of ISD increases and the transaction cost is reduced.
8.3.8. Increased Price Transparency
Information transparency indirectly affects the market performance by affecting the behavior of market participants. Academic studies in the past have shown that a market with the availability of quote information reveals information more quickly and completely than a market without it [138,139,140]. Quote information is a pre-trade information that allows traders to deduce other traders’ belief on the underlying event based on their pricing behavior [140]. As the traders in prediction market do not collaborate with other traders, but they compete, they are likely to participate more actively in a market with the availability of quote information than the markets without it, provided the market is not facing an extremely limited participation from traders [123].
In a market where only the highest or lowest outstanding quote information is provided, market participants can only see the buying or selling price of a contract posted by the aggressive traders in the market. In such a scenario, the informed traders may earn more profit by trading with the aggressive traders [139]. On the other hand, less informed traders benefit when more diverse quote information is provided. Furthermore, due to uncertainty about private information and future outcome, the increase in quote information helps market participants infer more information from other participants to formulate/re-adjust their estimates. Thus, higher price transparency is likely to motivate traders to participate actively in the market.
In a fully transparent market, i.e., when all the quote information is revealed in a market, market participants do not trade more actively. Precisely, a market participant can quickly find if at that moment there is any matching buy or sell order in the market. If the market has no matching order, then the trader will wait for a matching order instead of placing his/her order in the market. In such a scenario, informed traders are likely not to reveal their private information in the market. Otherwise, other traders will be able to observe their actions and learn from the same [119,122]. Thus, these informed traders benefit from trading with private information, leading to less active participation of less informed or uninformed traders.
Trading of ISD at ISPM can provide unprecedented transparency. The transparency on trading of ISD can be divided into pre-trade and post-trade transparency. Pre-trade transparency includes information on bids, offers, book size, and order book depth. Post-trade transparency is about information on executed trades, such as trade price, trade size, time of the trade, etc. Furthermore, the probability distribution results from trades in the market can be displayed in a specified, say histogram, format to allow the market participants and observers gauge the market’s consensus belief on the possible outcome of the underlying events.Information security risk managers can benefit from these superior insights, and they can formulate their risk management strategy accordingly.
8.3.9. Reduced Cost of Capital
The cyber-(re)insurers are required to maintain a certain amount of capital reserve to cover the unexpected losses. Furthermore, the capital reserve may not be sufficient to cover the claims filed for interdependent and systemic risks. Thus, the (re)insurers are required to adjust their risk exposure continually to mitigate the risk of insolvency and to maximize their expected profits. However, this whole exercise limits the access to capital for business expansion and thus affects the business growth. On the other hand, in ISD the losing position of traders hedge the winning positions of other traders. Thus, the issuer or ISPM operator is not required to maintain a huge capital reserve or hedge its risk exposure. The (insolvency)risk exposure to ISPM is greatly reduced, if not eliminated completely.
8.3.10. Reduced Risk to Issuer/Market Operator
The ISD are “zero net supply” products, i.e., the summation of all the buy side and sell side positions will yield zero. This implies that the payout to the winning position is the money received (minus the transaction cost) from the corresponding losing positions. Therefore, if the cost of the transaction charged by the ISPM is priced in such a way that the total money received as transaction cost is higher than the total risk exposure of automated market maker, then the total risk exposure of ISPM operator is limited, and the operator can generate consistent profit from the market operation.
8.3.11. Reduced Settlement and Clearing Costs
The cost of settlement for cyber-insurance claims is significantly high due to the requirements of specialized forensics, software tools and expert knowledge required for risk analysis of client organization, and for underwriting. This is not required for ISD as the instruments are traded at a regulated ISPM, and to receive payouts the market participants are not required to prove their claims. Furthermore, the payout and settlement of contracts is based on the payout trigger and decision criteria mentioned in the contracts specification. Thus, the market operator and market participants know in advance about the terms and conditions of the derivatives contracts. However, if the payout trigger and decision criteria are not clearly defined (ambiguous), then there is a risk of a dispute between the market participants and clearing-house on the issue of settlement of the said contract.
8.3.12. Diversification of Counterparty Credit Risks
The ISPM can greatly reduce its counterparty credit risk exposure by charging an adequate transaction fee for the trading of ISD. The transaction fee charged by ISPM is priced to cover the risk exposure of automated market maker. Furthermore, as the payout to the winning position is from the investments in losing position, the ISPM or issuer has limited liability, and the counterparty credit risk (even for short positions) is diversified.
8.3.13. Increased Data Generation
The challenge of lack of data faced by the cyber-(re)insurance industry can be addressed by information security derivatives trading data. The information security derivatives trading data can provide an entire distribution of trader’s belief on possible outcomes of the underlying events. This information can be used to improve the pricing of relevant cyber-insurance products. The risk managers can use the market data to make strategic decisions related to the formulation of organizational security policy and deployment of security controls. Furthermore, the market data can be used by security product vendors, security researchers, and other stakeholders to improve the security products, use the data to rate the products (security ratings like credit ratings), thus strengthening the overall information security ecosystem.
9. Conclusions and Future Work
In this article, we have identified a set of problems in the cyber-insurance products and thus, a need for an alternative financial instrument as a risk management mechanism in the information security domain. This completed the “problem elicitation” phase of DSRA and the output is a “construct” (problems in the existing mechanism). In the next step, we identified a set of requirements for the information security derivatives, which can be used as a risk hedging mechanism. This completed the “requirements identification” phase of DSRA and the output is a “construct” (requirements for the artifact). Next, we designed and developed of a variety of information security derivatives (options, vanilla options, swaps, and futures). This completed the “design and development” phase of DSRA and the outputs are “models” (financial instruments). Then, we demonstrated the application of ISDs in an imaginary scenario. The scenarios are derived from various real world events, thus they are practical to a great extent. Thus, completing the “demonstration” phase of DSRA. The output of this phase is a “method”. Lastly, we analyzed the ISDs against the previously identified set of requirements and their usefulness in addressing the economic impact of information security risks. This completed the “evaluation” phase of DSRA and the output is “better theories” for the usefulness of the artifact(ISDs). In our analysis, we found that the information security derivatives meet all the requirements for alternative risk management financial instruments. However, as the evaluation is based on the informed argument (logical reasoning) form of evaluation, the implementation of these financial instruments in a naturalistic setting may pose several unforeseen challenges. Nevertheless, the information security derivatives are expected to provide a bridge between the insurance and derivatives by personalizing the contracts such that they can serve the specific organizational purpose. Despite this, the viability of information security derivatives market is not assured. If the hedgers and investors (liquidity providers) do not have a strong incentive for participation in the market, then the market would suffer behavioral biases leading to skewed prices from the true probabilities of the underlying variables. This would adversely affect the sustainable market operations.
In future, we plan to pursue the theoretical research on the pricing of information security derivatives, behavioral biases and manipulations issues. Alternatively, a web-based prototype of an information security prediction market can be implemented to evaluate its various performance aspects in a naturalistic setting. The experimental information security prediction market would be assessed for its usefulness in decision-making, trading of securities to hedge the underlying risk, exchange of security information, and so on. The prototype can be implemented with incentive mechanism of any of the following or a combination of them: (i) virtual play money; (ii) digital money; or (iii) reputation score. Furthermore, as the strategic information security decisions need to be considered over a prolonged period, the opinions of the market participants may change in this period with the availability of new information. Therefore, the experimental evaluation of information security derivatives and prediction market needs to be stretched over a multi-year period, as has been in cases of evaluation of prediction markets in other domains (macro-economic derivatives).
Acknowledgments
This work is partly funded by the Center for Cyber and Information Security, Norway and partly from the Ph.D. research grant awarded by the Ministry of Education, Norway.
Author Contributions
Pankaj Pandey and Einar Snekkenes discussed and designed the concept and structure of the article. Pankaj Pandey identified the design aspects of the information security derivatives and demonstrated the derivatives in an imaginary scenario. Pankaj Pandey and Einar Snekkenes wrote and reviewed the article.
Conflicts of Interest
The authors declare no conflict of interest.
References
- Department for Business, Innovation and Skills. 2015 Information Security Breaches Survey; Technical Report URN BIS/15/302; HM Government: London, UK, 2015.
- Gray, A. Government Resists Calls to Fund Backstop for Cyber Disaster Losses. 2015. Available online: http://www.ft.com/cms/s/0/7f9d8326-d096-11e4-a840-00144feab7de.html (accessed on 29 December 2015).
- WEF and Partners. Global Risks 2014. sight Report, 9th ed.; World Economic Forum (WEF): Cologny/Geneva, Switzerland, 2014. [Google Scholar]
- Gadanecz, B.; Moessner, R.; Upper, C. Economic derivatives. In BIS Quarterly Review; Bank for International Settlements: Basel, Switzerland, 2007; pp. 69–81. [Google Scholar]
- Dubil, R. Economic derivatives markets—New opportunities for individual investors: A research agenda. Financ. Serv. Rev. 2007, 16, 89. [Google Scholar]
- Cao, M.; Li, A.; Wei, J. Weather derivatives: A new class of financial instruments. Soc. Sci. Res. Netw. 2003. Available online: http://papers.ssrn.com/sol3/papers.cfm?abstractid=1016123 (accessed on 29 December 2015). [Google Scholar] [CrossRef]
- Andersen, T. Innovative Financial Instruments for Natural Disaster Risk Management; Technical Report; Inter-American Development Bank: Washington, DC, USA, 2002. [Google Scholar]
- Liu, M.; Wu, F.F.; Ni, Y. A survey on risk management in electricity markets. In Proceedings of the Power Engineering Society General Meeting, Montreal, Canada, 18–22 June 2006.
- Cusatis, P.; Thomas, M. Hedging Instruments and Risk Management: How to Use Derivatives to Control Financial Risk in Any Market; McGraw-Hill Education: New York, NY, USA, 2005. [Google Scholar]
- Pandey, P.; Snekkenes, E.A. Applicability of prediction markets in information security risk management. In Proceedings of the 25th International Workshop on Database and Expert Systems Applications (DEXA), Munich, Germany, 1–4 September 2014; Tjoa, A.M., Morvan, F., Wagner, R.R., Eds.; pp. 296–300.
- Pandey, P.; Snekkenes, E.A. Using prediction markets to hedge information security risks. In Security and Trust Management; Mauw, S., Jensen, C., Eds.; Lecture Notes in Computer Science; Springer International Publishing: Wroclaw, Poland, 2014; Volume 8743, pp. 129–145. [Google Scholar]
- Pandey, P.; Snekkenes, E.A. Design and performance aspects of information security prediction markets for risk management. In Proceedings of the 12th International Conference on Security and Cryptography, Colmar, France, 20–22 July 2015; pp. 273–284.
- Johannesson, P.; Perjons, E. An Introduction to Design Science, 1st ed.; Springer International Publishing: Cham, Switzerland, 2014. [Google Scholar]
- Samuel-Ojo, O.; Shimabukuro, D.; Chatterjee, S.; Muthui, M.; Babineau, T.; Prasertsilp, P.; Ewais, S.; Young, M. Meta-analysis of design science research within the IS community: trends, patterns, and outcomes. In Global Perspectives on Design Science Research; Springer-Verlag: Berlin/Heidelberg, Germany, 2010; pp. 124–138. [Google Scholar]
- Vaishnavi, V.; Kuechler, B. Design Science Research in Information Systems. 2013. Available online: http://desrist.org/desrist/content/design-science-research-in-information-systems.pdf (accessed on 29 December 2015).
- Rossi, M.; Sein, M.K. Design research workshop: A proactive research approach. Present. Deliv. IRIS 2003, 26, 9–12. [Google Scholar]
- Purao, S. Design Research in the Technology of Information Systems: Truth or Dare; Technical Report; Georgia State University: Atlanta, GA, USA, 2002. [Google Scholar]
- March, S.T.; Smith, G.F. Design and natural science research on information technology. Decis. Support Syst. 1995, 15, 251–266. [Google Scholar] [CrossRef]
- Hevner, A.; March, S.; Park, J.; Ram, S. Design science in information systems research. MIS Q. 2004, 28, 75–105. [Google Scholar]
- Vaishnavi, V.K.; William, J.K. Design Science Research Methods and Patterns: Innovating Information and Communication Technology; Auerbach Publications, Taylor & Francis Group: Boca Raton, FL, USA, 2007. [Google Scholar]
- Venable, J.; Pries-Heje, J.; Baskerville, R. A comprehensive framework for evaluation in design science research. In Design Science Research in Information Systems. Advances in Theory and Practice; Springer-Verlag: Berlin/Heidelberg, Germany, 2012; pp. 423–438. [Google Scholar]
- UK Cyber Security. The Role of Insurance in Managing and Mitigating the Risk; Technical Report; UK HM Government and Marsh, 2015. Available online: https://www.gov.uk/government/uploads/system/uploads/attachment_data/file/415354/UK_Cyber_Security_Report_Final.pdf (accessed on 29 December 2015).
- Piquito, N.P. Financial Product Development: A Strategically Competitive System Engineering Approach to Innovative Risk Based Financial Engineering. Ph.D. Thesis, Faculty of Engineering, Rand Afrikaans University, Johannesburg, South Africa, 1999. [Google Scholar]
- Ross, S.A.; Jordan, B.D.; Westerfield, R. Fundamentals of Corporate Finance; McGraw-Hill/Irwin Publishing: New York, NY, USA, 2012. [Google Scholar]
- Silber, W.L. The process of financial innovation. Am. Econ. Rev. 1983, 73, 89–95. [Google Scholar]
- Horne, J.C. Of financial innovations and excesses. J. Financ. 1985, 40, 621–631. [Google Scholar] [CrossRef]
- Ross, S.A. Institutional markets, financial marketing, and financial innovation. J. Financ. 1989, 44, 541–556. [Google Scholar] [CrossRef]
- Merton, R.C. Financial innovation and economic performance. J. Appl. Corp. Financ. 1992, 4, 12–22. [Google Scholar] [CrossRef]
- Allen, F.; Gale, D. Financial Innovation and Risk Sharing; The MIT Press: Cambridge, MA, USA, 1994. [Google Scholar]
- Davis, K. Innovations in derivative securities: successes and failures. In Proceeding of the 6th Melbourne Money and Finance Conference, Supplement to the Journal of Applied Finance and Investment, Melbourne, Australia, July 1996.
- Shiller, R.J. Macro Markets: Creating Institutions for Managing Society’s Largest Economic Risks; Oxford University Press: New York, NY, USA, 1998. [Google Scholar]
- Myers, R. What Every CFO Needs to Know Now about Weather Risk Management. Available online: https://www.celsiuspro.com/Portals/0/Downloads/WeatherRisk_What_Every_CFO_Needs_to_Know_Now.pdf (accessed on 29 December 2015).
- Group, CME. Weather Products: Managing Global Weather Exposures, Growing Opportunties, Reducing Risks; Technical Report; CME Group: Chicago, IL, USA, 2009. [Google Scholar]
- Deng, S.; Oren, S.S. Electricity derivatives and risk management. Energy 2006, 31, 940–953. [Google Scholar] [CrossRef]
- Ghosh, K.; Ramesh, V. An options model for electric power markets. Int. J. Electri. Power Energy Syst. 1997, 19, 75–85. [Google Scholar] [CrossRef]
- Zhang, Q.; Zhou, H. Analysis of forward option trades in electricity markets. In Proceedings of the 2004 IEEE International Conference on Electric Utility Deregulation, Restructuring and Power Technologies, Hong Kong, China, 5–8 April 2004; Volume 2, pp. 500–504.
- Oum, Y.; Oren, S.; Deng, S. Hedging quantity risks with standard power options in a competitive wholesale electricity market. Nav. Res. Logist. NRL 2006, 53, 697–712. [Google Scholar] [CrossRef]
- Oum, Y.; Oren, S.S. Optimal static hedging of volumetric risk in a competitive wholesale electricity market. Decis. Anal. 2010, 7, 107–122. [Google Scholar] [CrossRef]
- Bhanot, K. Value of an option to purchase electric power—The case of uncertain consumption. Energy Econ. 2002, 24, 121–137. [Google Scholar] [CrossRef]
- Chung, T.; Zhang, S.; Yu, C.; Wong, K. Electricity market risk management using forward contracts with bilateral options. IEE Proc. Gen. Transm. Distrib. 2003, 150, 588–594. [Google Scholar] [CrossRef]
- Oren, S.S. Integrating real and financial options in demand-side electricity contracts. Decis. Support Syst. 2001, 30, 279–288. [Google Scholar] [CrossRef]
- Spinler, S.; Huchzermeier, A.; Kleindorfer, P. Risk hedging via options contracts for physical delivery. Spectrum 2003, 25, 379–395. [Google Scholar]
- Buyya, R.; Yeo, C.S.; Venugopal, S. Market-oriented cloud computing: Vision, hype, and reality for delivering it services as computing utilities. In Proceedings of the 10th IEEE International Conference on High Performance Computing and Communications, Dalian, China, 25–27 September 2008; pp. 5–13.
- Buyya, R.; Pandey, S.; Vecchiola, C. Cloudbus toolkit for market-oriented cloud computing. In Cloud Computing; Springer-Verlag: Berlin/Heidelberg, Germany, 2009; pp. 24–44. [Google Scholar]
- Dash, D.; Kantere, V.; Ailamaki, A. An economic model for self-tuned cloud caching. In Proceedings of the IEEE 25th International Conference on Data Engineering, Shanghai, China, 29 March–2 April 2009; pp. 1687–1693.
- Krieger, O.; McGachey, P.; Kanevsky, A. Enabling a marketplace of clouds: VMware’s vCloud director. SIGOPS Oper. Syst. Rev. 2010, 44, 103–114. Available online: http://doi.acm.org/10.1145/1899928.1899942 (accessed on 29 December 2015). [Google Scholar] [CrossRef]
- Zhang, Q.; Gürses, E.; Boutaba, R.; Xiao, J. Dynamic resource allocation for spot markets in clouds. In Proceedings of the 11th USENIX Conference on Hot Topics in Management of Internet, Cloud, and Enterprise Networks and Services, Hot-ICE’11, Boston, MA, USA, 29 March 2011; USENIX Association: Berkeley, CA, USA, 2011; pp. 1–6. [Google Scholar]
- Haque, A.; Alhashmi, S.M.; Parthiban, R. A survey of economic models in grid computing. Futur. Gen. Comput. Syst. 2011, 27, 1056–1069. [Google Scholar] [CrossRef]
- Amazon EC2 Spot Instances. Available online: http://aws.amazon.com/ec2/spot/ (accessed on 29 December 2015).
- Cohen, R. Compute Derivatives: The Next Big Thing in Commodities? 2013. Available online: http://www.forbes.com/sites/reuvencohen/2013/10/02/compute-derivatives-the-next-big-thing-in-commodities/ (accessed on 29 December 2015).
- Song, B.; Hassan, M.M.; Huh, E.N. A novel Cloud market infrastructure for trading service. In Proceedings of the International Conference on Computational Science and Its Applications, Yongin, South Korea, 29 June–2 July 2009; pp. 44–50.
- Mihailescu, M.; Teo, Y.M. Dynamic resource pricing on federated clouds. In Proceedings of the 10th IEEE/ACM International Conference on Cluster, Cloud and Grid Computing, Melbourne, Australia, 17–20 May 2010; pp. 513–517.
- Gomes, E.R.; Vo, Q.B.; Kowalczyk, R. Pure exchange markets for resource sharing in federated clouds. Concurr. Comput. Pract. Exp. 2012, 24, 977–991. [Google Scholar] [CrossRef]
- Vanmechelen, K.; Depoorter, W.; Broeckhove, J. Combining futures and spot markets: A hybrid market approach to economic grid resource management. J. Grid Comput. 2011, 9, 81–94. [Google Scholar] [CrossRef]
- Rahman, M.R. Risk Aware Resource Allocation for Clouds; Technical Report; University of Illinois: Champaign, IL, USA, 2011; Available online: https://www.ideals.illinois.edu/handle/2142/25754 (accessed on 29 December 2015).
- Bossenbroek, A.; Tirado-Ramos, A.; Sloot, P. Grid resource allocation by means of option contracts. IEEE Syst. J. 2009, 3, 49–64. [Google Scholar] [CrossRef]
- Toosi, A.N.; Thulasiram, R.K.; Buyya, R. Financial option market model for federated cloud environments. In Proceedings of the 2012 IEEE/ACM Fifth International Conference on Utility and Cloud Computing, Chicago, IL, USA, 5–8 November 2012; pp. 3–12.
- Du, A.Y.; Das, S.; Gopal, R.D.; Ramesh, R. Risk hedging in storage grid markets: Do options add value to forwards? ACM Trans. Manag. Inf. Syst. 2011, 2, 10. [Google Scholar] [CrossRef]
- Du, A.Y.; Das, S.; Ramesh, R. Efficient risk hedging by dynamic forward pricing: A study in cloud computing. INFORMS J. Comput. 2012, 25, 625–642. [Google Scholar] [CrossRef]
- Kauffman, R.; Ma, D.; Shang, R.; Huang, J.; Yang, Y. On the financification of cloud computing: An agenda for pricing and service delivery mechanism design research. Int. J. Cloud Comput. 2014, 2, 1–14. [Google Scholar]
- Cummins, J.D.; Weiss, M.A. Convergence of insurance and financial markets: Hybrid and securitized risk-transfer solutions. J. Risk Insur. 2009, 76, 493–545. [Google Scholar] [CrossRef]
- Bouriaux, S.; Scott, W.L. Capital market solutions to terrorism risk coverage: A feasibility study. J. Risk Financ. 2004, 5, 34–44. [Google Scholar] [CrossRef]
- David, M. The potential for new derivatives instruments to cover terrorism risks. Policy Issues Insur. 2005, 163–169. [Google Scholar] [CrossRef]
- Gerrish, A. Terror cats: TRIA’s failure to encourage a private market for terrorism insurance and how federal securitization of terrorism risk may be a viable alternative. Washing. Lee Law Rev. 2011, 68, 1825–1873. [Google Scholar]
- Biener, C.; Eling, M.; Wirfs, J.H. Insurability of cyber risk: An empirical analysis. Geneva Pap. Risk Insur. Issues Pract. 2015, 40, 131–158. [Google Scholar] [CrossRef]
- Akerlof, G.A. The Market for ’Lemons’: Quality Uncertainty and the Market Mechanism. Q. J. Econ. 1970, 84, 488–500. [Google Scholar] [CrossRef]
- New York Supreme Court. Zurich American Insurance Company vs. Sony Corporation of America; NY Court: New York, NY, USA, 2011; No. 651982/2011. [Google Scholar]
- Rothschild, M.; Stiglitz, J. Equilibrium in competitive insurance markets: An essay on the economics of imperfect information. Q. J. Econ. 1976, 90, 629. [Google Scholar] [CrossRef]
- Chon, G. Cyber Attack Risk Requires $1bn of Insurance Cover, Companies Warned. 2015. Available online: http://www.ft.com/intl/cms/s/0/61880f7a-b3a7-11e4-a6c1-00144feab7de.html (accessed on 29 December 2015).
- King, R. Cyber Insurance Capacity Is ‘very Small’: AIG CEO. CIO J. 2015. Available online: http://blogs.wsj.com/cio/2015/04/02/cyber-insurance-capacity-is-very-small-aig-ceo/ (accessed on 29 December 2015).
- DiPietro, B. Lack of Data Hampers Buyers, Sellers of Cyber and Reputation Policies. 2014. Available online: http://blogs.wsj.com/riskandcompliance/2014/07/01/lack-of-data-hampers-buyers-sellers-of-cyber-and-reputation-insurance/ (accessed on 29 December 2015).
- Solvency II: A Closer Look at the Evolving Process Transforming the Global Insurance Industry; Technical Report; KPMG LLP, 2011; Available online: https://www.kpmg.com/US/en/IssuesAndInsights/ArticlesPublications/Documents/solvency-II.pdf (accessed on 29 December 2015).
- Stapleton, T. Data Breach Cost : Risks, Costs and Mitigation Strategies for Data Breaches. Technical Report. 2012. Available online: http://www.zurichna.com/internet/zna/sitecollectiondocuments/en/products/securityandprivacy/data-breach-costs-wp-part-201-20-28risks-costs-and-mitigation-strategies.pdf (accessed on 29 December 2015).
- Hurtaud, S.; Flamand, T.; de la Vaissiere, L.; Hounka, A. Cyber Insurance as One Element of the Cyber Risk Management Strategy; Technical Report; Deloitte Luxembourg, 2015; Available online: http://rmas.fad.harvard.edu/files/rmas/files/lu-cyber-insurance-cyber-risk-management-strategy-03032015.pdf (accessed on 29 December 2015).
- Floresca, L. Data Breach Settlements: A New Cost in Cyber Risk. 2014. Available online: http://www.wsandco.com/about-us/news-and-events/cyber-blog/cyber-cost (accessed on 29 December 2015).
- WEF and Partners. Risk and Responsibility in a Hyperconnected World; Technical Report; World Economic Forum in collaboration with McKinsey & Company: Geneva, Switzerland, 2014. [Google Scholar]
- WEF and Partners. Partnering for Cyber Resilience: Risk and Responsibility in a Hyperconnected World—Principles and Guidelines; Technical Report Ref. 270912; World Economic Forum: Geneva, Switzerland, 2012. [Google Scholar]
- Durbin, M. All about Derivatives; McGraw-Hill Education: New York, NY, USA, 2010. [Google Scholar]
- Fabozzi, F.J. The Handbook of Financial Instruments; John Wiley & Sons, Inc.,: New York, NY, USA, 2002. [Google Scholar]
- Merton, R.C. Continuous-Time Finance; Wiley-Blackwell: Hoboken, NJ, USA, 1992. [Google Scholar]
- Pandey, P.; DeHaes, S. A novel financial instrument to incentivize investments in information security controls and mitigate residual risk. In Proceedings of the Ninth International Conference on Emerging Security Information, Systems and Technologies (SECUREWARE), Venice, Italy, 23–28 August 2015; Falk, R., Westphall, C.M., Hof, H.J., Eds.; pp. 166–175.
- Black, F.; Scholes, M. The pricing of options and corporate liabilities. J. Political Eco. 1973, 81, 637–654. Available online: http://www.jstor.org/stable/1831029 (accessed on 29 December 2015). [Google Scholar] [CrossRef]
- Pandey, P.; Snekkenes, E.A. A performance assessment metric for information security financial instruments. In Proceedings of the International Conference on Information Society (i-Society), London, UK, 9–11 November 2015; pp. 138–145.
- Sidney, C. The Art of Legging; Rotex Publishing: London, UK, 2003. [Google Scholar]
- Index of Cyber Security. 2015. Available online: http://www.cybersecurityindex.org/ (accessed on 29 December 2015).
- Embrechts, P.; Klüppelberg, C.; Mikosch, T. Modelling Extremal Events for Insurance and Finance; Applications of Mathematics; Springer: Berlin, Germany; Heidelberg, Germany, 1997; Volume 33, pp. 285–286. [Google Scholar]
- PureFunds ISE Cyber Security ETF; Technical Report; Pure Funds, 2014; Available online: http://pureetfs.com/etfs/hack.html (accessed on 29 December 2015).
- KPMG Consulting. UK Cyber Vulnerability Index 2013; Business and Industry Issue, KPMG Consulting: London, UK, 2014. [Google Scholar]
- ABI Research. Global Cybersecurity Index; Technical Report; International Telecommunication Union and ABI Research: New York, NY, USA, 2014. [Google Scholar]
- ETSI. A Full Set of Operational Indicators for Organizations to Use to Benchmark their Security Posture; Technical Report DGS/ISI-001-1; European Telecommunications Standards Institute (ETSI): Sophia Antipolis, France, 2013; version 1.1.1 (2013-04). [Google Scholar]
- Perloth, N. In Cyberattack on Saudi Firm, U.S. Sees Iran Firing Back. 2012. Available online: http://www.nytimes.com/2012/10/24/business/global/cyberattack-on-saudi-oil-firm-disquiets-us.html (accessed on 29 December 2015).
- Mathew, J. Oil Industry Has Become Hackers’ Favourite Because of Potential to Create Blackouts or Spills. 2015. Available online: http://www.ibtimes.co.uk/oil-industry-has-become-hackers-favourite-because-potential-create-blackouts-spills-1505737 (accessed on 29 December 2015).
- Davis, C. NatGas, Oil Industry in ’Crosshairs’ of Malicious Cyber Attacks. 2015. Available online: http://www.naturalgasintel.com/articles/102592-natgas-oil-industry-in-crosshairs-of-malicious-cyber-attacks (accessed on 29 December 2015).
- BBC News. Oil Cyber-Attacks Could Cost Lives, Shell Warns. 2012. Available online: http://www.bbc.com/news/technology-16137573 (accessed on 29 December 2015).
- Byres, E. Next Generation Cyber Attacks Target Oil and Gas SCADA. 2012. Available online: http://www.pipelineandgasjournal.com/next-generation-cyber-attacks-target-oil-and-gas-scada (accessed on 29 December 2015).
- Arnsdorf, I. Hackers’ Favorite Target: Big Oil and All That Deadly Equipment. 2015. Available online: http://www.bloomberg.com/news/articles/2015-06-10/hackers-favorite-target-big-oil (accessed on 29 December 2015).
- Hechinger, J. Harvard Makes Professor Disclose More After Blinkx Slides. 2014. Available online: http://www.bloomberg.com/news/2014-02-06/harvard-makes-professor-disclose-more-after-blinkx-slides.html (accessed on 29 December 2015).
- Wolfers, J.; Zitzewitz, E. Prediction Markets. J. Econ. Perspect. 2004, 18, 107–126. [Google Scholar] [CrossRef]
- Malkiel, B.G. The efficient market hypothesis and its critics. J. Econ. Perspect. 2003, 17, 59–82. [Google Scholar] [CrossRef]
- Dembo, R.; Freeman, A. Seeing Tomorrow: Rewriting the Rules of Risk; John Wiley & Sons, Inc.: Hoboken, NJ, USA, 1998. [Google Scholar]
- Palmer, D. Hackers See Cloud as ’a Fruit-Bearing Jackpot’ for Cyber Attacks. 2015. Available online: http://www.computing.co.uk/ctg/news/2429256/hackers-see-cloud-as-a-fruit-bearing-jackpot-for-cyber-attacks (accessed on 29 December 2015).
- Palmer, D. Venom Security Vulnerability Allows Hackers to Infiltrate Networks via the Cloud. 2015. Available online: http://www.computing.co.uk/ctg/news/2408602/venom-security-vulnerability-allows-hackers-to-infiltrate-networks-via-the-cloud (accessed on 29 December 2015).
- Vogel, P.S. The Increasing Business Risk of Cloud Cyberattacks. 2014. Available online: http://www.ecommercetimes.com/story/80107.html (accessed on 29 December 2015).
- Zetter, K. Russian Spy Gang Hijacks Satellite Links to Steal Data. 2015. Available online: http://www.wired.com/2015/09/turla-russian-espionage-gang-hijacks-satellite-connections-to-steal-data/ (accessed on 2 November 2015).
- Stuart, J. Comment: Satellite Industry Must Invest in Cyber Security. 2015. Available online: http://www.ft.com/intl/cms/s/0/659ab77e-c276-11e4-ad89-00144feab7de.html (accessed on 29 December 2015).
- Dougherty, J.E. Chinese Military Planning Cyber Attacks Against U.S. Satellites and Computer Systems to Degrade Pentagon’s Superiority. 2015. Available online: http://www.cyberwar.news/2015-10-20-chinese-military-planning-cyber-attacks-against-u-s-satellites-and-computer-systems-to-degrade-pentagons-superiority.html (accessed on 29 December 2015).
- Rabinovvitch, A. Hackers Find New Battleground in Space, Targeting Satellites in ’Trophy Attacks’. 2015. Available online: http://www.insurancejournal.com/news/international/2015/10/27/386240.htm (accessed on 29 December 2015).
- Cuthbertson, A. China’s Star Wars Weapons Include ’Missile-Loaded Satellites Able to Crash into International Space Station’. 2015. Available online: http://www.ibtimes.co.uk/chinas-star-wars-weapons-include-missile-loaded-satellites-able-crash-into-international-space-524304 (accessed on 29 December 2015).
- Flaherty, M.P.; Samenow, J.; Rein, L. Chinese Hack U.S. Weather Systems, Satellite Network. 2014. Available online: https://www.washingtonpost.com/local/chinese-hack-us-weather-systems-satellite-network/2014/11/12/bef1206a-68e9-11e4-b053-65cea7903f2e_story.html (accessed on 29 December 20155).
- Greenberg, A. Hackers Remotely Kill a Jeep on the Highway-With Me in It. 2015. Available online: http://www.wired.com/2015/07/hackers-remotely-kill-jeep-highway/ (accessed on 2 November 2015).
- Mearian, L. Hacker: ’Hundreds of Thousands’ of Vehicles Are at Risk of Attack. 2015. Available online: http://www.computerworld.com/article/2951489/telematics/hacker-hundreds-of-thousands-of-vehicles-are-at-risk-of-attack.html (accessed on 29 December 2015).
- Wright, R.; Sharman, A. Cyber Hack Triggers Mass Fiat Chrysler Car Recall. 2015. Available online: http://www.ft.com/intl/cms/s/0/2bafe3e0-321f-11e5-8873-775ba7c2ea3d.html (accessed on 29 December 2015).
- Gibbs, S. Jeep Owners Urged to Update Their Cars after Hackers Take Remote Control. 2015. Available online: http://www.theguardian.com/technology/2015/jul/21/jeep-owners-urged-update-car-software-hackers-remote-control (accessed on 29 December 2015).
- Slamka, C.; Soukhoroukova, A.; Spann, M. Event studies in real-and play-money prediction markets. J. Pred. Mark. 2008, 2, 53–70. [Google Scholar]
- Wolfers, J.; Zitzewitz, E. Prediction Markets in Theory and Practice; Technical Report; National Bureau of Economic Research: London, UK, 2006. [Google Scholar]
- Chen, Y.; Mullen, T.; Chu, C.H. An in-depth analysis of information markets with aggregate uncertainty. Electron. Commerce Res. 2006, 6, 201–221. [Google Scholar] [CrossRef]
- Fama, E.F. Efficient capital markets: A review of theory and empirical work. J. Financ. 1970, 25, 383–417. [Google Scholar] [CrossRef]
- Plott, C.R. Markets as information gathering tools. South. Econ. J. 2000, 2–15. [Google Scholar] [CrossRef]
- Gruca, T.S.; Berg, J.E.; Cipriano, M. Consensus and differences of opinion in electronic prediction markets. Electron. Mark. 2005, 15, 13–22. [Google Scholar] [CrossRef]
- Bondarenko, O.; Bossaerts, P. Expectations and Learning in Iowa. J. Bank. Financ. 2000, 24, 1535–1555. [Google Scholar] [CrossRef]
- Ho, T.H.; Chen, K.Y. Discovering and managing new product blockbusters: The magic and science of prediction markets. Calif. Manag. Rev. 2007, 50, 144–158. [Google Scholar] [CrossRef]
- Rhode, P.W.; Strumpf, K.S. Historical presidential betting markets. J. Econ. Perspect. 2004, 18, 127–141. [Google Scholar] [CrossRef]
- Yang, S. Information Aggregation Efficiency of Prediction Markets. Ph.D. Thesis, Erasmus Research Institute of Management, Rotterdam, The Netherlands, 2014. [Google Scholar]
- Shi, P.; Conitzer, V.; Guo, M. Prediction mechanisms that do not incentivize undesirable actions. In Internet and Network Economics; Springer-Verlag: Berlin/Heidelberg, Germany, 2009; pp. 89–100. [Google Scholar]
- Dimitrov, S.; Sami, R. Composition of markets with conflicting incentives. In Proceedings of the 11th ACM Conference on Electronic Commerce, Cambridge, MA, USA, 7–11 June 2010; pp. 53–62.
- Rhode, P.W.; Strumpf, K.S. Manipulating Political Stock Markets: A Field Experiment and a Century of Observational Data; University of Arizona: Tucson, AZ, USA, 2006. [Google Scholar]
- Hanson, R.; Oprea, R. Manipulators Increase Information Market Accuracy; George Mason University: Fairfax, VA, USA, 2004. [Google Scholar]
- Abramowicz, M. The hidden beauty of the quadratic market scoring rule: A uniform liquidity market maker with variations. GWU Law School Public Law Res. Pap. 2007. [Google Scholar] [CrossRef]
- Berg, H.; Proebsting, T. Hanson’s automated market maker. J. Predict. Mark. 2009, 3, 45–59. [Google Scholar]
- Hanson, R. On Market Maker Functions. J. Predict. Mark. 2009, 3, 61–63. Available online: http://EconPapers.repec.org/RePEc:buc:jpredm:v:3:y:2009:i:1:p:61-63 (accessed on 29 December 2015). [Google Scholar]
- Hanson, R. Book Orders for Market Scoring Rules; George Manson University: Fairfax, VA, USA, 2003. [Google Scholar]
- Chakraborty, M.; Das, S.; Peabody, J. Price evolution in a continuous double auction prediction market with a scoring-rule based market maker. In Proceedings of the Twenty-Ninth AAAI Conference on Artificial Intelligence, Austin, TX, USA, 25–30 January 2015.
- Hanson, R. Combinatorial information market design. Inf. Syst. Front. 2003, 5, 107–119. Available online: http://dx.doi.org/10.1023/A:1022058209073 (accessed on 29 December 2015). [Google Scholar] [CrossRef]
- Ledyard, J.; Hanson, R.; Ishikida, T. An experimental test of combinatorial information markets. J. Econ. Behav. Organ. 2009, 69, 182–189. [Google Scholar] [CrossRef]
- Pennock, D.M. A dynamic pari-mutuel market for hedging, wagering, and information aggregation. In Proceedings of the 5th ACM Conference on Electronic Commerce (EC ’04), New York, NY, USA, 17–20 May 2004; ACM: New York, NY, USA, 2004; pp. 170–179. [Google Scholar]
- Tetlock, P.C.; Hahn, R.W.; Lien, D.D. Designing information markets for decision making. AEI Brook. Jt. Center Work. Pap. 2005. [Google Scholar] [CrossRef]
- Hanson, R. Logarithmic market scoring rules for modular combinatorial information aggregation. J. Predict. Markets 2012, 1, 3–15. [Google Scholar]
- Bloomfield, R.; O’Hara, M. Market transparency: Who wins and who loses? Rev. Financ. Stud. 1999, 12, 5–35. [Google Scholar] [CrossRef]
- Madhavan, A. Consolidation, fragmentation, and the disclosure of trading information. Rev. Financ. Stud. 1995, 8, 579–603. [Google Scholar] [CrossRef]
- Pagano, M.; Röell, A. Transparency and liquidity: A comparison of auction and dealer markets with informed trading. J. Financ. 1996, 51, 579–611. [Google Scholar] [CrossRef]
Figure 1.
Process Flow Model for Design Science Research Approach (adapted from [13]).
Figure 1.
Process Flow Model for Design Science Research Approach (adapted from [13]).

Figure 2.
An Information Security Risk Management Process.

Figure 3.
A Taxonomy of Cyber-Threats (adapted from [22]).
Figure 3.
A Taxonomy of Cyber-Threats (adapted from [22]).

Figure 4.
Cyber Risk Framework (adapted from [77]).
Figure 4.
Cyber Risk Framework (adapted from [77]).

Figure 5.
Application Scenario of ISD.

Figure 6.
Process of Designing and Using Information Security Derivatives.

Figure 7.
Unhedged Expected Future Value for Market’s Probability Estimate.

Figure 8.
Unhedged Expected Future Value for CVaR Probability Estimate.

Figure 9.
Hedged Expected Future Value for Market’s Probability Estimate.

Figure 10.
Hedged Expected Future Value for CVaR’s Probability Estimate.

Figure 11.
Unhedged Expected Future Value for Market’s Probability Estimate.

Figure 12.
Unhedged Expected Future Value for Company’s Probability Estimate.

Figure 13.
Hedged Expected Future Value for Market’s Probability Estimate.

Figure 14.
Hedged Expected Future Value for Company’s Probability Estimate.

Figure 15.
Unhedged Expected Future Value for Company’s Probability Estimate.

Figure 16.
Unedged Expected Future Value for Counterparty’s Probability Estimate.

Figure 17.
Hedged Expected Future Value for Counterparty’s Probability Estimate.

Figure 18.
Hedged Expected Future Value for Company’s Probability Estimate.

Figure 19.
Unhedged Expected Future Value for Market’s Probability Estimate.

Figure 20.
Unhedged Expected Future Value for Company’s Probability Estimate.

Figure 21.
Hedged Expected Future Value for Market’s Probability Estimate.

Figure 22.
Hedged Expected Future Value for Company’s Probability Estimate.

Figure 23.
ISD Evaluation Process (adapted from [13]).
Figure 23.
ISD Evaluation Process (adapted from [13]).


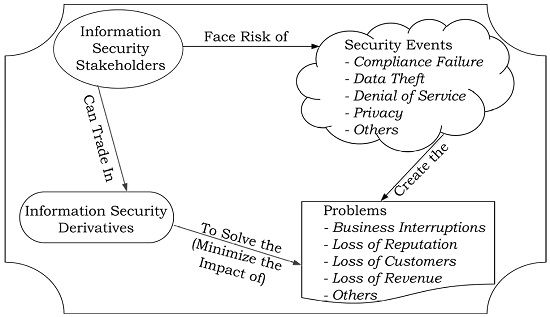
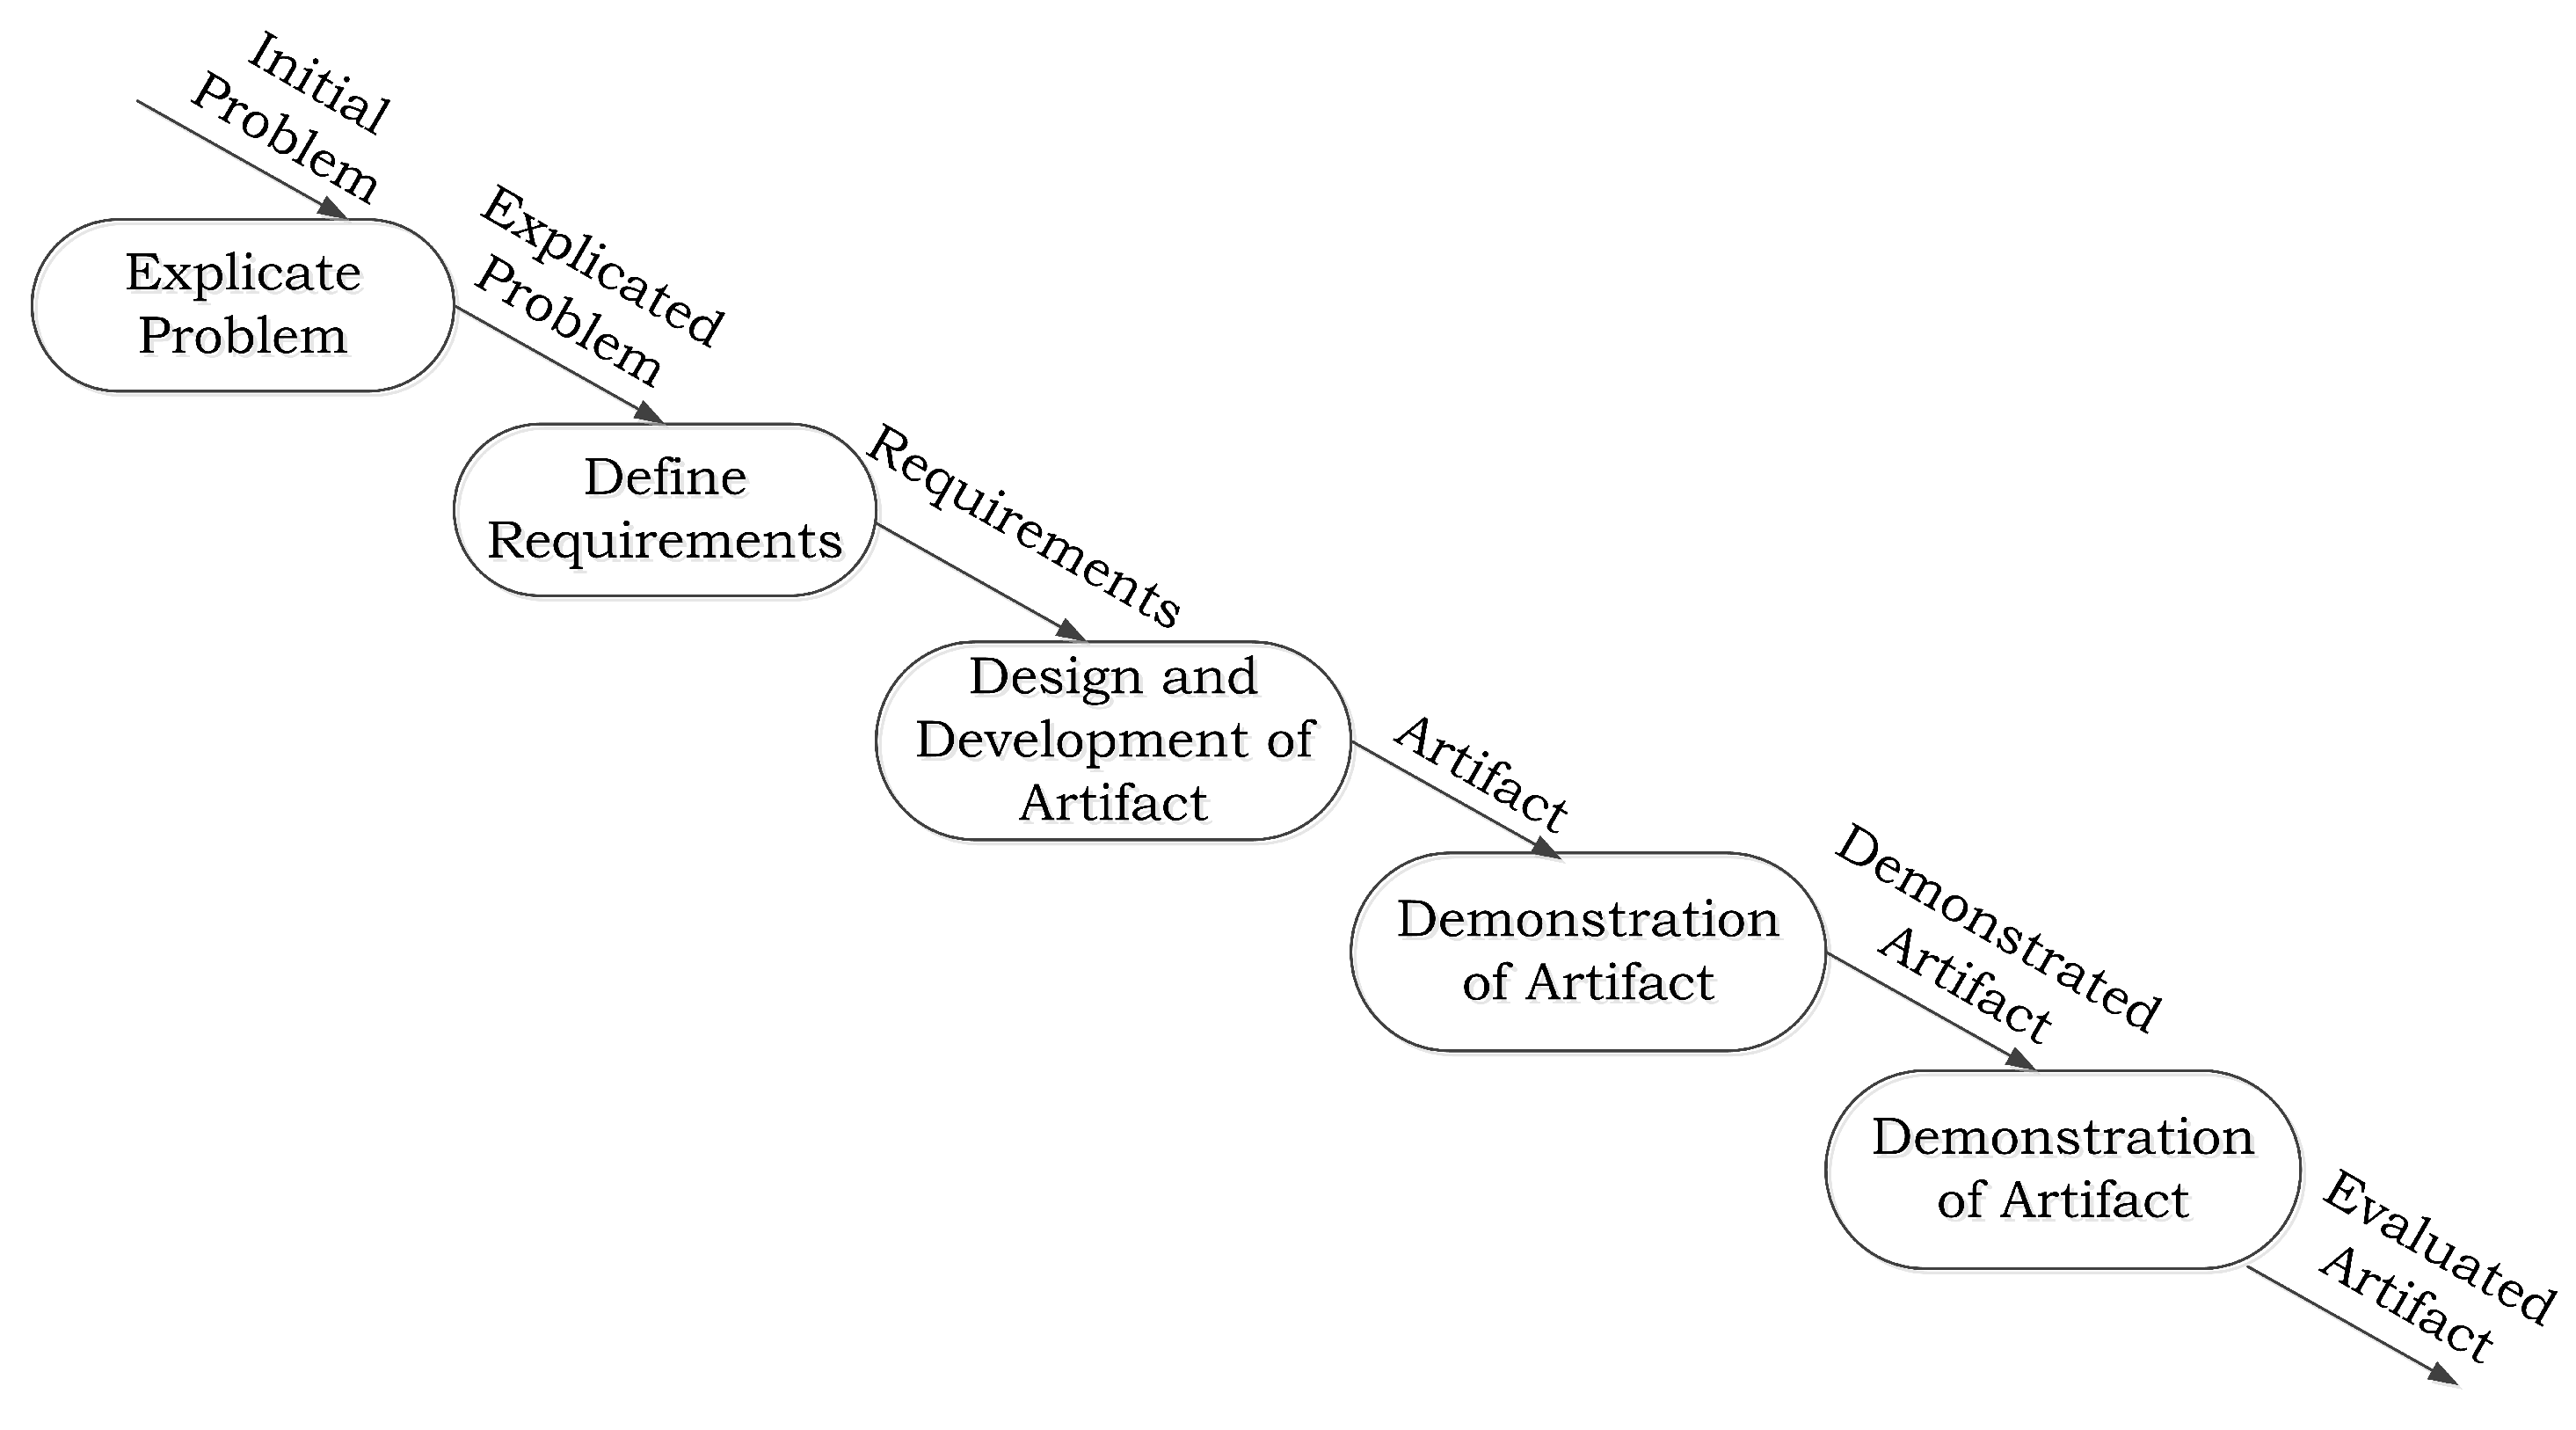
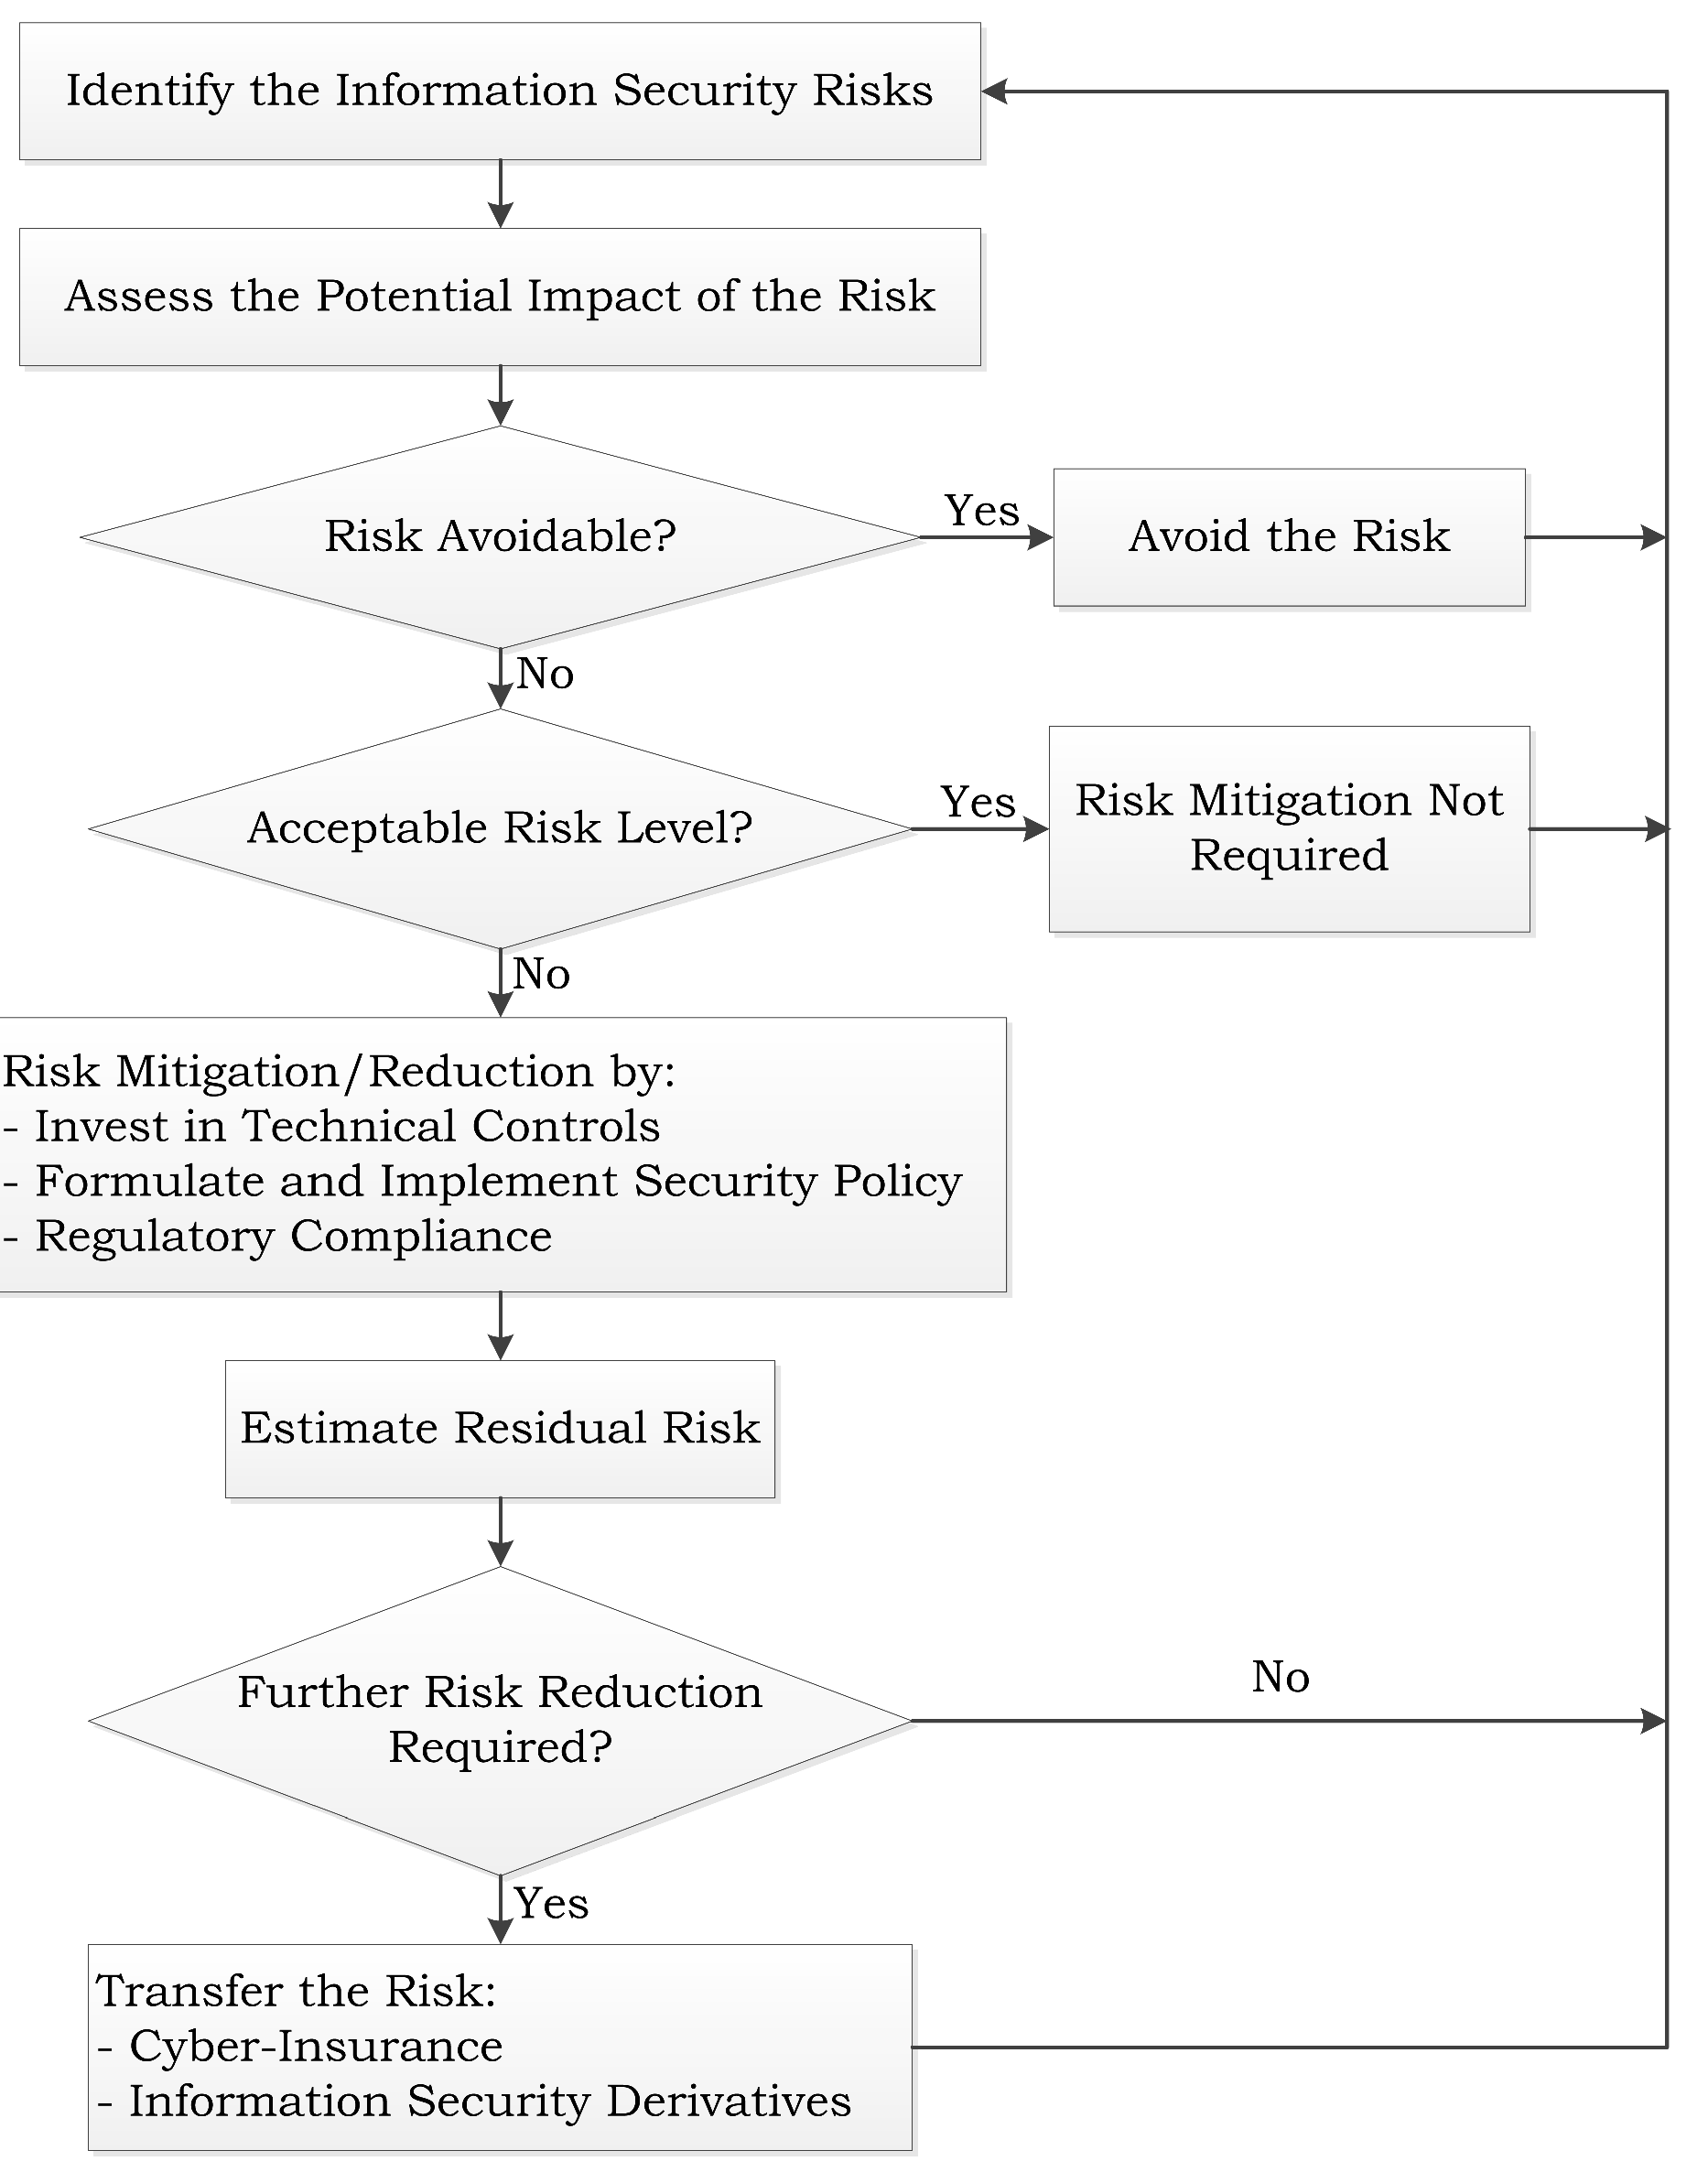
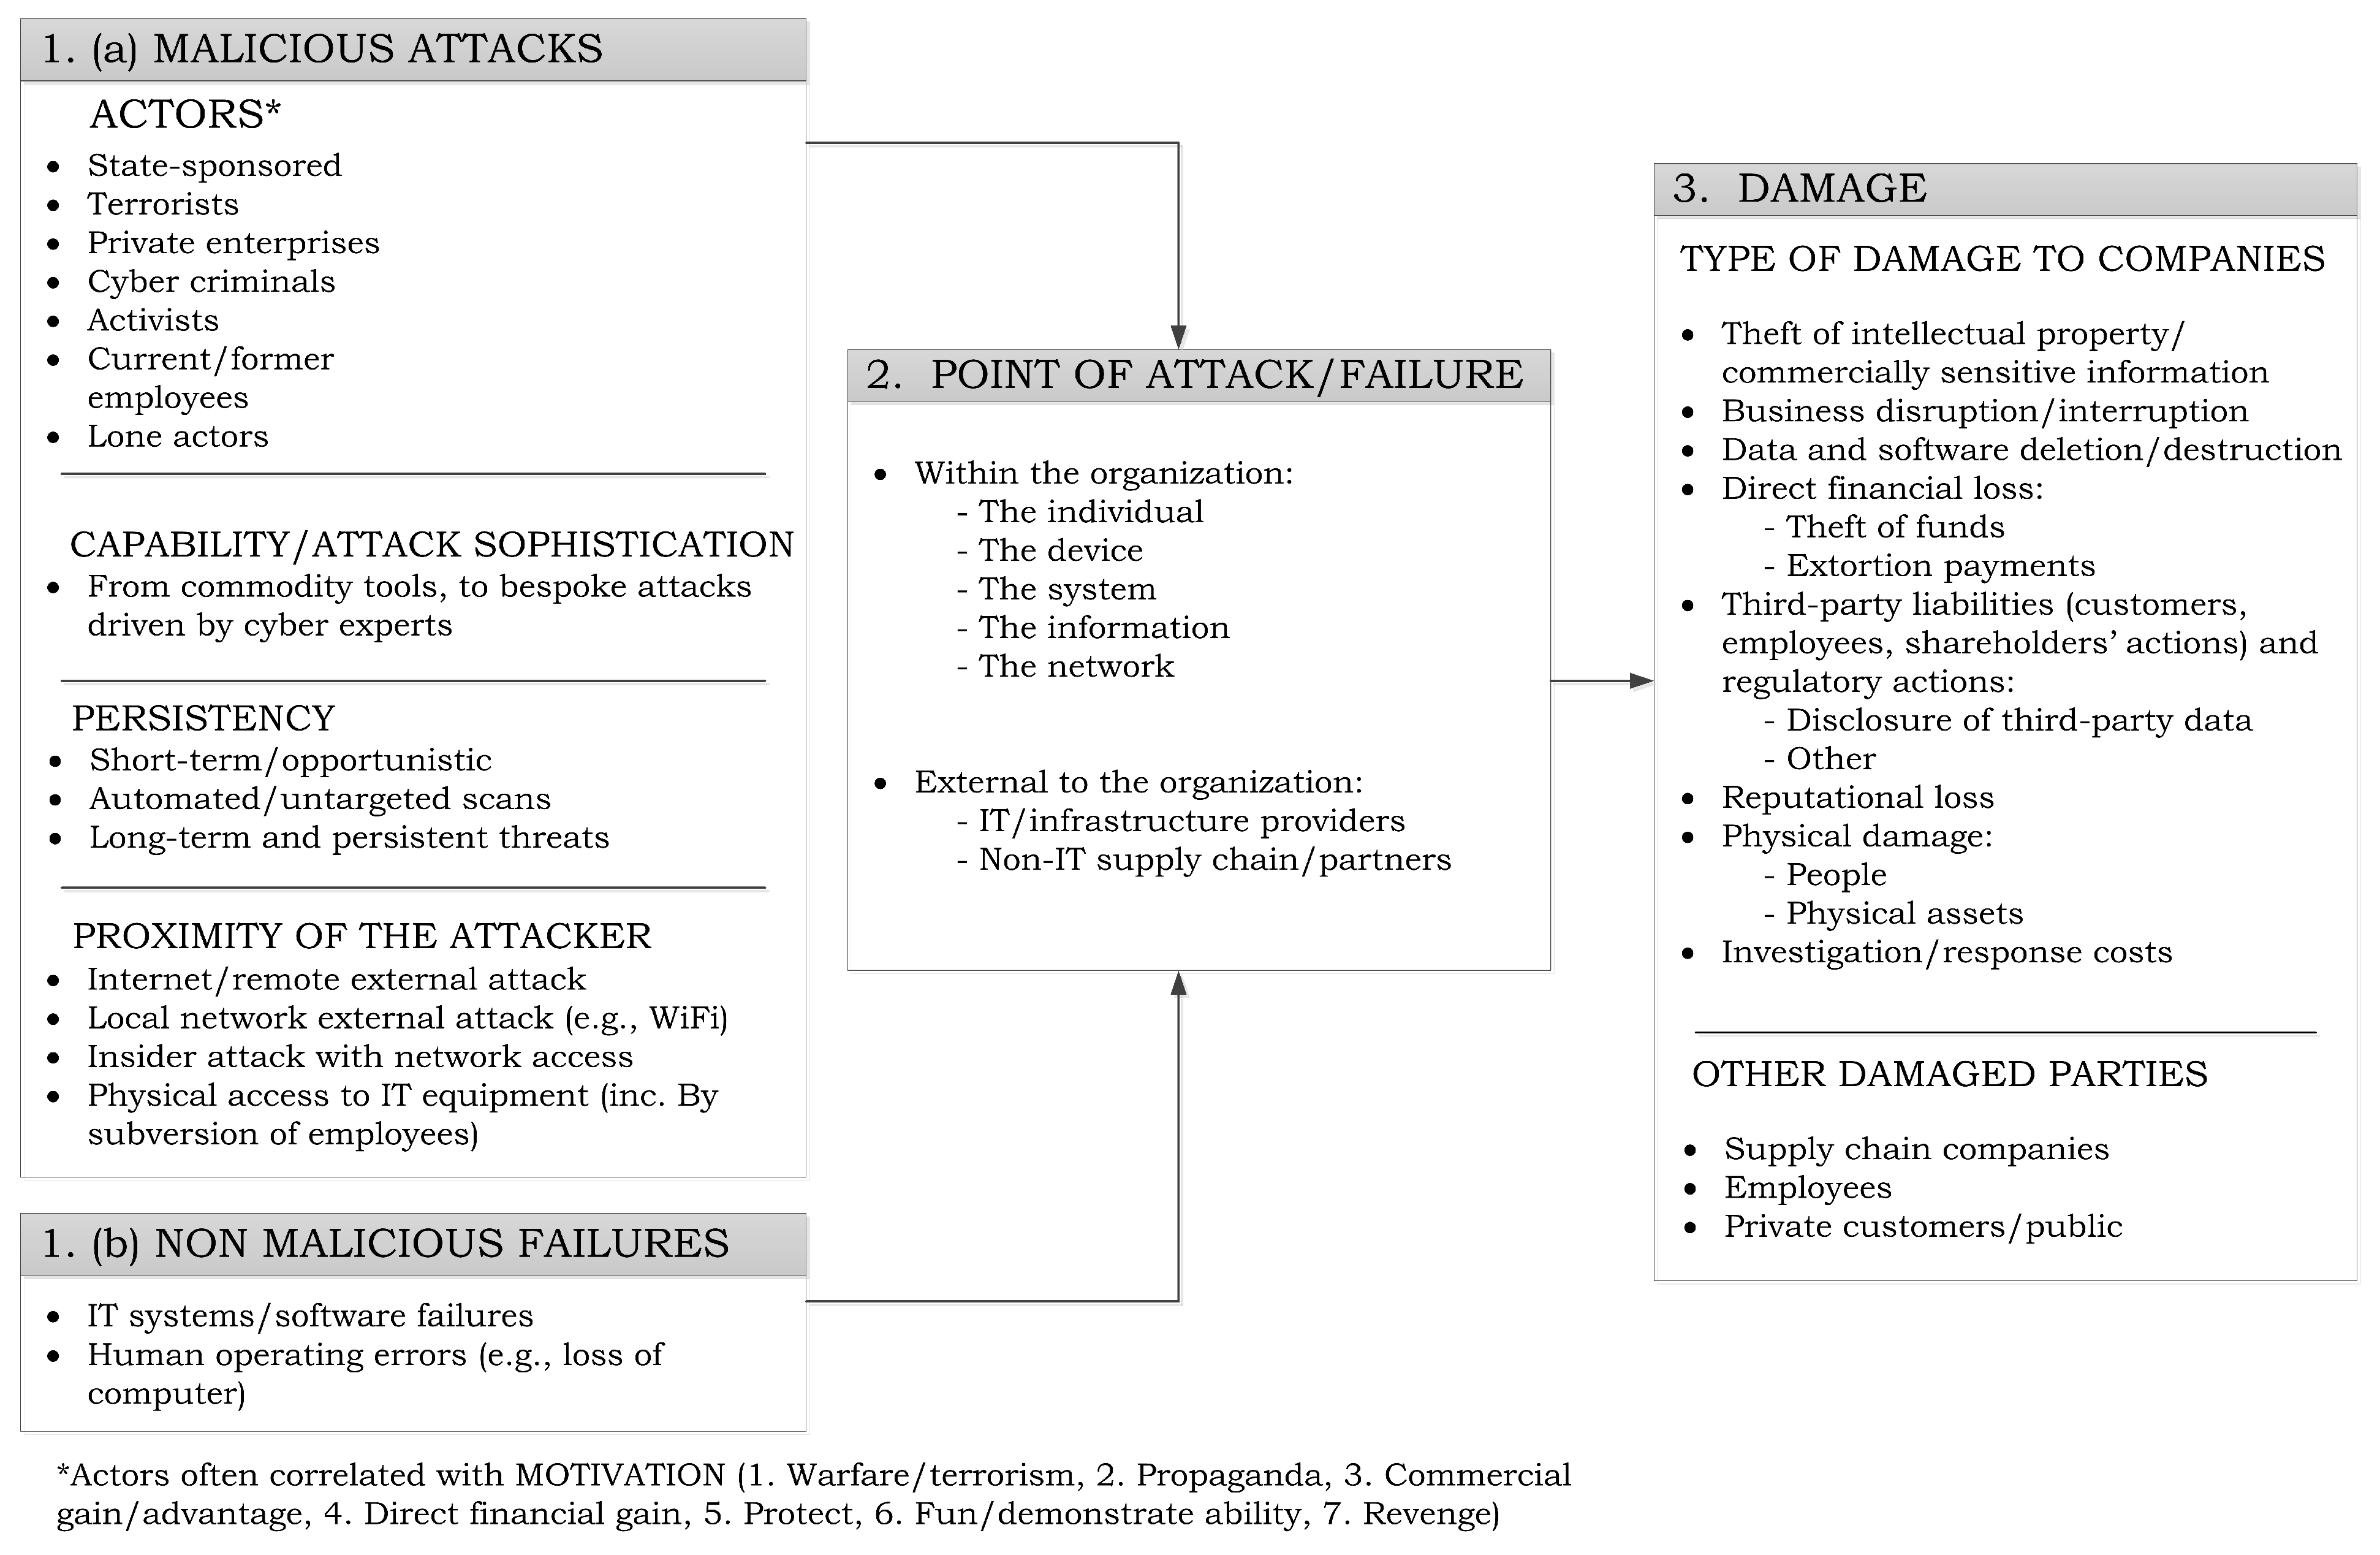
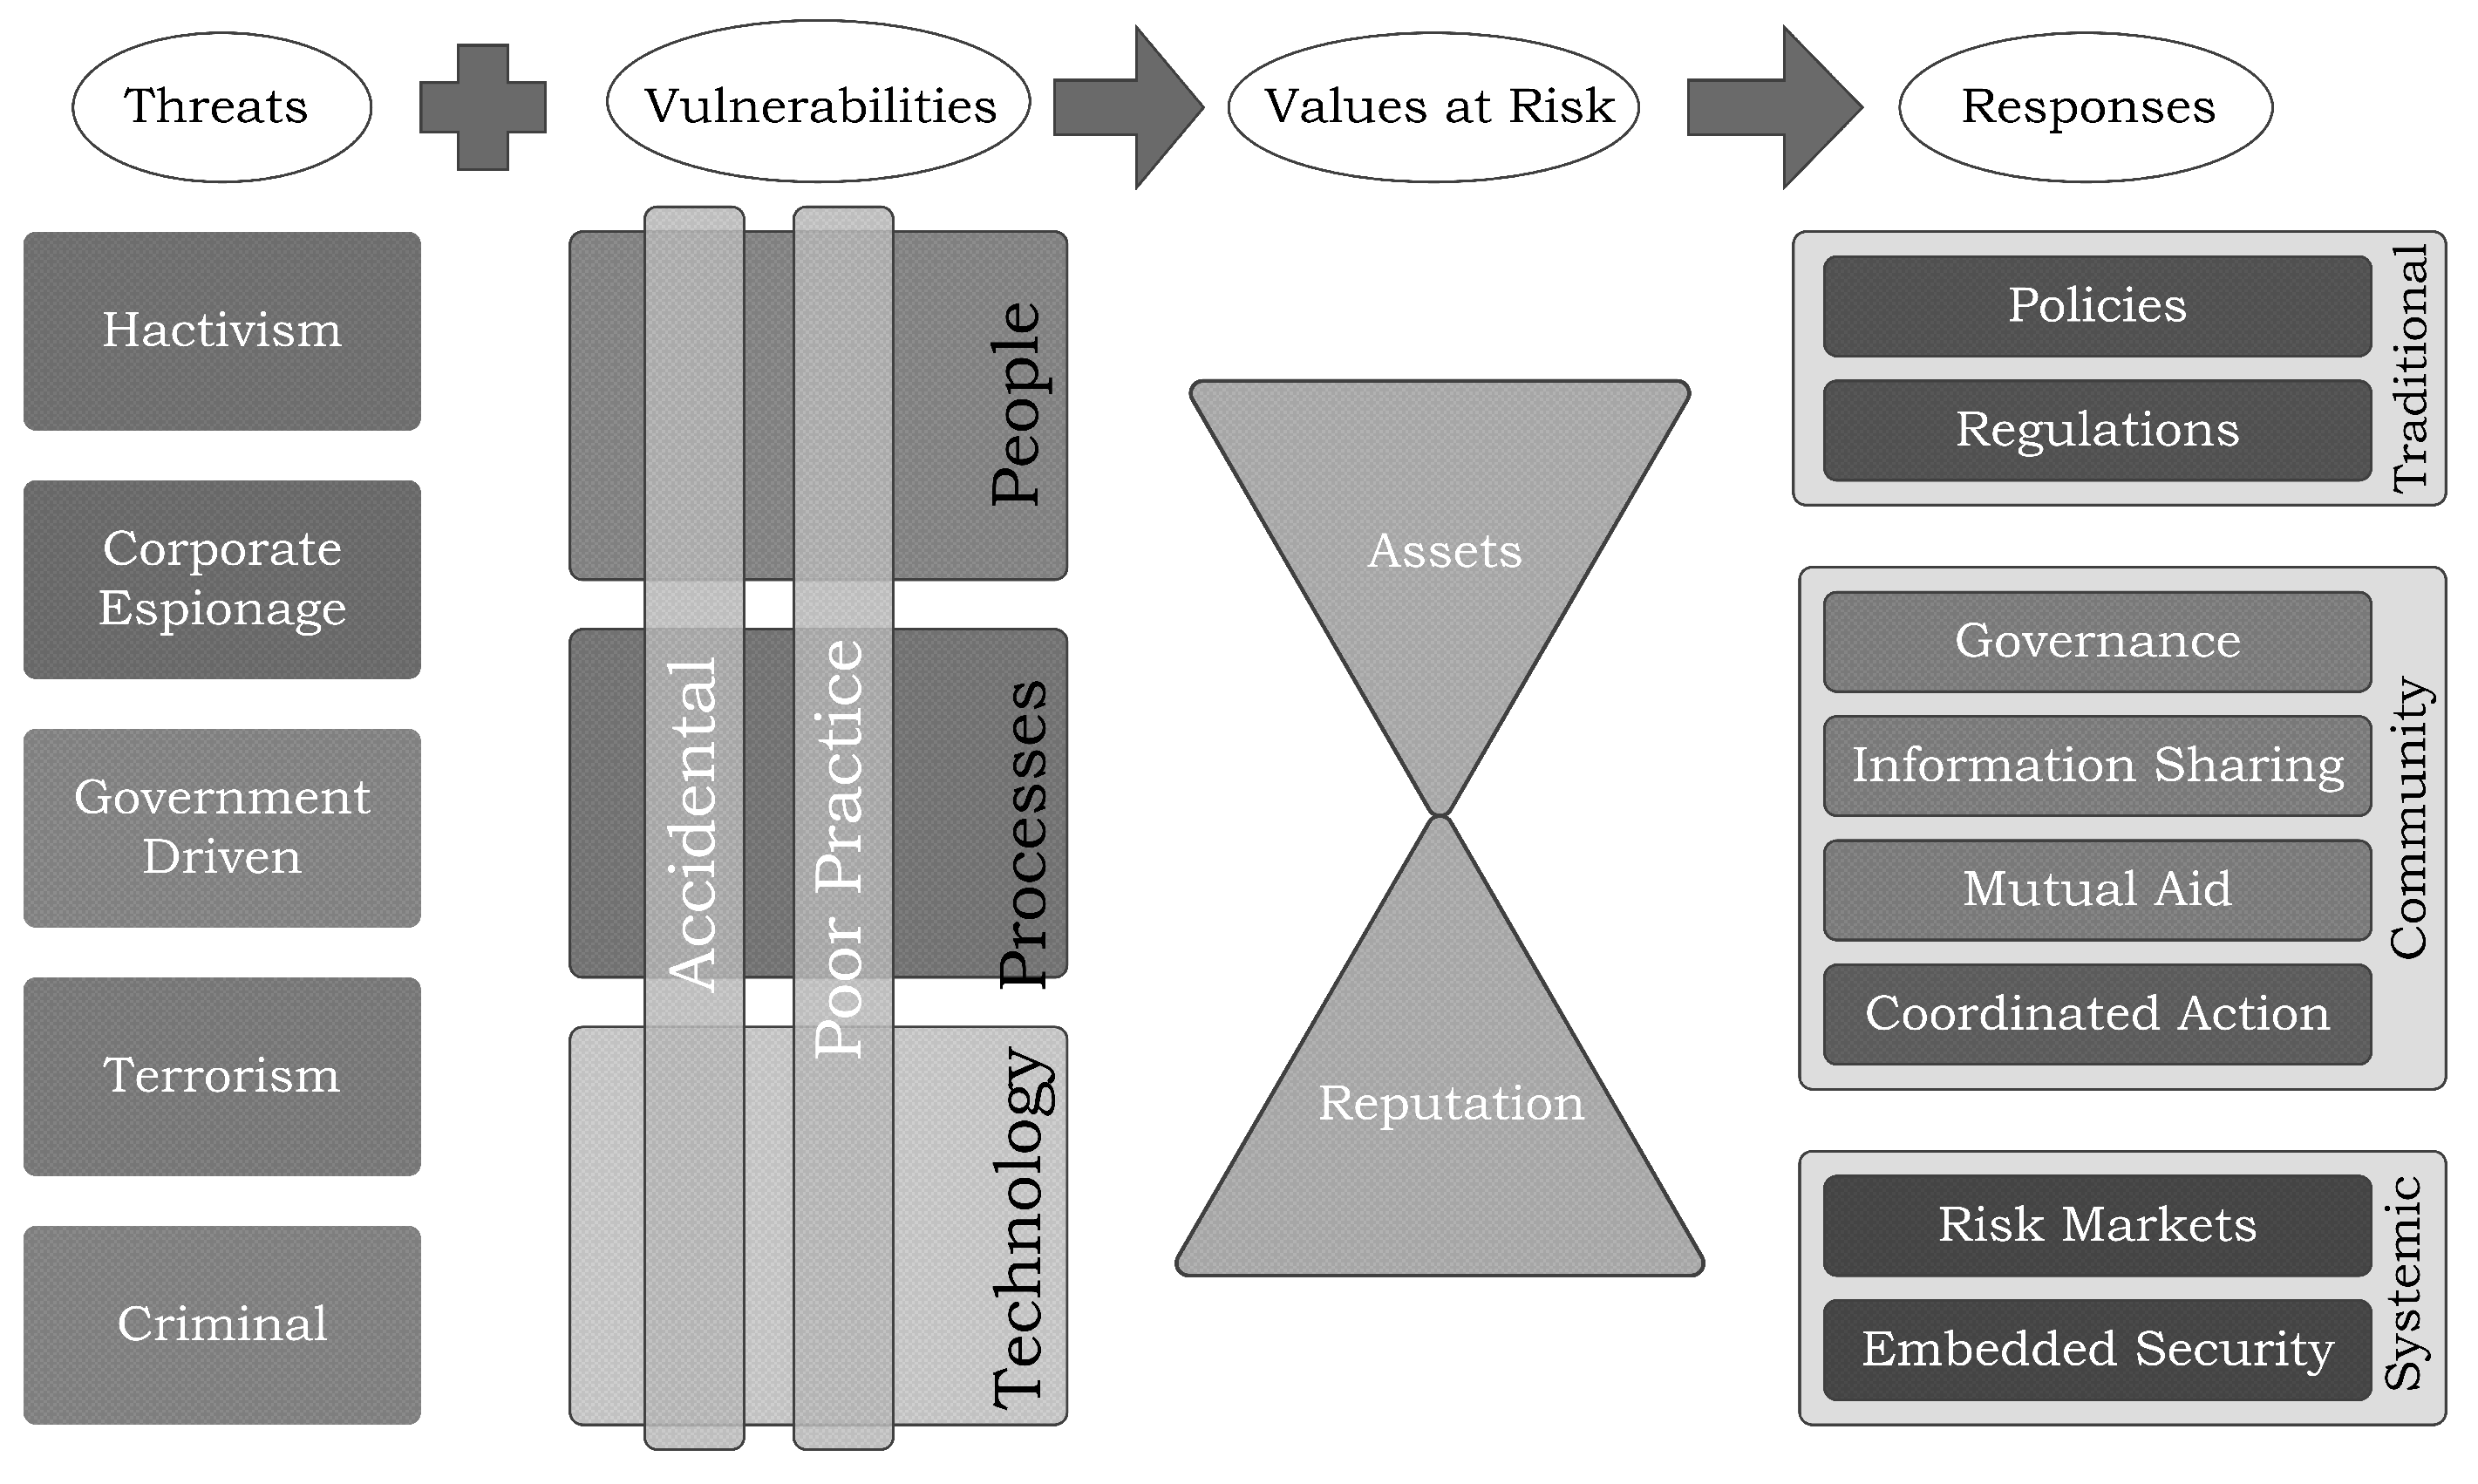
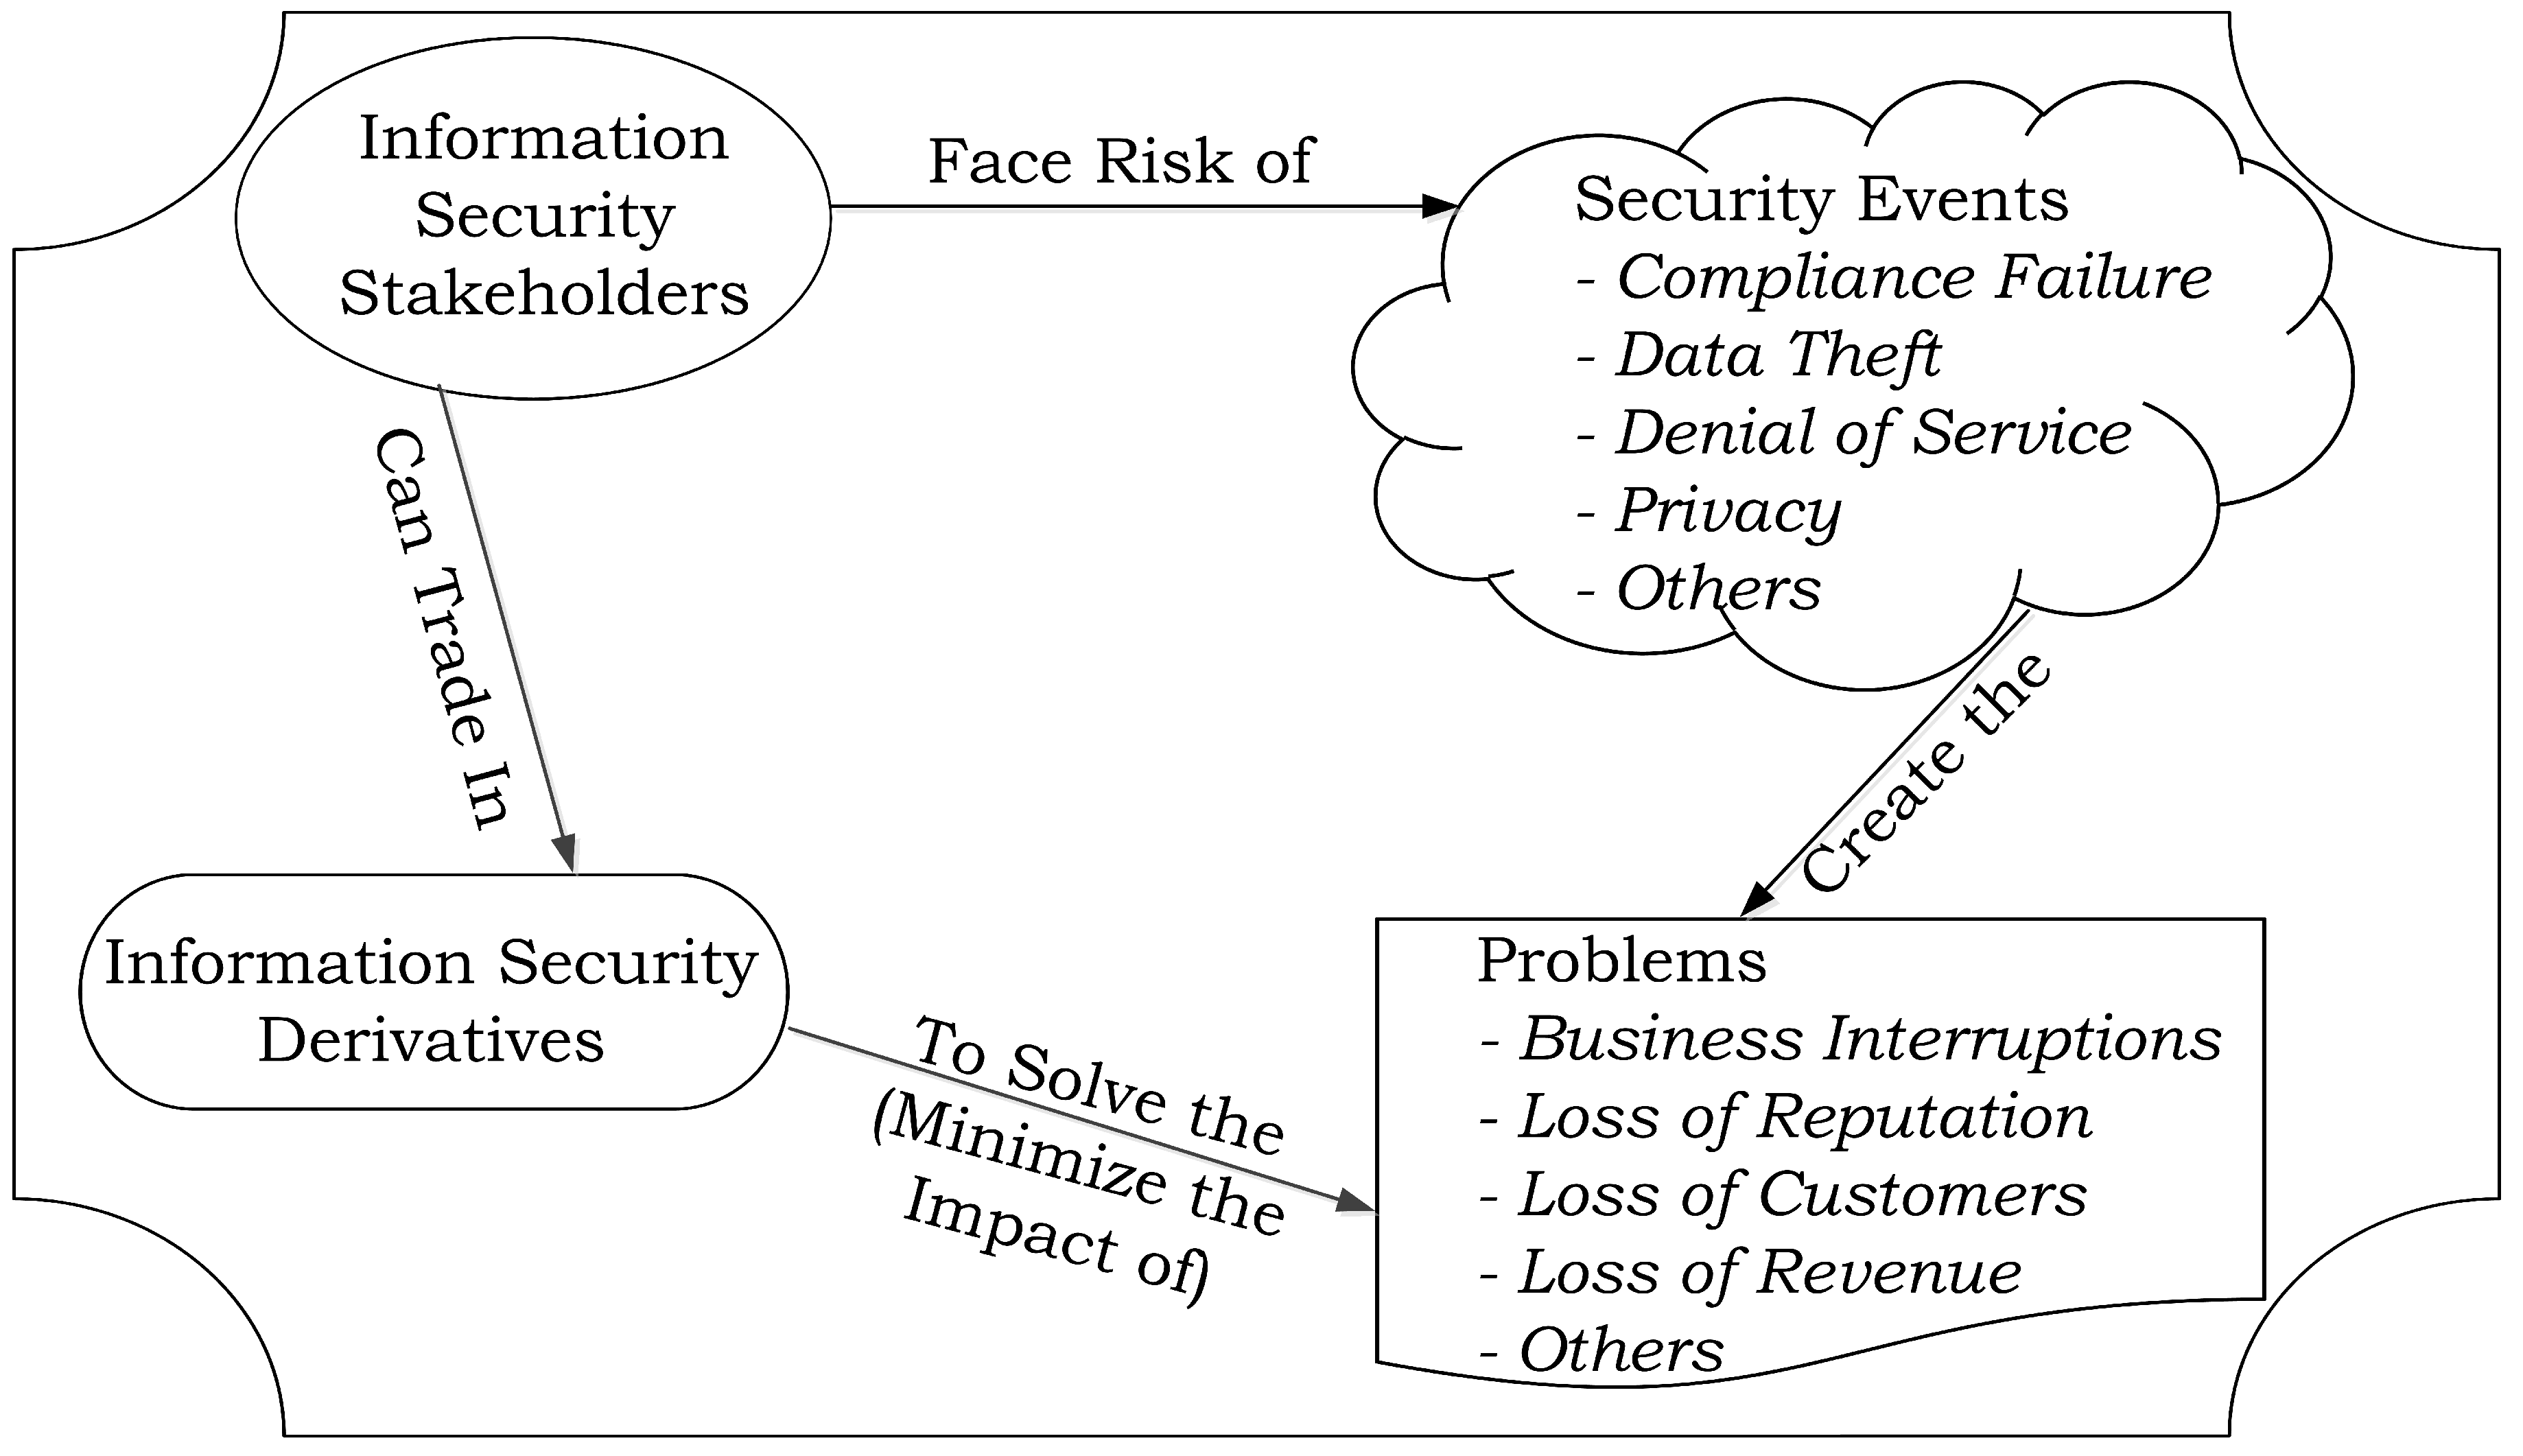
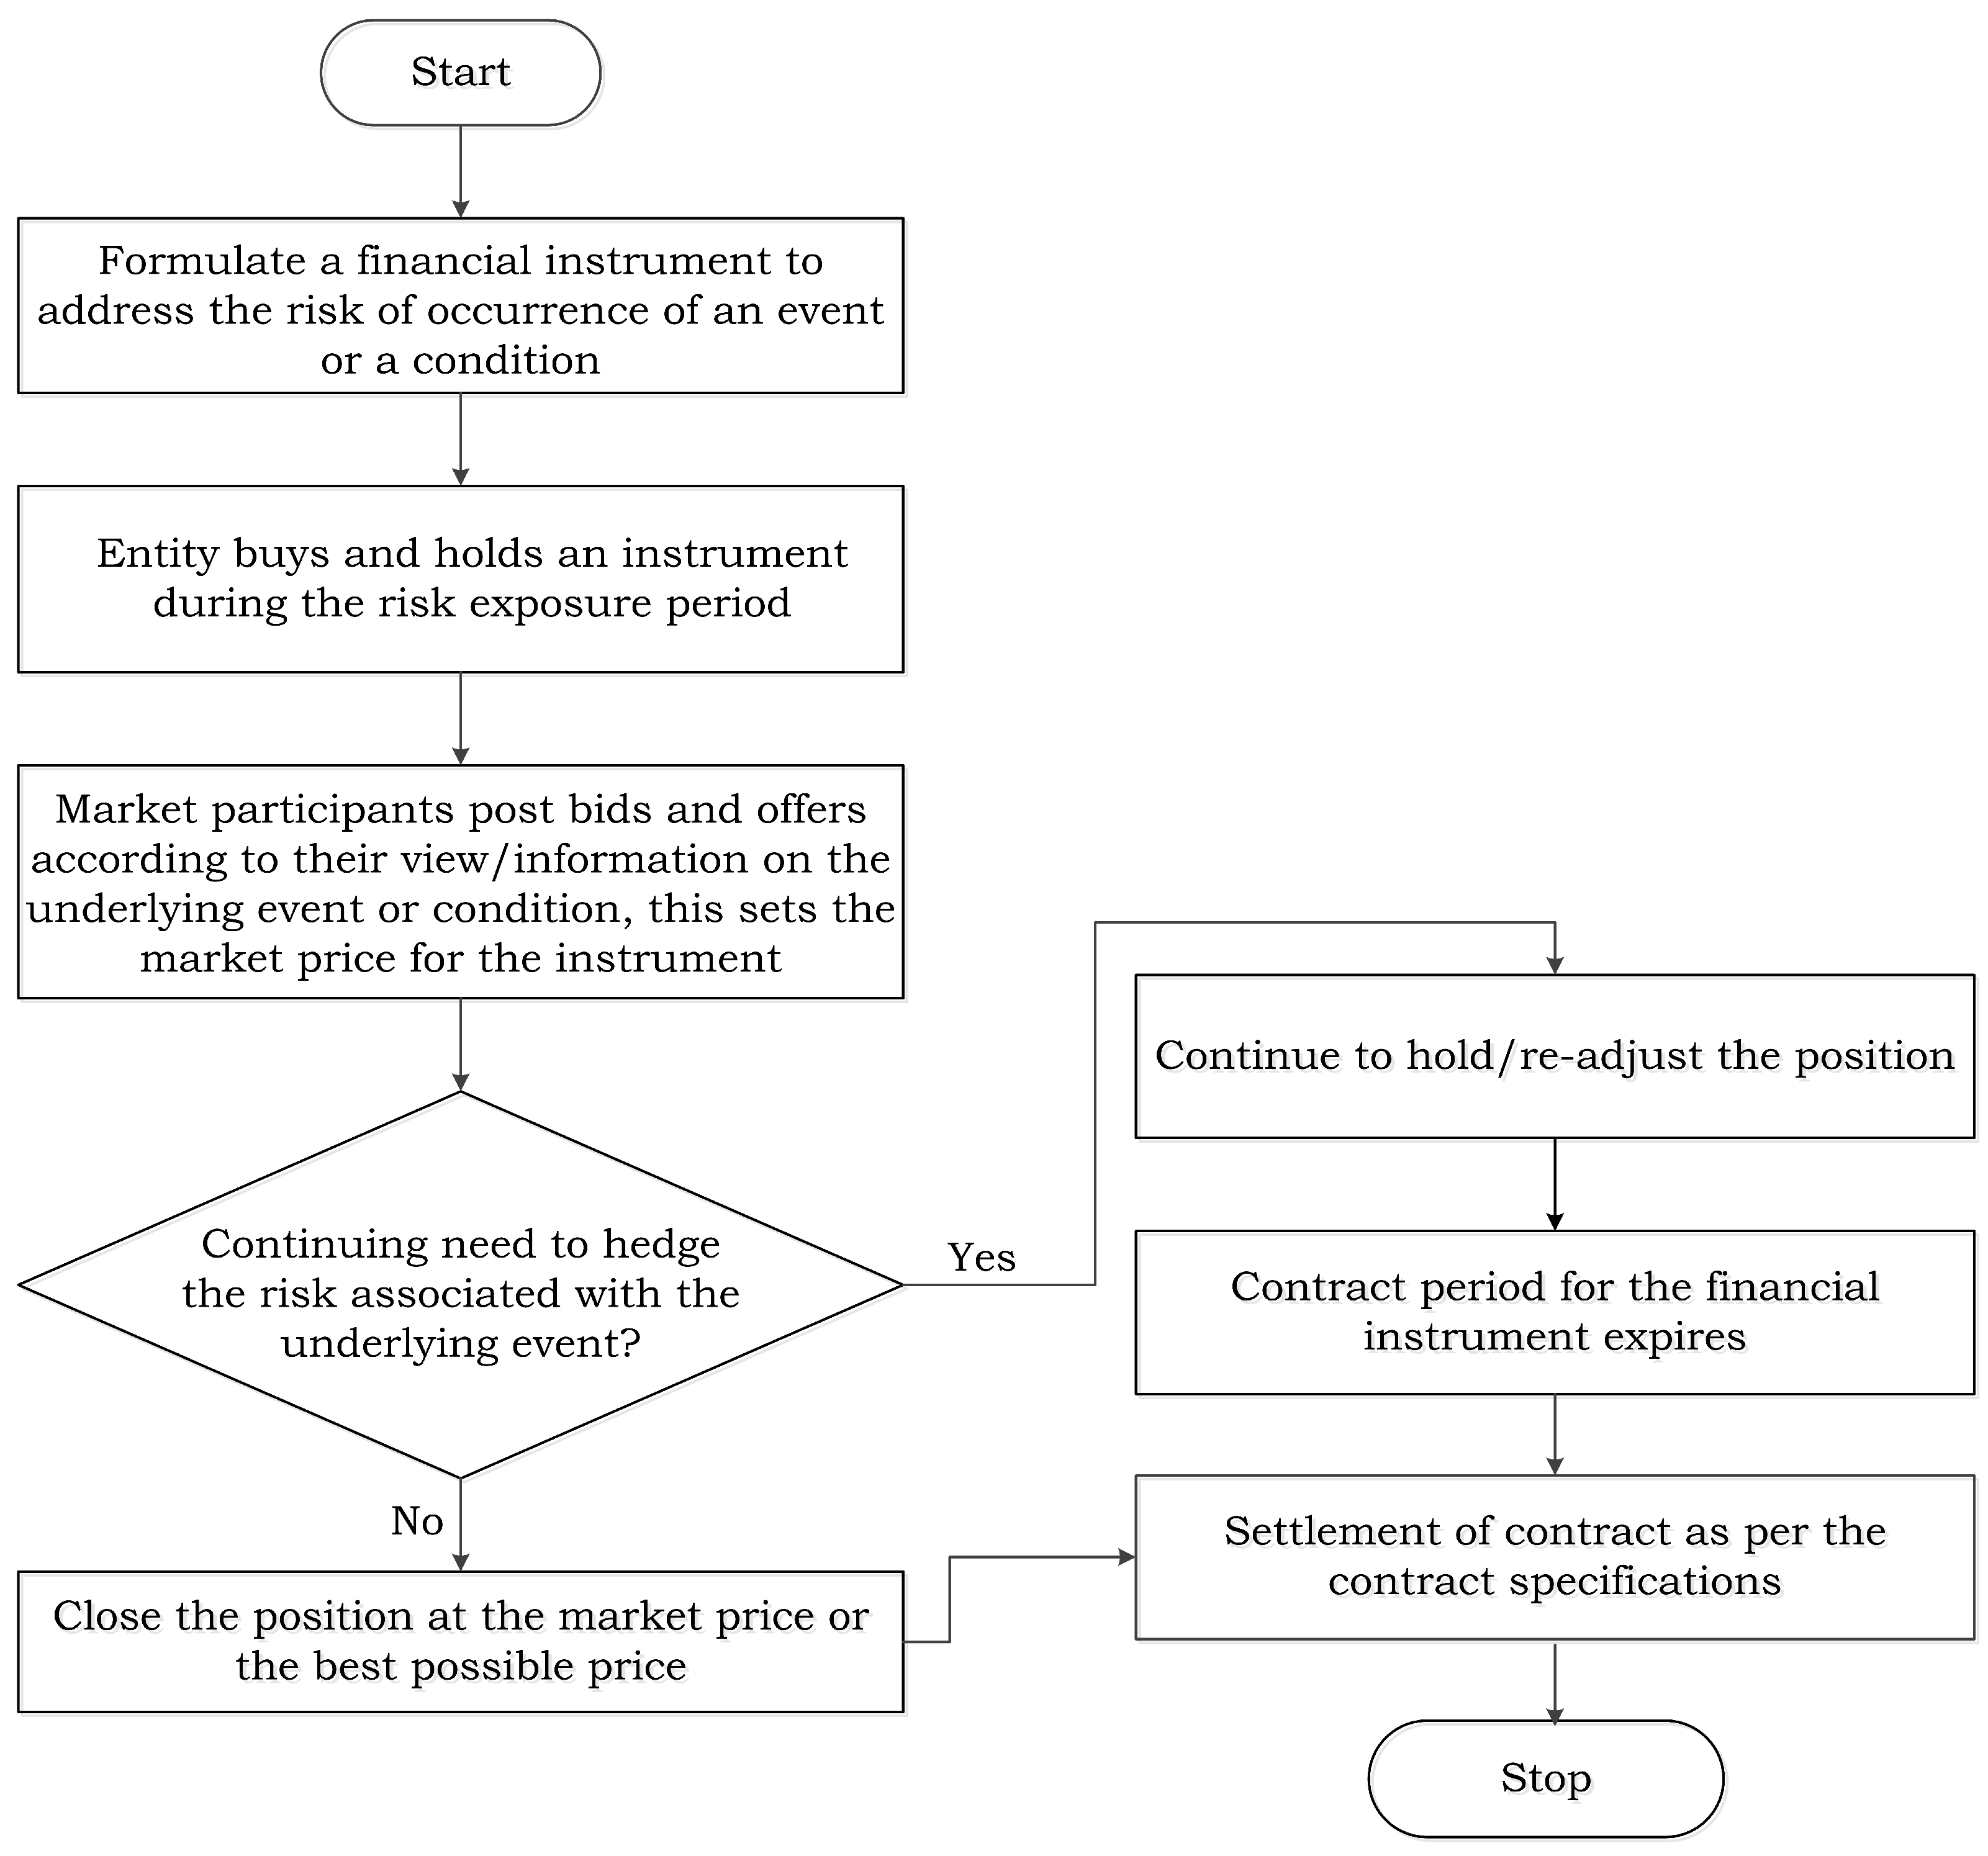
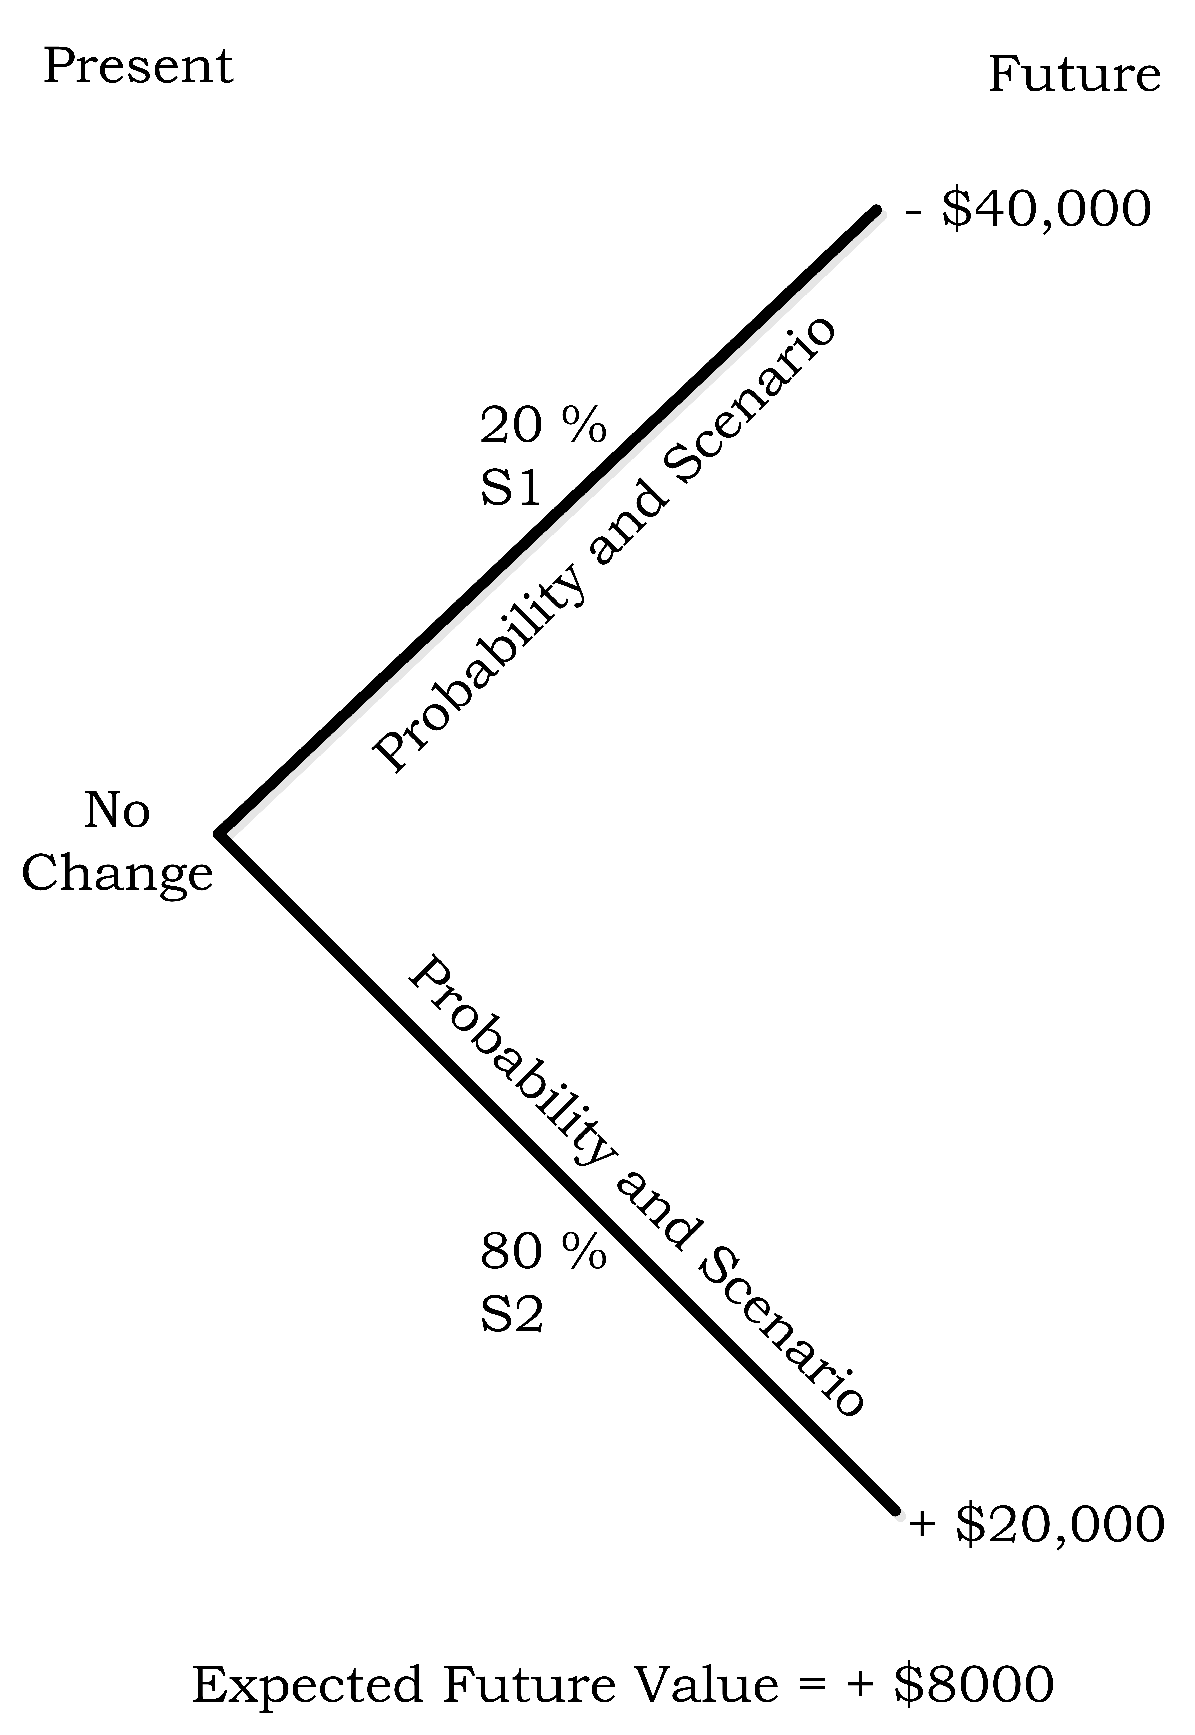
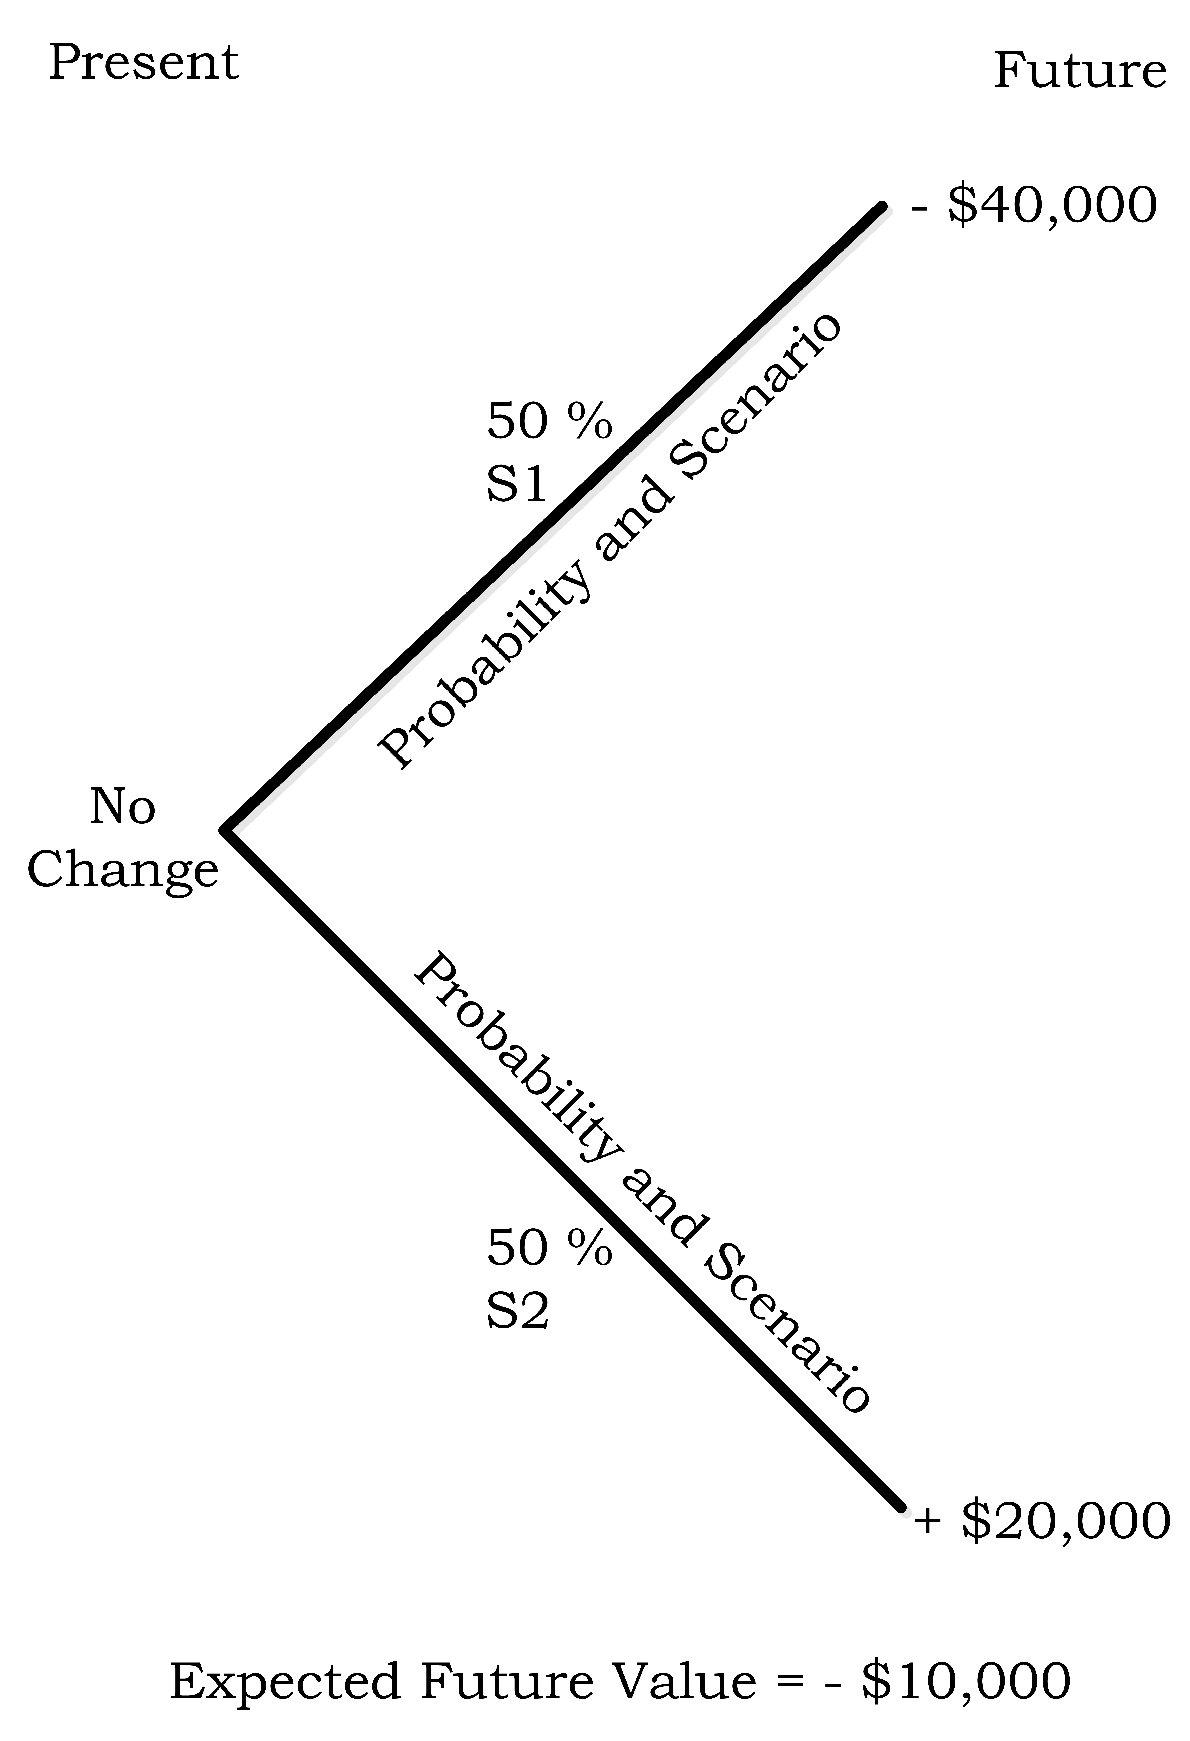
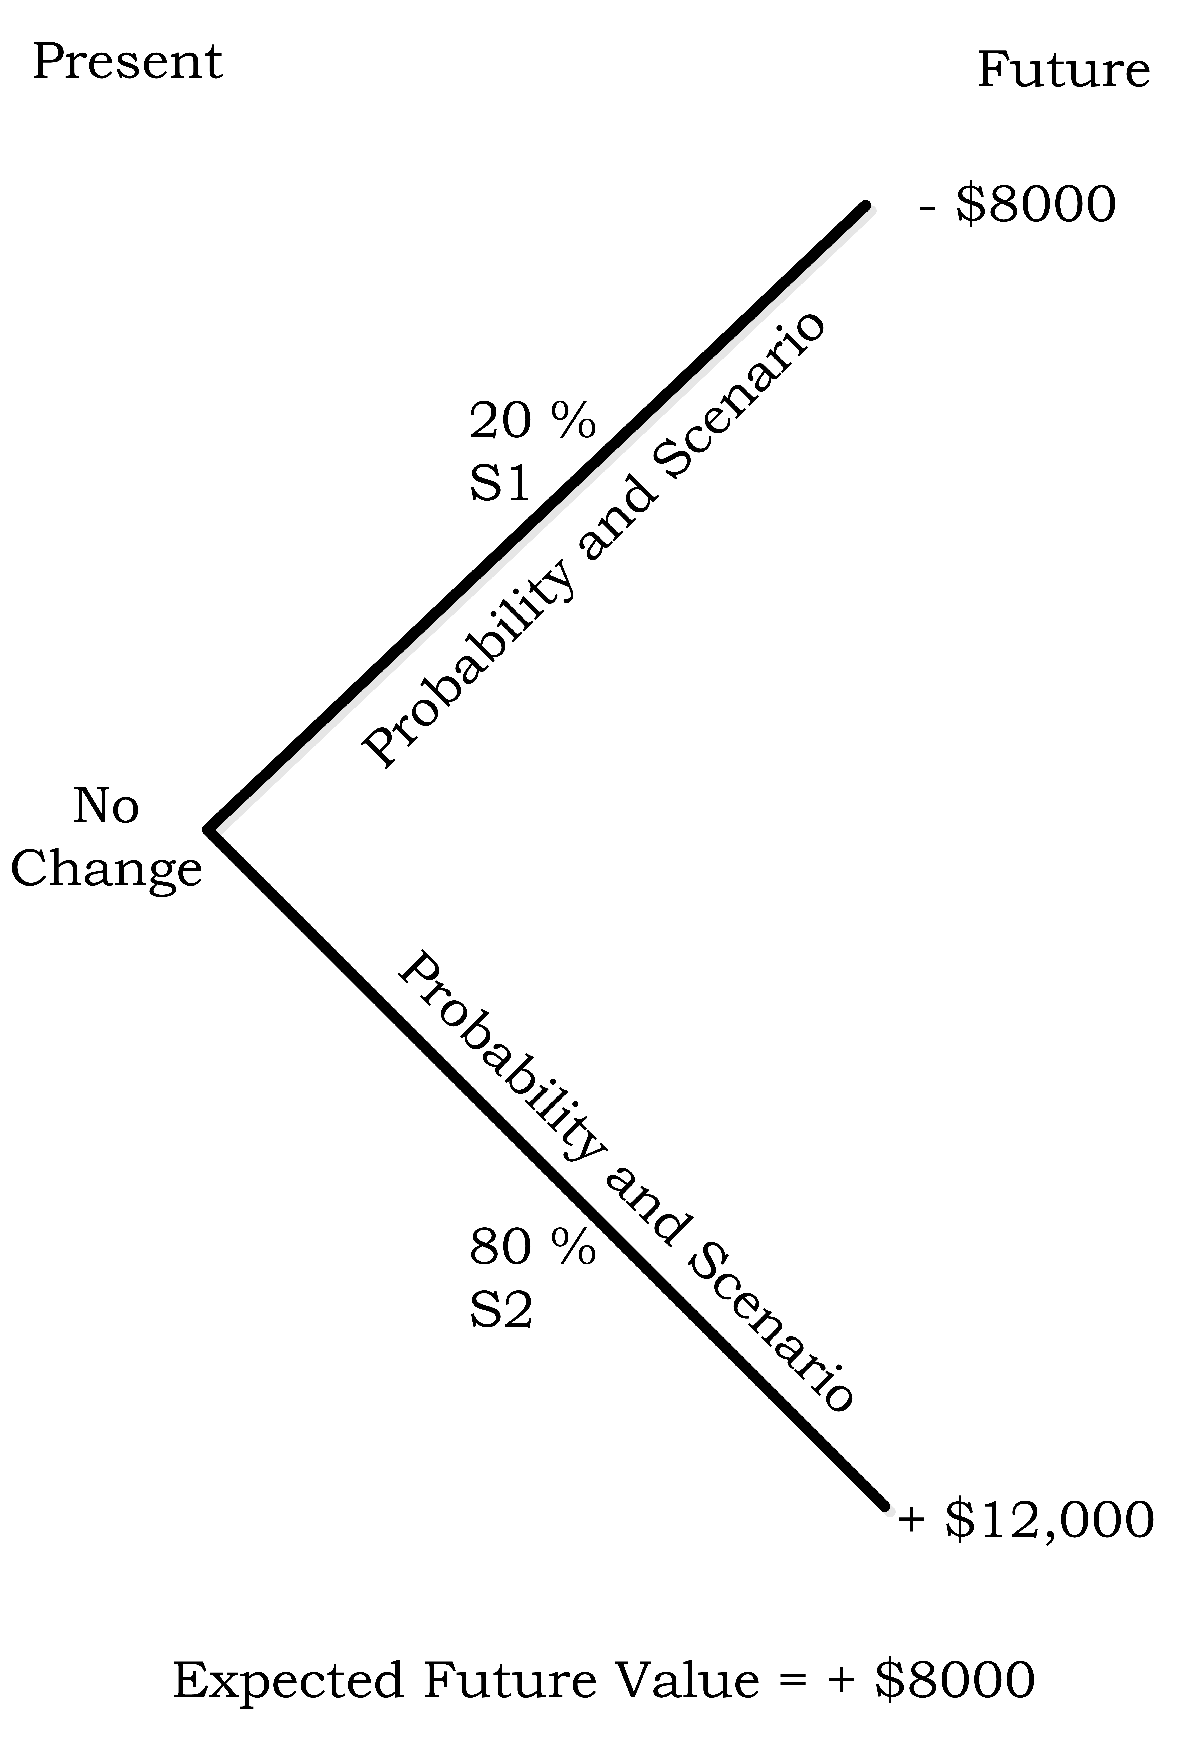
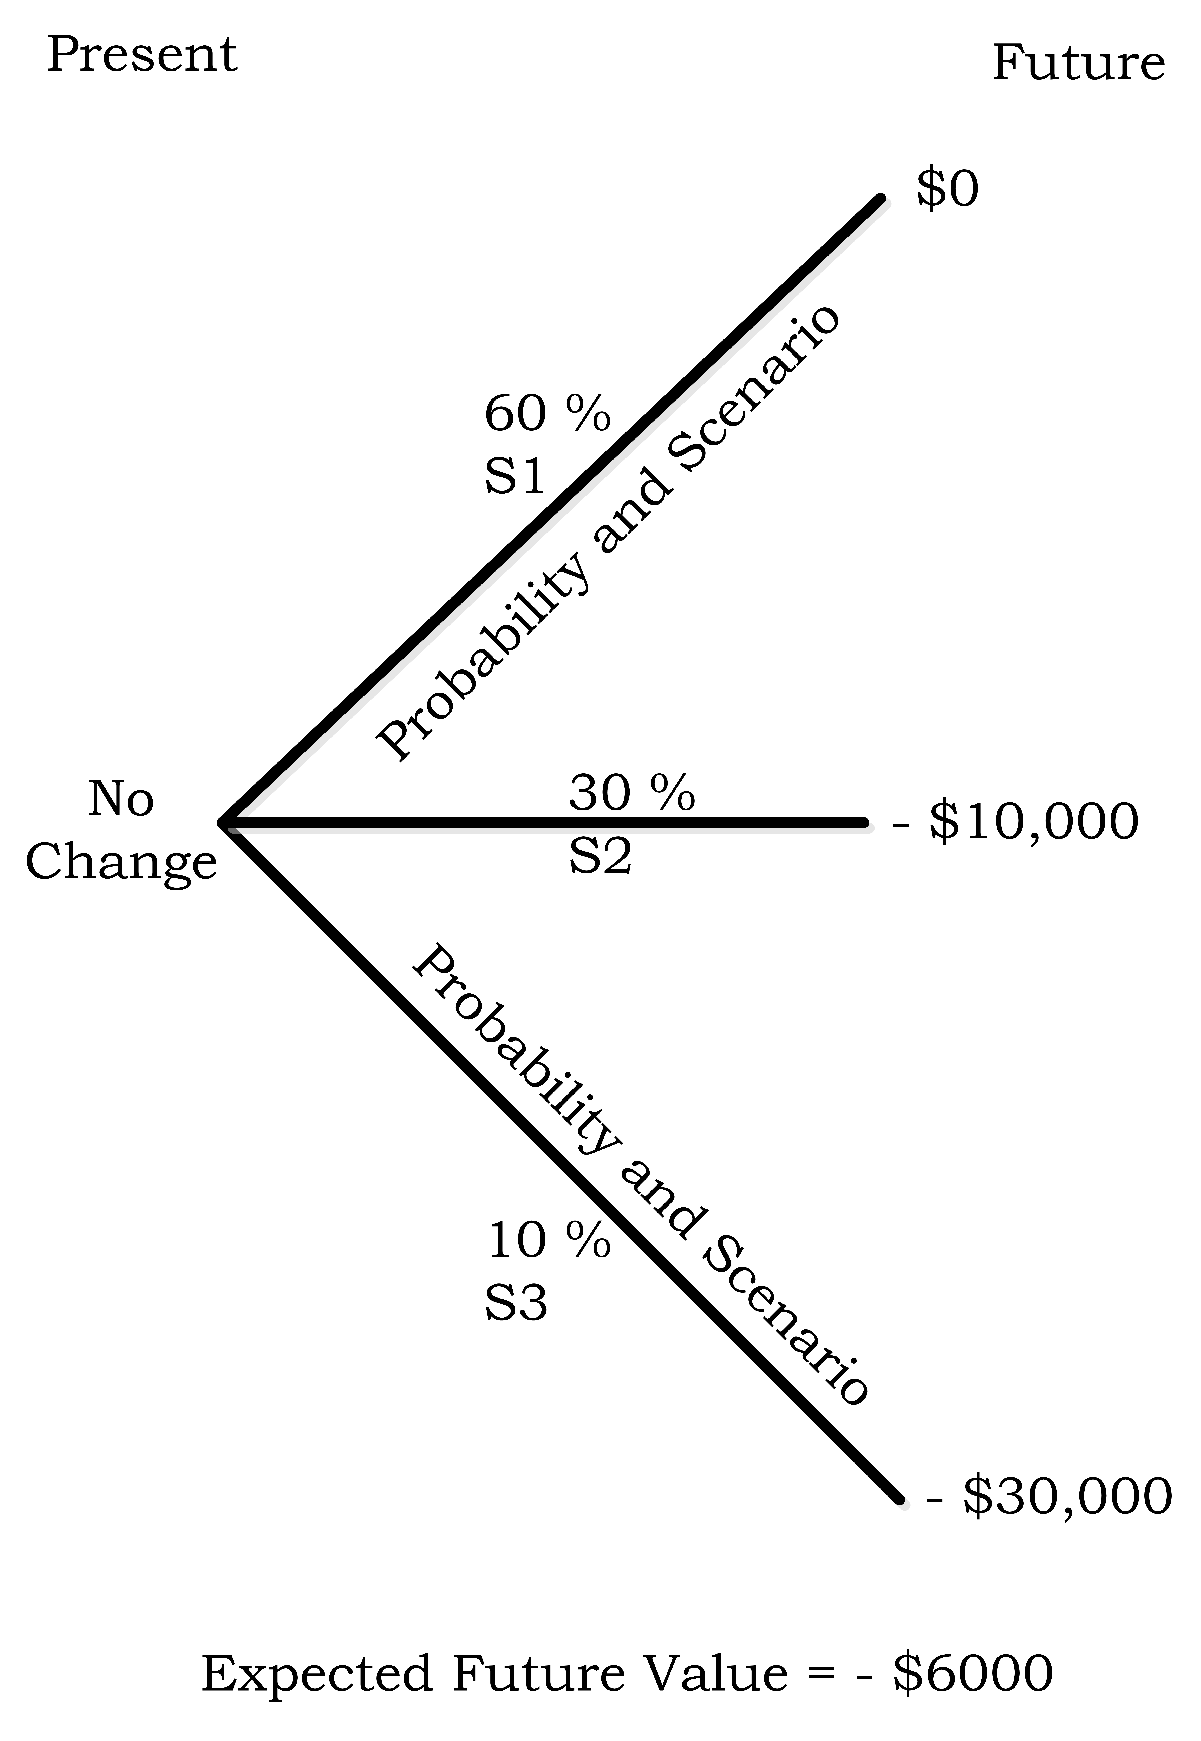
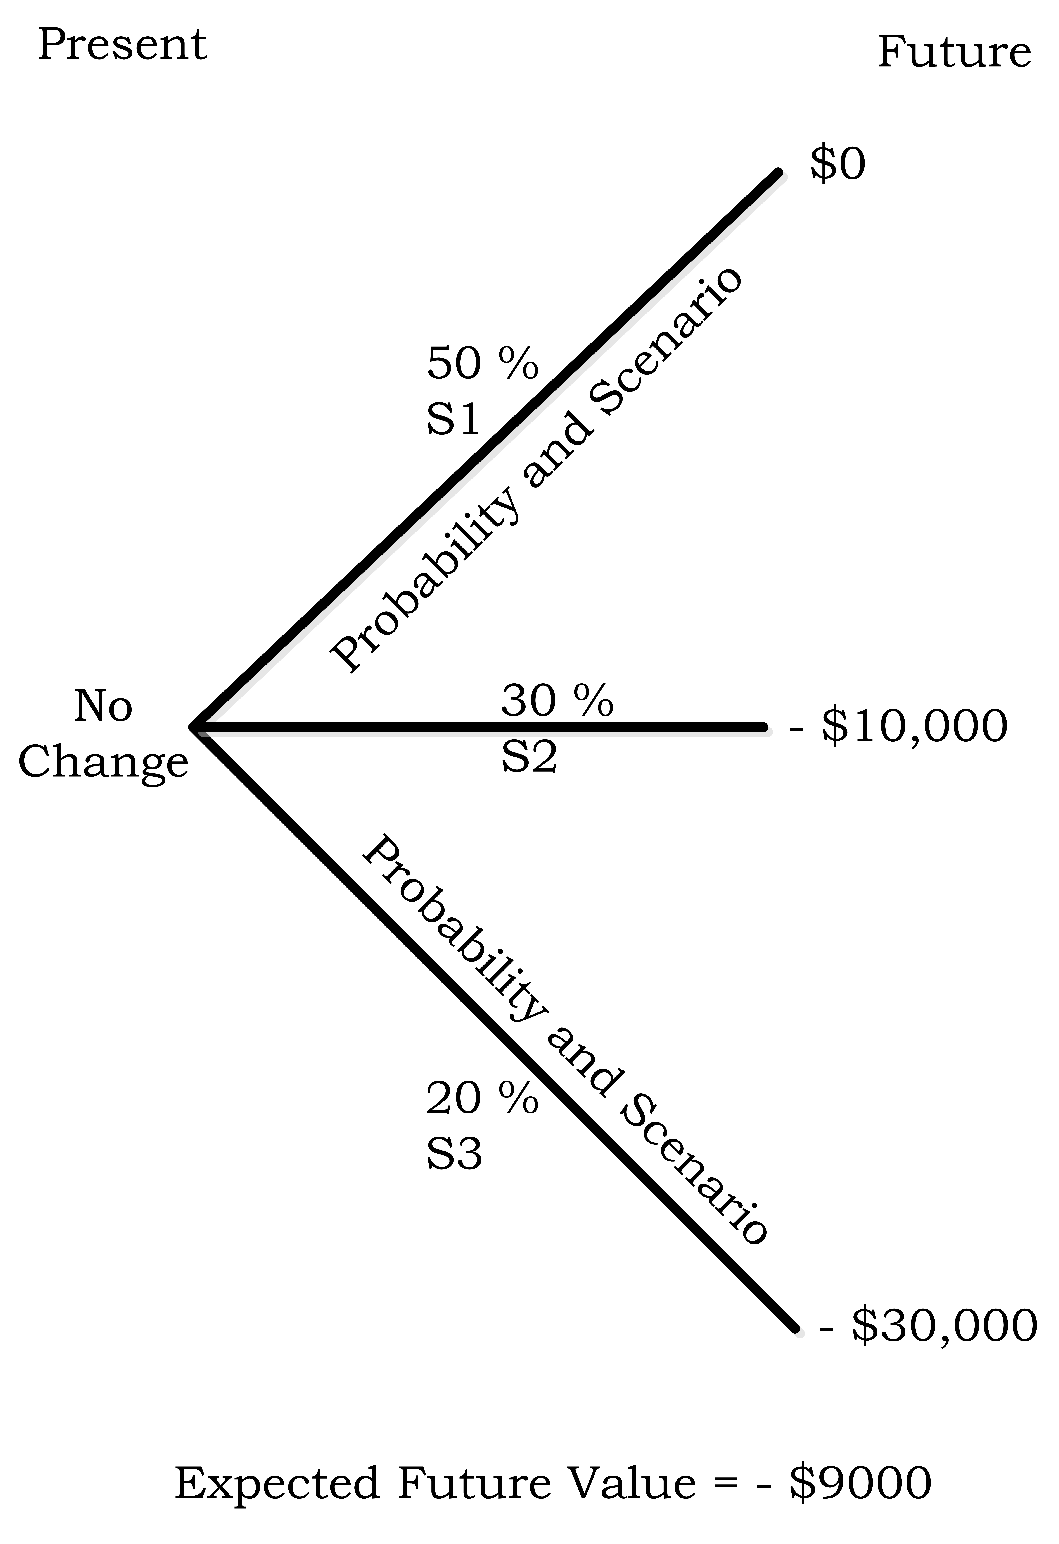
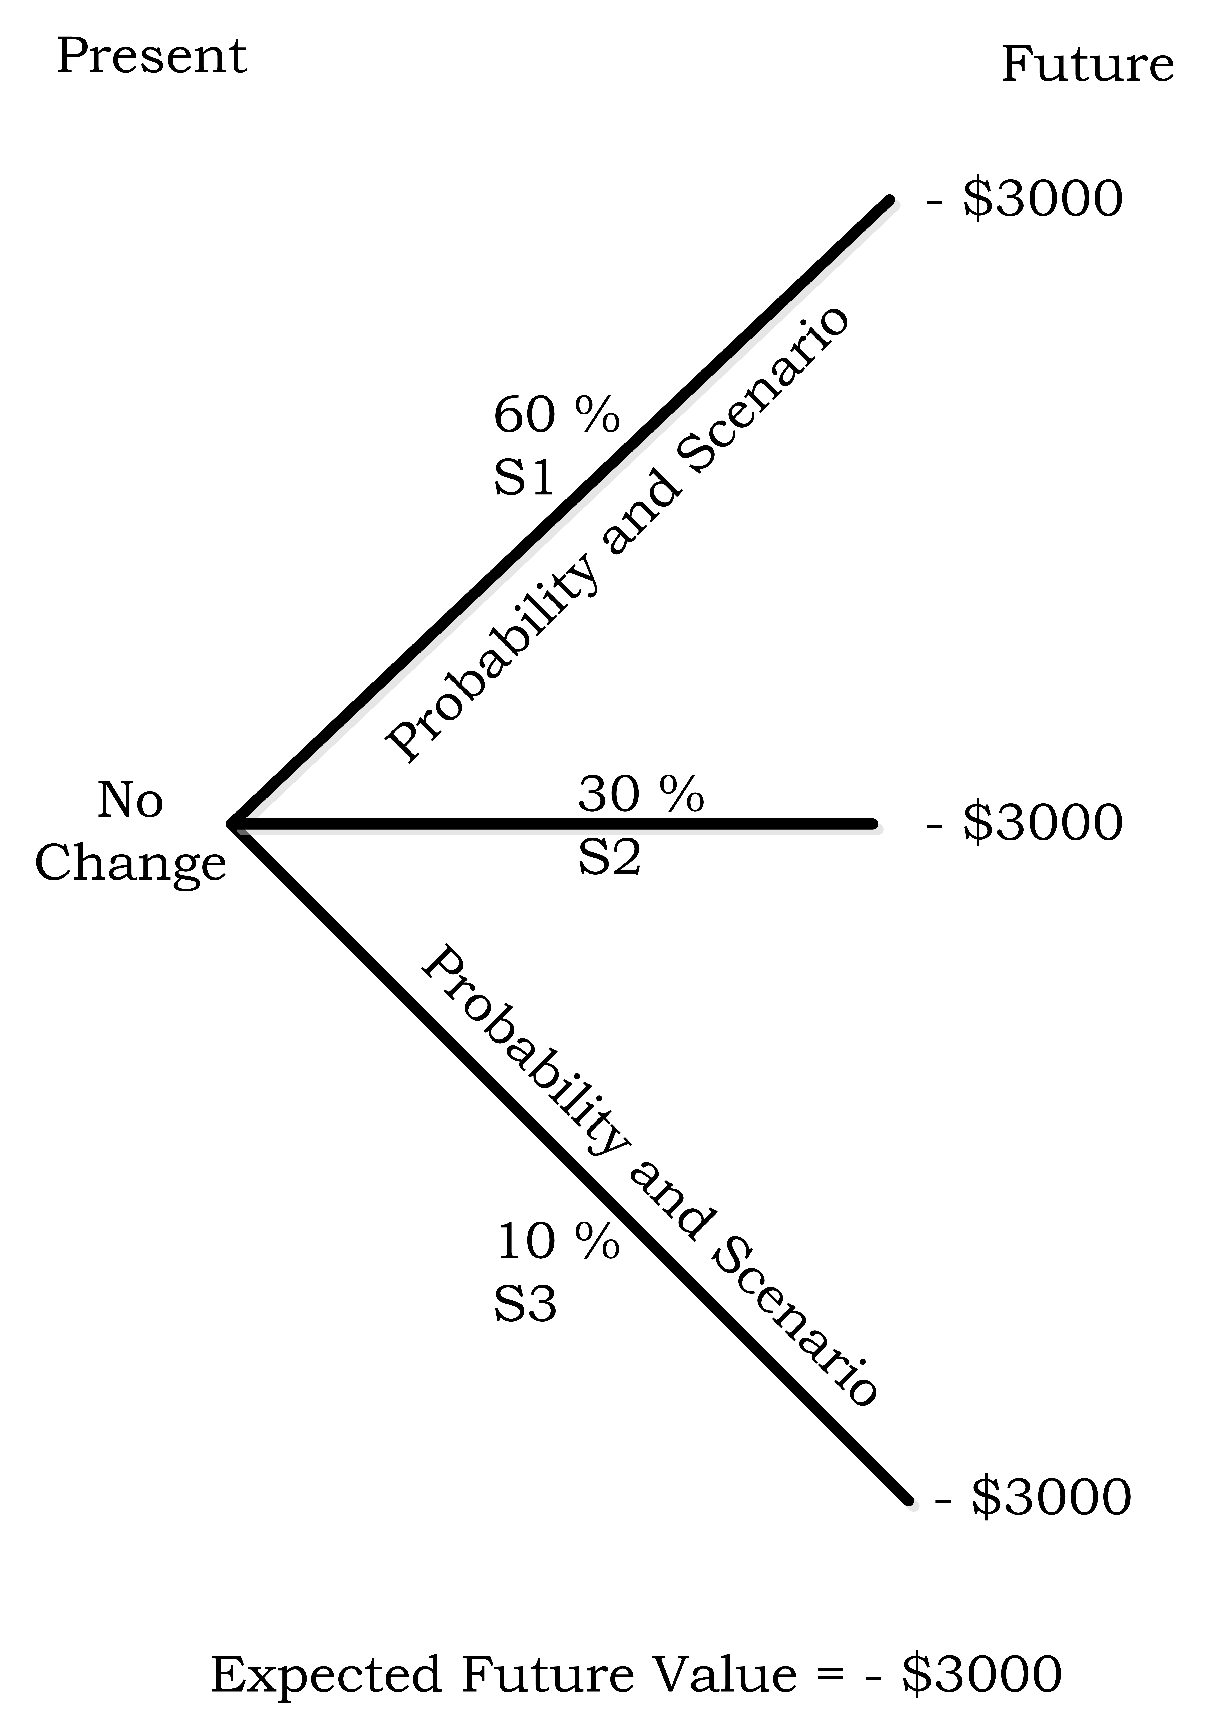
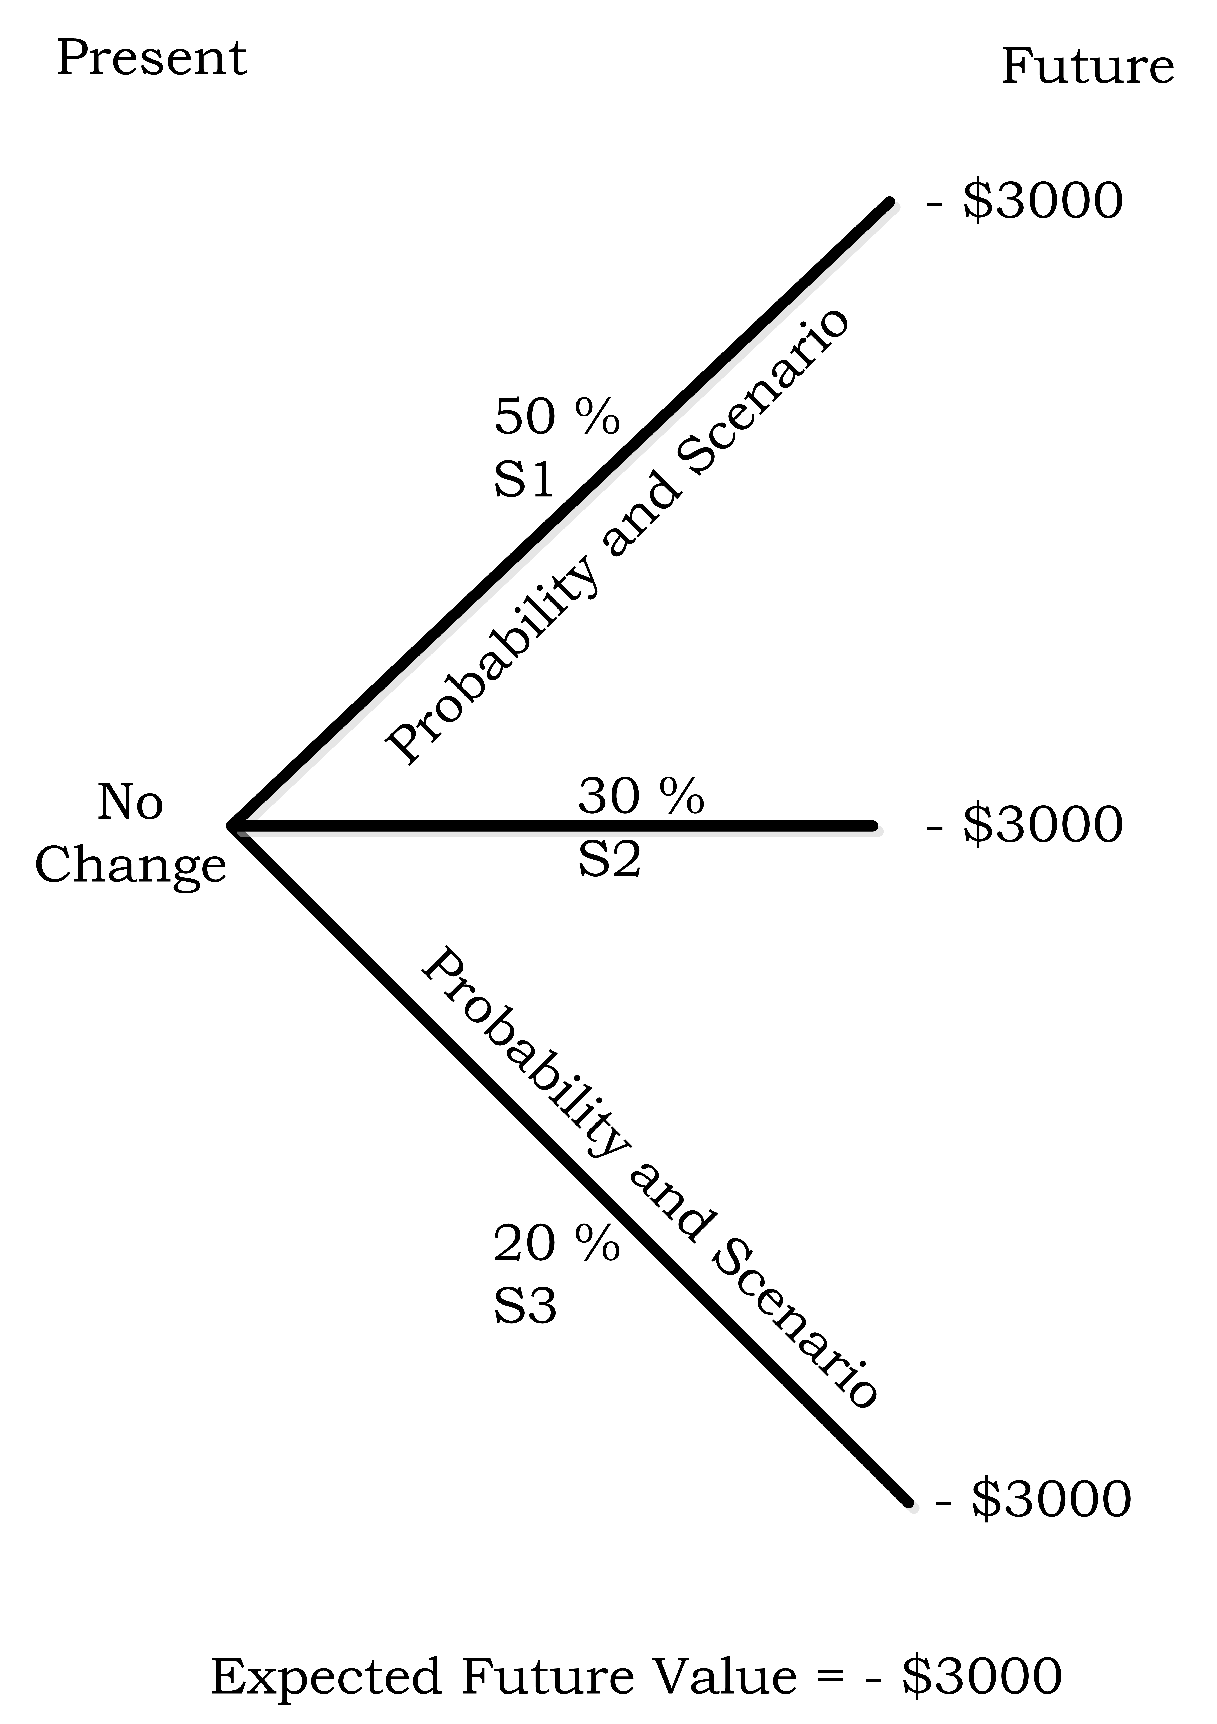
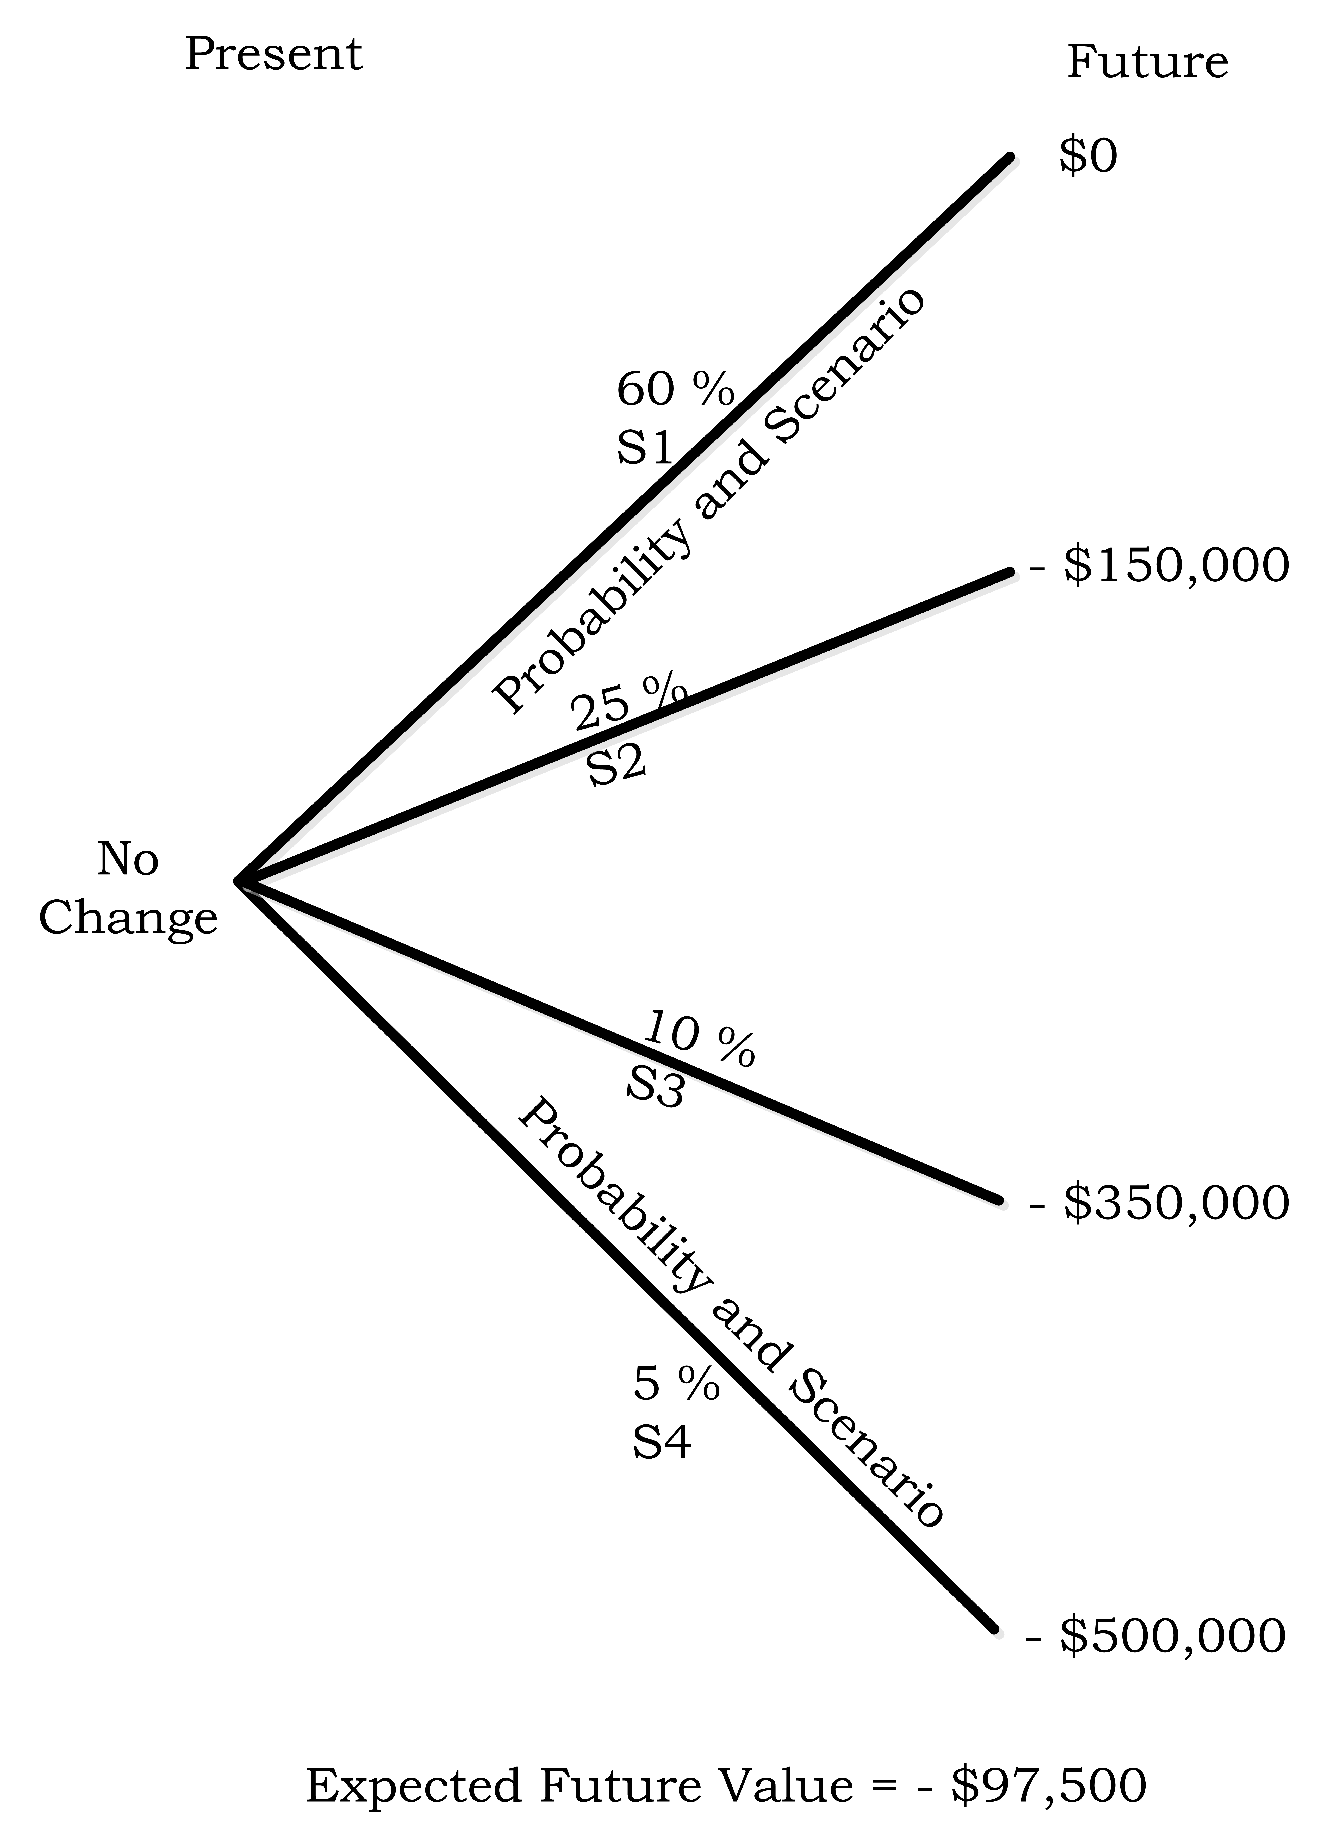
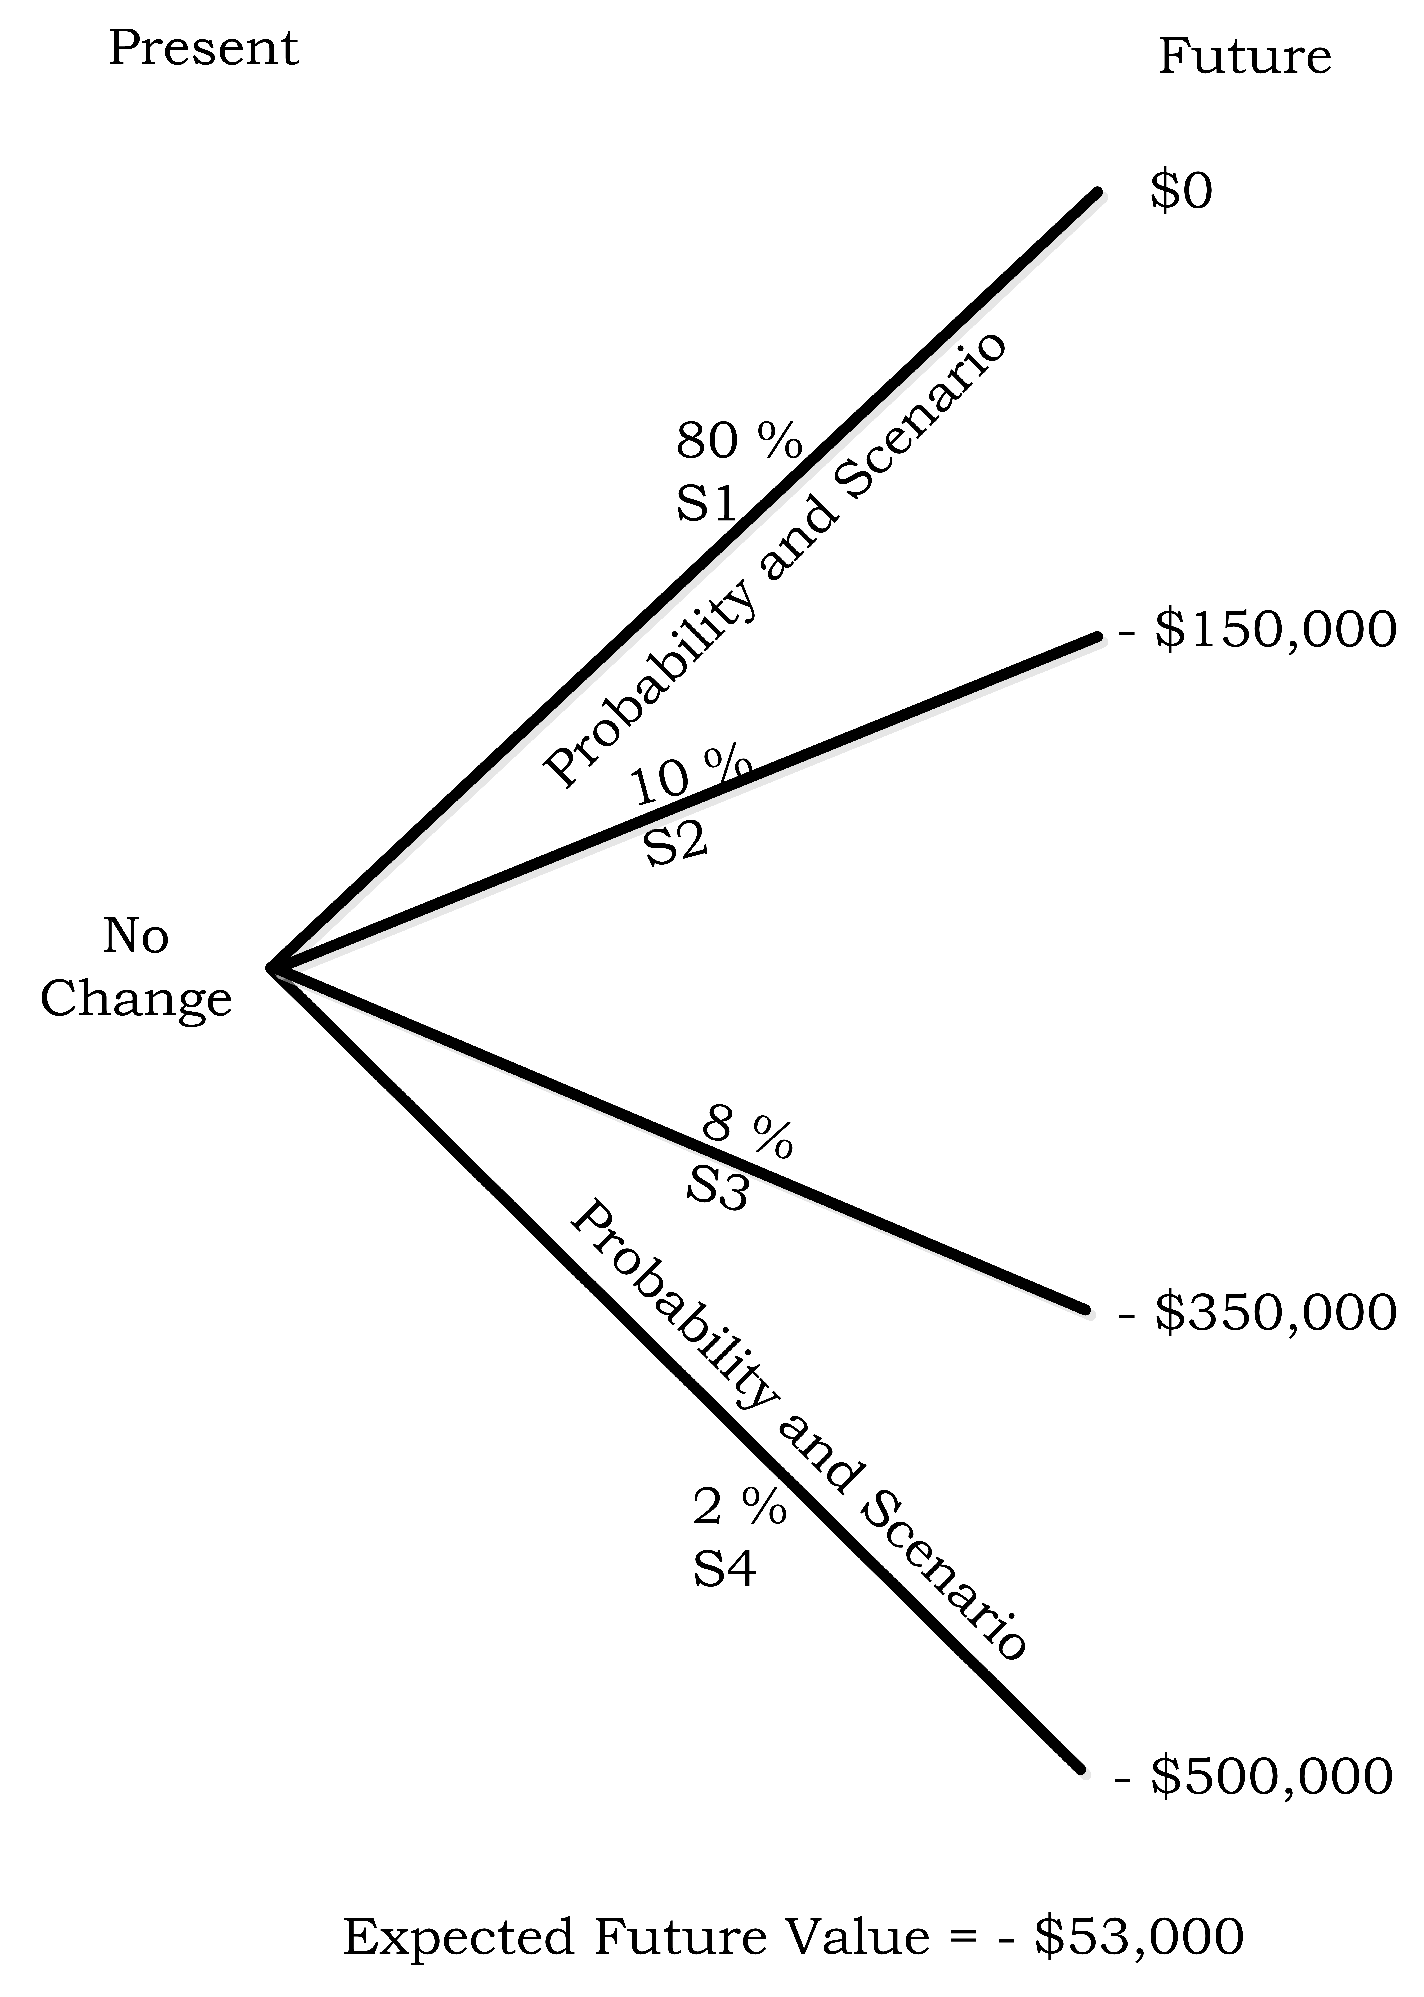
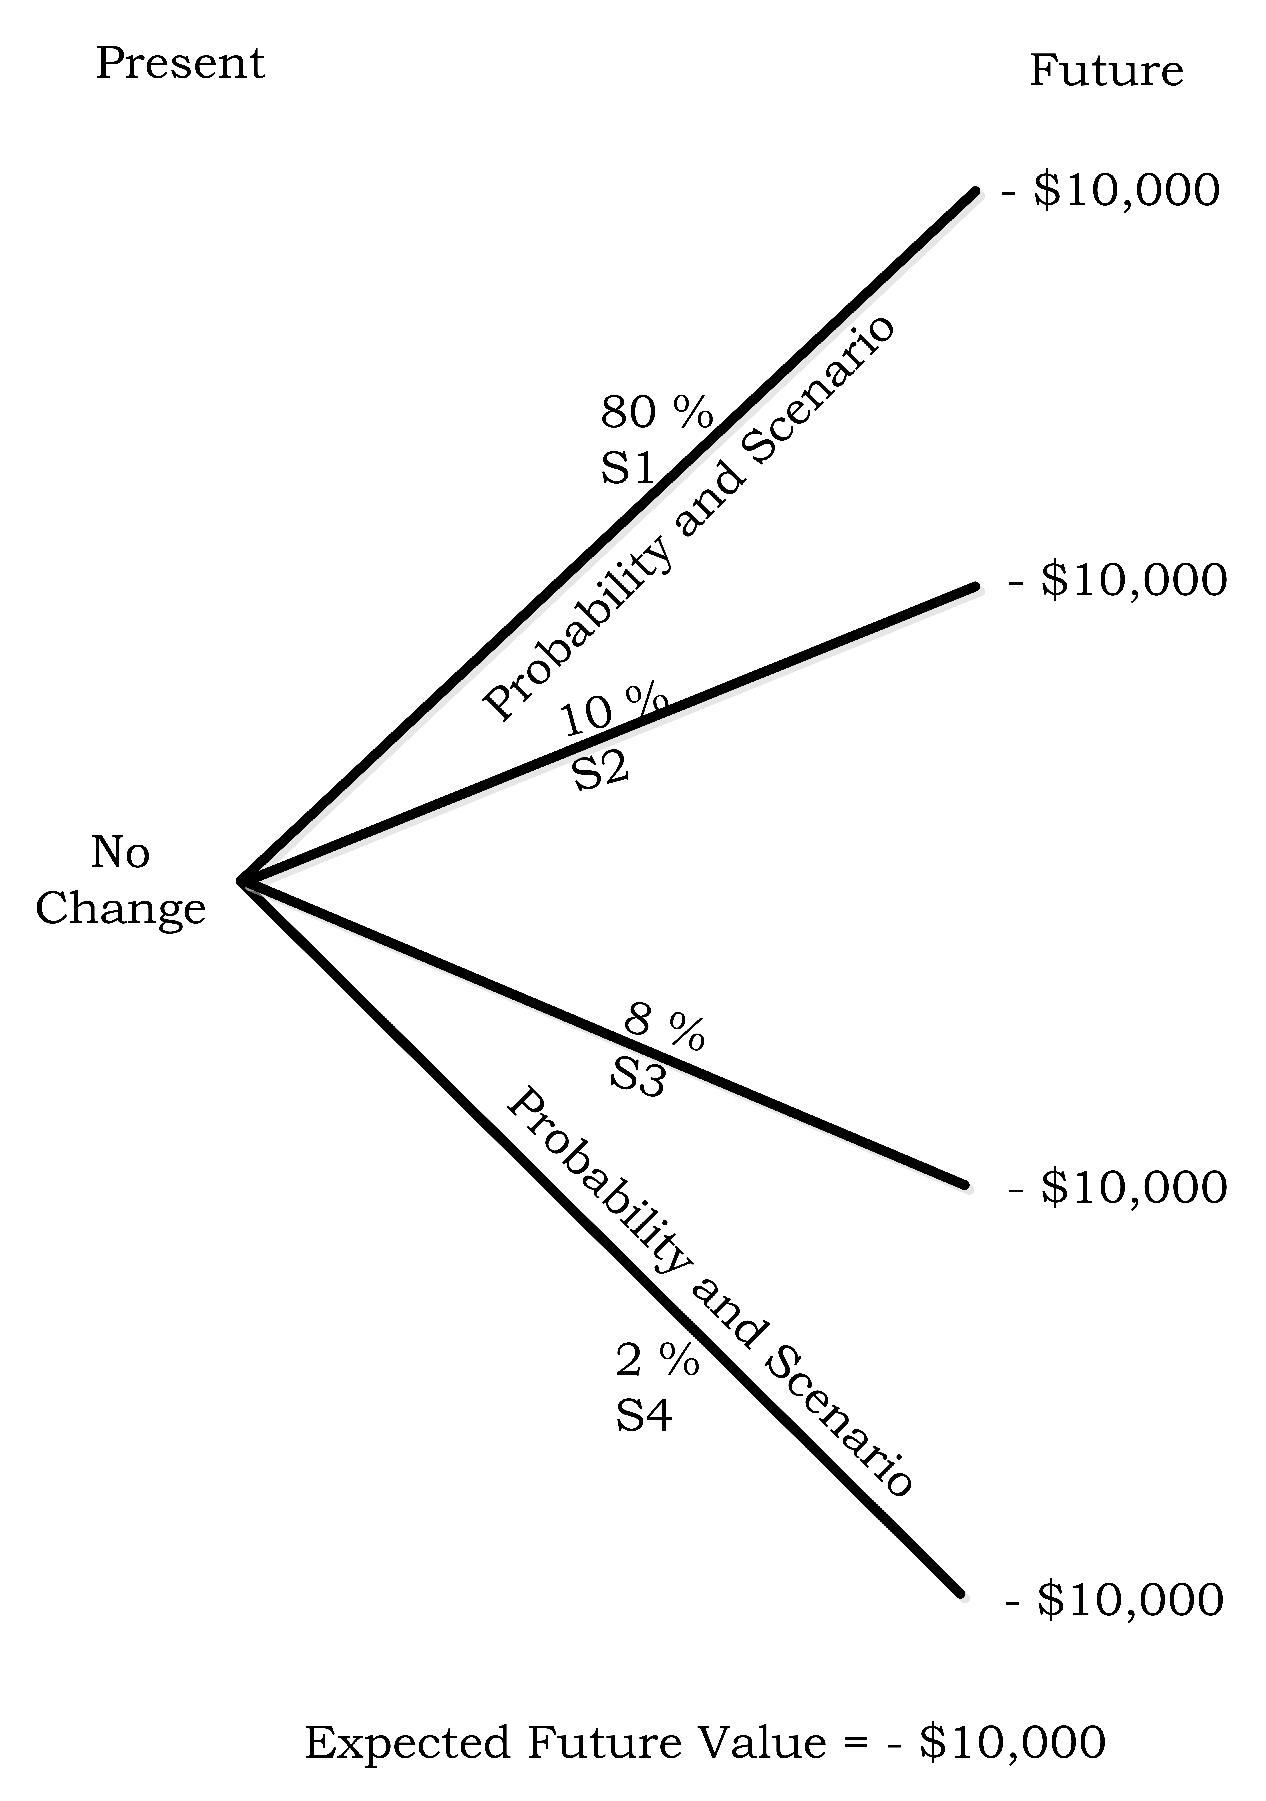
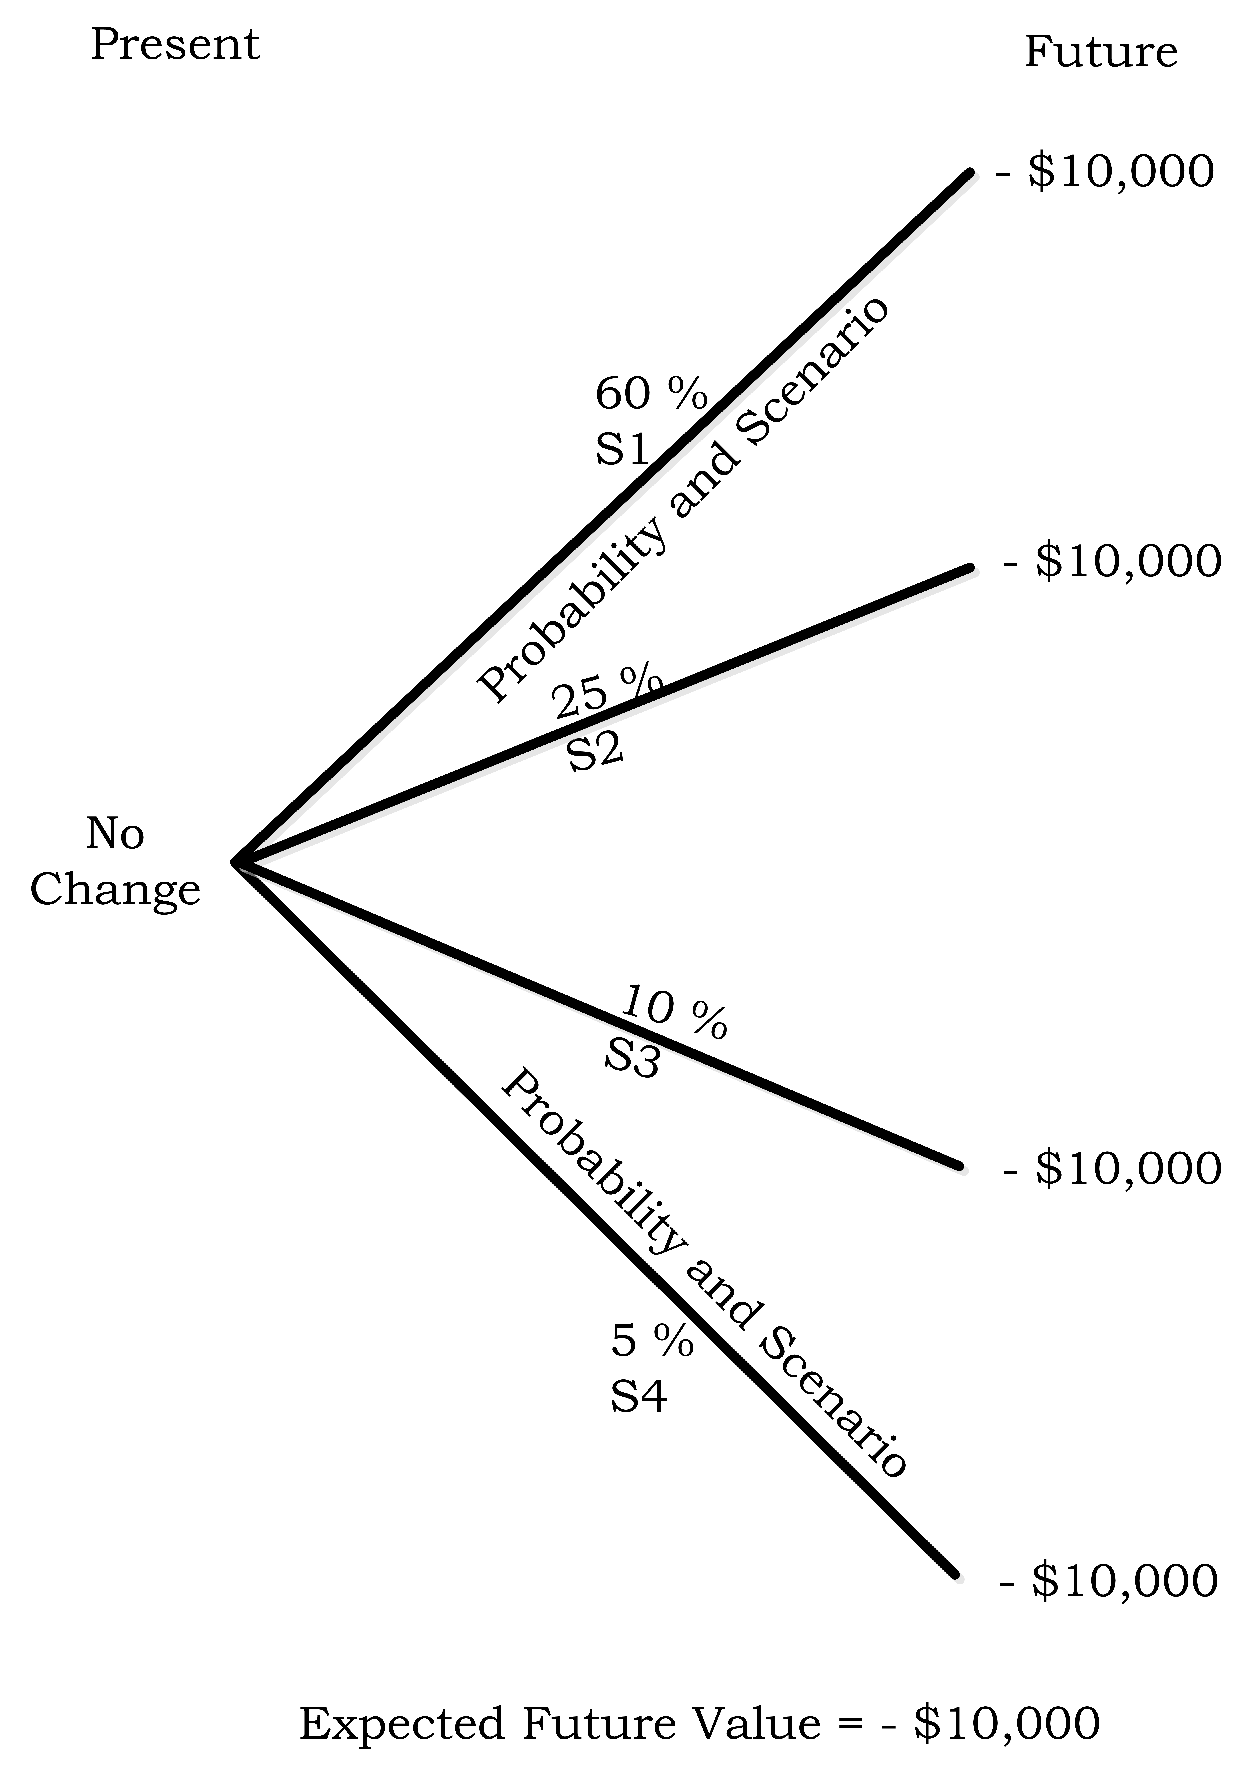
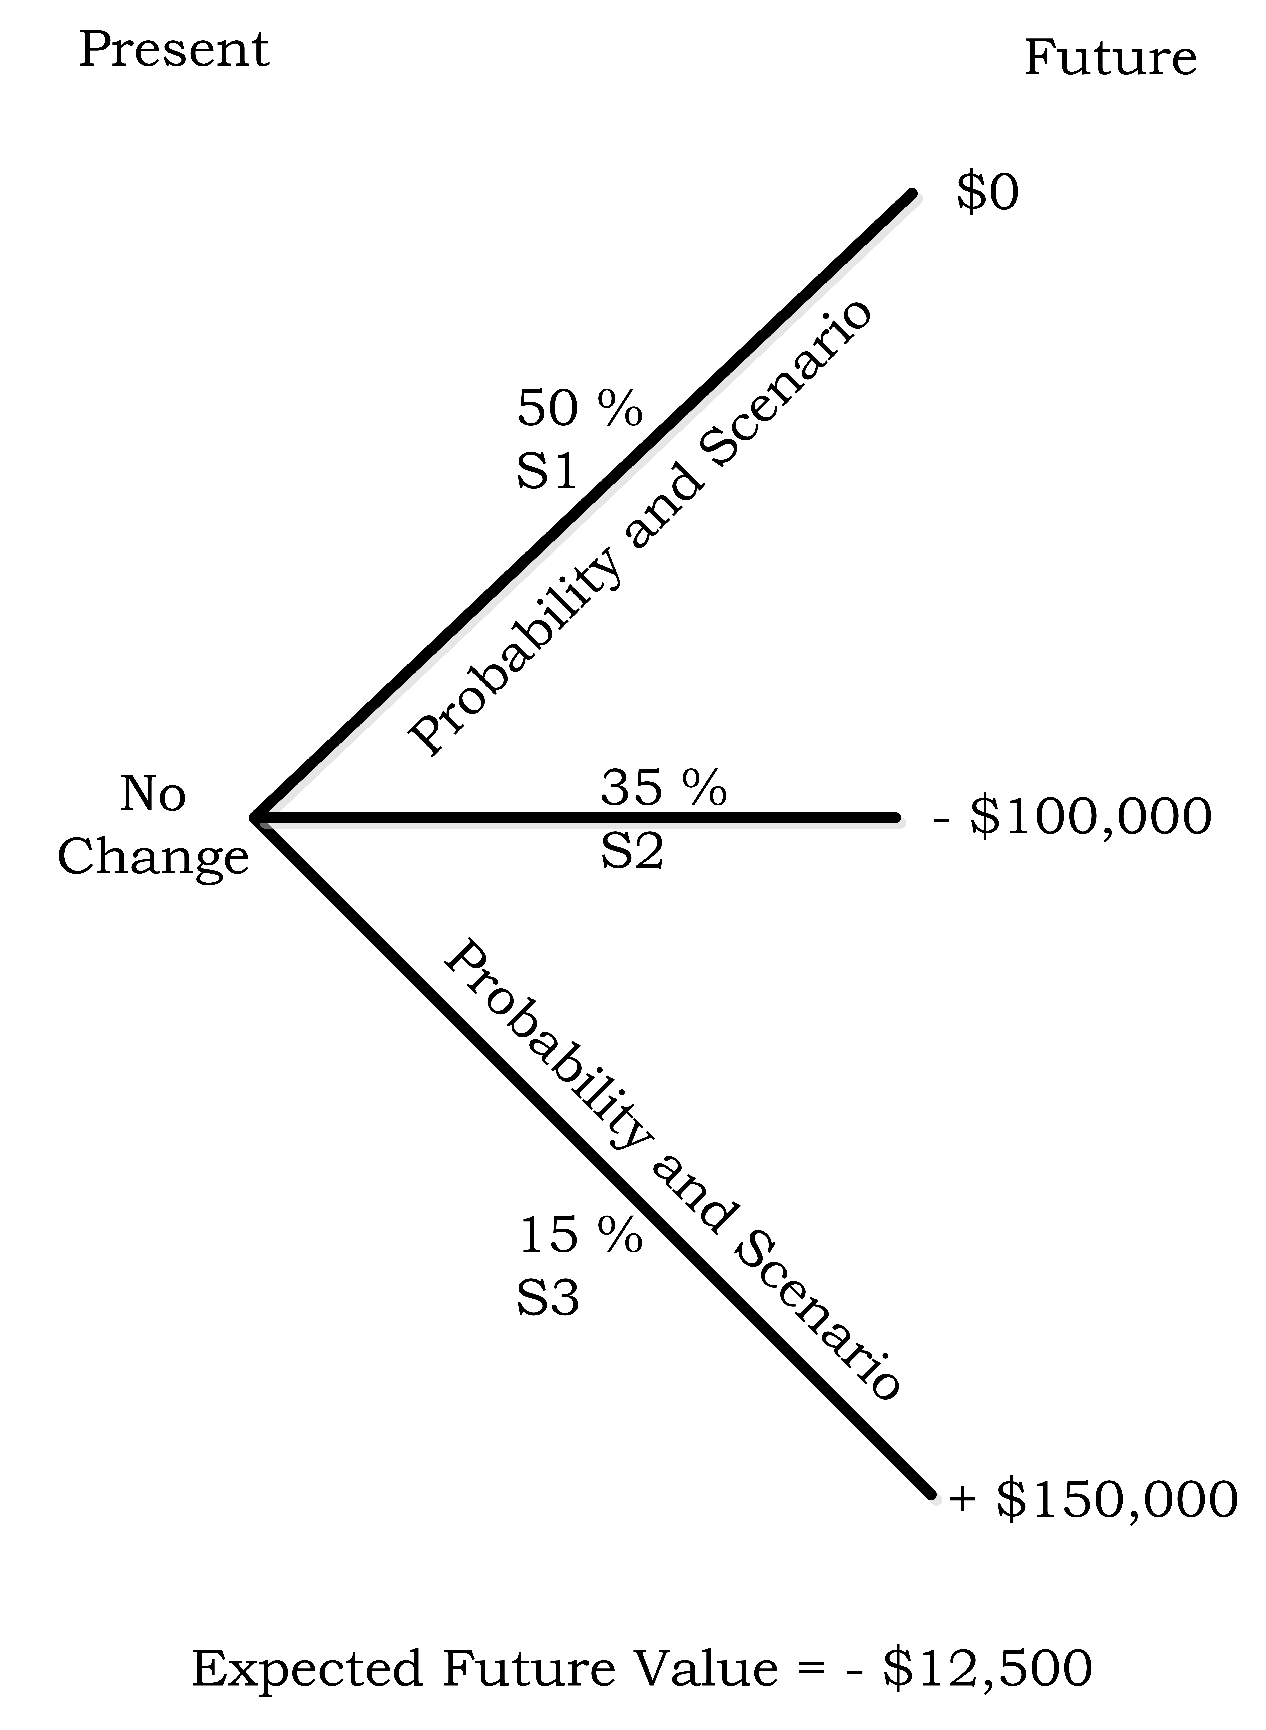
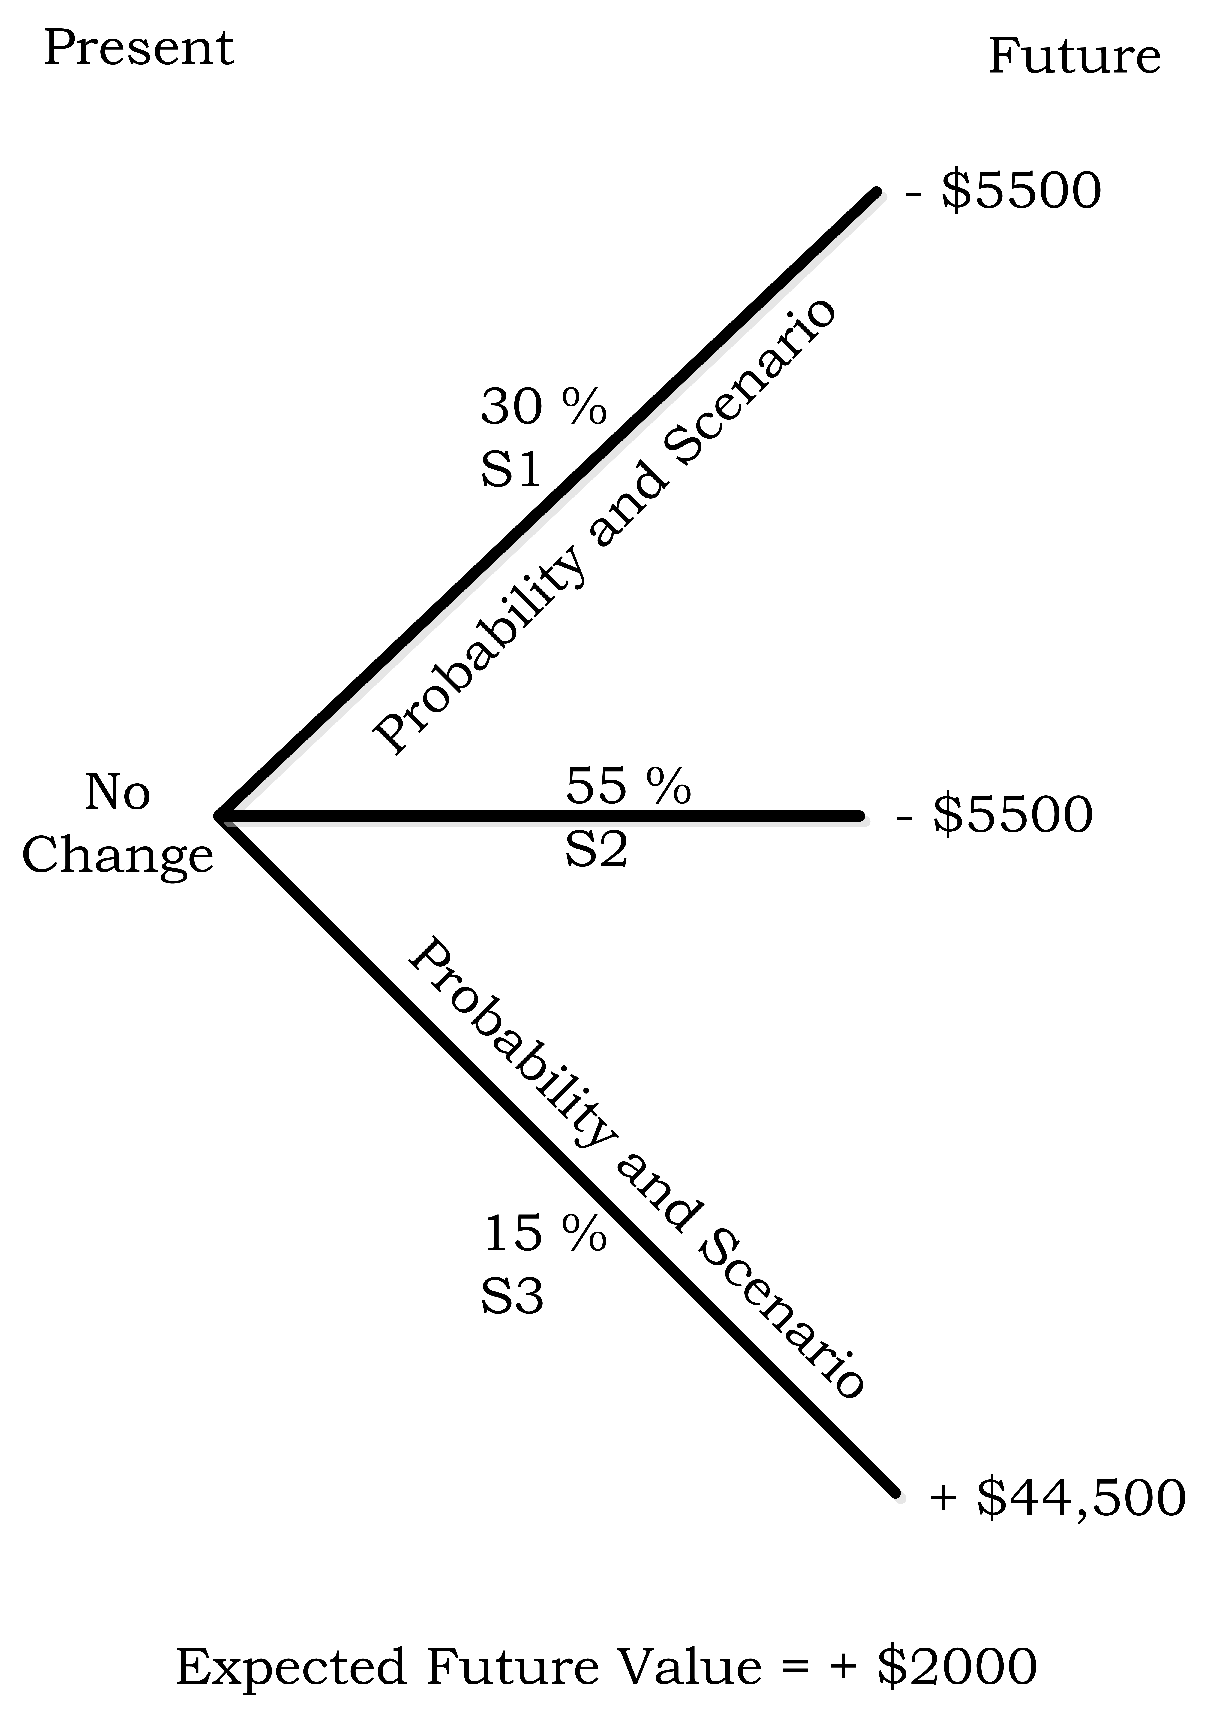
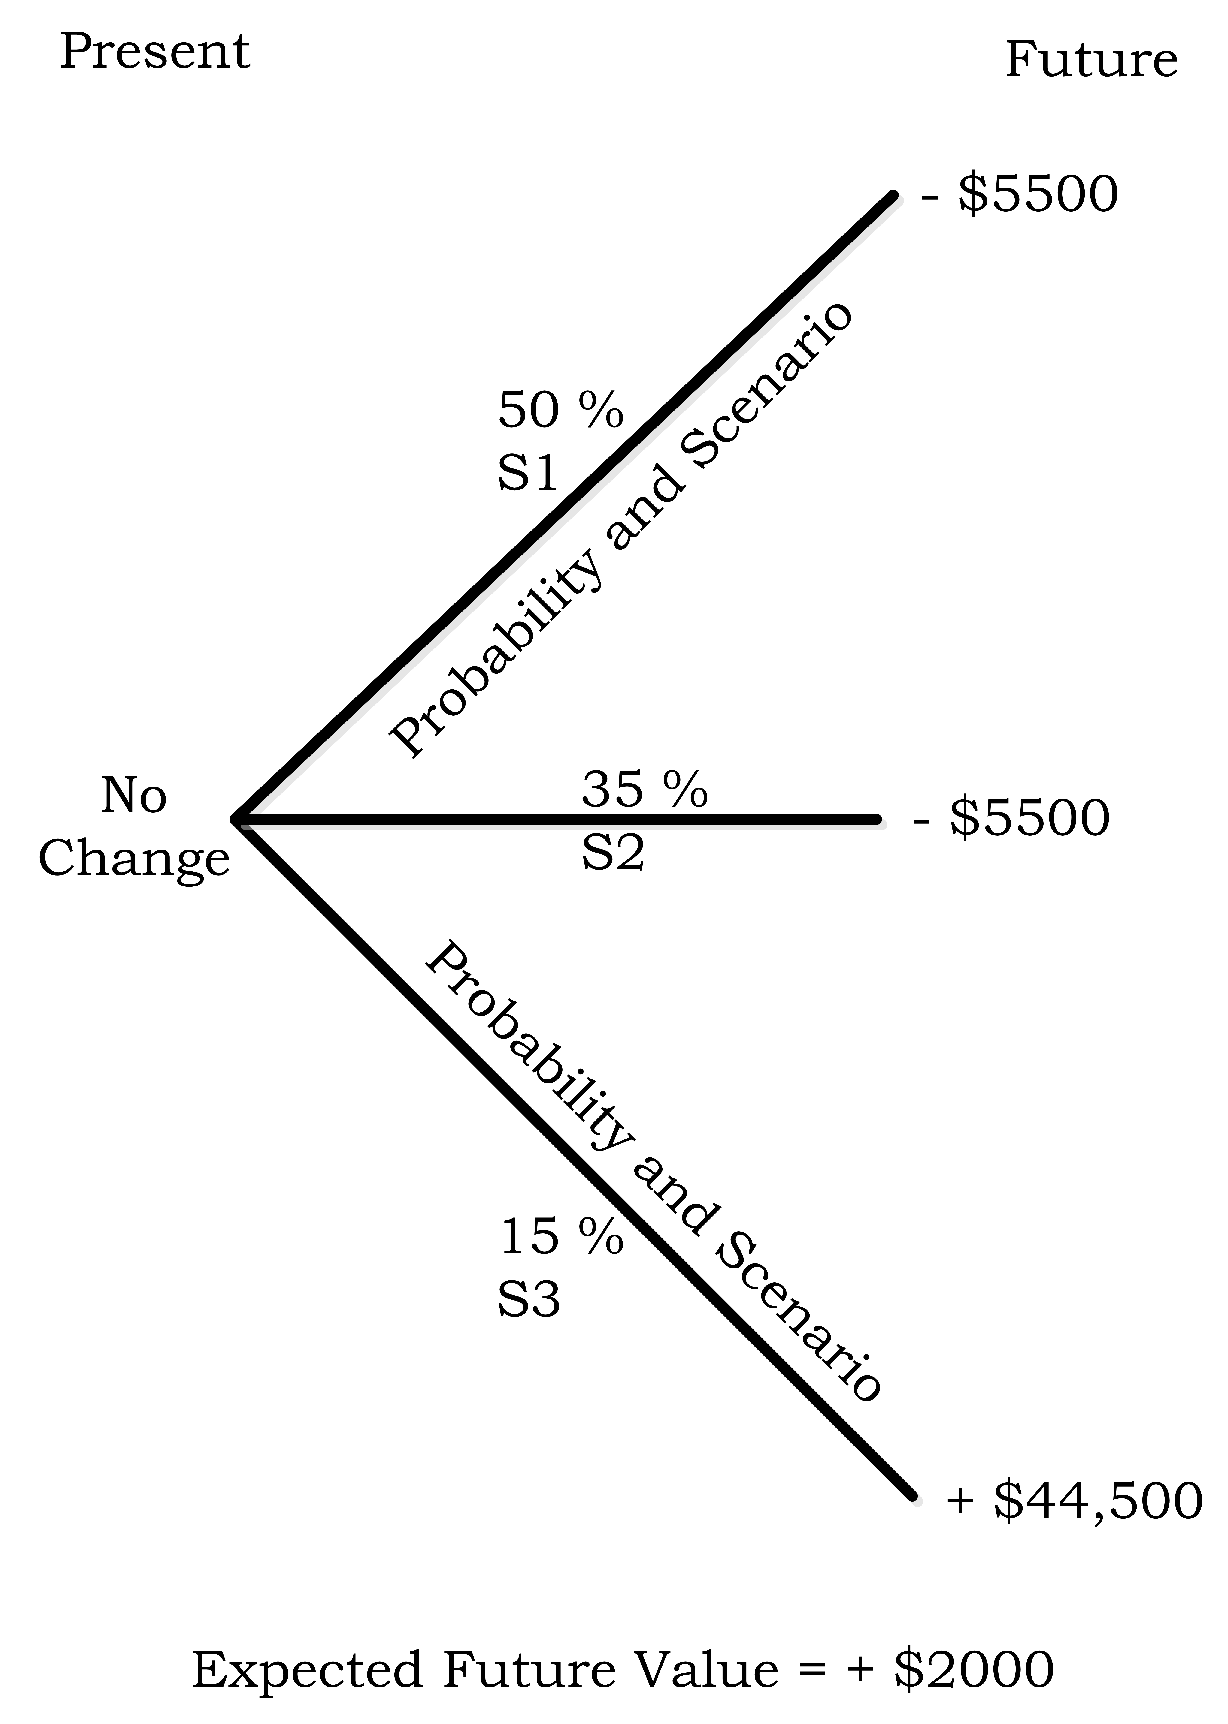
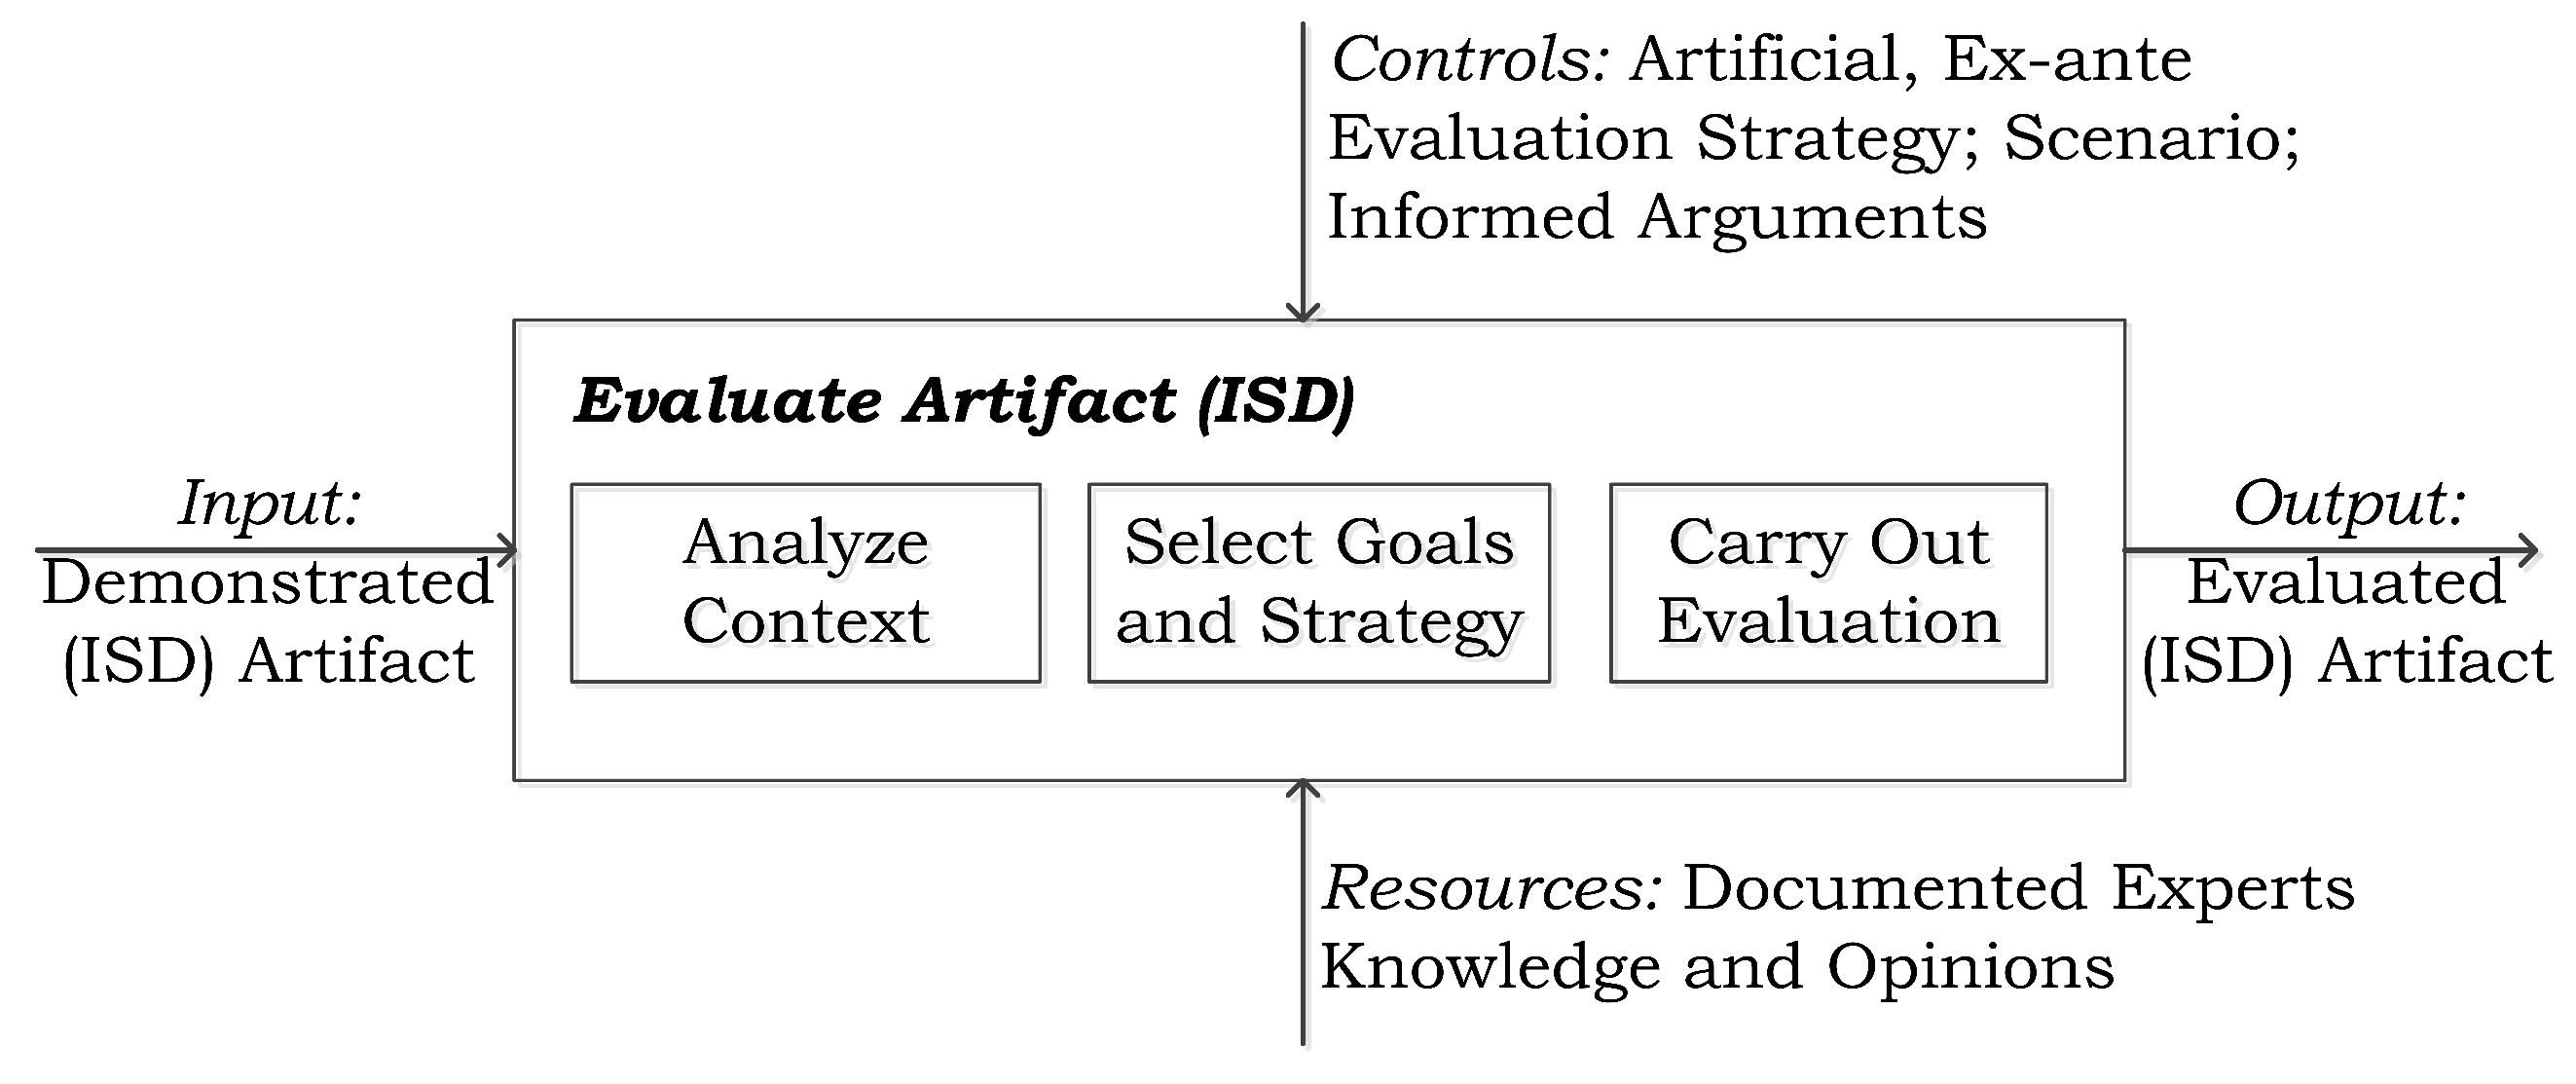
| Outputs | Description | March and Smith [18] | Rossi and Sein [16], Purao [17] |
|---|---|---|---|
| Constructs | The conceptual vocabulary of domain | ✓ | ✓ |
| Models | A set of propositions or statements expressing relationships between constructs | ✓ | ✓ |
| Methods | A set of steps used to perform a task - how to knowledge | ✓ | ✓ |
| Instantiations | The operationalization of constructs, models, and methods | ✓ | ✓ |
| Better Theories | Artifact construction as analogous to experimental natural science, coupled with reflection and abstraction | ✗ | ✓ |
Table 2.
Design Science Research Evaluation Methodologies (adapted from [19]).
| Core Methodology | Sub-Methodologies |
|---|---|
| Observational | Case Study: Study artifact in depth in business environment |
| Field Study: Monitor use of artifact in multiple projects | |
| Analytical | Static Analysis: Examine structure of artifact for static qualities (e.g., complexity) |
| Architecture Analysis: Study fit of artifact into technical IS architecture | |
| Optimization: Demonstrate inherent optimal properties of artifact or provide optimality bounds on artifact behavior | |
| Dynamic Analysis: Study artifact in use for dynamic qualities (e.g., performance) | |
| Experimental | Controlled Experiment: Study artifact in controlled environment for qualities (e.g., usability) |
| Simulation: Execute artifact with artificial data | |
| Testing | Functional (Black Box) Testing: Execute artifact interfaces to discover failures and identify defects |
| Structural (White Box) Testing: Perform coverage testing of some metric (e.g., execution paths) in the artifact implementation | |
| Descriptive | Informed Argument: Use information from the knowledge base (e.g., relevant research) to build a convincing argument for the artifact’s utility |
| Scenarios: Construct detailed scenarios around the artifact to demonstrate its utility |
| Objective | Reduce the Probability of Risk Event | Reduce the Financial Impact of Risk Event |
|---|---|---|
| Strategies | Technical Controls | Technical Controls |
| Security Policy | Cyber-Insurance | |
| Others | Derivatives |
Table 4.
An Assessment of Insurability of Cyber Risks (adapted from [65]).
| Insurability Criteria | Main Findings | Assessment |
|---|---|---|
| Randomness of Loss Occurrence | - Correlation among risks hinders efficient pooling | Problematic |
| - Risk pools are too small and cannot be diversified; also, lack of adequate reinsurance | ||
| - Lack of data | ||
| - Changing nature of cyber risks (e.g., new standards, regulations) | ||
| Maximum Possible Loss | - Maximum possible loss for cyber risk lower than for other operational risks | Not Problematic |
| - Insurers protect against extreme loses by cover limits | ||
| Average Loss Per Event | - Average loss for cyber risk lower than for other operational risks | Not Problematic |
| - Dependent on company size, self-protection, and institutional commitment for information security | ||
| Loss Exposure | - Increasing number of cyber risk events | Not Problematic |
| - Dependent on event catgory (i.e., human actions dominate other event categories) | ||
| Information Asymmetry | - Moral hazard poses a strong theoretical threat; regular risk assessments, deductibles, and caps on coverage help reduce moral hazard | Problematic |
| - Adverse selection poses a strong theoretical threat; upfront risk assessments (screening) and signaling (e.g., ISO certificates) help reduce adverse selection | ||
| Insurance Premium | - High premiums and other costs due to large uncertainties; expected to decline | Increasingly Less Problematic |
| - Large geographic and industry variations in availability of policies | ||
| - Low number of competitors; expected to increase over time | ||
| - Additional costs (e.g., upfront risk assessments) | ||
| Cover Limits | - Policies typically cover a maximum (e.g., US $ 50 Million) | Problematic |
| - Policies contain exclusions (e.g., self-inflicted loss, accessing unsecure websites, terrorism) | ||
| - Indirect costs (e.g., reputational effects) cannot be measured and often not covered | ||
| - Product complexity can be problematic (lots of exclusions, dynamic risk nature, both for the insurance seller and buyer uncertainty regarding the actual coverage) | ||
| Public Policy | - Increase in overall industry exposure through cyber insurance is conceivable due to moral hazard incentives and high loss correlations in interrelated networks | Less Problematic |
| - Insurance fraud might be incentivized, since hacking attacks or physical attacks are difficult to detect and to trace back | ||
| Legal Restrictions | - In many countries it is not allowed to insure regulatory fines | Less Problematic |
| - Risk of change (e.g., new legal standards and regulations) | ||
| - Complexity and dynamic nature of this novel risk type might pose a potential legal threat for insurance brokers that limits their willingness to offer the product; only few specialists willing and able to sell cyber insurance | ||
| - Disclosure of sensitive information |
Table 5.
Mapping of Cyber-Insurance Problems and Requirements for Information Security Derivatives (ISD).
| Cyber-Insurance Problems | Functional Requirements for ISD |
|---|---|
| Inefficient and Ineffective | Efficient and Effective Risk Hedging |
| Information Asymmetry | Increased Information Elicitation and Aggregation |
| Strong Manipulation Resistance | |
| Incomplete Markets | Increase in Products (Variety) |
| Scalability | |
| Rapid Implementation | |
| Lack of Liquidity | Increased Liquidity |
| High Transaction Cost | Reduced Transaction Cost |
| Increased Price Transparency | |
| Regulatory Capital Requirements | Low Cost of Capital |
| Reduced Risk to Market Operator | |
| High Settlement Cost | Low Settlement and Clearing Cost |
| High Counterparty Credit Risk | Low Counterparty Credit Risk |
| Lack of Data | Increased Data Generation |
Table 6.
Loss Categories from Cyber Attacks and Non-Malicious IT Failure (adapted from [22]).
| Loss Category | Description |
|---|---|
| Intellectual Property (IP) Theft | Loss of value of an IP asset, expressed in terms of loss of revenue as a result of reduced market share. |
| Business Interruption | Lost profits or extra expenses incurred due to the unavailability of IT systems or data as a result of cyber attacks or other non-malicious IT failures. |
| Data and Software Loss | The cost to reconstitute data or software that has been deleted or corrupted. |
| Cyber Extortion | The cost of expert handling for an extortion incident, combined with the amount of the ransom payment. |
| Cyber Crime/Cyber Fraud | The direct financial loss suffered by an organisation arising from the use of computers to commit fraud or theft of money, securities, or other property. |
| Breach of Privacy Event | The cost to investigate and respond to a privacy breach event, including IT forensics and notifying affected data subjects. Third-party liability claims arising from the same incident. Fines from regulators and industry associations. |
| Network Failure Liabilities | Third-party liabilities arising from certain security events occurring within the organisation’s IT network or passing through it in order to attack a third party. |
| Impact on Reputation | Loss of revenue arising from an increase in customer churn or reduced transaction volumes, which can be directly attributed to the publication of a defined security breach event. |
| Physical Asset Damage | First-party loss due to the destruction of physical property resulting from cyber attacks. |
| Death and Bodily Injury | Third-party liability for death and bodily injuries resulting from cyber attacks. |
| Incident Investigation and Response Costs | Direct costs incurred to investigate and “close” the incident and minimise post-incident losses. Applies to all the other categories/events. |
| Trigger Criteria | Examples |
|---|---|
| Index | Such as Company Specific Risk Index, ISE Cyber Security ETF (HACK) [87], |
| UK Cyber Vulnerability Index [88], | |
| Global Cybersecurity Index (GCI) [89], Index of Cyber Security [85] | |
| Results Indicators | Such as Technological Indicators (performance of security controls, etc.), |
| Process and Procedural Indicators (compliance with regulatory requirements, etc.), so on. | |
| Information Security Indicators [90] | |
| Customized Indicators | Such as a combination of performance index and result indicators, |
| Qualitative analysis of security strength, | |
| penetration testing of security defense systems, Forensics, so on. | |
| Information Security Indicators [90] |
| Payout Structure | Payout Structure Definition | ISO | ISVO | ISF | ISS |
|---|---|---|---|---|---|
| Fixed | Payouts are fixed and based on occurrence of pre-specified “state(s)” | ✓ | ✗ | ✗ | ✓ |
| Increasing | Payouts are proportionately linked to occurrence of “state(s)” above the trigger level | ✗ | ✓ | ✓ | ✓ |
| Tiered | Payouts depend on the level of outcomes, i.e., the payout structure is tiered (increase or decrease) | ✗ | ✓ | ✓ | ✓ |
| Decreasing | Payouts decreases with decrease/falling-short from the trigger level | ✗ | ✓ | ✓ | ✓ |
| Fixed Specifications | Variable Specifications |
|---|---|
| Issuer | |
| Information Security Derivative Type | |
| Contract ID | |
| Underlying Event or Condition | |
| Trading Start Date and Time | YYYY-MM-DD |
| HH-MM-SS | |
| Trading End Date and Time | YYYY-MM-DD |
| HH-MM-SS | |
| Minimum Investment Required | Amount : |
| Currency : | |
| Maximum Investment Permitted | Amount : |
| Currency : | |
| Contract Trading Unit (Lot Size) | |
| Transaction Fee | |
| Payout Trigger Criteria | |
| Decision Criteria | |
| Payout (Return) Structure | |
| Pay-Off Horizon | |
| Settlement Date | |
| Independent Third Party Verification Required | Yes/No |
| Eligible Investors/Traders | |
| Know Your Trader/Investor Required | Yes/No |
| Transferable Instrument | Yes/No |
| Other Relevant Information |
| Fixed Specifications | Variable Specifications |
|---|---|
| Issuer | Information Security Prediction Market |
| Information Security Derivative Type | Information Security Option |
| Contract ID | ISO 123 |
| Underlying Event or Condition | The unit-1 of the company “O” suffers a (pre-defined type of) cyber-attack and the production at the unit is adversely affected for one or more days on or before 31 December 2015. |
| Trading Start Date and Time | 1 October 2015 00-00-01 CET |
| Trading End Date and Time | 31 December 2015 23-59-59 CET |
| Minimum Investment Required | Amount : 1000 (One Thousand) |
| Currency : USD | |
| Maximum Investment Permitted | Amount : 500,000 (Five Hundred Thousand) |
| Currency : USD | |
| Contract Trading Unit (Lot Size) | One (01) |
| Transaction Fee | 0% (Zero for the sake of easy calculation and demonstration) |
| Payout Trigger Criteria | Failure of production system, thus affecting the production by at least 30% at the Unit-1 of company O for three or more hours during the normal work (production hours) would count as a failure for one full day. |
| Decision Criteria | (i) Press release by the company. |
| (ii) Company’s reporting to a regulator, such as stock market regulator. | |
| Payout (Return) Structure | Fixed; $100 per contract if the predefined (cyber-attack) event occurs, $0 otherwise. |
| Pay-Off Horizon | On the day of settlement |
| Settlement Date | If there is no news/report of cyber-attack within the trading period, then the settlement would be on the fourth business day after the last trading day. However, if there is any news/report of the incident within the trading period then the settlement would take place on the fourth business day from the last trading day or from the day of production recovery whichever is earlier. |
| Independent Third Party Verification Required | No |
| Eligible Investors/Traders | Only verified |
| Know Your Trader/Investor Required | Yes |
| Transferable Instrument | Yes, to other verified traders only |
| Other Relevant Information | Nil |
| Participant | Trading Side | Incentive/Motivation |
|---|---|---|
| Oil Company “O” | Buy | To hedge the cyber-risk exposure to the unit-1. |
| Oil Company’s Cyber-Security Product Vendor “V” | Sell | To convince others through the display of strong faith that their system is strong and will meet the pre-specified performance requirements for the oil industry. |
| Competitors of Vendor “V” | Buy | To convince others through the display of strong signal that the system of “V” is not able to meet the desired performance and they can develop or have better products to meet the desired requirements. |
| Investors in Company “O” | Buy/Sell | To hedge their risk or to profit from trading in the contract. The buy or sell decision depends on investor’s individual belief. Investors try to earn profit by predicting the future price movements or the probability of the underlying event based on the any relevant information they may have. |
| Cyber-Insurers and Re-insurers | Buy/Sell | To hedge their risk or to profit from trading in the contract. The buy or sell decision is based on their individual risk portfolio. |
| Speculators | Buy/Sell | This category includes a range of market participants, such as hedge funds, proprietary trading firms, individual traders, and so on. These traders participate (buy or sell) to earn a profit by predicting the future price movements or the probability of the underlying event based on the any relevant information they may have. |
| Security Researchers | Buy/Sell | Security researchers in possession of some relevant information may participate in trading of the contract. Moral and ethical aspects, such as [97], are ignored. |
| Fixed Specifications | Variable Specifications |
|---|---|
| Issuer | Information Security Prediction Market |
| Information Security Derivative Type | Information Security Vanilla Option |
| Contract ID | ISVO 123 |
| Underlying Event or Condition | The company “C” suffers a (pre-defined type of) cyber-attack during the trading period of the contract and its cloud services are unavailable to its clients. |
| Trading Start Date and Time | 1 October 2015 00-00-01 CET |
| Trading End Date and Time | 31 December 2015 23-59-59 CET |
| Minimum Investment Required | Amount : 1000 (One Thousand) |
| Currency : USD | |
| Maximum Investment Permitted | Amount : 500,000 (Five Hundred Thousand) |
| Currency : USD | |
| Contract Trading Unit (Lot Size) | One (01) |
| Transaction Fee | 0% (Zero for the sake of easy calculation and demonstration) |
| Payout Trigger Criteria | Cloud computing services of “C” are unavailable for at least continues 60 min in one day. |
| Decision Criteria | Press release by the company “C” or a regulatory filing by the company “C”, such as to the stocks trading regulator. |
| Payout (Return) Structure | Scaling-Increasing; Payout of $100 per contract for per hour of service unavailability, $0 otherwise. |
| Pay-Off Horizon | On the day of settlement |
| Settlement Date | If there is no news/report of any cyber-attack on the company ‘C’ then the settlement will be on the fourth business day from the last day of trading. However, if there is any news/report of any cyber-attack during the trading period then the settlement will be on the fourth business day after the incident’s report is released or the fourth business day from the last trading date, whichever is earlier. |
| Independent Third Party Verification Required | No |
| Eligible Investors/Traders | Only verified |
| Know Your Trader/Investor Required | Yes |
| Transferable Instrument | Yes, to other verified traders only |
| Other Relevant Information | Nil |
| Participant | Trading Side | Incentive/Motivation |
|---|---|---|
| Company “C” | Buy | To hedge the risk exposure. |
| Cyber-security product vendor’s of “C” | Sell | To convince others through the display of strong faith that their products are of high quality and can strongly defend against cyber-attacks. |
| Competitors of security product vendors of “C” | Buy | To convince others through the display of strong signal that the products of cloud service provider’s are not strong enough and can not defend against the advance cyber-attacks. |
| Investors in “C” | Buy/Sell | To hedge their risk or to profit from trading in the contract. The buy or sell decision depends on investor’s individual belief. |
| Cyber-Insurer and Cyber-Reinsurer | Buy/Sell | To hedge their risk or to profit from trading in the contract. The buy or sell decision is based on the company’s risk portfolio. |
| Speculators | Buy/Sell | This category includes a range of market participants, such as speculators, hedge funds, proprietary trading firms, individual traders, and so on. These traders participate (buy or sell) to earn a profit from the relevant information they may have. |
| Security Researchers | Buy/Sell | Security researchers in possession of some relevant information may participate in the trading of the contract. |
| Fixed Specifications | Variable Specifications |
|---|---|
| Issuer | Information Security Prediction Market |
| Information Security Derivative Type | Information Security Swap |
| Contract ID | ISS 123 |
| Underlying Event or Condition | The satellite services providing company “S” suffers a (pre-specified type of) cyber-attack during the trading period of the contract and its services are completely unavailable to its clients for continuous six hours at least. |
| Trading Start Date and Time | 1 January 2016 00-00-01 CET |
| Trading End Date and Time | 31 December 2016 23-59-59 CET |
| Minimum Investment Required | Amount : 1000 (One Thousand) |
| Currency : USD | |
| Maximum Investment Permitted | Amount : 50,000 (Fifty Thousand) |
| Currency : USD | |
| Contract Trading Unit (Lot Size) | One (01) |
| Transaction Fee | 0% to the exchange(Zero for the sake of easy calculation and demonstration), Premium of 2% to the counterparty. |
| Payout Trigger Criteria | For the calculation of payout, the disruption of services for a continuous period of six or more hours during the contract trading period. |
| Decision Criteria | At least one of the following: |
| (i) Press release by the company “S”. | |
| (ii) A filing by the company “C” to a regulator, such as stocks trading regulator. | |
| (iii) A third party verification report. | |
| Payout (Return) Structure | Maximum payout of $500,000 or the actual impact, whichever is lower. |
| Pay-Off Horizon | On the day of settlement |
| Settlement Date | If there is no news/report of any cyber-attack on the company “S” then the contract will automatically settle on the first business day from the last trading day) from the last date of the contract period. If any of the states S2, S3, or S4 occur during the trading period then the settlement would occur on the fourth business day from the date of incident reporting. |
| Independent Third Party Verification Required | Yes, if the counterparties want to verify the incident. |
| Eligible Investors/Traders | Only verified |
| Know Your Trader/Investor Required | Yes |
| Transferable Instrument | Yes, to other verified traders only |
| Other Relevant Information | Nil |
| Participant | Trading Side | Incentive/Motivation |
|---|---|---|
| Company “S” | Buy | To hedge the risk exposure. |
| Security Product Vendors of “S” | Sell | To convince others that their products are of high quality and can strongly defend against cyber-attacks. |
| Cyber-Insurer and Cyber-Reinsurers | Sell | To hedge the risk exposure due to new developments in the company/technology/regulatory requirements, etc. To diversify their investment and profit from trading in the contract, if they believe that the company “S” has strong security system. |
| Speculators | Sell | To diversify their investment portfolio. |
| State | Limited Period Interruption | Satellite Hijacking (Permanent Loss) |
|---|---|---|
| S1 | ✗ | ✗ |
| S2 | ✓ | ✗ |
| S3 | ✗ | ✓ |
| S4 | ✓ | ✓ |
| State | Loss Probability | Impact Value |
|---|---|---|
| S1 | 60% | $0 |
| S2 | 25% | −$150,000 |
| S3 | 10% | −$350,000 |
| S4 | 5% | −$500,000 |
| State | Loss Probability | Impact Value |
|---|---|---|
| S1 | 80% | $0 |
| S2 | 10% | −$150,000 |
| S3 | 8% | −$350,000 |
| S4 | 2% | −$500,000 |
| Fixed Specifications | Variable Specifications |
|---|---|
| Issuer | Information Security Prediction Market |
| Derivative Type | Information Security Future |
| Contract ID | ISF 123 |
| Underlying Event or Condition | The contract has a strike fixed at the sale of 10,000 cars. One counterparty, say C1, pays $1000 to the second counterparty, say C2, for every 1000 cars sold above the strike. Similarly, the counterparty, C2 pays $1,000 to C1 for every 1000 cars falling short of the strike. The payout can only be a multiple of 1000, and sales of 500 or more cars will be considered as equivalent of 1000 for the payout calculation. |
| Trading Start Date and Time | 1 October 2015 00-00-01 CET |
| Trading End Date and Time | 31 December 2016 23-59-59 CET |
| Minimum Investment Required | Amount : 100,000 (One Thousand) |
| Currency : USD | |
| Maximum Investment Permitted | Amount : 500,000 (Five Hundred Thousand) |
| Currency : USD | |
| Contract Trading Unit (Lot Size) | One (01) |
| Transaction Fee | 0% (Zero for the sake of easy calculation and demonstration) |
| Payout Trigger Criteria | Strike fixed at car sales figure of 10,000. |
| Decision Criteria | Sales figures as reported by the company in its quarterly and annual reports. |
| Payout (Return) Structure | Scaling |
| Pay-Off Horizon | On the day of settlement |
| Settlement Date | The settlement takes place on the fourth trading day from the date of company filling its report (sales figures)until 31 December 2016. If the company fails to file its sales report by the end of 31 January 2017 then the median estimates of analysts (A1, A2, and A3) tracking the company will be taken into consideration to settle the contract, no later than five trading days from the 31 January 2017. |
| Independent Third Party Verification Required | No |
| Eligible Investors/Traders | Only verified |
| Know Your Trader/Investor Required | Yes |
| Transferable Instrument | Yes, to other verified traders only |
| Other Relevant Information | Nil |
| Participant | Trading Side | Incentive/Motivation |
|---|---|---|
| Car Manufacturer | Buy | To hedge the adverse impact of software vulnerabilities on the company’s reputation and sales. |
| Competitors of Car Manufacturer | Sell | To convince others through the display of strong signal that the electronic system in the cars manufactured by “M” have severe vulnerabilities and security risks. The competitors would trade the contracts to signal that they can develop or have better products which are stronger (less or no vulnerability) than “M’s” system. |
| Investors in Car Manufacturer | Buy/Sell | To hedge their risk or to profit from trading in the contract. The buy or sell decision depends upon investor’s individual belief. |
| Cyber-Security Researchers | Buy/Sell | Security researchers in possession of some relevant information may participate in trading of the contract. However, they may like to participate in trading of the contract which is related to the vulnerability discovery in the said product. Trading in that particular contract would allow them to “responsibly” disclose the vulnerability to the car manufacturer “M”. |
| Cyber-(Re)Insurer | Buy/Sell | To hedge their risk or to profit from trading in the contract. The buy or sell decision depends upon insurer’s risk portfolio. |
| Speculators | Buy/Sell | To diversify their investment portfolio. |
| State | State Description |
|---|---|
| S1 | Number of cars sold by the end of 31 December 2016 is 10,000 |
| S2 | Number of cars sold by the end of 31 December 2016 is 9000 (less than 10,000) |
| S3 | Number of cars sold by the end of 31 December 2016 is 11,000 (more than 10,000) |
| State | Event Probability | Impact Value |
|---|---|---|
| S1 | 50% | $0 |
| S2 | 35% | −$100,000 |
| S3 | 15% | +$150,000 |
| State | Event Probability | Impact Value |
|---|---|---|
| S1 | 30% | $0 |
| S2 | 55% | −$100,000 |
| S3 | 15% | +$150,000 |
© 2016 by the authors; licensee MDPI, Basel, Switzerland. This article is an open access article distributed under the terms and conditions of the Creative Commons Attribution (CC-BY) license (http://creativecommons.org/licenses/by/4.0/).
Share and Cite
MDPI and ACS Style
Pandey, P.; Snekkenes, E. Using Financial Instruments to Transfer the Information Security Risks. Future Internet 2016, 8, 20. https://doi.org/10.3390/fi8020020
AMA Style
Pandey P, Snekkenes E. Using Financial Instruments to Transfer the Information Security Risks. Future Internet. 2016; 8(2):20. https://doi.org/10.3390/fi8020020
Chicago/Turabian StylePandey, Pankaj, and Einar Snekkenes. 2016. "Using Financial Instruments to Transfer the Information Security Risks" Future Internet 8, no. 2: 20. https://doi.org/10.3390/fi8020020
Note that from the first issue of 2016, this journal uses article numbers instead of page numbers. See further details here.