1. Introduction
Tuberculosis (TB) continues to be a global and grave public health concern. It is a health issue for millions and the cause of numerous deaths each year worldwide [
1]. Despite the availability of effective treatments and strategies to improve access to treatment regimens, multidrug-resistant and extremely drug-resistant TB cases are emerging due to the lack of adherence to treatment protocols. This non-adherence is mainly because of the longer treatment course (6 to 8 months) and unpleasant side effects of the drug treatment [
2].
Pakistan is a TB high-burden country, experiencing the emergence of a large number of new TB cases (approximately 420,000 every year) and prevalence of multidrug-resistant TB. Pakistan ranks fifth for drug-susceptible TB and fourth for multidrug-resistant TB [
3]. The burden of disease caused by TB and the effectiveness of different programmatic interventions are better understood through an interpretation of the available epidemiological data [
4]. The program management function, Monitoring and Evaluation (M&E), makes the best use of the available resources (including data) to guide and support programmatic decision-making. The M&E system plans and conducts data collection and analysis to inform program managers and keep performance measures on track [
5]. Unfortunately, this immense resource is either underutilized or not used at all [
4].
Health information systems used in disease-specific health programs are designed to collect patient-centric data to generate actionable information to guide decision-making. Likewise, TB control programs mostly maintain and manage paper-based patient recording and reporting systems [
6].
Fidelity to treatment protocols is ensured through case management (DOTS strategy) and follow-up evaluations (sputum specimen for microscopic examination or culture at specific points in the treatment period) [
7]. Generally, in the TB control programs, paper-based patient records are used to prepare periodic reports on the patient enrolment, retention and treatment progress. These data summaries are also sent to different management levels for aggregation, analysis and reporting [
6]. However, paper-based recording and reporting systems suffer from some inherent challenges, which include: checking data quality, data entry and aggregation, allotting treatment outcome correctly, filling gaps in data, analysing data and generating actionable information. These data management activities are inefficient, work-intensive and time consuming [
8]. However, the advent of digital technology has positively impacted the organizational workflow [
9].
Electronic Health Information Systems (eHIS) have generated better results on the three fronts of TB control programs: patient care, resource management and disease surveillance [
8]. Increasingly, mobile health (mHealth) interventions are grabbing the attention of the public health professionals because of their ability to improve the public health situation [
10]. mHealth refers to the application of portable hand-held devices and communication capabilities in the health care programs [
11]. During the past decade, mHealth has been continuously evolving within the eHealth domain, where it has shown great potential to overcome many traditional barriers in delivering care and reducing the associated distance, time and cost [
12]. Fortunately, most developing countries have already launched mHealth initiatives to unleash the power and reach of smartphones and consider them an important resource for front line workers [
10].
Early diagnosis and vigilant management are important considerations to successfully control TB. Therefore, in TB control programs, case management involves a multidisciplinary approach for comprehensive and coordinated follow up of the presumptive and confirmed TB case [
13]. This approach includes improved communication between patient and care giving teams, patient education and delivery of support during treatment [
14]. Increasingly, mHealth applications are being used to support health care teams in early diagnosis and monitoring patient progress [
15]. Many of the existing mHealth solutions for TB case management are custom software developed for individual organizations and use cases, they are not freely available for other organizations to try. There are also general purpose mHealth solutions available, such as Medic Mobile or ODK Collect and its cousins. These are direct-to-digital systems that do not involve any paper record keeping or paper archives.
Among the various reported uses of mHealth tools the most reported are: data collection, electronic decision support, provider’s education and training, and communication [
10]. However, the particular use of mHealth for data collection has a greater likelihood of improving public health in low- and middle-income countries [
16]. Noteworthy are those unpredictable implementation challenges and complicated situational factors that affect an introduction of mHealth applications in primary healthcare settings of the developing world [
17,
18].
Since there are a number of freely-available open source mHealth applications aimed at improving data collection, only one tool leveraged the strengths of the existing paper system with the flexibility and efficiency of the digital records. We chose the ODK Scan paper-to-digital application to test improved data collection in the public–private mix model of the TB control program of Pakistan. The ultimate goal of this intervention was to reduce the time and resources spent on TB data collection by improving the data collection and digitization process and reducing reliance on manual data entry. Additionally, ODK Scan was chosen because it allows supervisors and managers to assess the data quality by reviewing the original image snippets. The specific objectives of this pilot study were to: (1) assess data quality aspects at both the app and user levels, (2) assess the quantitative impact of ODK Scan on the data management processes, and (3) collect feedback on application user experiences to ascertain app usability, user interface design and workflow changes.
2. Material and Methods
2.1 Description of Technology
Open Data Kit (ODK) Scan is an Android-based mobile application and a part of the ODK 2.0 suite of tools [
9,
19]. It uses the device’s built-in camera to capture an image of a scan-compatible paper form, which it feeds into a series of image processing algorithms (SURF, fast approximate nearest neighbor, and RANSAC) to establish a point-by-point mapping between the template and the captured image [
20,
21,
22,
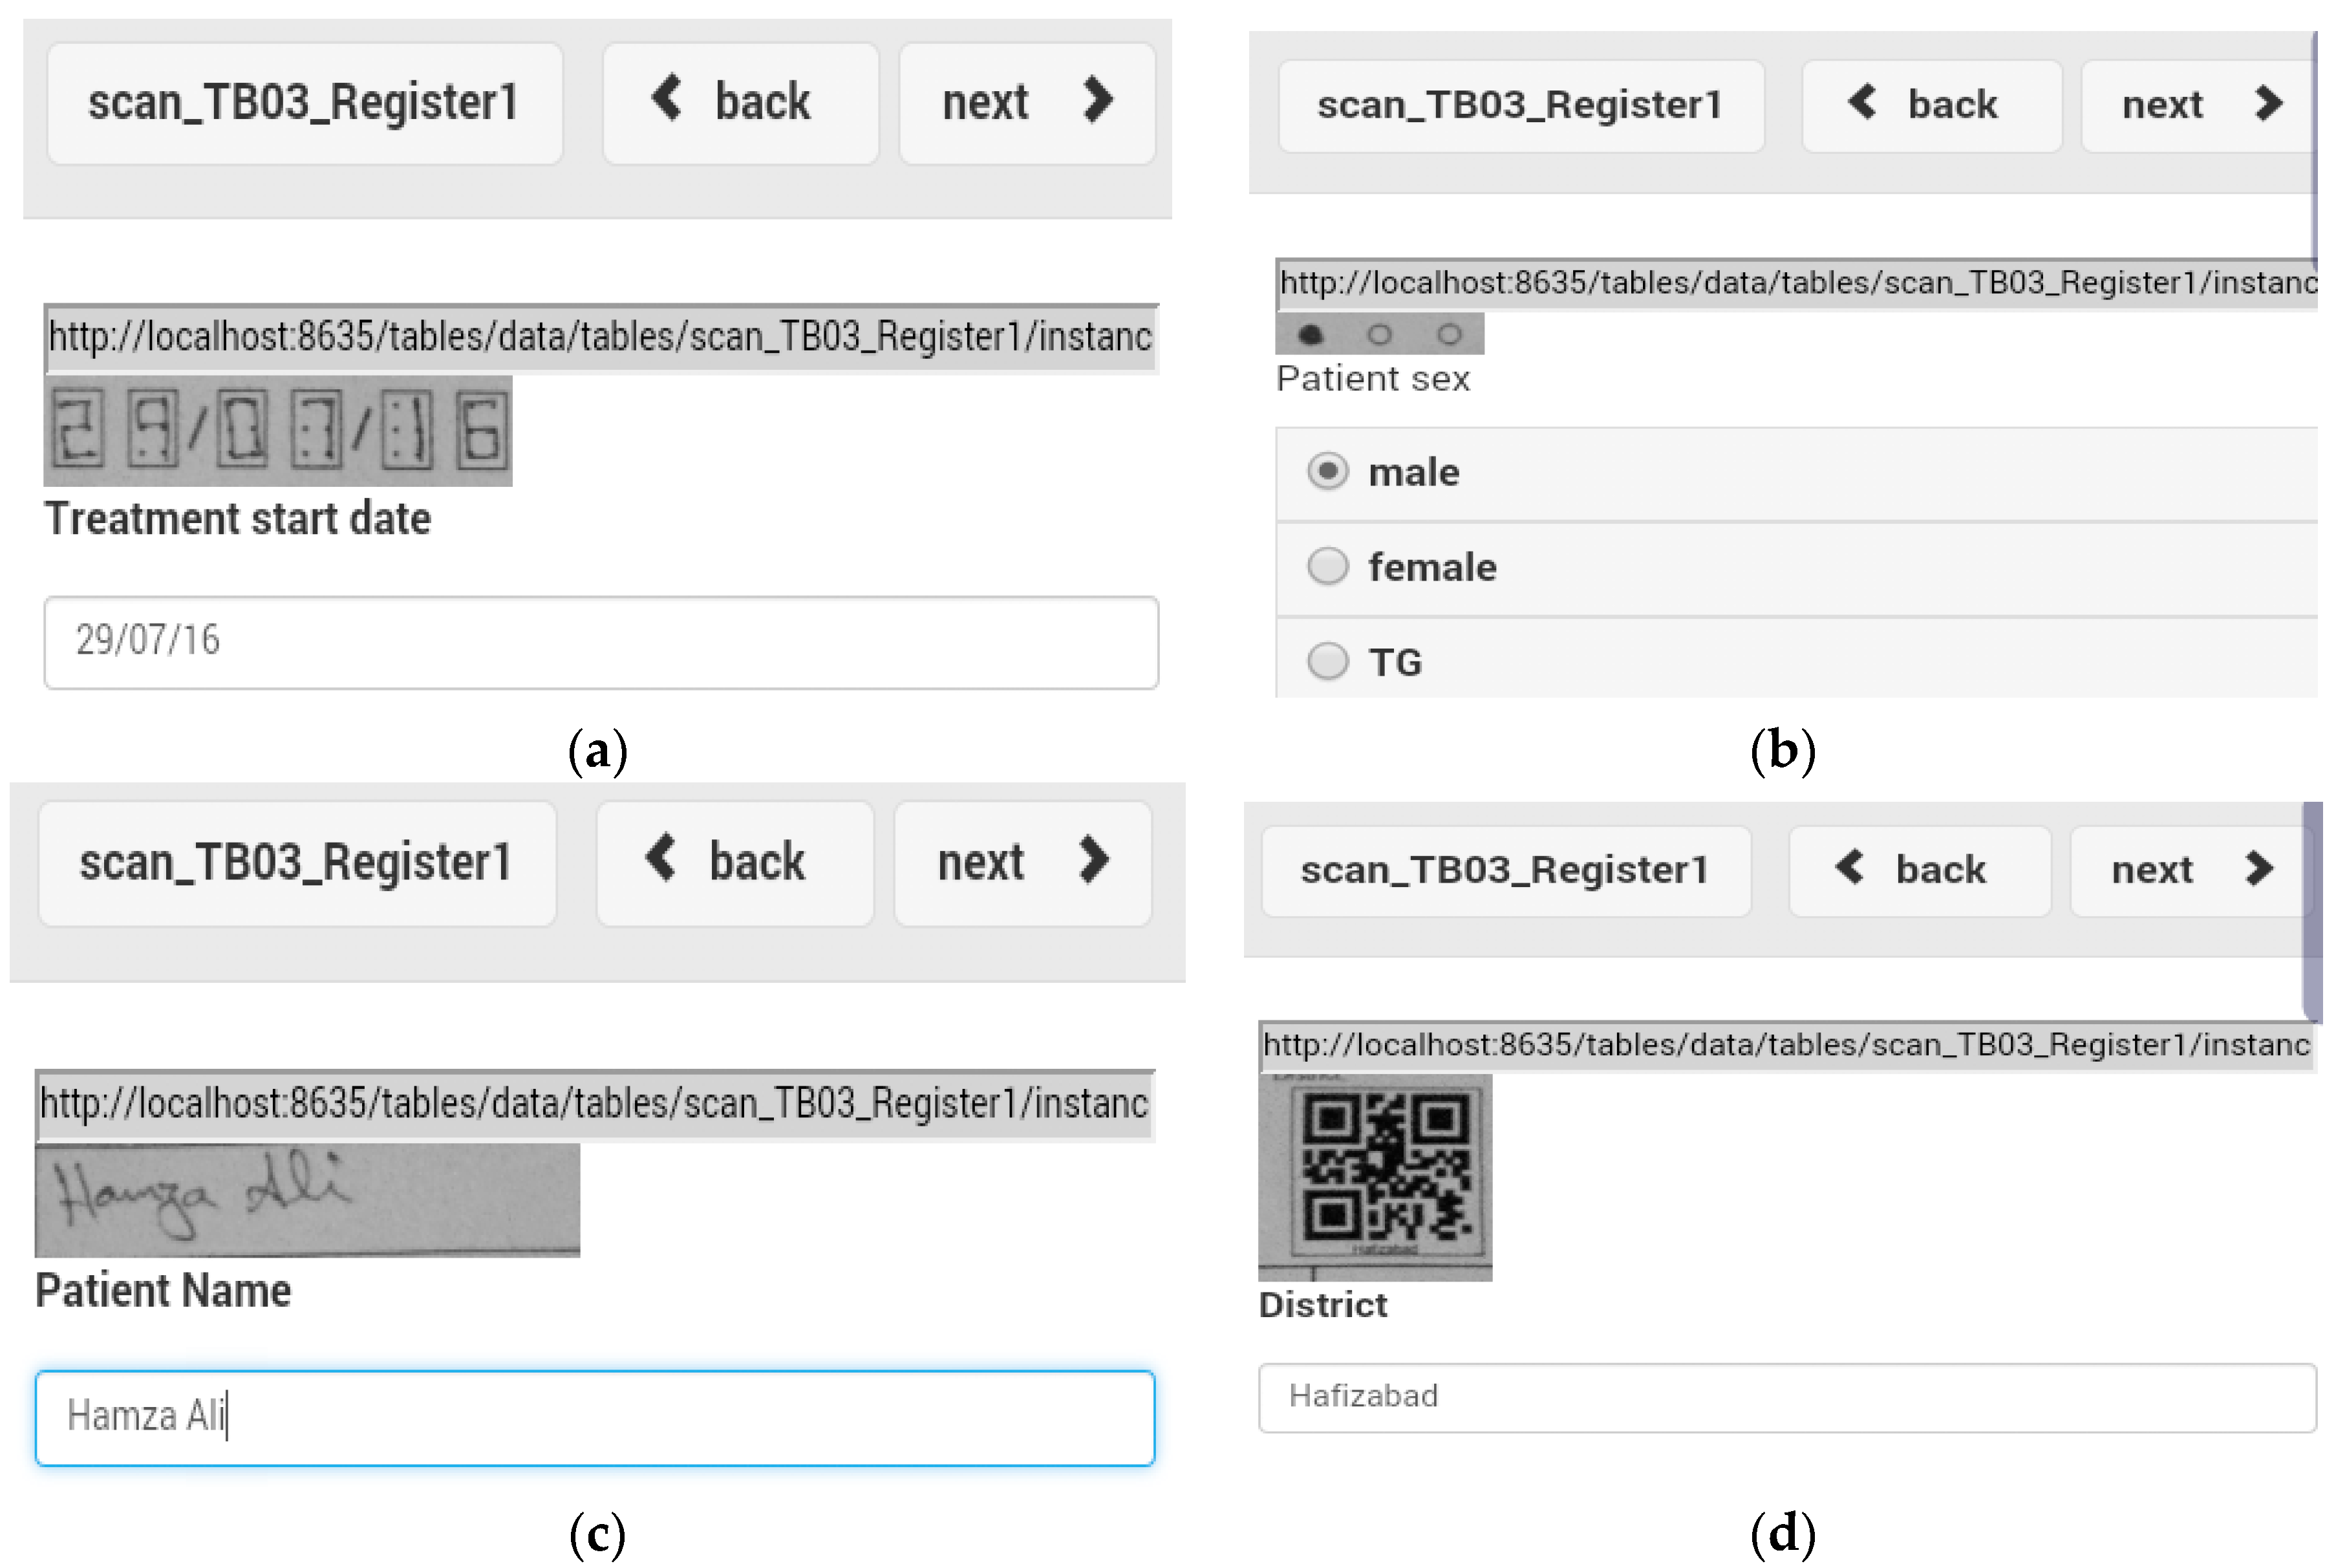
23]. Using this mapping, Scan segments the form into small image snippets that each contains a single data field from the original form [
24]. The image snippets fall into three possible prompt types: hand-filled bubbles, structured number boxes, and QR codes. Hand-filled bubbles are multiple-choice questions that are completed by filling in the bubble that corresponds with the desired response. Scan classifies hand-filled bubbles using a Support Vector Machine (SVM) and principal component analysis (PCA) [
20,
25,
26]. Structured number boxes are a 2 × 3 grid of dots that can be connected by straight lines to draw numerals. Scan classifies numbers using a Multi-layer Perceptron (MLP) with back propagation of error [
27]. Finally, QR codes are two-dimensional barcodes that can be processed as alphanumeric strings. Scan uses the Zebra Crossing (Zxing) library to classify QR Codes [
28]. After Scan has classified each prompt, it inserts the data into an editable record in the ODK 2.0 database. Each digitized field includes a copy of its associated image snippet from the original form, which can be used to verify digitized fields. Once the record is in the ODK 2.0 database, users can use the other tools, such as ODK Survey and ODK Tables to view, edit, verify, aggregate, and sync the data or create customized services, interactions and reports with the data [
19].
ODK Scan does not process freehand written text. Prompts that require written text will include boxes on the paper forms that users can fill with their hand written text, but Scan will leave the corresponding field in the database record blank. Hand written text fields can be manually transcribed on the device by viewing the prompt in ODK Survey, which will display the corresponding image snippet, and typing in the text via the phone’s keyboard. Alternatively, they can be manually transcribed on a PC after the record has been synced, again by viewing the image snippet.
Scan and the rest of the ODK 2.0 tools do not require a consistent Internet connection to function [
19]. All of the image processing is performed by the device itself, and the data is stored in a local database. An Internet connection is only required for syncing records with the cloud, and this can be done at the leisure of the user.
2.2. ODK Scan Workflow
Before ODK Scan is to be used, a scan-compatible form must be designed using the form designer. Paper copies of the form image are printed out and the form’s definition files are copied to the Android-based device. After the form is filled, the user takes a picture using the built-in camera of the smartphone. ODK Scan detects the data fields and auto-digitizes them. The user can then launch ODK Survey to view and verify data fields, and editing if necessary. After a user is sure about the data quality, the patient record is synced with an aggregate server. If no internet connection is available, the user can delay synchronization and continue collecting data until connectivity is restored. At any time, the user can view all synced records on the smartphone and run customized reports to view actionable information. For this trial we created a report that generates information about patients whose follow up appointments are either overdue or due in the coming days. Aside from the syncing step of the ODK Scan workflow, all steps can be undertaken without an internet connection.
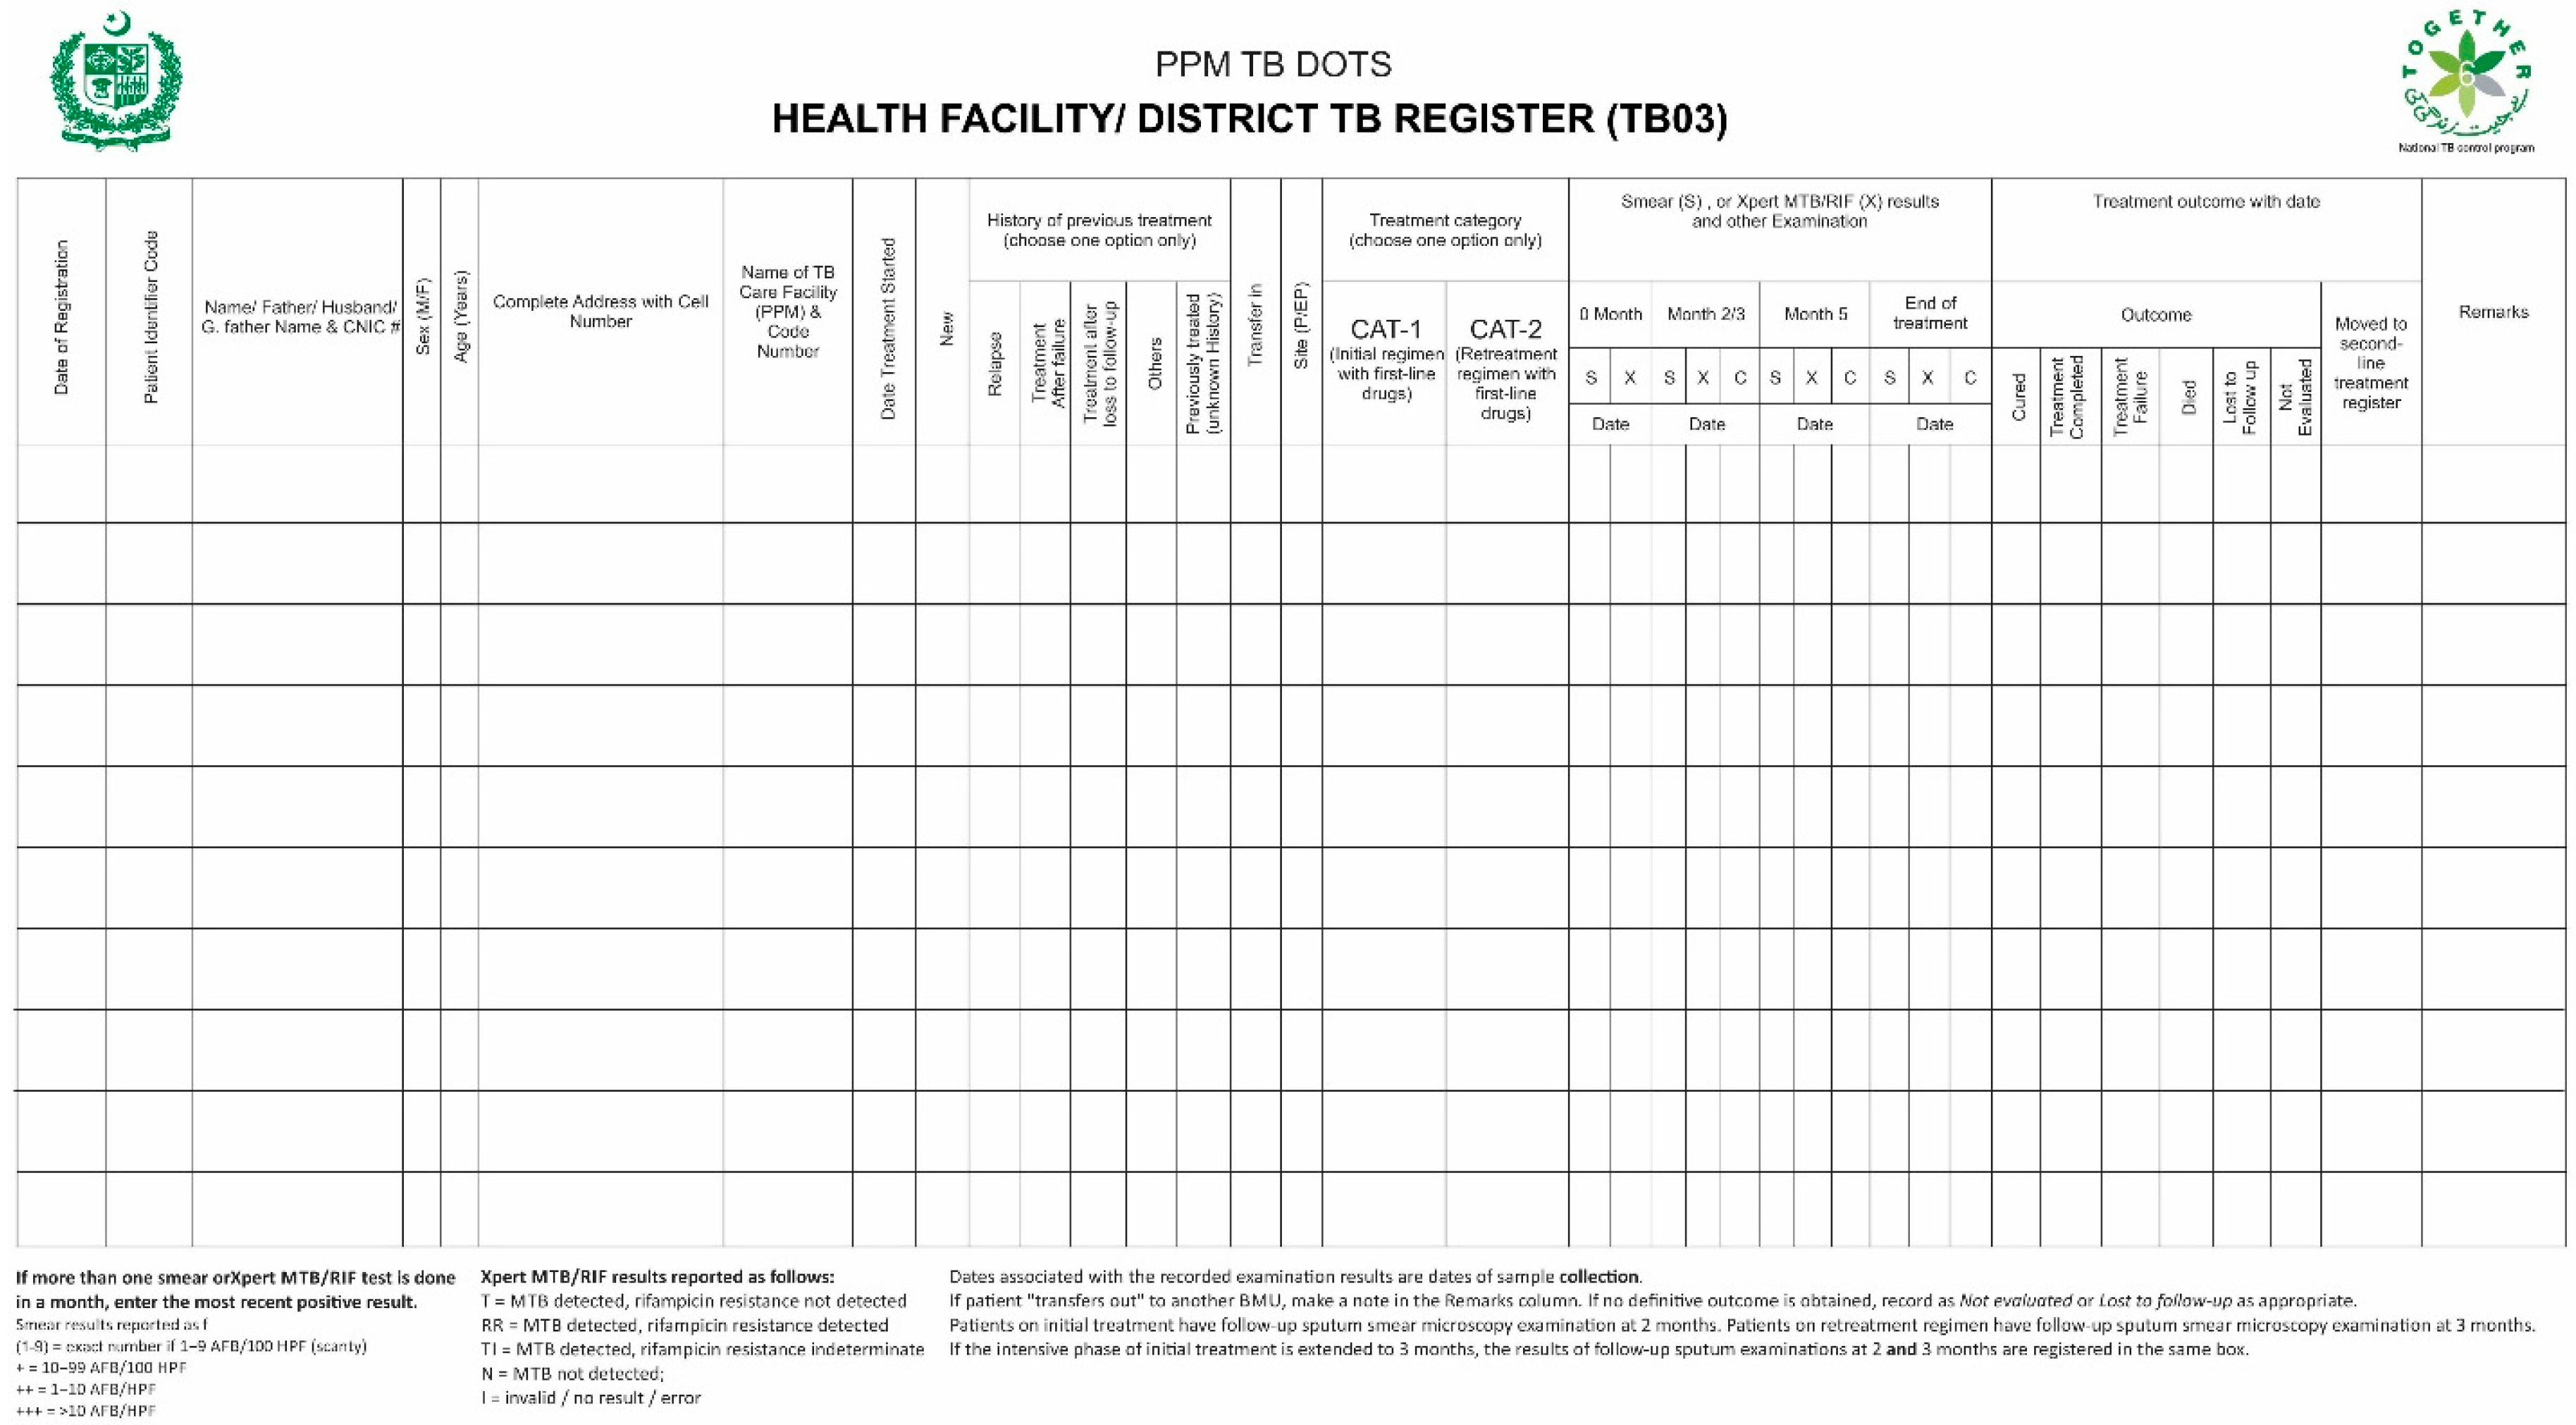
2.3. Intervention
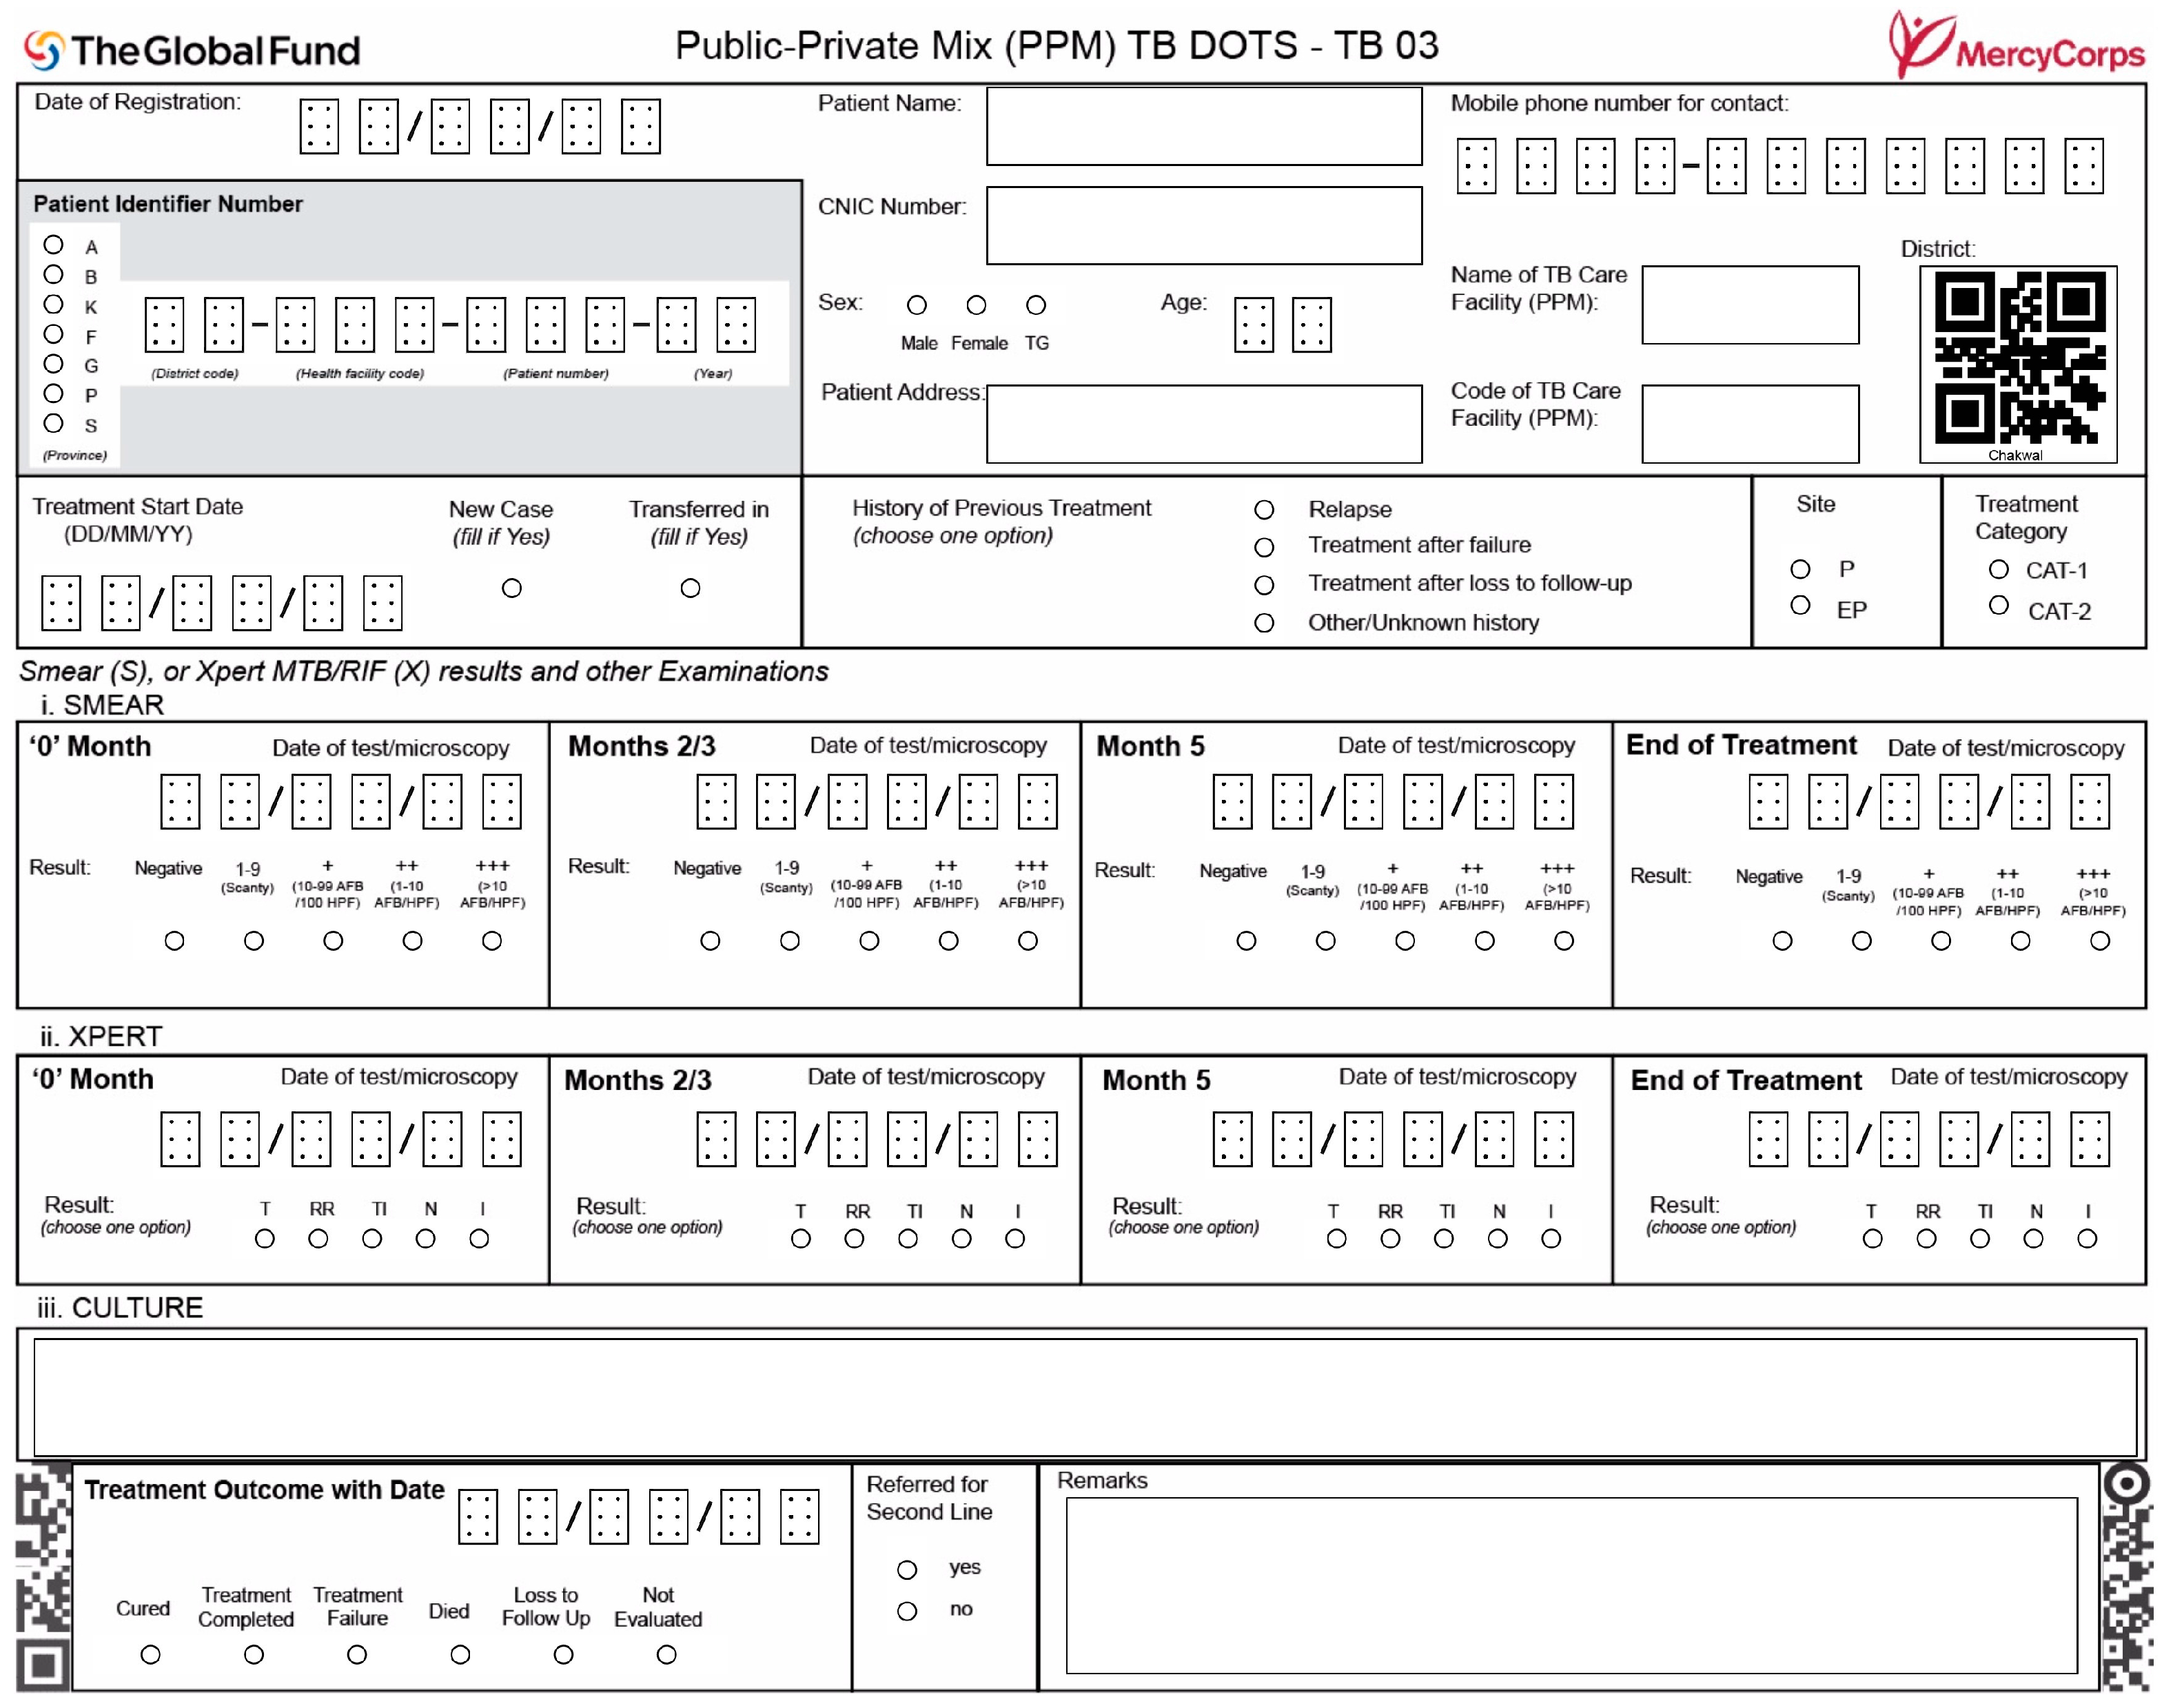
Among nine recording and reporting formats used in the TB control program of Pakistan, one recording format (TB03) was selected (
Figure 1). Its scan-compatible form was designed using the ODK Scan Form Designer to create machine-readable fields for the app to recognize (
Figure 2). The scan-compatible form consists of three types of machine-readable data fields, i.e., structured number boxes, fill-in bubbles and QR codes, and one non-machine readable data field, i.e., hand written text fields (
Figure 3). After the form design was prepared, it was pre-tested, necessary modifications in form design were made, and the forms were printed and bound into a register book. The intervention started at the beginning of May 2016 and lasted for three months in district-level field settings. Informed consent was sought from four of the field workers, belonging to two enrolled districts (Chakwal and Hafizabad) of the TB control program of Pakistan. The field workers (District Field Supervisors) were trained in using the Scan-compatible TB 03 form and the app workflow and were given smartphones (Samsung Galaxy J7 and Huawei Y6) and scan-compatible TB03 registers. Additionally, we provided them 3G-enabled mobile SIMs for internet connectivity and monthly top-up for sharing data via internet. We imposed no restriction on accessing or downloading any other mobile applications. Field workers were allowed to use smartphones, including making calls, text messaging and internet browsing.
2.4. Design
A sequential, explanatory mixed-method research approach was employed to elucidate the technology use for an effective implementation of the ODK Scan paper-to-digital system. However, the mixed method research approach involves combining the quantitative analysis with qualitative reasoning. This research approach includes application of three methods: (1) quantitative assessment of the data quality at both app and user levels; (2) quantitative measurement of the time spent in filling forms, data transfer, aggregation and verification; and (3) qualitative feedback from the field workers (users) to capture their complete experience. However, each of these methods is explored in more detail below.
(1) Quantitative assessment of the data quality was done at both the app and user levels. At the application level, accuracy of ODK Scan’s ability to recognize fill-in bubbles and number boxes was measured by comparing the raw Scan values (the digitized values which Scan’s algorithm produced before human verification) with the data appearing in image snippets of the corresponding data fields. To calculate this, the team hired a Seattle USA-based data analyst to examine each individual number and fill-in bubble image snippet, to record the observed “ground truth” value as observed from the image, and to compare it with the corresponding raw value that ODK Scan processing recorded. Comparison of these field value pairs allowed us to calculate ODK Scan’s accuracy rates for all the number and fill-in bubble fields.
At the user-level, the workflow allowed users to improve the quality of the data through verification and editing data fields manually. User-level data quality was assessed by comparing the same “ground truth” values for each field to the final values that the field worker synced with the server. These accuracy rates were predicted to be higher than the app-level accuracy rate because the field workers had the opportunity to correct errors from the “raw” Scan processing.
Furthermore, we calculated the accuracy rates of the existing (non-ODK Scan) manual entry processes by comparing the field values observed from the hardcopy TB03 register pages to the values manually entered by the data entry worker in the Microsoft Excel datasheets. This would provide us with a baseline for manual entry accuracy rate. Accuracy rates for both user-level digitization processes were calculated based on the full field value, rather than by individual digit or bubble (binary assessment of correct or incorrect for each field).
(2) Quantitative measurements of the time spent in filling forms, data transfer, aggregation and verification were recorded in the routine data management process using direct observation. They were then compared with the endline measures for the same data management processes using the ODK Scan system.
(3) Gathering of qualitative feedback on app use experience was done through surveys and interviews. The survey captured Likert-scale assessment, while face-to-face interviews using a semi-structured questionnaire were carried out with each of the field workers. Their experiences with app usability and workflow modification were explored to assess the effectiveness of the ODK Scan paper-to-digital system from a usability perspective.
3 Findings
3.1. Data Quality
App-level quality measure: During an intervention period of three months, 122 patients’ paper-based records were scanned, digitized and checked for quality. All of these data were synced and available on the cloud-based ODK aggregate server for access and remote analysis. The first task was to assess ODK Scan’s ability to correctly parse the user filled machine-readable data fields, the structured number boxes and the fill-in bubbles. Accuracy rates for these fields were calculated by manually reviewing the 122 records, consisting of 10,600 digits and 8000 fill-in bubbles, and comparing Scan’s raw predicted value against the ground truth value of the image snippet. The recognition accuracy for the fill-in bubbles was found to be much higher than that of the number boxes. Including blank fields (fields that users did not fill in), the Scan app classified 99.2% fill-in bubbles and 79.4% digits correctly (
Table 1).
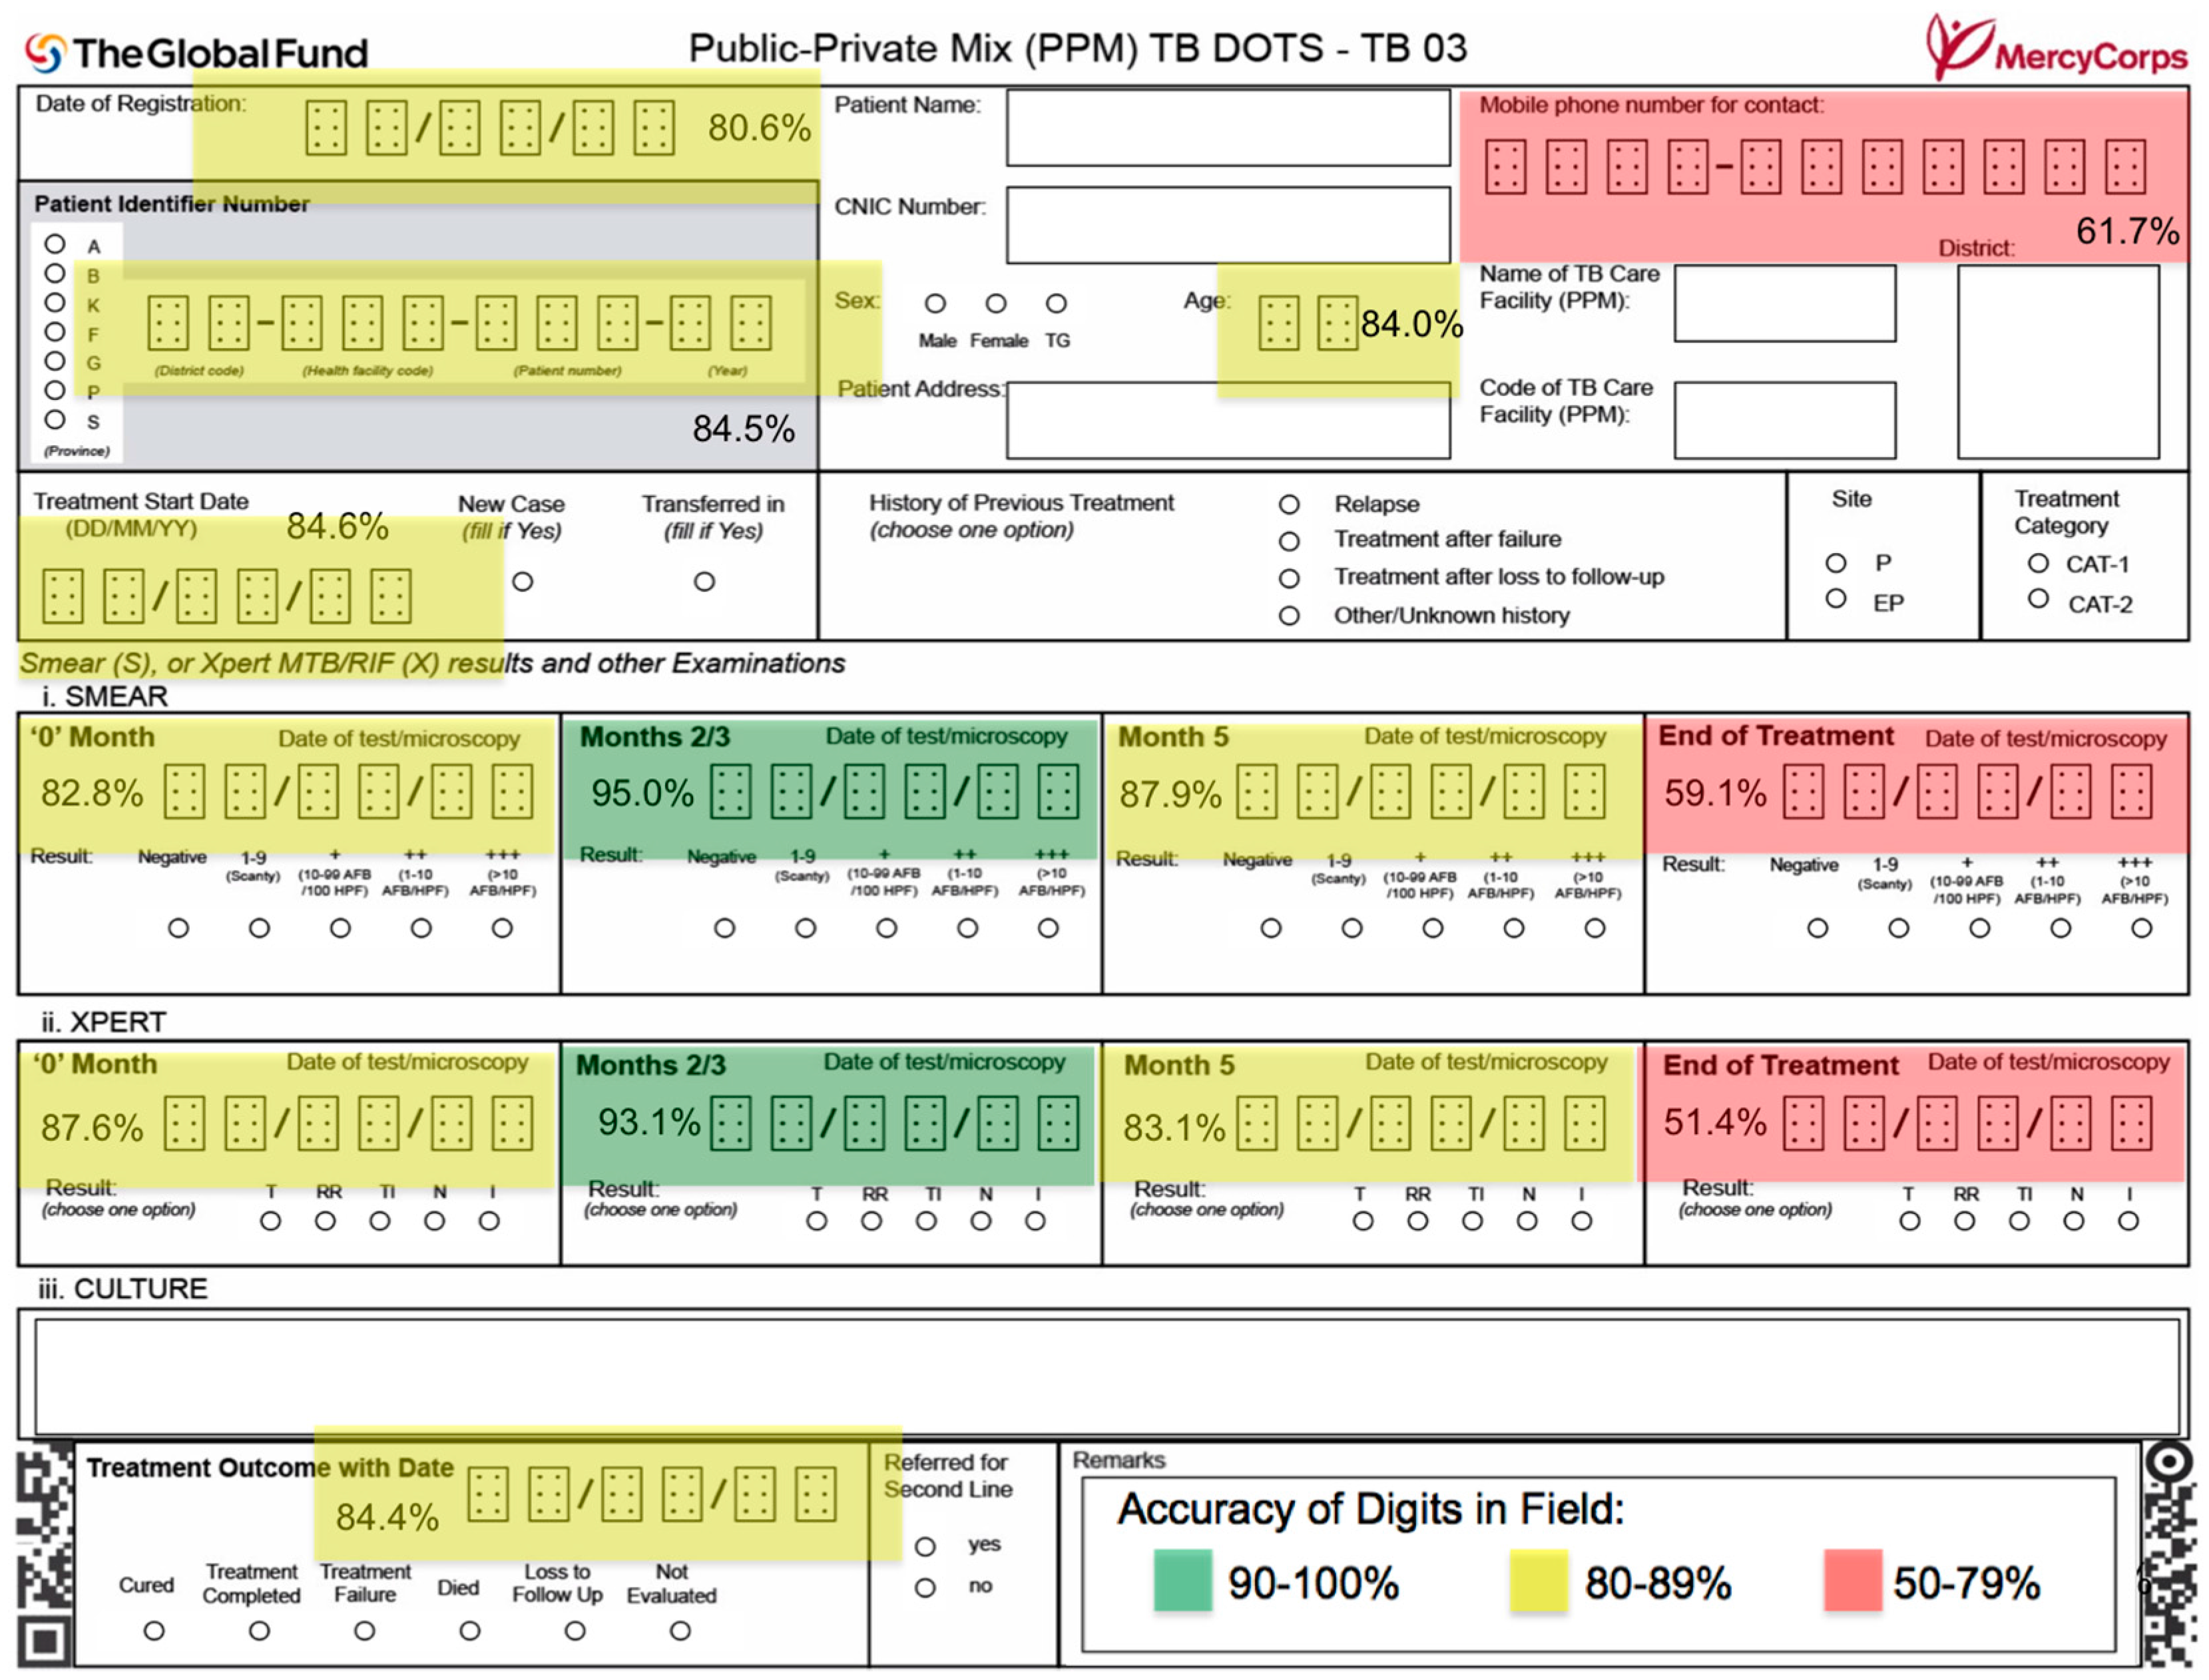
The misclassified number fields were further investigated by mapping accuracy measures of the number boxes on the TB form to specific fields on the physical paper. It was found that fields located on the right side of the page, the side farthest from the register book’s binding, suffered from lower accuracy measures than the number boxes which were located closer to the center or left-hand side (
Figure 4). Inspection of the captured images showed that the pages were bending away from the binding. This bending warped the point-to-point mapping of the captured image to the template file, which caused the expected image snippet coordinates to mismatch. The resulting image snippets were misaligned, meaning that there would be missing edges and other important information. The structured number classifier’s accuracy suffered when attempting to classify misaligned image snippets.
User-level quality measure: The ODK Scan workflow includes viewing, editing and verifying data before it is synced with the server. Field workers were therefore given complete responsibility for the quality assessment and improvement. However, in the existing manual data entry process, this responsibility is shared between a field worker and a data management officer (DMO). The DMO is responsible for data entry and quality at the next level of management. When data quality (accuracy) of synced records were checked and compared with the quality of manually entered records, it was found that the existing manual data entry process resulted in a data accuracy rate of 94%, while the ODK Scan process only reached 86%. As described in the methodology section, both of these accuracy rates were calculated by comparing values observed from the paper records with the values that were saved to the digital record in each process. While it is understandable that human accuracy for data entry did not reach a perfect 100% for either processes, the discrepancy between the two rates shows that the task-dependence of field-worker for data verification with ODK Scan did not meet the quality of the existing manual data entry. This discrepancy between the manual data entry and verified ODK Scan data accuracy rates is further explored in the discussion section.
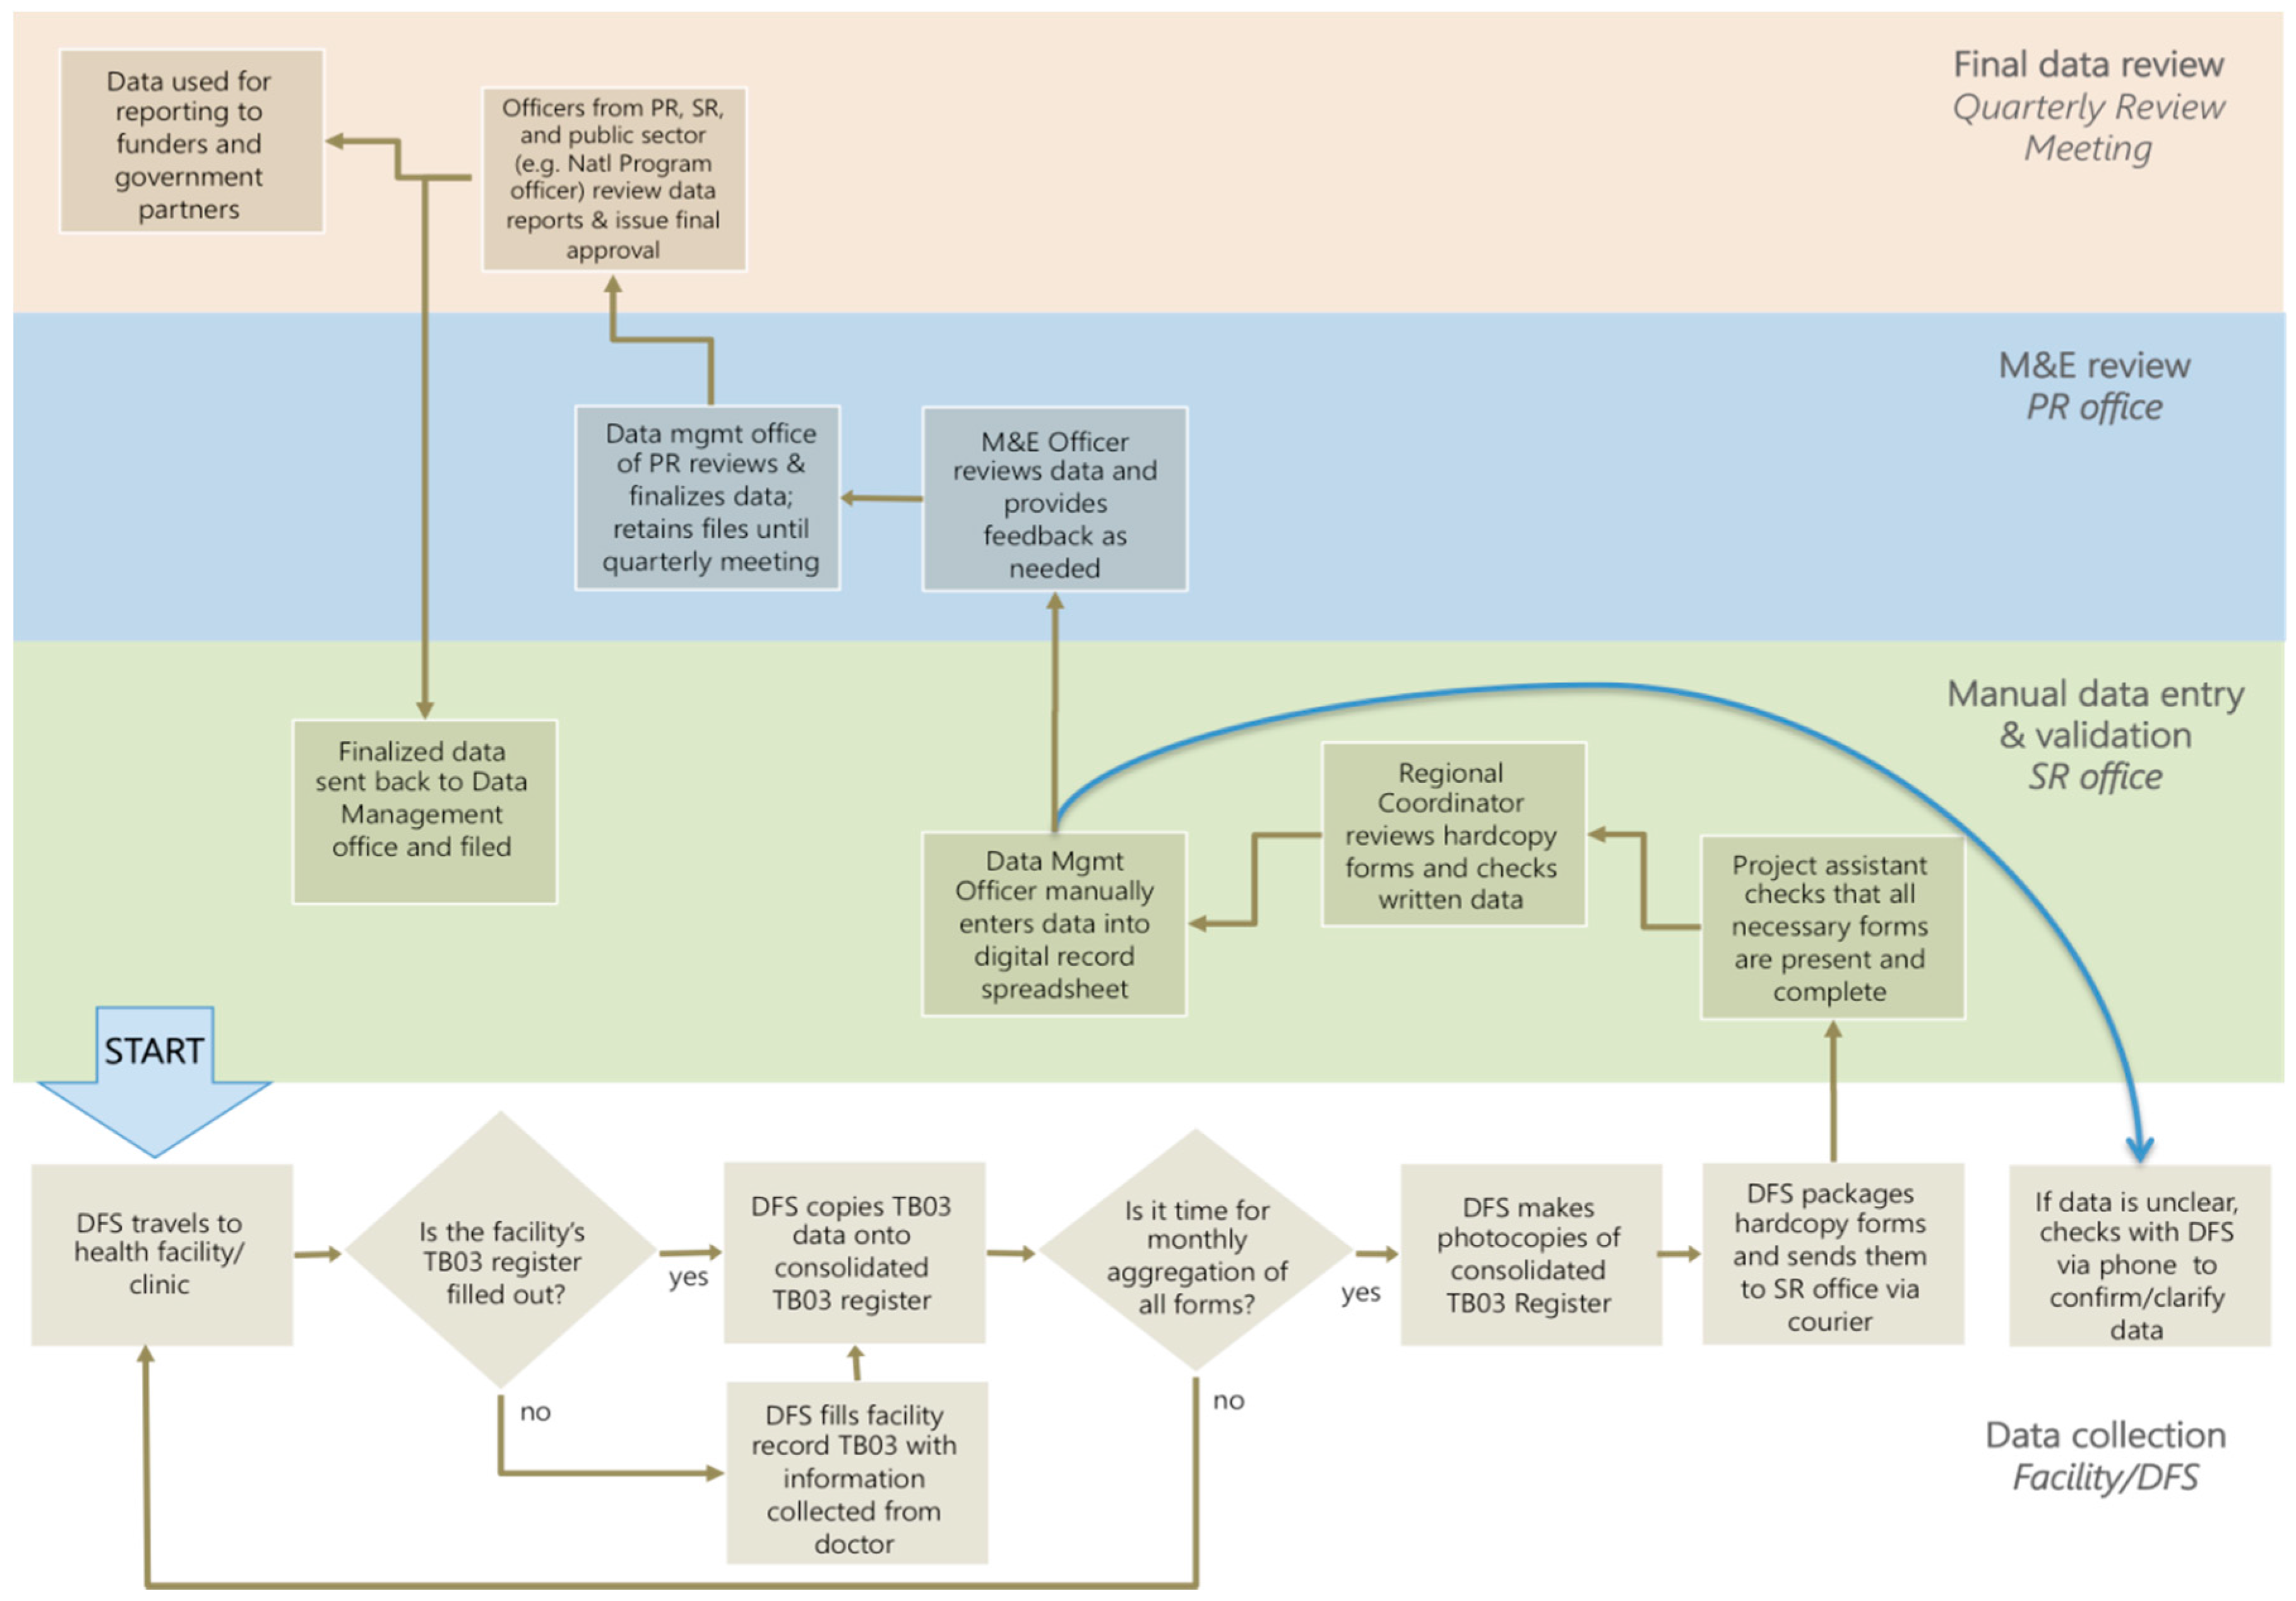
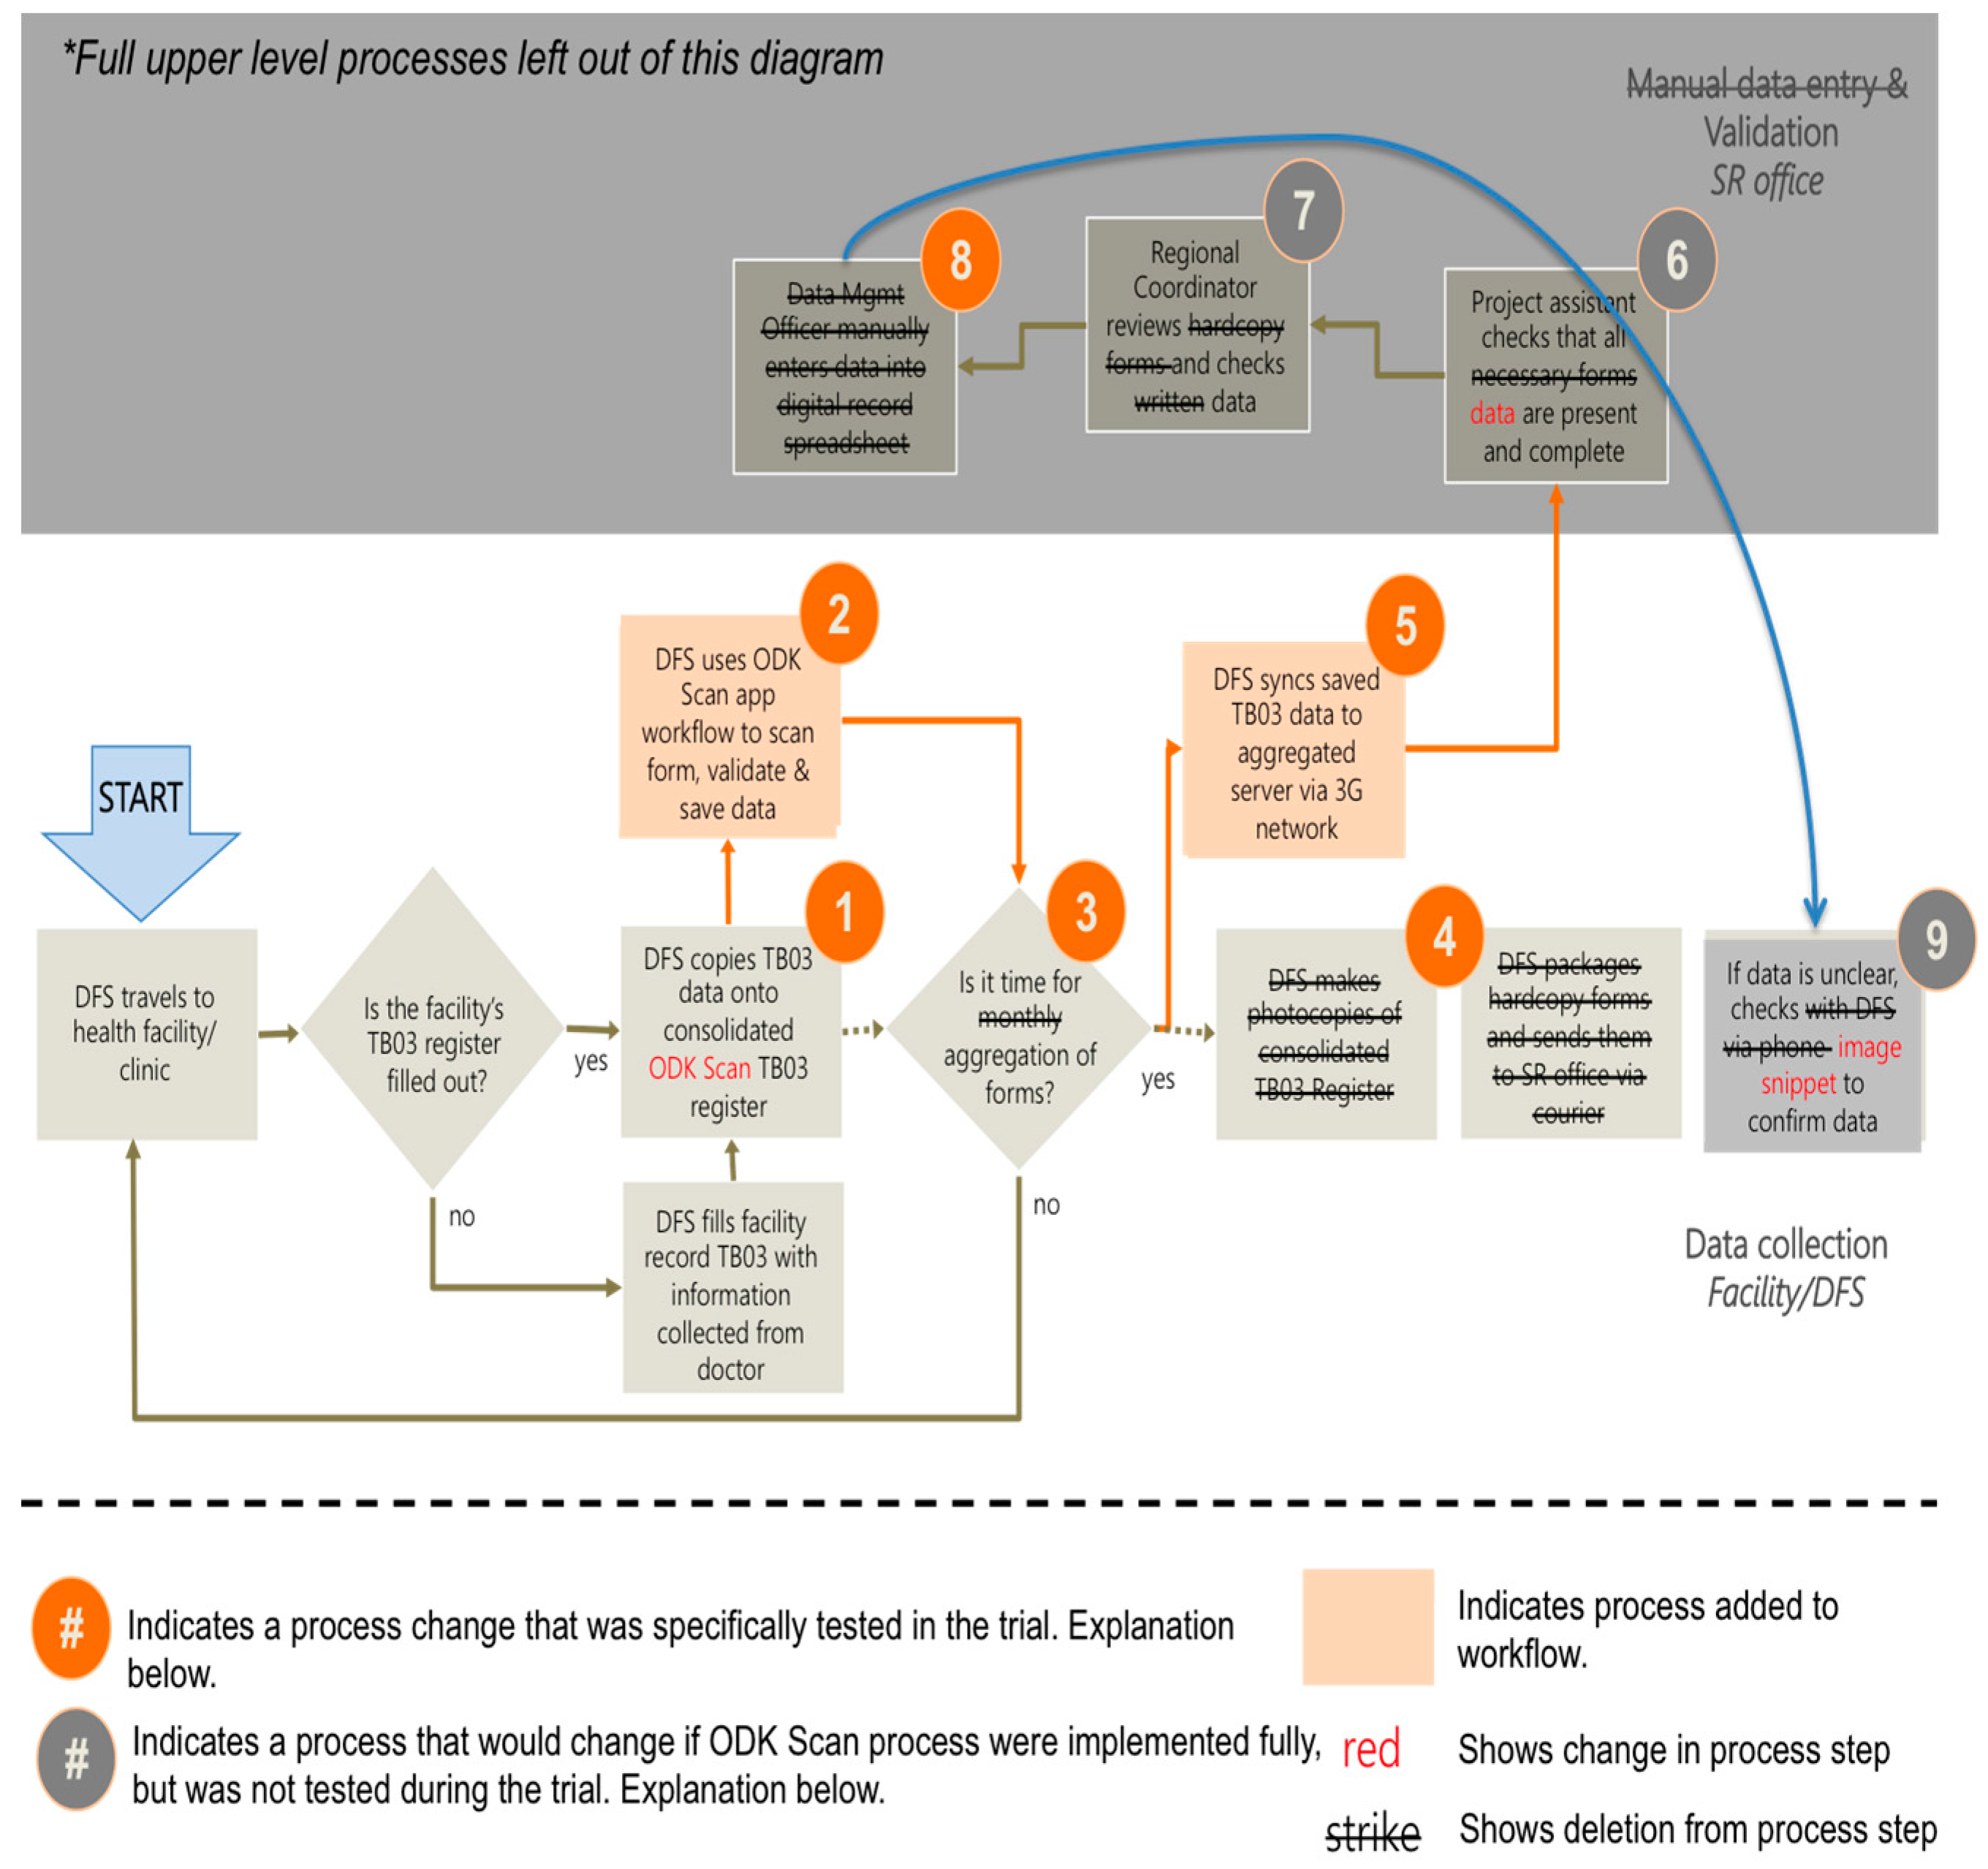
3.2. Impacting Data Management Processes
In the TB control program, the routine data management process begins with the collection of data from all enrolled general practitioners (GPs). Once the consolidated paper-based report is prepared it is transferred to the next level of management (sub-recipient office), which then passes through multiple desk reviews and is finally entered into an Excel spreadsheet. The digitization of paper-based records takes a significant amount of time before it is shared with the next level of management (principle recipient office) for finalization and progress review meetings (
Figure 5). Time spent in form-filling, data collection, transfer, aggregation and verification was measured by the direct observation. At baseline, these measures were recorded by observing the routine data management process. However, at the endline, the same measures were recorded by observing the ODK Scan workflow.
Filling in the ODK scan-compatible TB form took longer than the old form. Extra attention was required for filling in bubbles and writing structured numbers on the guiding dots correctly. Each field worker (n = 4) was observed while filling in three Scan-compatible forms. The average time taken to fill 12 Scan-compatible forms was 02 min 57 s (max, 03:04 s; min, 01:48 s). However, on average it took 1 min and 27 s to fill in one patient record using the existing TB03 register. The next aspect of data management, data collection, was not affected by the ODK Scan workflow because the process remained the same: visit all of the enrolled GPs of a district. Finally, with the routine data management process, once data collection was completed, it took 1–2 days to transfer data via local courier service, in the form of hard-copies. However, with the ODK Scan process the same transfer of data only lasted a few min. It only required the user to get to an area of internet connectivity and send the data to the ODK Aggregate Server.
In the routine data management process, aggregation of records required manual data entry into a spreadsheet, and digitization of one record took 2 min. This digitization process was reduced to 10 s in the ODK Scan workflow. Moreover, the data verification process was greatly altered, as in the ODK Scan process the field worker took the sole responsibility of viewing and verifying data, while in the routine data management process this responsibility was shared between field worker and DMO. In terms of time, verification of paper based records took 20 s per record for the DMO, while in the ODK Scan process it took 3 min per record for the field worker. The increased consumption of time in the verification step of the ODK Scan is because of the app workflow involving identification and rectification of the misrecognized machine-readable data fields by moving point-by-point. The ODK Scan process provided a significant time reduction for the data transfer and aggregation steps; however, time required for the verification and form filling were increased as compared to corresponding processes of the routine data management (
Table 2,
Figure 6).
The redesigned data management process saved resources by eliminating tasks that demanded time and money. In the routine data management process, paper-based records were sent to the office for digitization via local courier service. However in the redesigned process, manual entry of the records at the office is completely eliminated and data is sent to the server electronically through internet connectivity. The redesigned data management process offered flexibility to supervisors in reviewing digital data and enabled them to provide feedback immediately.
3.3. Feedback on App Usability and Workflow Modifications
The field workers learned quickly how to use the smartphones and swiftly became comfortable with the application’s workflow: most of them were already using smartphones in their personal lives. Nevertheless, the implementation of ODK Scan was guided by the principles of minimal disturbance in current workflow and generating value for users to improve the chances of adoption. Face-to-face interviews were conducted independently with each of the field workers at the end of the intervention period. These interviews were supported by a semi-structured questionnaire, which included hints to guide the interviewer to ensure the completeness of the feedback. The interviews were conducted by a research team member in the language of the enrolled field workers (Urdu). All interviews were digitally recorded, transcribed in Urdu and then translated into English. The interview recordings and the corresponding translations were then checked by another team member for consistency and completeness. Data is segregated based on the various steps of the app workflow for the ease of analysis and presentation.
3.3.1. Form Filling
In both routine and redesigned data management processes users are required to fill paper-based form. The form designs used in routine and redesigned processes are completely different, but data fields are common between the two designs. Furthermore, the Scan-compatible TB03 form allowed more structured and fewer hand written text fields, whereas the standard TB03 form included hand written data fields only. The ODK Scan process begins with filling in the ODK Scan-compatible form. This includes marking the correct bubble for the fill-in bubble fields, linking guide dots for the structured number fields and writing in the text fields. Field test results showed that this step took more time as compared to the corresponding step of the routine data management process. Moreover, in terms of learning to fill in the new form, all of the field workers adapted to the form well and found it easy to locate the desired field. Nonetheless, almost all field workers were unhappy about the time-consuming aspect of the form filling for the ODK Scan process (
Table 3), while at the same time they acknowledged the benefit of using number boxes and fill-in bubbles. One DFS said, “This experience was very good. This is excellent. Especially dots and bubbles have eliminated any chance of the data management officer contacting us for clarification or to address any readability issue.”
Interestingly, one DFS highlighted a different aspect of this, saying
“[I do not like] filling the dots on the form as they are time consuming. Also, filling the dots embarrasses me whenever I do that in the presence of others. It seems like I am a kid and practicing handwriting.”
3.2.2. Scanning Form
Scanning a Scan-compatible form requires the user to take a picture of the paper form using smartphone’s built-in camera. This lets the application process the form in the background and detects machine-readable, hand-marked data fields. Once the processing of image is finished, a notification appears in the top toolbar. Field workers understood the importance of taking a good quality picture, and one described it as follows:
“A good picture is one which is not blurred, and properly focuses the form and covers all the edges of forms. No corner should be cut.”
Field workers considered this step important and easy to learn. Knowing this step to be important for having accurate and better classification results, they preferred to take image at a relatively calmer place. One field worker said, “Because this is delicate task and to make its editing error-free, I conduct this exercise at home.”
3.3.3. Verifying Data
When an image is processed, the record is stored into the ODK 2.0 database. The user then launces the ODK Survey app by pressing the “Transcribe” button to verify the data. This allows the field worker to move field-by-field checking for any necessary edits. Most of the field workers considered the data verification process time-consuming, which may have contributed to the relatively lower data quality in comparison to the manual data management process. One field worker explained this process as follows: “I performed verification by pressing next option to move from one field to another. I checked all data points of one form and verify each field to confirm that data written on form is properly scanned and all mistakes are rectified. The information is easily viewable.”
Moreover, one field worker explained the positive aspect of this verification step and said, “Using this app feature, I feel more confident about the quality of data as I view and verify each data fields one-by-one. It feels like I am taking complete charge of the data quality.”
3.3.4. Sending Data
Sending data to the next management level was significantly easier with the ODK Scan process. In the Scan process, this simply involves getting to an area with internet connectivity and sending data to the server by syncing it. Conversely, in the routine data management process, it is very time and energy consuming: copies of the TB register must be sent to the office through a reliable courier service. One of the field workers explained this process: “Using sync feature is easier because I do editing mostly at home then I reach an area of connectivity and sync forms. While, for sending paper forms via courier, first I have to carry big sized TB03 register to photocopier to make the copies of TB03, then I have to visit courier office to send the parcel. It will not reach the same day, at least it takes one day and then I have to call office to confirm if they have received the parcel/documents.”
Another field worker explained the process of data sharing that he adopted over the intervention period: “Once editing is finalized, then we connect device to Internet—mostly to WiFi—and open Core Services app for syncing. First I verify my email address then syncing is confirmed. Mostly I used to sync the data from public partner’s office, and if I am far away then I go to local Internet café to sync data. To ensure my connectivity with Internet I check and confirm WiFi icon on top of the screen.”
However, dependence on WiFi internet connection for syncing the data was challenging for two of the field workers, and one of them said, “It would be very great and easy for us if ODK can sync forms via 3G Internet connectivity. As it is, I scan and edit the forms at home and for syncing forms I have to travel to place where I can have access to WiFi which takes too much time.”
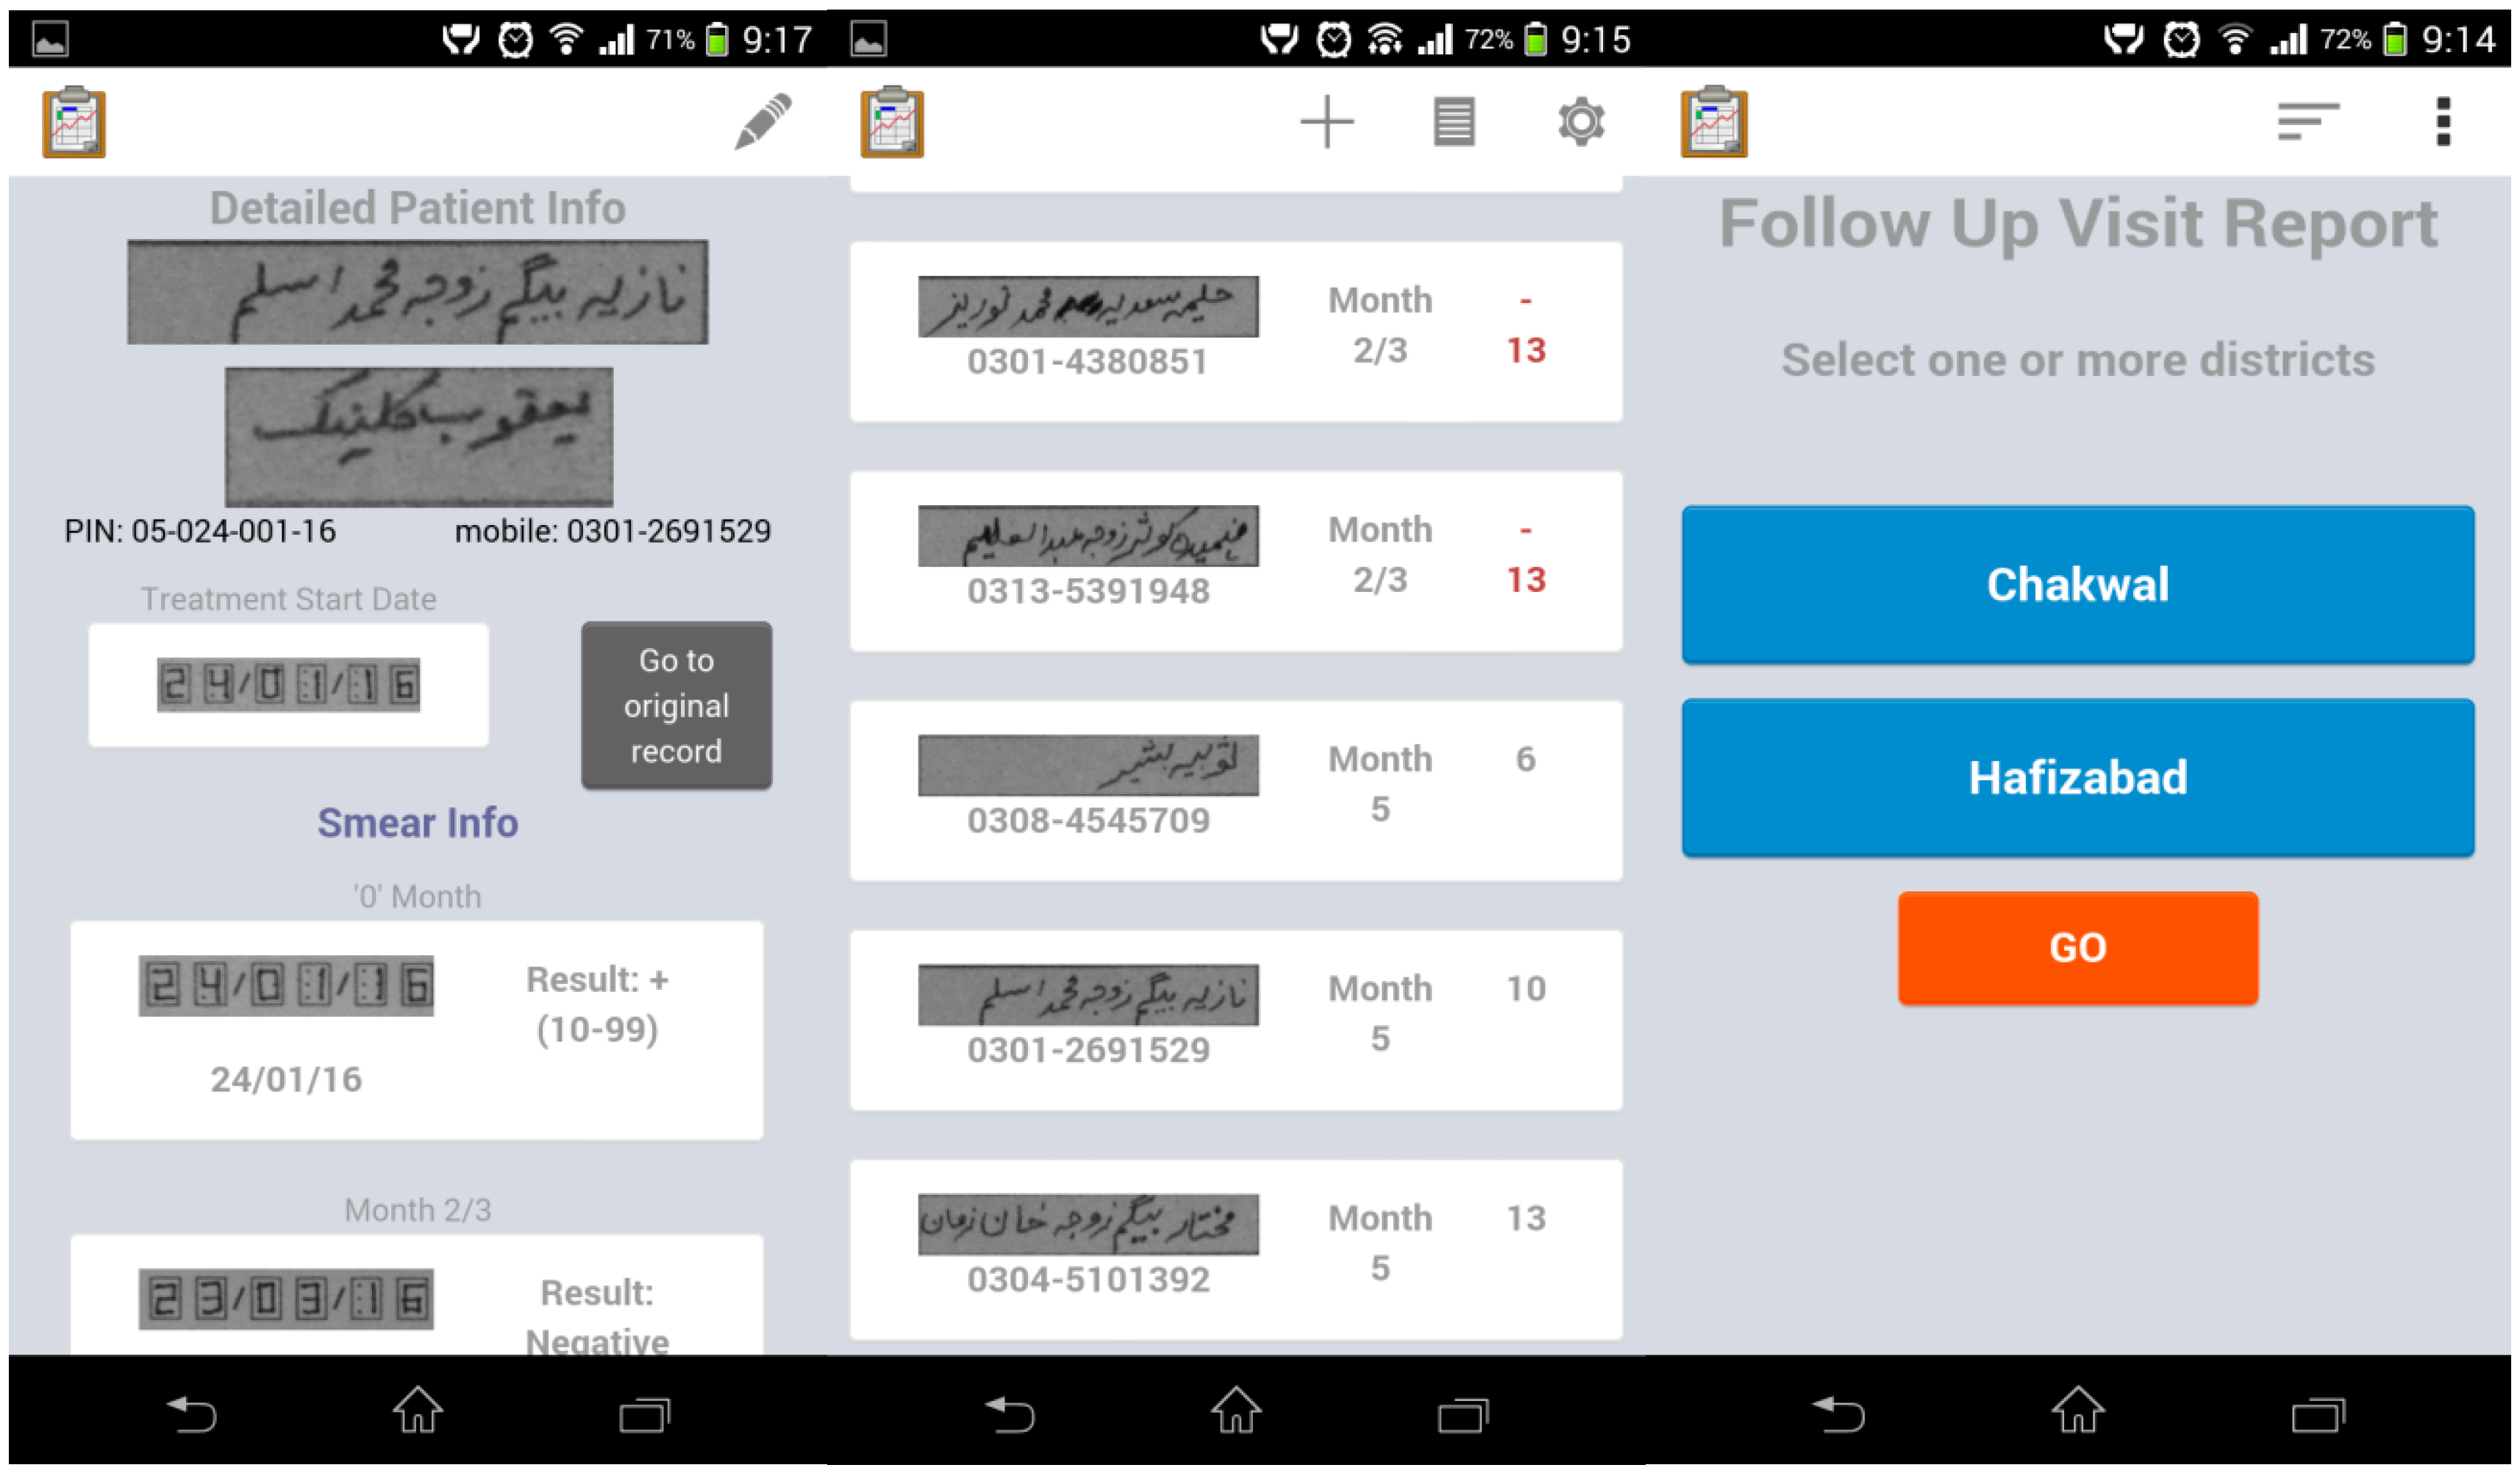
3.3.5. Report Generation
Regular sputum smear microscopy is an important medical aspect in ensuring adherence to the treatment protocol and declaring the treatment outcome of a TB patient. It is extremely difficult to review paper-based records and prepare a list of patients whose sputum smear microscopy is due in the next month. This time-consuming exercise is iterative and considered as a fundamental responsibility of the field workers for tracking treatment progress of the registered patients. With the ODK Scan process, generating this actionable information became easier by running a customized follow up visit report on the smartphone in offline mode (
Figure 7). This enabled field workers to keep a constant check on the treatment progress of the patients registered in his area of control. Moreover, all field workers talked very positively about the benefits of this report. One of them said, “My existing practice is to review TB03 in the beginning of month to identify patients with follow up appointments. This task takes lot of time and mental energies as it is difficult to develop such list. With that view point, if I see this application, this is an excellent idea that I open app and all follow up visits will be appeared.”
Others said:
“This is the best feature of this application, as now we know in advance when we have to call the patient for follow-up.”
“Previously my practice was to visit all the GPs to enlist patients who have follow up visit due or overdue. Now with this report I do not have to visit the GPs to know patient’s follow up visit date.”
“I would say that, follow up visit report has revolutionized our work. Now, we will never miss out any patient and upon click we view all needed information required for follow up.”
3.3.6. Suggestions for Improvement
After analyzing the content of interviews, it was evident that the field workers completely understood the app workflow and appreciated the benefits of using ODK Scan in improving their work efficiency and performance. Moreover, field workers were eager to continue application use. In addition to simple aggregation reports, field workers wanted to enhance the features of the application. For instance, they suggested including a bookmark feature to tag any patient record, if he/she is not accessible via telephone at the first attempt. With the number of the records available in a table on the user’s device, the most popular requirement was the patient look-up feature. As TB treatment involves multiple visits of the same patient for medical checkup, it is becoming increasingly difficult for field workers to retrieve a relevant patient’s record from the ODK Tables default interface upon patient’s revisit. A look-up feature will help field workers to avoid re-scanning and re-verifying forms, and the follow up service will be updated in an existing patient’s record.
Currently, synchronization involves the movement of data in either direction. This means new records on the device are sent to the server and at the same time new records available at the server, synced by others, are downloaded onto the user’s device. Deleting a record, either deliberately or mistakenly, is a potential threat of data loss. Therefore, defining user permission attributes to restrict data access to only the appropriate individuals would improve the Scan workflow. Lastly, one of the field workers suggested that instead of scanning, a direct-to-digital solution seems more feasible.
4. Discussion
This paper compares paper-based and technology-assisted data management processes and tries to extrapolate the value of mHealth solutions for capturing remote health data. In particular, the present study assesses the usability and technological aspects of the ODK Scan supported by the perspective of the field workers in relation to their work settings. However, it is also noted that in the developing country context, a prerequisite to the success of mHealth interventions is the consideration of developers and implementers about the field workers’ expectations, needs and work settings [
29,
30]. Moreover, a gap between the work practices and use of the new technologies is attributed by the poor implementation design of the technology-based interventions [
31].
In the Public-Private Mix model of the TB control program of Pakistan, despite available direct-to-digital data collection solutions, the ODK Scan paper-to-digital system was chosen because of the current healthcare system requirement. Largely, the healthcare system relies on paper-based records for recording, reporting, verification, validation and other purposes. This setting informed the selection of ODK Scan paper-to-digital system. In other mHealth interventions where Android-based smartphones are used primarily for data collection, the ability of smartphones to transfer data in real time from remote areas to centrally located offices is achieved by exploiting the internet connectivity [
15,
32]. Similarly, in this field test, internet connectivity benefited field workers in transferring the data and labor involved in sharing the data in the form of hard copies was avoided. However, the ability of smartphones to transfer data by using 3G internet connectivity instead of WiFi would be highly beneficial. More than just digitization of patient’s records, technology also supports report generation, case management and patient follow-up [
33].
Data quality achieved through the ODK Scan process is not impressive if compared with its counter process. This drop in quality can be explained through imperfect computer vision algorithms, and the change in the field workers roles; previously field workers were not solely responsible for ensuring data quality. In terms of time, the routine process of data review takes much longer than the new process of the data review and verification. Therefore, an alternative approach to improve the data quality would be to carry out supportive supervision, so that acceptable level of quality of the final set of data could be achieved [
34]. However, supportive supervision role can be strengthened by providing appropriate training and timely feedback to the field workers on the data quality aspects. Additionally, effective data verification approaches require determination of the data quality characteristics and the application of quality standards [
35]. However, the benefits of the mHealth technologies are improved with increased validity of the digital data [
36]. Data quality could also be enhanced by improving ODK Scan’s algorithms, but this is an expensive and difficult proposition. The worst of the accuracy problems were associated with poor form alignment due to bending pages. This might be helped by improving the form alignment algorithm or training the classifiers to handle misaligned snippets. Classification accuracy might also be improved by using context information, such as specified valid numeric or date ranges, though this would increase form design complexity.
In the ODK Scan pilot test, unrestricted mobile and internet usage was authorized in good faith to generate ownership and responsibility among the field workers. It is also reported that the free use policy has generated a sense of ownership and empowerment among the health workers by recognizing the significance and convenience of the smartphone usage in their practices [
37].
The most challenging aspect of the use of ODK Scan was filling in Scan-compatible forms that included fill-in bubbles, number boxes and text fields. Additionally, this field test recorded significant time consumption on data verification and editing processes, which is expected to be reduced with field workers becoming more accustomed with scan-compatible form and related processes. Likewise, one of the data field workers also mentioned the practice aspect of the time reduction during an interview. On one hand, viewing and verifying all processed data values is beneficial for ensuring data quality, but on the other hand this requires the field worker to spend more time finalizing the scanned record after correcting Scan’s errors. Therefore, more errors in the machine-readable data fields resulted in the frustration of field workers. Furthermore, lower recognition accuracy of the number boxes indicates a need for additional application engineering work to make ODK Scan more practical and workable solution. However, it is also an essential consideration for an implementing organization to include as many machine-readable data fields as required [
38]. Additionally, the opinion of the field workers must be included during the form design process, so that the workload is anticipated and subsequently accepted by them and only important data fields are chosen for the ODK scan paper-to-digital system. Complexity of the mHealth interventions requires change management considerations, including changes in the behavior of healthcare providers and professionals, and systems and processes in delivering care [
39,
40].
Considering the short duration of the ODK Scan pilot phase, its impact on the TB case management aspects and treatment outcomes could not be measured. After feedback-informed technology enhancements, its expansion plan in the TB control program of Pakistan will be prepared. In current mHealth domain, a key challenge is to make strong evidence available for advocating the proliferation of mHealth use in improving health outcomes. Therefore, in future studies, we aim to measure ODK Scan’s effectiveness in ensuring fidelity to treatment protocols and improving treatment outcomes.


 ,
, 


