Towards Rack Utilization in Internet Datacenters: An Approach Based on Dynamic Programming

1
School of Computer and Information Engineering, Chuzhou University, Chuzhou 239000, China
2
Tencent, Inc., Guangzhou 510000, China
*
Author to whom correspondence should be addressed.
Future Internet 2017, 9(2), 17; https://doi.org/10.3390/fi9020017
Submission received: 20 February 2017
/
Revised: 24 April 2017
/
Accepted: 3 May 2017
/
Published: 6 May 2017
Abstract
:In the datacenter rented to Internet Service Providers (ISPs), the low utilization of racks can seriously affect ISPs’ benefit because the ISPs are charged by “rack per year” rather than servers. Based on our analysis about the utilization data from production systems, we find that the over-provisioning of power results in low power utilization, which potentially decreases rack utilization as well as the ISPs’ benefit. To improve the rack utilization, maximizing the number of servers in racks is an effective way. In this paper, we propose a server placement algorithm to minimize the power fragment in a rack. The experimental results show that it can save more than 50% leasing cost (rack utilization improvement) in evaluation.
1. Introduction
Large-scale Internet Service Providers (ISPs) like Google, Facebook, Amazon and Tencent [1] usually rent Internet Data Centers (IDCs) to deploy their Internet services. Generally, IDCs are composed of infrastructure (e.g., servers, storage and network devices essential for the provision of Internet services, which are packaged in racks) and supporting environment (e.g., machine rooms, electricity, refrigeration, and network access needed for guaranteeing the normal running of infrastructure).
As for large ISPs, there are two major methods of constructing IDCs. The first one requires ISPs to construct and manage all of the infrastructure of IDCs and their supporting environments, and we call it “self-building mode”. The other method requires the ISP to build and manage the infrastructure of IDC, while the supporting environment is leased from a Data Center Provider (DCP). Thus, we call it “leasing mode”, e.g., Google, Amazon and Yahoo lease the supporting environment from Equinix (Redwood City, CA, USA), an American public corporation providing carrier-neutral data centers and internet exchanges to enable interconnection [2].
Although Google et al. are trying the self-building mode, the leasing mode is still used widely due to its low construction cost, professional maintenance, and scalability, etc. In addition, it is quite difficult to build an IDC overseas because of national security policies. That is why the leasing mode is the common option of most ISPs. The operating cost under leasing mode mainly includes the lease expense to DCP. For convenience, DCP usually charges ISPs for the supporting environment at the unit of “rack per year”, rather than according to specific services it offers. That is, the more racks an ISP uses, the more lease expense it should pay the DCP. Therefore, to reduce the rack number by enhancing rack utilization is an effective way to lower the operating cost of ISP.
There are several factors limiting the rack utilization, which are as follows:
- the total height of all servers in one rack should not exceed the height of the rack;
- the number of servers should not exceed the total number of switch ports in one rack;
- the total power used by servers should not exceed the power allocated to one rack.
As the IDC infrastructure including racks and switches are customized by ISPs, DCP usually sets no limitation on the height of rack and the number of switch ports in a rack. However, since the power supply system is pre-determined when building an IDC, the power of racks is subject to the power supply system in IDC. That is to say, the power of rack is the key limiting factor of rack utilization in IDC with leasing mode, and the rack utilization we focus on is essentially the utilization of rack power. Studies [3,4] have found that the power used by servers is always far below their power rating.
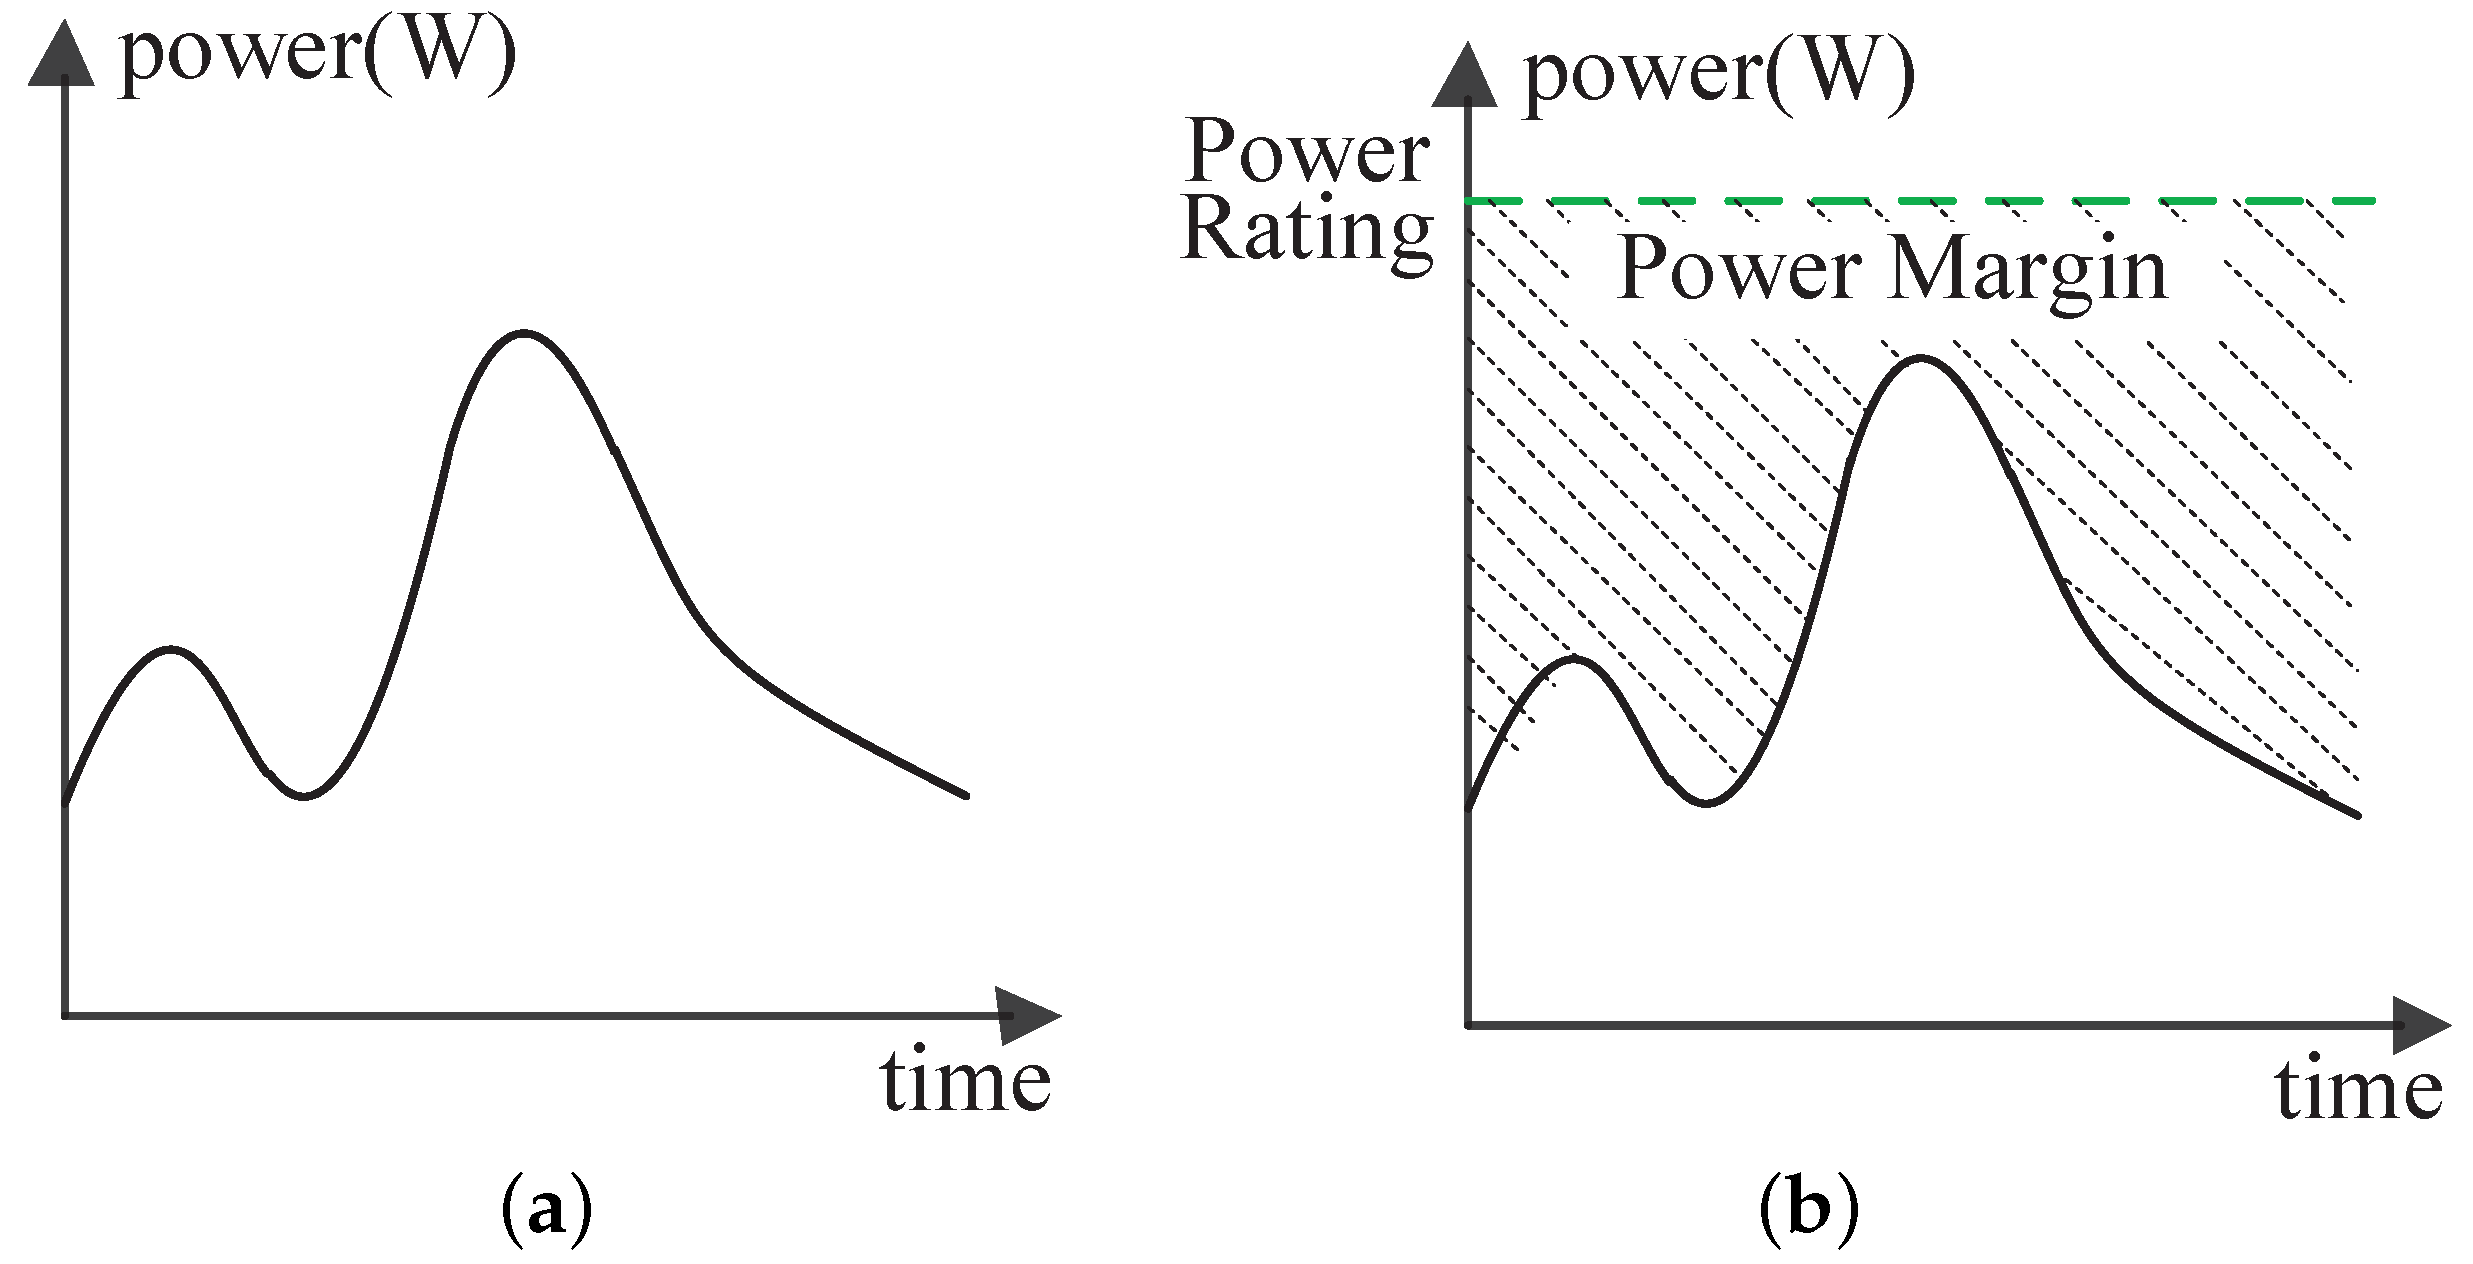
Taking Figure 1 as an example, assuming the power demand of a server over time is as shown in Figure 1a, if we set its power budget at the power rating as shown in Figure 1b, there will be a huge power margin in the area shaded by dashed line. Specifically, the power margin is the part of the power budget that is not consumed by the servers, which directly decreases the rack utilization.
To eliminate the power margin in servers, the server consolidation approach [5,6,7] unites as many applications as possible into fewer servers to make full use of the power budget. However, there are some problems with this method in real-world datacenters [8]. First, due to the higher density of applications in a server, a single point of failure will affect more applications. Meanwhile, server consolidation is typically based on virtualization, which could bring some overhead and unfair contentions among applications. Finally, there is an inevitable cost of application migration when consolidating applications.
Another approach to eliminate the power margins is to restrict power budgets of servers [9,10,11,12], that is, to set a lower power budget by using power capping technology. Since the power supply of a rack is typically fixed, restricting the power budget of servers will allow more servers to be deployed in a rack. As the power of servers changes with the utilization of servers, the actual power of servers may exceed their power budget. To avoid this issue, an appropriate value should be set for the power budget of each server using the technique of power capping, which has been addressed in our previous work [13]. After power budgets are assigned for each server in a rack, there will probably be some remaining space of power, which is called power fragment of rack and will affect the rack utilization. Reducing power fragment involves the permutation of racks and servers in IDC, which is difficult to decide due to their vast amount. To solve it, we propose a server placement algorithm based on dynamic programming to address the arrangement of racks and servers with given power budgets, which is capable of making an approximately optimal solution in a short time.
The main contribution of this paper is three-fold:
- we analyse the potential reasons for inefficient rack utilization;
- we propose a server placement algorithm based on dynamic programming to make a solution about the arrangement of racks and servers with given power budgets;
- we evaluate our algorithm based on real data from Tencent and synthetic data.
The rest of this paper is organized as follows. The related work is discussed in Section 2. In Section 3, we introduce how to deploy servers in racks and analyse the potential reasons for inefficient rack utilization. In Section 4, we propose a server placement algorithm and evaluate it in Section 5 with the real traces from racks and servers in Tencent and synthetic data. Section 6 concludes this paper and points out our future work.
2. Related Work
Saving the power consumption of servers can increase the number of servers installed in IDC and thus the utilization of IDC. Many researchers have discussed the issue of power consumption from the level of servers [14] to that of IDC [6,7]. Generally, the solutions are thought to be of two kinds: shutting down the idle servers [6,7,15] and dynamic voltage and frequency scaling (DVFS) [8,16]. The former solution usually relies on the server consolidation technology to merge more businesses into fewer number of servers, thus shutting down those idle servers or support equipment. This method improves the power utilization of servers and lowers the power margin of servers. However, there exist some implementation issues. The work of [17] presents the disadvantages of business migration after shutdown, and the work of [6] indicates that the server consolidation may result in resource competition. The DVFS technology, derived from the Busy-Idle state switch of CPU [8], has been expanded to other components, such as memory and disk [8,17] to reduce the power consumption of servers at low utilization. More server margin can be released in the case of low utilization of server by adopting DVFS, so as to provide more space for further improving the rack utilization.
Both the shutdown of idle servers and DVFS can reduce power supply, which may cause the performance loss of applications. Many researchers have taken into account this issue [10,14]. The authors of [6] obtain the business performance in various consolidation cases through the offline experiment with pairwise integration of different businesses, but it results in huge experimental cost. The work of [14] analyzes the application situation of consolidation based on the assumption that the businesses with similar utilization are also similar in performance. The authors of [10] introduce the technology of power capping, and make a tradeoff between power capping and business performance. In addition, the work in [18] creates shuffled distribution topologies, where power feed connections are permuted among servers within and across racks. The authors of [7] develop a compilation technology to lessen conflicts between different businesses in the same server.
Different from the above work, in this paper, we aim to reduce the power fragments of each rack, thus promoting the rack utilization in IDC as well as saving leasing cost, by proposing a server placement algorithm based on dynamic programming.
3. Background and Motivation
Increasing rack utilization can reduces the demands for racks and thus the leasing cost of ISPs. In this section, we first introduce the background. Then, we present the motivation of our work.
3.1. Background
For racks and servers in IDC, we define two types of power space. The maximum power of rack is denoted as RackMaxPower, which is determined by the rack power supply and generally adopts its rating power. When the total power of all devices stacked inside a rack reaches or exceeds its maximum power, the power supply will be cut off to protect those devices. Meanwhile, the maximum power of server is denoted as ServerMaxPower, which generally adopts the server’s rating power. Usually, server’s power consumption will not exceed its maximum power, even if it runs at full capacity. In reality, the maximum power of server is far lower than its rating power [9]. When deploying servers, it must be ensured that the total supply of all servers in a rack will not exceed the maximum power of the rack, thus avoiding the influence on that workload running on the rack due to its power-off.
Since there is a lack of analysis on the actual operating power of all servers in IDC, the total power of servers in a rack [9,12] is usually calculated with all servers’ maximum power. With such a method, the power supply for all servers in a rack can be guaranteed, but a huge power space will be idle. Actually, most servers have always been running at a level lower than their maximum power. In addition, the existing IDCs did not consider the server arrangement from the perspective of their actual used power when deploying their servers, leaving a large power space unused in the rack.
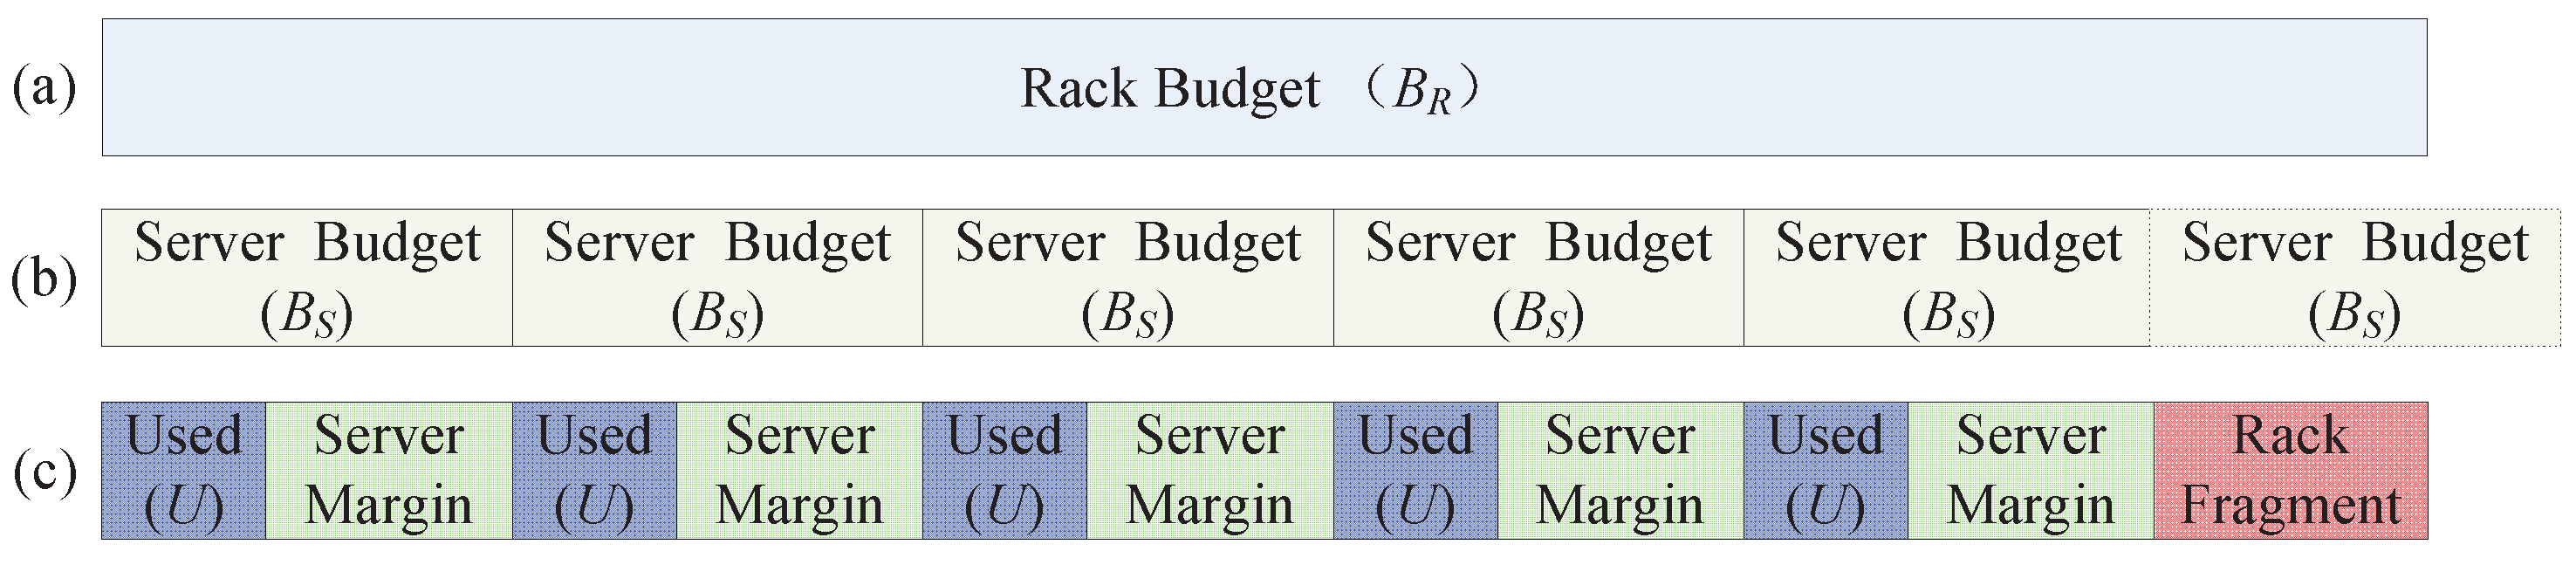
As seen in Figure 2, the power distribution in a scenario of server placement is used to demonstrate the potential in improving the rack utilization. In this scenario, the power budget of rack is , the power budget for the server to be racked is , and the average used power of a server in a long operation time (Used) is U. The power budget of rack is equal to the rack’s maximum power, and both of them are fixed. On the other hand, the power budget of server is alterable with the technique of power capping.
Figure 2a shows the power budget of each rack, i.e., . Figure 2b represents the power budget of each server, i.e., . In addition, the power budget of the server is denoted as . As seen in Figure 2b, when adding the server into a rack, the sum of server budgets of those servers has surpassed the rack budget, which is highlighted by the dashed box. Therefore, the rack is able to accommodate servers. Figure 2c demonstrates the distribution of each server’s average used power (denoted as Used).
The difference between power budget and used power in a server is defined as the power margin of server, labelled as ServerMargin, and the difference between rack budget and the sum of server budget of all servers in a rack is defined as power fragment of the rack, labelled as RackFragment. The ServerMargin represents the unused power of a server in its budget, and RackFragment refers to the power fragment resulting from the failure of hosting more servers.
The used power and power margin of the server are denoted as and , respectively; The power fragment of rack is denoted as ; the total space of all servers’ power margin and the power fragment of rack, i.e., the sum of all servers’ and the rack’s , is denoted as . The expressions of the above variables are shown as Equation (1):
In essence, the server’s power margin is caused by the over-provisioning of power, while the power fragment of the rack derives from the irrational server arrangement on the rack. Idle power can be mined from in Equation (1). The rack utilization in Equation (2) can be promoted by reducing the server’s power margin and the rack’s power fragment of :
3.2. Motivation
The power margin of server can be reduced by setting a power threshold lower than its power rating. In addition, the power threshold can be regarded as the power budget of the server. When the CPU utilization exceeds the upper limit of server’s computing power corresponding to the power threshold, the performance of applications will be affected. The lower the power threshold, the smaller the power margin of server is and thus the larger the potential performance loss may be. How to avoid the performance loss of applications running in servers by accurately setting the power threshold is not the focus of this paper and it has been addressed by researchers [13]. Without loss of generality, we assume that the power threshold for each server will have no negative effect on applications running in the server.
The authors of [9] pointed out that the existence of power fragment of a rack means a waste of power, but did not provide a solution to avoid it. Since the power budget of rack is fixed, we intend to optimize the arrangement of servers stacked inside racks to reduce the loss in rack utilization caused by power fragment of rack. Generally, reducing the power fragment of a rack does not mean that it will minimize the power fragment of all racks in a datacenter. Therefore, a comprehensive analysis on the power fragment of all racks should be conducted when there is a need to reduce the power fragment of a rack. Logically, the leasing cost of IDC is positively correlated with the total power fragment of all racks currently in use. Thus, the leasing cost can replace the the power fragment of racks as the research subject, which facilitates the evaluation of server placement mechanism.
Assuming that there is a server set S constituted by m servers to be racked, and a rack set R containing n racks. The power budget of the server is , the power budget of the rack is , and the leasing cost is . Then, our goal is to find out the mapping relation (denoted as ) from servers to racks that can minimize the leasing cost . In addition, the following constraint should be satisfied:
If meeting the condition of Equation (3), can be expressed as follows:
Thus, the key of reducing RackBudget is to find out the optimal mapping relation to minimize :
Additionally, the scales of S and R for processing at a time should be taken into account because of the requirement on the communication distance of those servers with the same application, and the time complexity of server placement algorithm with optimal cost. The following challenges need to be considered:
- how to express the leasing costs of racks with different power fragment of rack;
- how to determine the scales of servers and racks as the input of server placement algorithm;
- how to improve the utilization of multiple racks with server placement algorithm simultaneously.
4. Our Approach
The power fragments of a rack refer to the fragments of power space generated after installing servers, which cannot be utilized by the servers stacked inside racks. A more rational arrangement of servers should reduce the power fragments of racks, thus improving their utilization. In this paper, we propose a server placement algorithm with the lowest leasing cost. First, we introduce the metrics of leasing cost. Then, we describe how the server placement algorithm works.
4.1. The Metrics of Cost
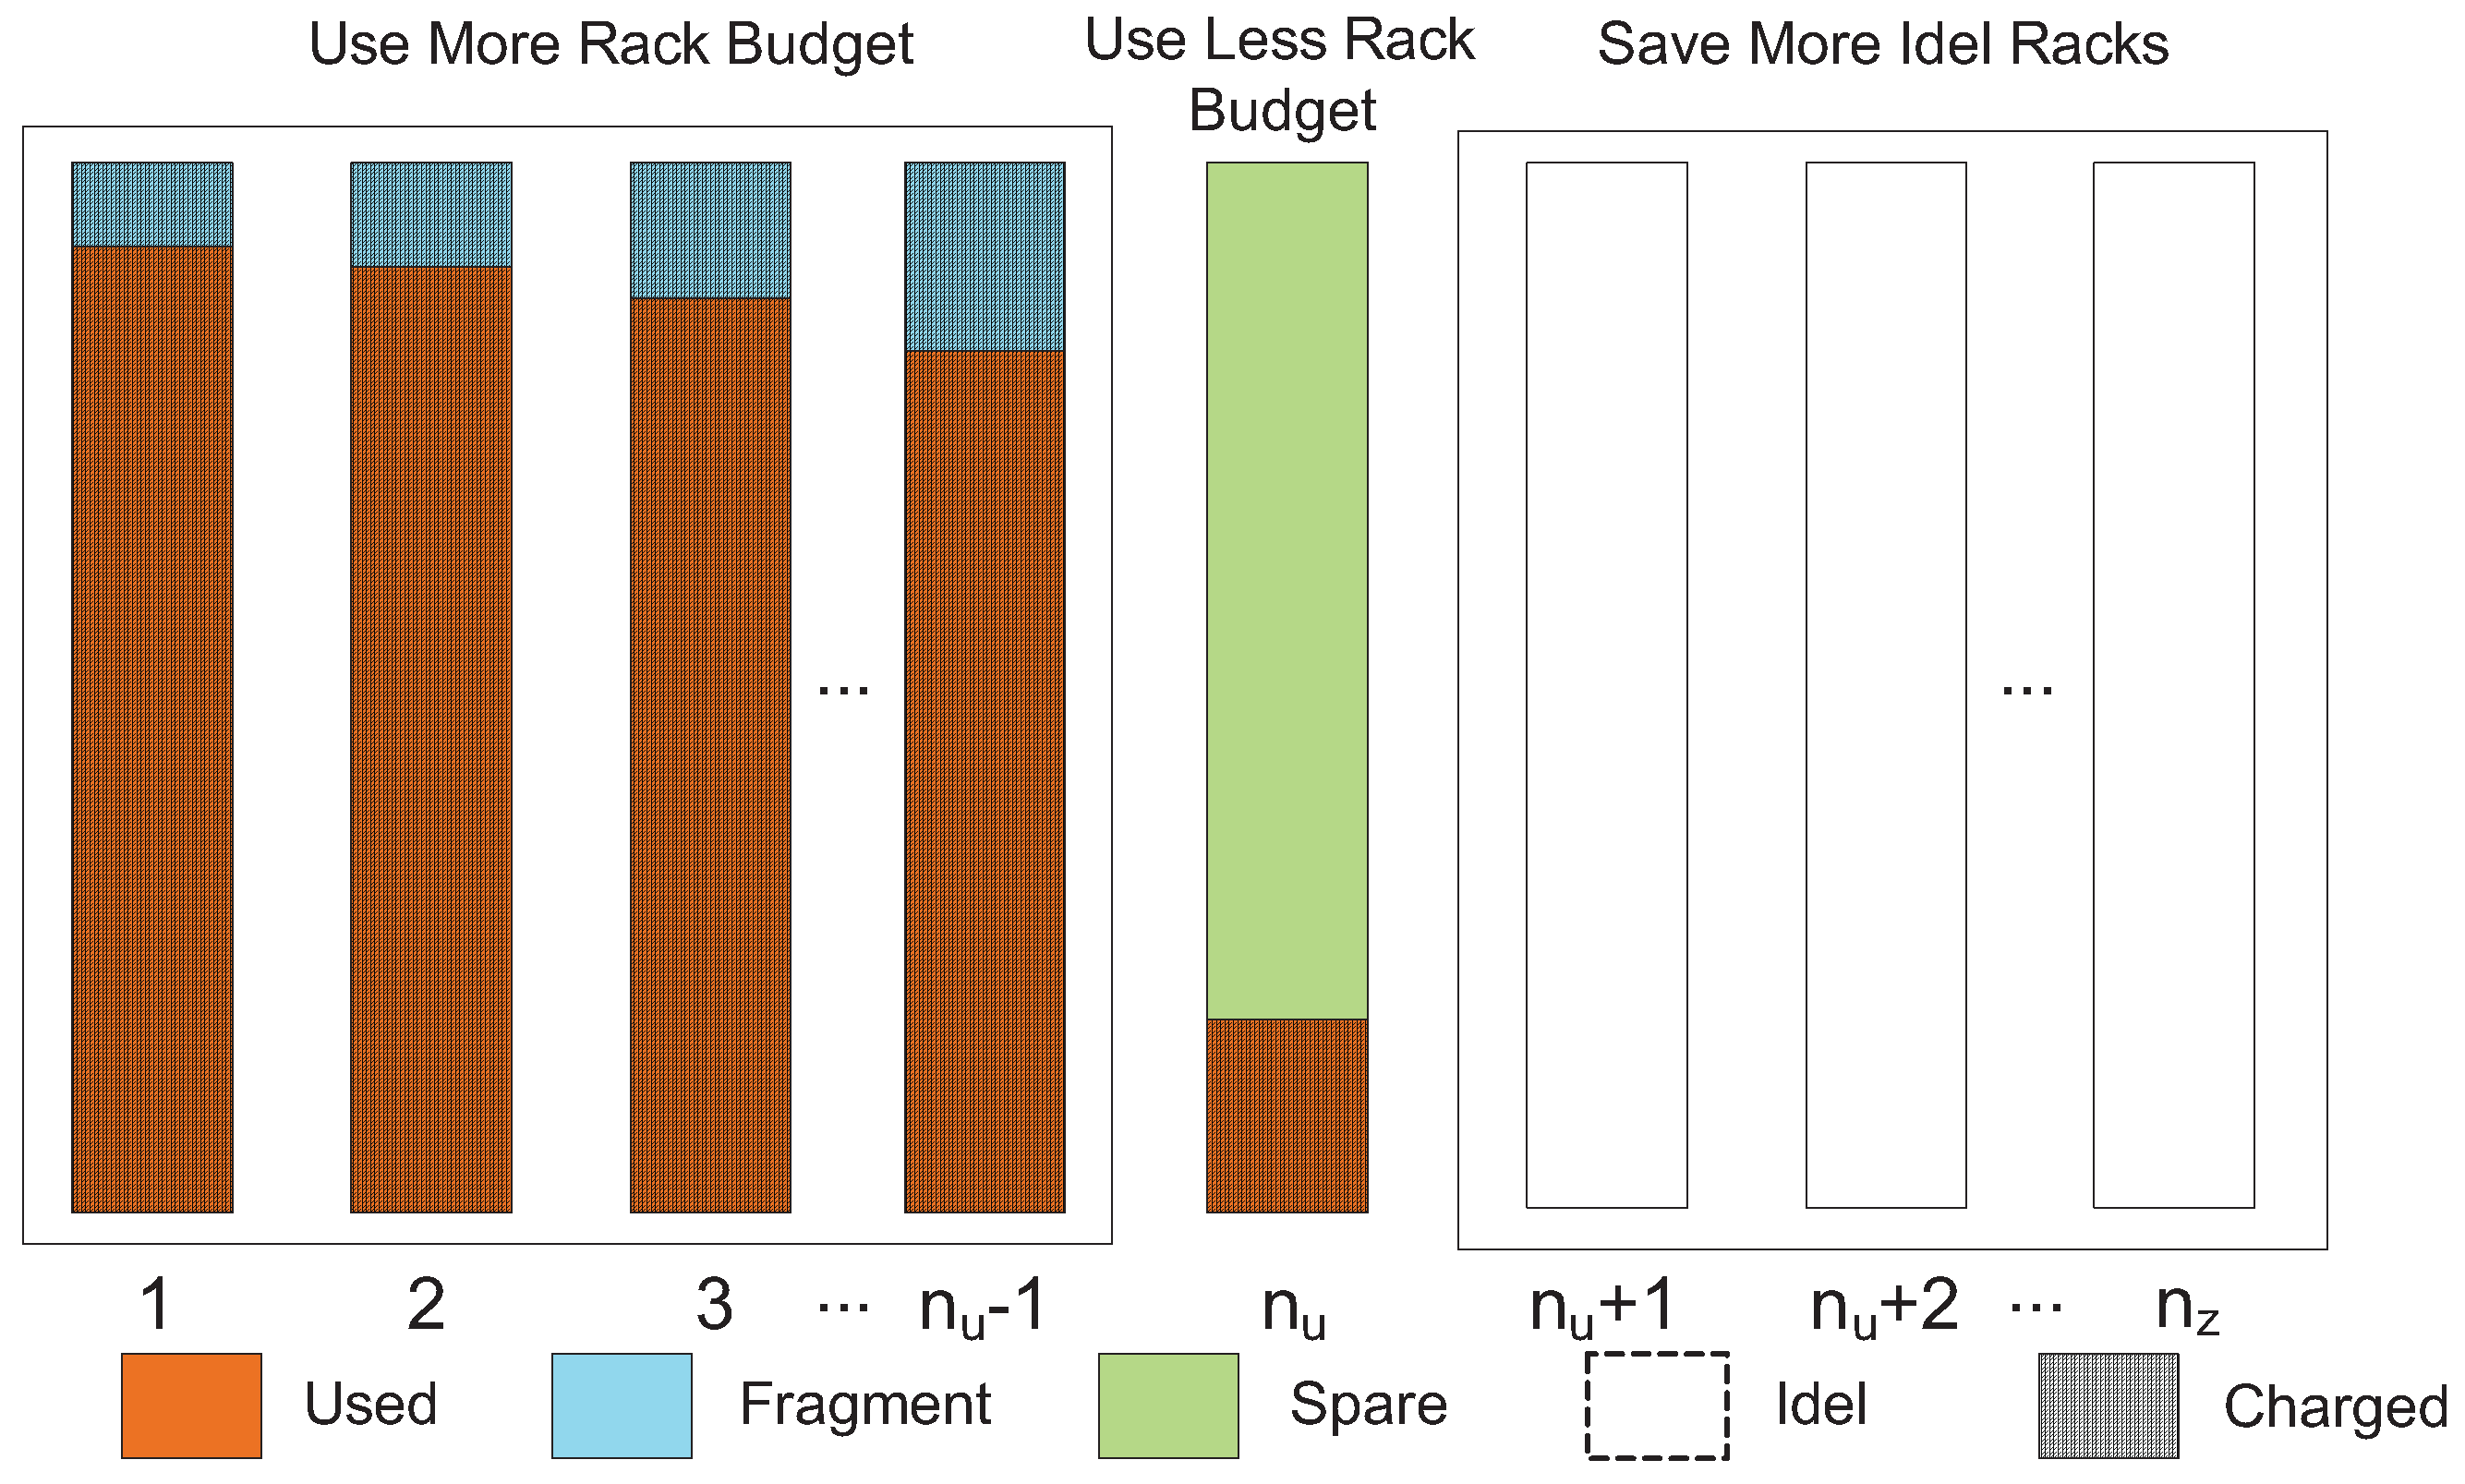
Suppose that there are servers and racks. As shown in Figure 3, a total of racks are used to accommodate all servers, where . All of these racks in use are ranked in an increasing order according to their remaining power that is not used. The first (− 1) racks are unable to accommodate more servers due to insufficient remaining power. The cost of each rack is the full leasing cost. The rack has the most remaining power, but there are no more servers to be racked. Thus, the cost of the rack is smaller than the full leasing cost as it can accommodate more servers. The dash area in Figure 3 represents all the rack space to be charged. An optimal server placement strategy is needed to minimize the leasing cost (), e.g., minimizing the power budget of the first (− 1) racks during deploying servers to save racks, and reducing the power consumption of the rack. Equation (7) is used to calculate the leasing cost of racks , where the sum of all servers’ power in the rack is assumed as :
4.2. The Scale of Server Placement Problem
All servers and racks in datacenter should be taken as input when solving the optimal server placement strategy . However, the simultaneous processing of all servers and racks cannot be achieved due to the following two reasons:
- the servers hosting the same or similar businesses are usually deployed in closer racks to reduce the expense of network. However, if the server placement strategy is implemented for all servers and racks, the servers with similar businesses may be deployed dispersedly in racks with long physical distance, resulting in huge communication expense.
- IDC is equipped with a huge number of servers and racks. Suppose and are the number of servers and racks, and the complexity of iteration for the optimal server placement strategy is . If all servers and racks are taken as the input of optimal server placement strategy, the scale of problem will be so large that the solving time will be very long and even the problem cannot be solved.
Therefore, in the production system, taking a region consisting of a certain number of servers and racks as the input of server placement strategy is necessary. It should be noted that the region must be racks with short physical distance and a set of servers running similar businesses, thus reducing the cost of server migration during deploying servers and the cost of communication. Here, we first need to figure out what the size of region suitable for server placement strategy is.
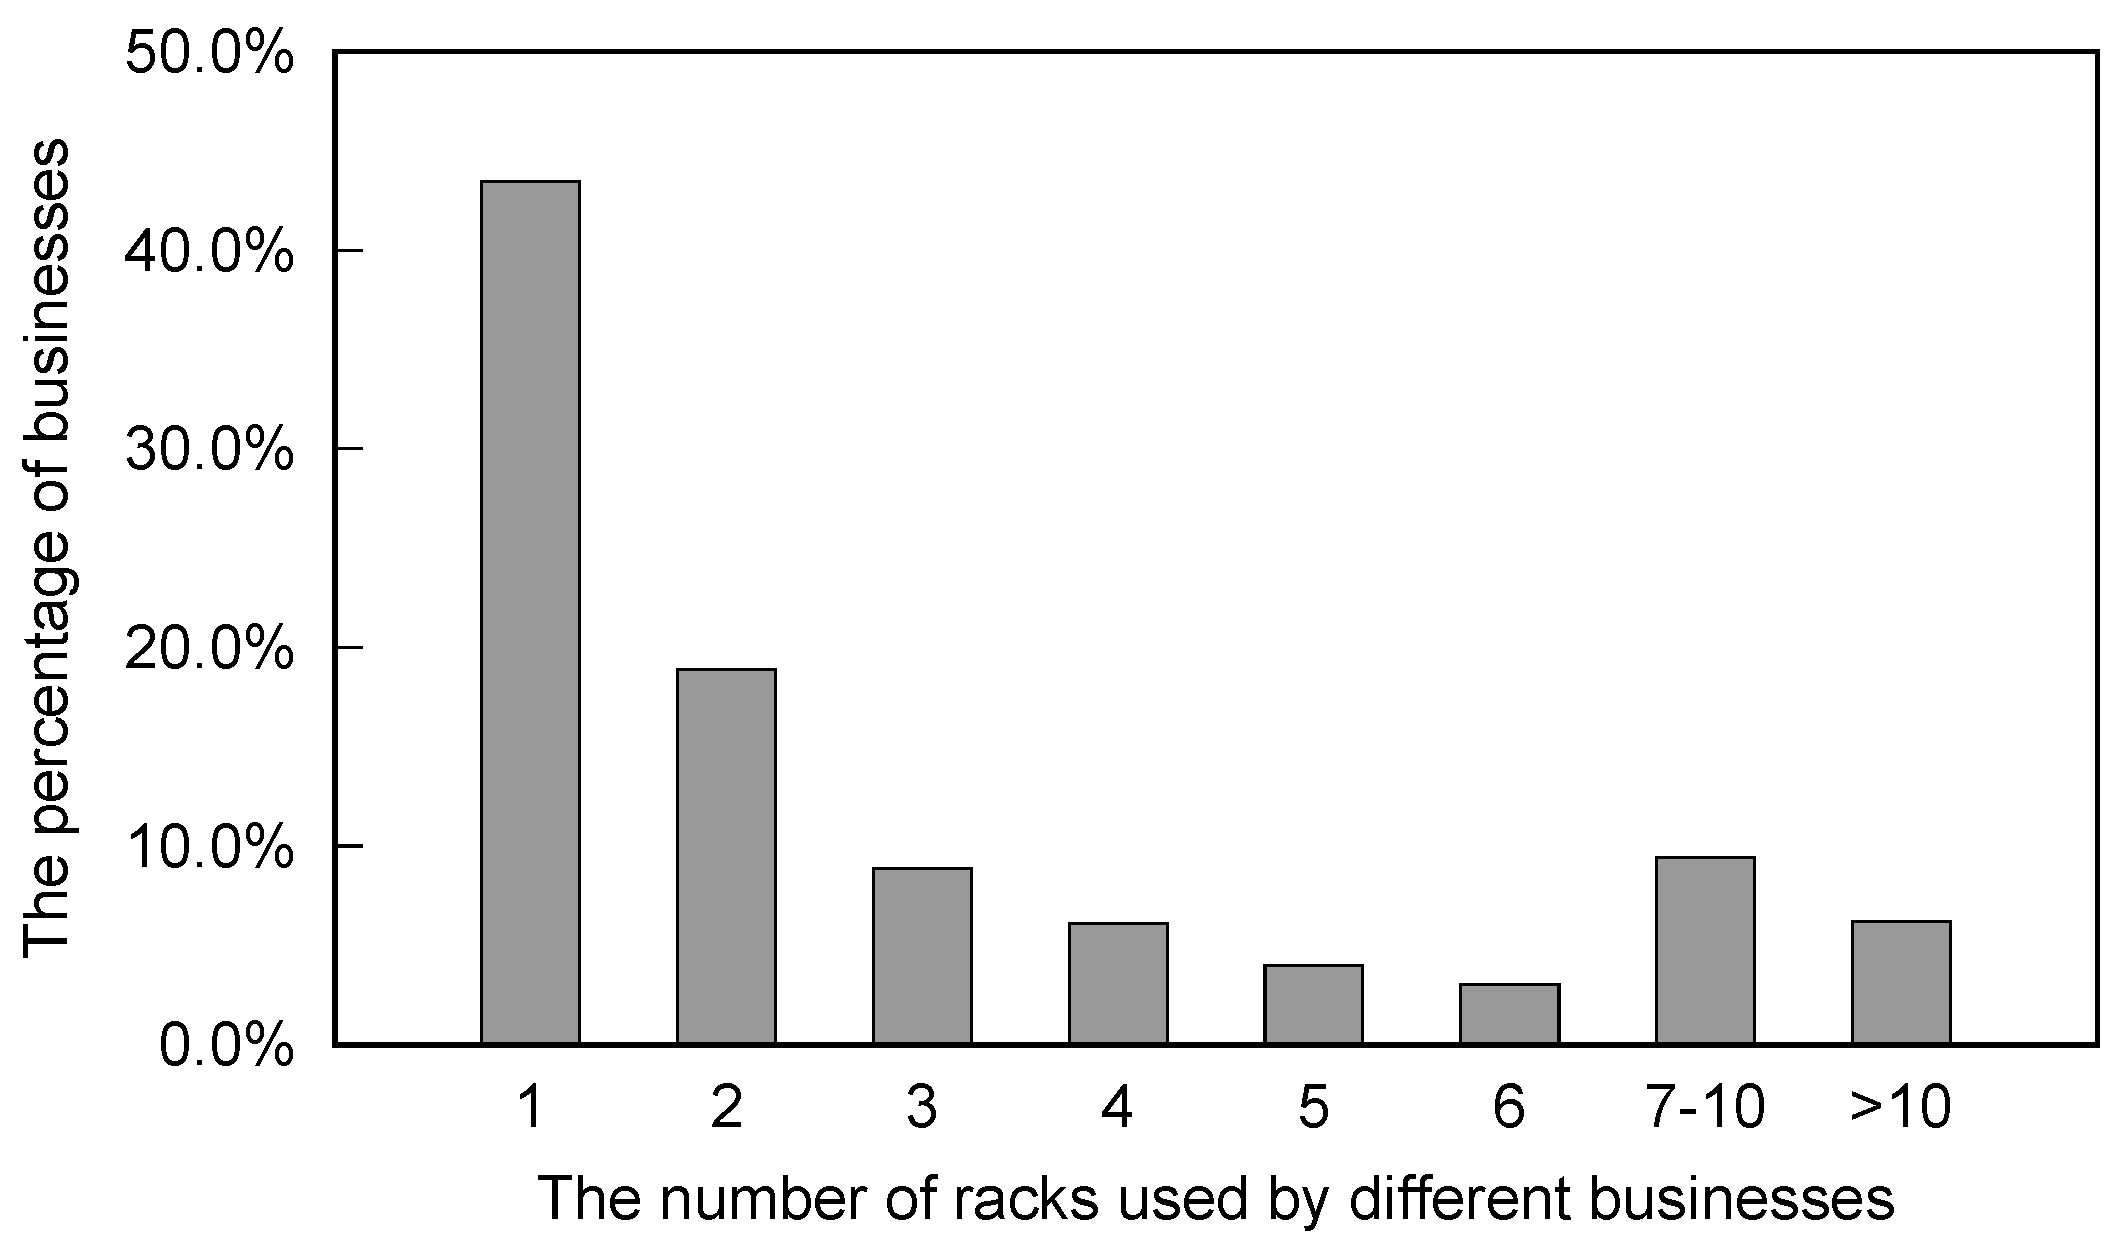
In the Tencent network, there are over 4700 kinds of businesses deployed in dedicated servers. The number of racks used by each business in one machine room are shown in Figure 4. The number of racks used by more than 90% businesses is within 10, and that used by over 80% businesses does not exceed 5. Therefore, when optimizing the original server placement strategy, an integer between 5 and 10 can be used as the number of racks , and the number of existing servers inside these racks can be used as .
4.3. Branch and Bound Based Algorithm
In order to address the problem discussed above, in this section, we propose a branch and bound based server placement algorithm. The algorithm proposed in this section is to search all possible server placement strategies. Since there exist servers, and each server can be stacked inside any of the racks, so the total number of possible strategies is . Among them, strategies with the lowest leasing cost are needed. In order to reduce the number of searches, the branch and bound approach is adopted in this algorithm to cut branches whose power exceeds the total rack power, as well as the current cost has exceeded the minimum cost. The variables and functions used in Algorithm 1 are described in Table 1.
As shown in Algorithm 1, the input contains all servers in and all racks in , the output is a set of optimal leasing cost strategies of mapping from servers to racks. Specifically, the core function is visit(), which is used to process servers one-by-one in . In lines 2–6, it iterates over all feasible strategies of current server in each rack, and if the server is allowed to be added to one rack, then turn to the next server. In line 7, it determines whether the arrangement of all servers is completed. In addition, in lines 8–11, it calculates the leasing cost and determines whether the arrangement of servers and racks is the optimal solution. In line 16, it accesses the result of optimal arrangement by calling the visit(0).
| Algorithm 1 The Branch and Bound Based Server Placement |
| Input: The servers in and racks in ; |
Output: The placement decision of servers to racks */
|
The proposed algorithm traverses all available arrangements, and it can get the optimal solution. Although it reduces the number of computations by using the branch and bound method, the computing cost rises exponentially. Specifically, the time complexity and the space complexity are both , where n is the number of servers.
4.4. Dynamic Programming Based Algorithm
To reduce computational complexity, we propose another algorithm according to the following idea: servers should be assigned to each rack as much as possible, so as to minimize the power fragment of each rack. How to install more servers into each rack can be abstracted as a 0–1 Knapsack problem. That is, each rack is regarded as a knapsack with the capacity of C, and C is equal to of the rack. Each server is regarded as an object with the value of V and weight of M, which are equal to the power threshold of server . Then, the problem is how to maximize V in each knapsack while ensuring the sum of objects’ M will not exceed C. Notably, although multiple racks can be regarded as multiple knapsacks, it is different from the Multidimensional Knapsack (MKP) problem [16]. Specifically, the MKP problem is to find a path to maximize the value of objects in all knapsacks. In addition, it does not apply to the case that not all knapsacks are needed for the optimal strategy.
The knapsack problem with gradually filling up each rack in this paper is more like a Stochastic Knapsack Problem (SKP). The number of knapsacks can be reduced if there are limited number of objects. The knapsack problem is a nondeterministic polynomial (NP) problem with overlapping sub-problems and optimal sub-structures. Thus, we can solve the problem by constructing a state transition equation and using the dynamic programming method. The state transition equation is constructed as follows:
Specifically, dp(i,) represents the largest power available for the to servers when the remaining rack power is . represents the power threshold of the server. In addition, represents the number of servers to be racked. The largest power available for the servers to be installed into a rack can be obtained by calling dp(0,).
The variables and functions used in Algorithm 2 are described in Table 2.
In this section, we take the server placement problem as a knapsack problem. The pseudo-code of the algorithm is shown in Algorithm 2. The core function of this algorithm, named as dp(), is the state transition equation based on dynamic programming, which represents the maximum power of all servers starting from the one when the remaining power of a rack is . In the algorithm, the searching result of the substructure is stored in set d, thus avoiding the repeated computing of overlapping sub-problems. In line 5, the algorithm judges whether d has a computing result; if so, it returns the result (line 6). In lines 8 and 9, recursive computations are performed, respectively, to judge whether stacking the server can maximize the rack’s utilized power and to determine the server arrangement. In lines 10–13, two strategies are compared to return the better one. In lines 17–20, the server arrangement with the optimal leasing cost is obtained through multiple callings of dp().
| Algorithm 2 The Dynamic Programming Based Server Placement |
| Input: Servers in and racks in ; |
Output: The placement decision from servers to racks */
|
The algorithm can provide the optimal server placement strategy for one rack in each computation. It belongs to the greedy algorithm achieving a local optimization for rack, so the final solution is an approximate optimal solution. Compared with the branch and bound algorithm, the solution of the algorithm proposed in this section is probably inferior to the global optimal solution, but it is much time-saving.
5. Experiment
5.1. Experimental Settings
In this section, an experimental platform equipped with an 8-core Intel Xeon Processor E5606 (2.13 GHz) (Santa Clara, CA, USA) is adopted to compare the server placement algorithms.
All of the dataset comes from Tencent IDC (Chengdu, China), which is the largest Internet Service Provider (ISP) in Asia. Using the Tencent Configuration Management Database (CMDB), five racks (No. 0301-B01 ∼ No. 0301-B05) and their 52 servers at Guanghua server room of China Telecom (Chengdu) are selected as the sample. The operating system of all servers is the Suse Linux Enterprise System 10 SP2 (64 bit) (Seattle, WA, USA). The number of servers with different models and the server arrangement on each rack are listed in Table 3. These five racks have the same hardware parameters and the same maximum power of 4048 W. The model “4 Nodes” takes four nodes as a rack unit, which cannot be split in the actual server placement process. In addition, we round up the power threshold to the next integer so as to simplify the computation.
5.2. Experiments Based on Real Data
In this section, is used to measure the leasing cost of a rack, and it can be calculated by Formula (7). First, the branch and bound based server placement algorithm is implemented and evaluated on the experiment platform. Since the time complexity is , where n is the number of servers, and the time spent to accomplish the optimal server arrangement is rather unreasonable.
Then, we adopt the dynamic programming based server placement algorithm () to obtain the solution of server placement. The leasing cost and rack utilization obtained by are compared with that of current server placement strategy from Tencent, and the experimental results are shown in Table 4. The current server placement strategy of Tencent is marked as “no mechanism”, and the leasing cost is 4.12 . Two groups of experiments are separately conducted at the modes with “no power capping” and “no performance loss”, and they both use our algorithm based on dynamic programming. Specifically, “no power capping” indicates that all servers took as , and “no performance loss” represents that the of servers is reduced to the level that would not cause performance loss through power capping.
Table 4 shows that the current server placement strategy with no mechanism on the power of server and rack has a very low utilization, and its leasing cost is about 1.7 times than that of the solution optimized by the proposed algorithm without power capping.
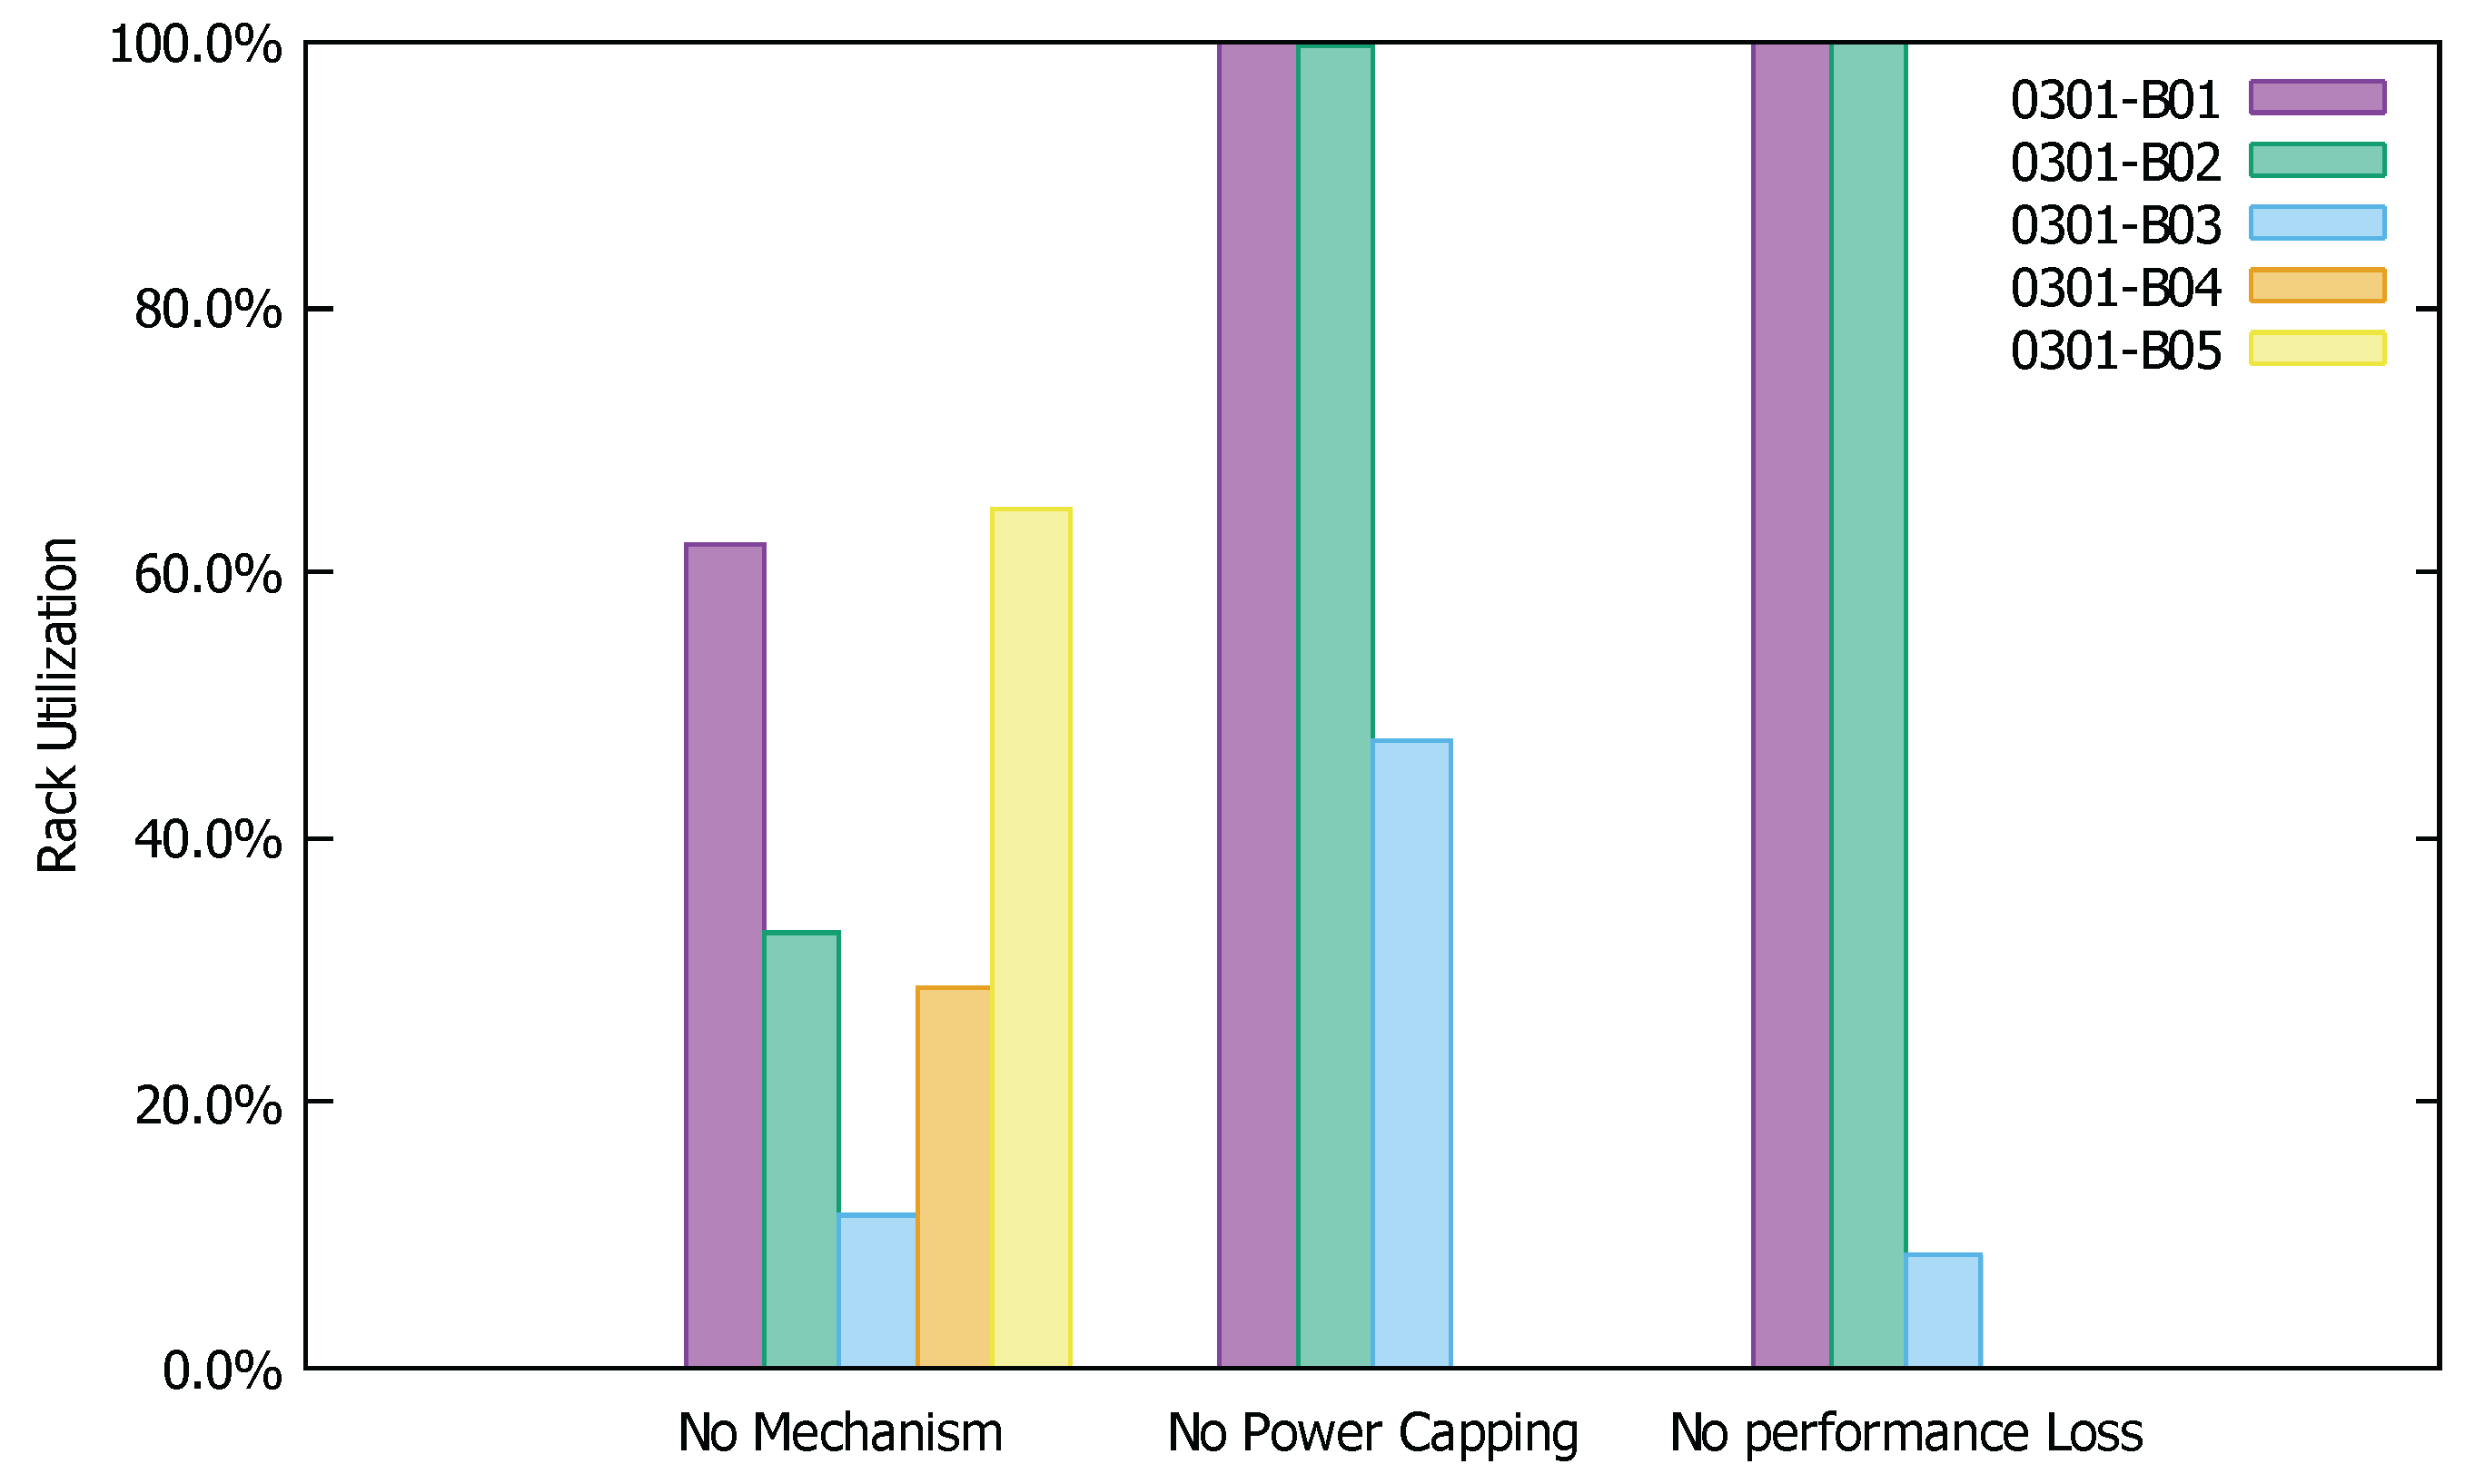
Figure 5 shows the power utilization of each rack at different server placement modes. When using no mechanism, the lowest power utilization of rack is only 11.6% and the highest one just reaches 64.9%. After adopting two solutions based on the algorithm proposed in this paper, the first racks (suppose there are racks in total) all reach or approach the power utilization of 100%. Therefore, our algorithm is capable of fully reducing the rack fragment to enhance the overall rack utilization. Through experimental results, it can be seen that the leasing cost can be substantially saved by implementing power capping and server arrangement based on our algorithm for the racks and servers in the Tencent server room. In addition, as for different levels of power capping, our algorithm can provide approximately optimal solutions corresponding to different leasing costs.
5.3. Experiment Based on Synthetic Data
In this section, we use synthetic data containing 512 racks (rack1-rack512) and 16,384 servers (server1-server16384) to evaluate the performance of the proposed algorithm and classical algorithms. Each rack has the same power (i.e., 5120 W). The power of each server is between 100 W and 160 W, which is generated by calling random.randint(100, 160) of Python. In order to verify the performance of the proposed algorithm, we compare it with three classical methods: bestfit algorithm (Bestfit), worstfit algorithm (Worstfit), and random algorithm (Random). The experimental results are shown in Table 5. In addition, we can see that:
- the proposed method is superior to the other three methods. Specifically, the proposed method used 417 machines, which is less than the number of machines used by the Bestfit method (425), the Worstfit method (422), and the Random method (423). That is, under the same conditions, the proposed method has greater flexibility to put more servers on the rack;
- the data in the fourth column also show that the proposed method has the best stability since its standard deviation of used power by racks is the lowest one among these methods.
6. Conclusions
We propose that reducing power fragment of racks can help ISPs save their leasing cost in IDC. In addition, it inspires us to introduce a server placement algorithm that can solve the optimal server arrangement in racks in a short time. The experiments on the data of racks and servers in Tencent indicates that our proposed algorithm is able to reduce over half of the original leasing cost. In this paper, we assume that the rack power budget is equal to its rated power and they cannot be adjusted. In fact, we find that the actual power supply of rack may be higher than its rated power. In addition, a coefficient is recommended to be set for the rated power of rack to increase the rack power budget appropriately, which is one of our future work.
Acknowledgments
This work is supported by the Anhui Natural Science Foundation of China under Grant No. 1608085QF147, the Key Project of Support Program for Excellent Youth Scholars in Colleges and Universities of Anhui Province (No. gxyqZD2016332) and Key Project of Anhui University Science Research (No. KJ2017A418).
Author Contributions
Haibao Chen, Yuyan Zhao and Chuxiong Yan conceived and designed the experiments; Chuxiong Yan performed the experiments and analyzed the data; and Haibao Chen and Yuyan Zhao wrote the paper.
Conflicts of Interest
The authors declare no conflict of interest.
References
- Tencent Corporation. Available online: http://www.tencent.com/ (accessed on 5 May 2017).
- Equinix. Available online: http://www.equinix.com/ (accessed on 5 May 2017).
- Ganesh, L.; Weatherspoon, H.; Marian, T.; Birman, K. Integrated approach to data center power management. IEEE Trans. Comput. 2013, 62, 1086–1096. [Google Scholar] [CrossRef]
- Yao, Y.; Huang, L.; Sharma, A.; Golubchik, L.; Neely, M. Data centers power reduction: A two time scale approach for delay tolerant workloads. In Proceedings of the INFOCOM, Orlando, FL, USA, 25–30 March 2012; IEEE: New York, NY, USA, 2012; pp. 1431–1439. [Google Scholar]
- Zhou, Z.; Liu, F.; Jin, H.; Li, B.; Li, B.; Jiang, H. On arbitrating the power-performance tradeoff in saas clouds. In Proceedings of the INFOCOM, Turin, Italy, 14–19 April 2013; IEEE: New York, NY, USA, 2013; pp. 872–880. [Google Scholar]
- Mars, J.; Tang, L.; Hundt, R.; Skadron, K.; Soffa, M.L. Bubble-up: Increasing utilization in modern warehouse scale computers via sensible co-locations. In Proceedings of the MICRO, Alegre, Brazil, 3–7 December 2011; ACM: New York, NY, USA, 2011; pp. 248–259. [Google Scholar]
- Tang, L.; Mars, J.; Soffa, M.L. Compiling for niceness: Mitigating contention for qos in warehouse scale computers. In Proceedings of the CGO, San Jose, CA, USA, 31 March–4 April 2012; ACM: New York, NY, USA, 2012; pp. 1–12. [Google Scholar]
- Meisner, D.; Sadler, C.M.; Barroso, L.A.; Weber, W.-D.; Wenisch, T.F. Power management of online data-intensive services. In Proceedings of the ISCA, San Jose, CA, USA, 4–8 June 2011; IEEE: New York, NY, USA, 2011; pp. 319–330. [Google Scholar]
- Fan, X.; Weber, W.; Barroso, L.A. Power provisioning for a warehouse-sized computer. In Proceedings of the ISCA, San Diego, CA, USA, 9–13 June 2007; ACM: New York, NY, USA, 2007; Volume 35, pp. 13–23. [Google Scholar]
- Raghavendra, R.; Ranganathan, P.; Talwar, V.; Wang, Z.; Zhu, X. No power struggles: Coordinated multi-level power management for the data center. In Proceedings of the ASPLOS, Seattle, WA, USA, 1–5 March 2008; ACM: New York, NY, USA, 2008; Volume 36, pp. 48–59. [Google Scholar]
- Wang, X.; Chen, M. Cluster-level feedback power control for performance optimization. In Proceedings of the HPCA, Salt Lake City, UT, USA, 16–20 February 2008; IEEE: New York, NY, USA, 2008; pp. 101–110. [Google Scholar]
- Ranganathan, P.; Leech, P.; Irwin, D.; Chase, J. Ensemble-level power management for dense blade servers. In Proceedings of the ISCA, Boston, MA, USA, 17–21 June 2006; IEEE Computer Society: New York, NY, USA, 2006; Volume 34, pp. 66–77. [Google Scholar]
- Wu, S.; Yan, C.; Chen, H.; Jin, H.; Guo, W.; Wang, Z.; Zou, D. Evaluating latency-sensitive applications: Performance degradation in datacenters with restricted power budget. In Proceedings of the 2015 44th International Conference on Parallel Processing (ICPP), Beijing, China, 1–4 September 2015; IEEE: New York, NY, USA, 2015; pp. 639–648. [Google Scholar]
- Delimitrou, C.; Kozyrakis, C. Paragon: Qos-aware scheduling for heterogeneous datacenters. In Proceedings of the Eighteenth International Conference on Architectural Support for Programming Languages and Operating Systems (ASPLOS), Houston, TX, USA, 16–20 March 2013. [Google Scholar]
- Gandhi, A.; Harchol-Balter, M.; Das, R.; Lefurgy, C. Optimal power allocation in server farms. In Proceedings of the SIGMETRICS, Seattle, WA, USA, 15–19 June 2009; ACM: New York, NY, USA, 2009; Volume 37, pp. 157–168. [Google Scholar]
- Martello, S.; Toth, P. Knapsack Problems: Algorithms and Computer Implementations; John Wiley & Sons, Inc.: Hoboken, NJ, USA, 1990. [Google Scholar]
- Meisner, D.; Gold, B.T.; Wenisch, T.F. Powernap: Eliminating server idle power. In Proceedings of the 14th International Conference on Architectural Support for Programming Languages and Operating Systems (ASPLOS), Washington, DC, USA, 7–11 March 2009; ACM: New York, NY, USA, 2009. [Google Scholar]
- Pelley, S.; Meisner, D.; Zandevakili, P.; Wenisch, T.; Underwood, J. Power routing: Dynamic power provisioning in the data center. In Proceedings of the 14th International Conference on Architectural Support for Programming Languages and Operating Systems (ASPLOS), Washington, DC, USA, 7–11 March 2009; ACM: New York, NY, USA, 2009. [Google Scholar]
Figure 1.
Power margin. (a) Server’s power demand; (b) Setting power budget at power rating.

Figure 2.
A scenario of server placement. (a) the power budget of a rack; (b) the server budget in a rack; (c) the used power and server margin in a rack.
Figure 2.
A scenario of server placement. (a) the power budget of a rack; (b) the server budget in a rack; (c) the used power and server margin in a rack.

Figure 3.
Model of the IDC’s leasing cost.

Figure 4.
The percentages of businesses using different number of racks.

Figure 5.
Rack utilization with different methods.

Table 1.
Variables and functions in Algorithm 1.
| Variables and Functions | Description |
|---|---|
| A list containing all servers needed to be handled | |
| A list containing all racks | |
| A list containing all mapping from servers to racks obtained by running algorithm | |
| visit(i) | A function determining which rack is used to host server i |
| The minimum cost |
Table 2.
Variables and functions in Algorithm 2.
| Variables and Functions | Description |
|---|---|
| dp() | The core function based on dynamic programming |
| The remaining power of a rack | |
| The power of a server | |
| i | The server |
Table 3.
Information about servers and racks.
| Rack | Utilization | Model | Quantity | Power Rating |
|---|---|---|---|---|
| 0301-B01 | 62.2% | DELL DCS6100 | 16(4 Nodes) | 629/4 |
| 0301-B02 | 33% | DELL DCS6100 | 4(4 Nodes) | 629/4 |
| HUAWEI XH320 | 4(4 Nodes) | 707.7/4 | ||
| 0301-B03 | 11.6% | IBM X3650M3 | 2 | 234.2 |
| 0301-B04 | 28.6% | HUAWEI RH2285 | 1 | 216.7 |
| DELL FS12-TY | 5 | 188 | ||
| IBM X3650M3 | 7 | 234.2 | ||
| 0301-B05 | 64.9% | DELL FS12-TY | 9 | 188 |
| IBM X3650M3 | 4 | 234.2 |
Table 4.
The leasing costs with different modes.
| Mode | Num. of Used Racks | Leasing Cost (Unit: ) |
|---|---|---|
| No mechanism | 5 | 4.12 |
| No power capping | 3 | 2.47 |
| No performance loss | 3 | 2.09 |
Table 5.
The comparison of different methods.
| Methods | Num. of Used Racks | Avg. Used Power of Racks | Std. Dev. Used Power of Racks |
|---|---|---|---|
| Proposed method | 417 | 5115.628 | 8.722438 |
| Bestfit method | 425 | 5019.334 | 46.89323 |
| Worstfit method | 422 | 5055.017 | 36.54645 |
| Random method | 423 | 5043.066 | 46.3167 |
© 2017 by the authors. Licensee MDPI, Basel, Switzerland. This article is an open access article distributed under the terms and conditions of the Creative Commons Attribution (CC BY) license (http://creativecommons.org/licenses/by/4.0/).
Share and Cite
MDPI and ACS Style
Chen, H.; Zhao, Y.; Yan, C. Towards Rack Utilization in Internet Datacenters: An Approach Based on Dynamic Programming. Future Internet 2017, 9, 17. https://doi.org/10.3390/fi9020017
AMA Style
Chen H, Zhao Y, Yan C. Towards Rack Utilization in Internet Datacenters: An Approach Based on Dynamic Programming. Future Internet. 2017; 9(2):17. https://doi.org/10.3390/fi9020017
Chicago/Turabian StyleChen, Haibao, Yuyan Zhao, and Chuxiong Yan. 2017. "Towards Rack Utilization in Internet Datacenters: An Approach Based on Dynamic Programming" Future Internet 9, no. 2: 17. https://doi.org/10.3390/fi9020017
Note that from the first issue of 2016, this journal uses article numbers instead of page numbers. See further details here.