Visual Interface Evaluation for Wearables Datasets: Predicting the Subjective Augmented Vision Image QoE and QoS


Department of Computer Science, Central Michigan University, Mount Pleasant, MI 48859, USA
*
Author to whom correspondence should be addressed.
Future Internet 2017, 9(3), 40; https://doi.org/10.3390/fi9030040
Submission received: 30 June 2017
/
Revised: 17 July 2017
/
Accepted: 24 July 2017
/
Published: 28 July 2017
Abstract
:As Augmented Reality (AR) applications become commonplace, the determination of a device operator’s subjective Quality of Experience (QoE) in addition to objective Quality of Service (QoS) metrics gains importance. Human subject experimentation is common for QoE relationship determinations due to the subjective nature of the QoE. In AR scenarios, the overlay of displayed content with the real world adds to the complexity. We employ Electroencephalography (EEG) measurements as the solution to the inherent subjectivity and situationality of AR content display overlaid with the real world. Specifically, we evaluate prediction performance for traditional image display (AR) and spherical/immersive image display (SAR) for the QoE and underlying QoS levels. Our approach utilizing a four-position EEG wearable achieves high levels of accuracy. Our detailed evaluation of the available data indicates that less sensors would perform almost as well and could be integrated into future wearable devices. Additionally, we make our Visual Interface Evaluation for Wearables (VIEW) datasets from human subject experimentation publicly available and describe their utilization.
1. Introduction
Increasingly, wearable media display devices, such as for Virtual Reality (VR) and Augmented Reality (AR) services, become sources for media consumption in industrial and consumer scenarios. Typically, these devices perform binocular vision augmentation and content presentation, and initial interest is emerging for directly comparing the two approaches in immersive contexts [1]. For AR applications in particular, content is commonly displayed to provide context-dependent information. The goal is to positively modify human performance, e.g., for driving tasks [2], in the context of medical procedures [3,4] or for educational purposes [5]. The delivery of context-dependent network-delivered content to devices in near real time, however, represents a challenge and requires new paradigm considerations [6]. Facilitating the content distribution to these device types can follow multiple approaches, such as direct wired or wireless connectivity or proxification with cellular connected mobile phones [7]. In either scenario, a trade-off exists between the amount of compressed media data and the possible quality that can be attained for presentation. While past research and implementation efforts were generally directed at objective metrics, typically summarized as Quality of Service (QoS), the subjective Quality of Experience (QoE) has become popular in the determination of overall service quality [8]. In turn, network and service providers have an interest in optimizing the quality-data relationship for their offerings by taking the user’s experience as QoE into account. This approach to the valuation of predominantly mobile services is beginning to attract interest in AR scenarios [9].
The QoE, however, is commonly derived from human subject experimentations, whereby participants rate their experience on a Likert-type scale from worst to best. The individual ratings are subsequently aggregated and expressed in terms of Mean Opinion Scores (MOS); see, e.g., [10,11]. This subjective rating approach, in turn, is based on cognitive and emotional states at the time of experimentation and combines with the actual delivery of the service under evaluation. Human subject experimentation, however, is not easily undertaken and commonly requires approved procedures and more experimental effort than computer-driven experiments or simulations [12]. The MOS approach furthermore averages the individual dependencies to derive an overall applicable relationship between the underlying service delivery and user experiences in general. An additional downside to this approach is, thus, the loss of the finer-grained subjective dependencies.
The subjective nature of quality considerations has led to several objective image quality metrics that approximate the QoE through various features; see, e.g., [13]. Strides were made that combine the QoS and the QoE in a generalized quantitative relationship to facilitate their determination; see, e.g., [14,15]. The main goal of these efforts is to exploit the underlying common media compression and impairment metrics (QoS) that are readily obtainable in order to closely approximate the subjective experience (QoE). This approach enables easier experiment replication and practical implementation.
1.1. Related Works
The shift to wearable content consumption in AR scenarios requires new considerations of environmental factors, as well as the equipment under consideration; see, e.g., [16]. Common device types perform either monocular [17] or binocular [18] vision augmentation by presenting content to the device operator; see, e.g., [19] for an overview. As operator performance augmentation is typically the goal behind AR content display, evaluations such as in [20,21,22] showcase issues for the various system types. Perceptual issues for these content presentation approaches have been evaluated in the past, as well, such as for item segmentation [23], depth perception [24], contrast and color perception [25] or the field-of-view [26]. In our own prior research, we investigated the differences between the traditional opaque and transparent augmented reality scenarios for media presentation [27]. Employing neural models to aid in image quality assessment has attracted recent research efforts, as well; see, e.g., [28].
The combination of the perceptual nature of real-world overlaid content display in AR scenarios with considerations for the QoE of device operators points to the importance of underlying psycho-physiological aspects. In past research efforts, media quality was evaluated in the context of cognitive processes [29]. Electroencephalography (EEG) measurements, in turn, could be exploited for the determination or prediction of the QoE. The potential for a direct measurement [30] has successfully been exploited in traditional settings; see, e.g., [29,31,32]. Typically, EEG measurements at 300–500 ms after the stimulus, such as media display or quality changes, are utilized, with potential drawbacks [33]. In typical Brain-Computer Interface (BCI) research approaches, larger numbers of wet electrodes are utilized in human subject experimentation within clinical settings. For more practical considerations, commercially-available consumer-grade hardware can be employed in the experimentation and data gathering. However, other physiological signals could be employed, as well, as examples for skin conductivity or heart rate show promise [34].
The consumer-grade devices that have emerged in recent years typically employ dry EEG electrodes at a limited number of placements on a subject’s head to gather information. Our initial investigations [35,36] point towards the opportunity to exploit this setup to perform individual QoE determinations and predictions. Jointly with the commonly head-worn binocular vision-augmenting devices, a new opportunity in determining the QoE of device operators emerges. Specifically, small modifications of current AR devices could provide real-time or close to real-time EEG measurements that provide service providers with feedback for service improvement.
1.2. Contribution and Article Structure
Throughout this paper, we employ commercially-available off-the-shelf equipment in a non-clinical setting to determine the user-specific QoE in binocular vision augmentation scenarios. Our approach resembles a practical conceptualization towards real-world implementations. The main contributions we describe in this paper are:
- A performance evaluation of predicting the QoE of individual human subjects in overall vision augmentation (augmented reality) settings based on EEG measurements,
- An evaluation of how these data can be employed in future wearable device iterations through evaluations of potential complexity reductions and
- A publicly-available dataset of human subject quality ratings at different media impairment levels with accompanying EEG measurements.
The remainder of this paper is structured as follows. In the succeeding section, we review our general approach and methodology before presenting the underlying datasets in Section 3. We subsequently discuss the utilization of the datasets in an exemplary evaluation in Section 4 and describe the obtained results in Section 5 before we conclude in Section 6.
2. Methodology
In this section, we highlight the generation of the dataset through experimentation before describing it in greater detail in Section 3. The general configuration for our experiments was previously described in [16,27,35,36]. Overall, we follow the generation to evaluation process illustrated in Figure 1, noting that the prediction performance evaluation results are presented last for readability.
Human subjects were initially introduced to the experiment and overall system utilization. All subjects gave their informed consent for inclusion before they participated in the experiments. The study was conducted in accordance with the Declaration of Helsinki, and the protocol was approved by the Institutional Review Board of Central Michigan University (Central Michigan University Institutional Review Board #568993).
The participants wore a commercial-grade head-mounted binocular vision augmentation device and a commercial-grade EEG headband, both available off-the-shelf. Specifically, we employ the Epson Moverio BT-200 mobile viewer, which consists of a wearable head-mounted display unit and a processing unit that utilizes the Android Operating System. The display is wired to receive the video signals and power from the processing unit and has a resolution of 960 by 540 pixels with Light Emitting Diode (LED) light sources and a 23-degree Field Of View (FOV). The display reproduces colors at 24-bit depth at 60 Hz with 70% transparency. The real-world backdrop is a small meeting/classroom with participants facing a whiteboard initially. The room was dim, with the main light source coming from shaded windows to the side, as in prior works.
The subjects (or users) u had 15 s of media viewing time ranging from to , whereby we denote the image as i and the impairment level as l. The presentation was followed by an unrestricted quality rating period. During the rating period, subjects were asked to rate the previously-observed media quality on a five-point Likert scale. After a short gray screen period, the next image was presented. Overall, our approach follows the Absolute Category Rating with Hidden Reference (ACR-HR) approach according to the International Telecommunication Union -Telecommunication Standardization Sector (ITU-T) P.910 [37], i.e., we include the original image in the evaluation as additional reference. The result is the subject’s quality of experience for this particular presentation, denoted as .
We currently consider two different content scenarios, namely (i) traditional image display ( which we denote as AR) and (ii) spherical (immersive) image display ( which we denote as SAR). The images selected for the traditional image display condition were obtained from the Tampere Image Database from 2013 (TID2013) for reference [38], and initial findings were described in [27,36]. Specifically, we included the JPEG compression distortion in our evaluations and the resultant dataset for the AR condition, with the reference images illustrated in Figure 2.
Images selected for the spherical image display (SAR) condition were derived by applying different levels of JPEG compression to the source images, mimicking the impairments of the regular images. The selected spherical source images are from the Adobe Stock images library, which represent studio-quality images as a baseline. We illustrate these spherical images for reference in Figure 3.
The simultaneously-captured EEG data for TP9, Fp1, Fp2 and TP10 positions (denoted as positions p, }, respectively) were at 10 Hz and provided several EEG band data points:
- Low at 2.5–6.1 Hz,
- Delta at 1–4 Hz,
- Theta at 4–8 Hz,
- Alpha at 7.5–13 Hz,
- Beta at 13–30 Hz, and
- Gamma at 30–44 Hz.
We employ the Interaxon MUSE EEG head band, obtaining the EEG data directly through the device’s software development kit (SDK). For each of the subjects, we captured the data during the entire experimentation session time , which included time before and after the actual media presentation. The EEG headband was connected via Bluetooth to a laptop where the data were stored. Similarly, the viewer device was connected to the laptop, as well, and communicated using a dedicated wireless network to send images and commands to the device and obtain subject ratings. The introduced communications delay is minimal and provides a more realistic environment for real-world implementation considerations. We make our gathered data publicly available as described in the following section.
3. Visual Interface Evaluation for Wearables Datasets
We employ the overall approach described in Section 2 to generate two Visual Interface Evaluation for Wearables (VIEW) datasets for traditional (AR-VIEW) and spherical (SAR-VIEW) content presentation, respectively. Each dataset contains the outcomes of 15 IRB-approved human subject experiments employing consumer-grade off-the-shelf equipment. The AR-VIEW dataset covers the illustrated seven images and contains 42 individual ratings (one for each QoS level) for each of the 15 subjects. The SAR-VIEW dataset contains the six evaluated spherical images at each QoS level, for a total of 36 individual subject ratings. Accompanying these individual QoS/QoE data are the time-stamped EEG measurements for the individual subjects’ session. We make these datasets publicly available at [39,40] as a reference source and to aid research in this domain. Each dataset is stored as the widely-supported SQLite [41] database file for convenience and portability purposes.
3.1. Dataset Description
The data contained in the individual AR-VIEW and SAR-VIEW databases are structured as follows. For each participating anonymized subject, we provide two tables in the database file that contain the data gathered for that specific user u, separated into QoS levels and QoE ratings, as well as EEG data. The AR-VIEW database contains subjects , while the SAR-VIEW database contains subjects . The ratings table (with the schema overview in Table 1) for each subject contains (i) the timestamps for media presentation start and end; (ii) the images and file names; (iii) the impairment levels l, ranging from 0 (original source image) to 5 (highest impairment); and (iv) the subject’s Likert-type scale rating ranging from 1 (lowest) to 5 (highest). We note that the impairment level is inversely related to the alternatively utilized image quality level q, which can readily be converted as (where 6 would represent the original image quality level).
The EEG table (with the schema provided in Table 2) for each subject contains the timestamp of EEG measurements and the values for the individual EEG bands measured at the four positions (in order TP9, Fp1, Fp2, TP10).
The original EEG values represent the logarithm of the sum of the power spectral density of the EEG data and are provided by the device’s SDK (software development kit). We converted the log scale values back to regular values as before storing them in the dataset.
3.2. Dataset Utilization
For a comparison of the ratings between the user-specific QoE ratings in dependence of the QoS level, one can derive the ratings data for each user as a direct query in SQL as SELECT image,level,rating FROM Subject_{u}_ratings and the EEG data in a similar fashion. We provide an example using Python in Listing 1 that showcases the interface to the database to extract the information for Subject 0 into a data frame (employing the popular Pandas package).
The separate table column names are directly mapped to the individual frequency bands as described in Table 2 and demonstrated in Listing 1. Employing this approach allows one to immediately interface with the data contained in the dataset for further analysis.

4. Data Preparation and Evaluation
We now employ the VIEW datasets in an exemplary evaluation, following the general process illustrated in Figure 1. We utilize machine learning approaches to predict the individual subject QoE ratings for different impairment levels in AR and SAR configurations. Similarly, we employ the same mechanisms to predict the QoS (compression) level. In our prior works (see [35]), we found that a direct assessment of EEG potentials yielded low correlations between predictions based on machine learning approaches and actual subject ratings for image quality levels. In turn, we initially perform a normalization of the complete captured EEG session data based on z-scores for each EEG band and position. The z-score expresses the individual measurement points as divergences from the overall session average in multiples of the overall session standard deviation. Let denote an individual position’s single EEG channel (e.g., ) average and standard deviation value, respectively. The z-score for a measurement value at time t is determined as:
Following the findings outlined in, e.g., [29], the image display as the stimulus evokes EEG potentials. These potentials commonly trail the stimulus between 300 and 500 ms and can be utilized in the determination of the QoE for an individual subject. In our evaluations, we employ a slightly different approach, considering the averaged EEG readings from the time of the stimulus to 500 ms afterwards, i.e., we consider ms. We are motivated to utilize this approach within our general non-clinical configuration, which is in contrast to most other conducted studies and more aligned with practical implementation considerations. In turn, we consider in our evaluation the averaged EEG position’s channel z-scores during the first 500 ms of a media presentation for a subject , determined as:
We employ this pre-processed data in the modeling and prediction of individual user ratings (to predict QoE) and set the image impairment level (to relate to QoS) as follows. Due to the categorical nature of the Likert-type scale, logistic regression is employed on either all or a subset of EEG sensor position data. Additionally, we consider a practical approach that evaluates the possibility of reducing the four EEG sensor positions to the sides, center or individual sensor placements on one of the four positions p for which the dataset contains measurements. Specifically, we employ and in these scenarios as follows:
- All:
- Outside:
- Inside:
- Left:
- Right:
- Individual: , , and
In turn, we denote the combination of all of the individual channels at the respective scenario positions for a specific user’s presentation as . We additionally note that we consider the second degree () polynomial extension of the original values throughout our prediction efforts, based on our prior findings in [35].
The logistic regression is performed on a random training and subset of data points (80/20 split), whereby we denote the total number of samples constituting the testing subset as s. Each data point represents a specific user’s rating for a specific impairment level combined with the averaged z-score for the 500-ms time period cut-off we consider throughout, i.e., represents . The regression-determined coefficients are subsequently applied to the remaining test subset of data points to predict the ratings based on the corresponding EEG values. The differences between the predicted and original values are determined as the Mean Absolute Error (MAE). The MAE for this particular n-th randomized prediction run is defined as:
We repeat this prediction process times, interrupting when a 95% confidence interval width [42] below 5 percent of the overall average MAE value is reached. The determined coefficients for these runs are averaged themselves to and employed in the prediction of the complete dataset, i.e., without separation of training and testing data. This approach mimics the availability of a user-dependent profile that is employed to predict close to real time how users experience the media presentation (QoE). This last prediction is utilized to determine the coefficient of determination () score and the MAE for the final prediction based on the averaged coefficients in comparison with a subject’s actual ratings. The value is commonly employed to evaluate the performance of regression models with respect to explaining the variance of a target variable through the model with indicating the best performance [42].
5. Results
We now present the results obtained from our VIEW dataset application for QoE/QoS prediction in a high level overview for both regular images (AR) and spherical images (SAR). Specifically, we provide the averages of the individual subject prediction performances, as well as their standard deviations for the QoE and QoS.
5.1. Results for Regular Images
We initially illustrate the results for the mean absolute error as the result of the logistic regression and subsequent prediction efforts in Figure 4.
We immediately observe that employing all EEG channels at all measurement points (All) results in a fairly low MAE value on average. Additionally, we only note little differences amongst subjects as indicated by the illustrated standard deviation. A closer inspection reveals that the introduced error is slightly higher for the prediction of the user ratings (QoE) than for the set level (QoS). An attempt at reducing the number of required EEG electrodes to the two outside or center ones (e.g., to reduce the complexity of future devices and/or systems employing this approach) results in an increase of the error and prediction outcome variability between subjects. Following this initial observation, the effect is amplified for the subject-dependent QoE in comparison to the QoS. Interestingly, a reduction to either left or right electrode pairs (Left, Right) yields smaller increases of the error, with the left electrodes resulting in the smallest increase overall. These increases, however, remain relatively low in their impact. Attempts at further complexity reduction to individual electrodes does increase the error more significantly, commonly to over one half of the user ratings or QoS levels. Approaches that would employ a single electrode in the utilized placement configuration, thus, would result in more deviation from the real values.
Shifting the view to the scores for the employed logistic model and prediction outcomes, we present our high-level results in Figure 5.
Following the trend visible for the MAE values, we initially observe that the application of all electrodes results in the highest attainable scores, on average close to one. Inverse to the MAE, the scores subsequently are higher for the QoS prediction, but only trailed by a small margin by the QoE scores. Again, we notice that an attempt in the system complexity reduction results in a decrease of prediction performance, both on the general average and variability amongst participating subjects. A further reduction of individual electrodes decreases the model performance even further.
5.2. Results for Spherical Images
We now shift the presentation of results to the spherical image scenario, where participating subjects were viewing images in an immersive fashion. The MAE results are illustrated in Figure 6.
We initially note that the application of all electrodes and channels results in a fairly low overall error, about 0.1, with noticeable differences between subjects. Corroborating our earlier observations in the AR scenario, we additionally note a slightly higher level of error and variability for the QoE case compared to the QoS case. Comparing the results to those presented for the regular image scenario, we notice an increase in the prediction error. Specifically, we observe that this baseline for prediction in the spherical case performs approximately as the two-electrode scenario for regular images. A decrease of the available EEG sensor data to sensor pairs immediately catapults the error to about over 0.5 on average with significant variability amongst subjects. A comparison with the regular image scenario results yields again a level of error that is more comparable to the single electrode scenario for those. Relying on the feedback of single electrodes increases the overall error to almost one, paired with high inter-subject variability. In turn, any predictions could result in significant differences from the true underlying values and render systematic exploitation of EEG signals difficult.
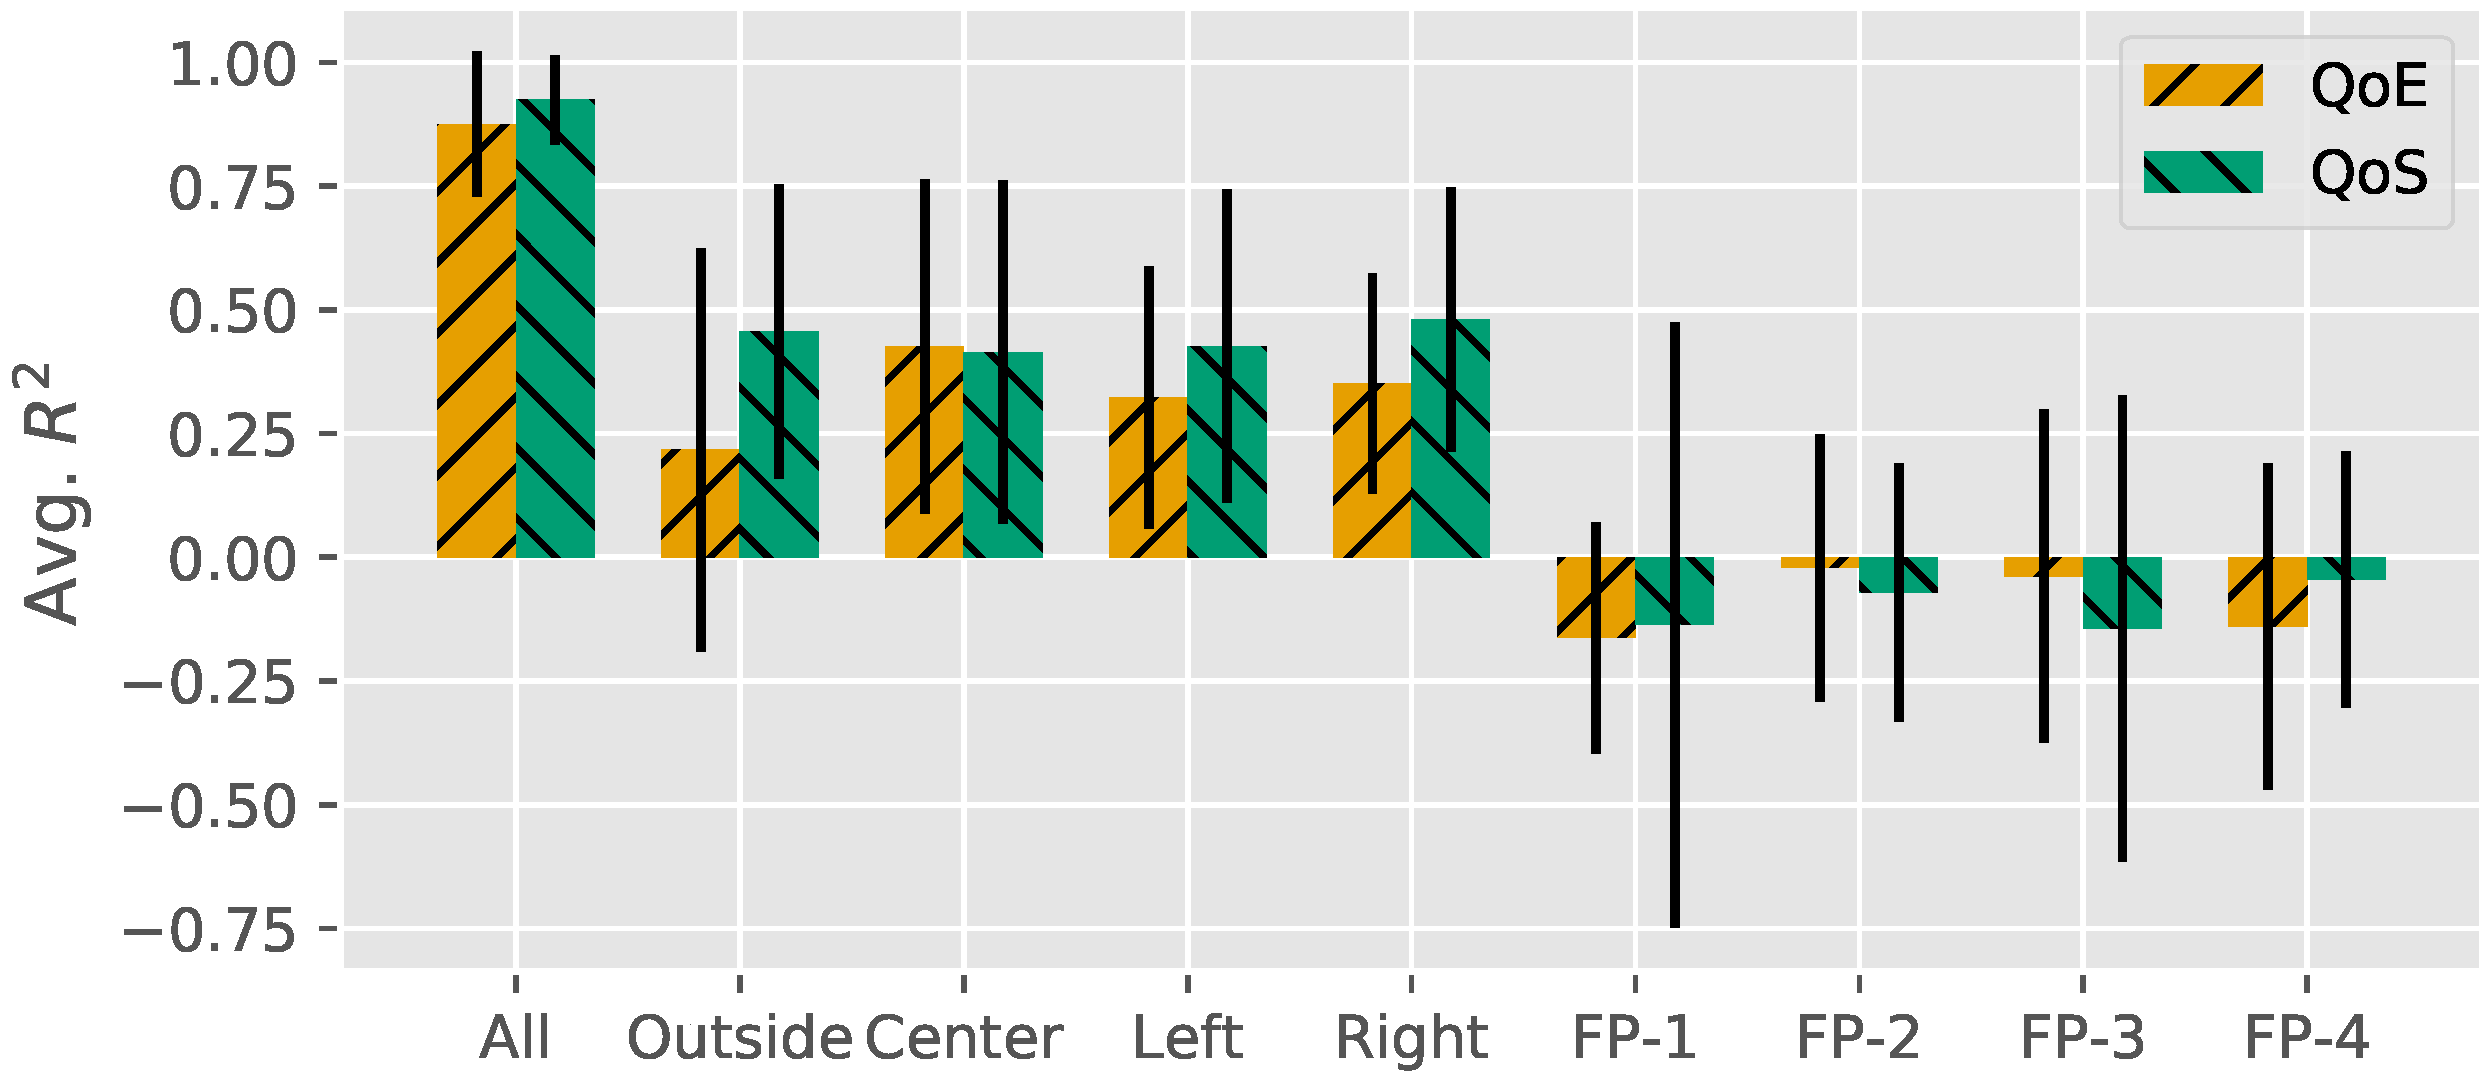
The corresponding scores attained from the model application are illustrated in Figure 7.
Similar to prior results, we attain the best model performance for the inclusion of all four electrodes in the modeling effort. While not as high as for the regular image scenario, the scores are fairly high and can be considered excellent for prediction efforts. Attempts at system complexity reduction yield almost a halving of the coefficient of determination accompanied by increased variability. Further reduction to single electrode inputs yields an even worse outcome, whereby negative scores are attained for the overall average. Given the nature of the score, this refers to the model not only being unable to capture the underlying variability and explain it, but the modeling approaches for single electrodes introduce even more undesired outcome variability.
6. Conclusions
We performed human subject experimentation to determine the QoE and QoS in augmented reality settings. Our prediction performance analysis employing the datasets with machine learning approaches for QoE and QoS predictions showcases that QoE/QoS predictions are feasible on an individual subject basis. Utilizing the mean absolute prediction error, we found that in the current configuration, all four available electrodes’ data can be employed in fairly accurate predictions of QoE and QoS levels. Considering future wearable devices, a reduction of the number of electrodes is possible with only small penalties on prediction accuracies. Such a reduction would allow the generation of wearable devices with reduced complexity paired with good real-time QoE/QoS prediction performance overall, as long as at least two electrodes remain in the configuration.
Throughout this paper, we describe the generation and utilization of the Visual Interface Evaluation for Wearables (VIEW) datasets. The VIEW datasets contain anonymous human subject ratings and EEG band information gathered during experimental sessions with commercially-available off-the-shelf equipment. We make them publicly available and describe their utilization to help the research community in furthering their inquiries in the domain of QoE in augmented reality scenarios.
Several interesting avenues for additional evaluations exist, such as evaluations of more devices and types, with subsequent cross-performance analyses. Additional evaluations based on the VIEW dataset exist, as well, such as new approaches to data processing and prediction. In our ongoing research, we are investigating other wearables and actual system implementations in the context of the tactile Internet and edge computing.
Acknowledgments
This work was supported in part by a Faculty Research and Creative Endeavors grant from Central Michigan University.
Author Contributions
Brian Bauman developed the experimental framework, conducted the human subject experiments and generated the initial data. Patrick Seeling generated the publicly-available datasets, analyzed the data and prepared the manuscript.
Conflicts of Interest
The authors declare no conflict of interest.
References
- Keighrey, C.; Flynn, R.; Murray, S.; Murray, N. A QoE evaluation of immersive augmented and virtual reality speech language assessment applications. In Proceedings of the 2017 Ninth International Conference on Quality of Multimedia Experience (QoMEX), Erfurt, Germany, 31 May–2 June 2017; pp. 1–6. [Google Scholar]
- Gabbard, J.L.; Fitch, G.M.; Kim, H. Behind the Glass: Driver Challenges and Opportunities for AR Automotive Applications. Proc. IEEE 2014, 102, 124–136. [Google Scholar] [CrossRef]
- Rolland, J.; Fuchs, H. Optical Versus Video See-Through Head-Mounted Displays in Medical Visualization. Presence 2000, 9, 287–309. [Google Scholar] [CrossRef]
- Traub, J.; Sielhorst, T.; Heining, S.M.; Navab, N. Advanced Display and Visualization Concepts for Image Guided Surgery. J. Disp. Technol. 2008, 4, 483–490. [Google Scholar] [CrossRef]
- Lee, K. Augmented Reality in Education and Training. TechTrends 2012, 56, 13–21. [Google Scholar] [CrossRef]
- Shih, Y.Y.; Chung, W.H.; Pang, A.C.; Chiu, T.C.; Wei, H.Y. Enabling Low-Latency Applications in Fog-Radio Access Networks. IEEE Netw. 2017, 31, 52–58. [Google Scholar] [CrossRef]
- Seeling, P. Network Traffic Characteristics of Proxied Wearable Devices: A Day with Google Glass. In Proceedings of the IEEE Consumer Communications and Networking Conference (CCNC), Las Vegas, NV, USA, 9–12 January 2015. [Google Scholar]
- Brunnström, K.; Beker, S.A.; De Moor, K.; Dooms, A.; Egger, S.; Garcia, M.N.; Hossfeld, T.; Jumisko-Pyykkö, S.; Keimel, C.; Larabi, C.; et al. Qualinet White Paper on Definitions of Quality of Experience. Proceedings of 5th Qualinet Meeting, Novi Sad, Serbia, 12 March 2013. [Google Scholar]
- Engelke, U.; Nguyen, H.; Ketchell, S. Quality of augmented reality experience: A correlation analysis. In Proceedings of the 2017 Ninth International Conference on Quality of Multimedia Experience (QoMEX), Erfurt, Germany, 31 May–2 June 2017; pp. 1–3. [Google Scholar]
- Hektner, J.M.; Schmidt, J.A.; Csikszentmihalyi, M. Experience Sampling Method: Measuring the Quality of Everyday Life; Sage: Newcastle upon Tyne, UK, 2007. [Google Scholar]
- ITU-R, R. 1534-1, Method for the Subjective Assessment of Intermediate Quality Levels of Coding Systems (MUSHRA); International Telecommunication Union: Geneva, Switzerland, 2003. [Google Scholar]
- Calvo, R.A.; D’Mello, S. Affect Detection: An Interdisciplinary Review of Models, Methods, and Their Applications. IEEE Trans. Affect. Comput. 2010, 1, 18–37. [Google Scholar] [CrossRef]
- Gaubatz, M.D.; Hemami, S.S. On the nearly scale-independent rank behavior of image quality metrics. In Proceedings of the IEEE International Conference on Image Processing ICIP, San Diego, CA, USA, 12–15 October 2008; pp. 701–704. [Google Scholar]
- Fiedler, M.; Hossfeld, T.; Tran-Gia, P. A generic quantitative relationship between quality of experience and quality of service. IEEE Netw. 2010, 24, 36–41. [Google Scholar] [CrossRef]
- Reichl, P.; Tuffin, B.; Schatz, R. Logarithmic laws in service quality perception: where microeconomics meets psychophysics and quality of experience. Telecommun. Syst. 2013, 52, 587–600. [Google Scholar] [CrossRef]
- Seeling, P. Augmented Vision and Quality of Experience Assessment: Towards a Unified Evaluation Framework. In Proceedings of the IEEE ICC Workshop on Quality of Experience-based Management for Future Internet Applications and Services (QoE-FI), London, UK, 8–12 June 2015. [Google Scholar]
- Mann, S. Humanistic computing: “WearComp” as a new framework and application for intelligent signal processing. Proc. IEEE 1998, 86, 2123–2151. [Google Scholar] [CrossRef]
- Kanbara, M.; Okuma, T.; Takemura, H. A Stereoscopic Video See-through Augmented Reality System Based on Real-time Vision-based Registration. In Proceedings of the IEEE Virtual Reality 2000 (Cat. No. 00CB37048), New Brunswick, NJ, USA, 22–22 March 2000; pp. 255–262. [Google Scholar]
- Van Krevelen, D.W.F.; Poelman, R. A Survey of Augmented Reality Technologies, Applications and Limitations. Int. J. Virtual Real. 2010, 9, 1–20. [Google Scholar]
- Kruijff, E.; Swan, J.E., II; Feiner, S. Perceptual Issues in Augmented Reality Revisited. In Proceedings of the IEEE and ACM International Symposium on Mixed and Augmented Reality (ISMAR), Seoul, Korea, 13–16 October 2010; pp. 3–12. [Google Scholar]
- Kalkofen, D.; Mendez, E.; Schmalstieg, D. Interactive Focus and Context Visualization for Augmented Reality. In Proceedings of the IEEE and ACM International Symposium on Mixed and Augmented Reality (ISMAR), Nara, Japan, 13–16 November 2007; pp. 191–201. [Google Scholar]
- Bonanni, L.; Lee, C.H.; Selker, T. Attention-Based Design of Augmented Reality Interfaces. In Proceedings of the ACM Human Factors in Computing Systems Conference CHI, Portland, OR, USA, 2–7 April 2005; pp. 1228–1231. [Google Scholar]
- Sanches, S.R.R.; Tokunaga, D.M.; Silva, V.F.; Tori, R. Subjective Video Quality Assessment in Segmentation for Augmented Reality Applications. In Proceedings of the 2012 14th Symposium on Virtual and Augmented Reality, Rio de Janeiro, Brazil, 28–31 May 2012; pp. 46–55. [Google Scholar]
- Klein, E.; Swan, J.E.; Schmidt, G.S.; Livingston, M.A.; Staadt, O.G. Measurement Protocols for Medium-Field Distance Perception in Large-Screen Immersive Displays. In Proceedings of the IEEE Virtual Reality Conference (VR), Lafayette, LA, USA, 14–18 March 2009; pp. 107–113. [Google Scholar]
- Livingston, M.A.; Barrow, J.H.; Sibley, C.M. Quantification of Contrast Sensitivity and Color Perception using Head-worn Augmented Reality Displays. In Proceedings of the IEEE Virtual Reality Conference (VR), Lafayette, LA, USA, 14–18 March 2009; pp. 115–122. [Google Scholar]
- Woods, R.L.; Fetchenheuer, I.; Vargas Martín, F.; Peli, E. The impact of non-immersive head-mounted displays (HMDs) on the visual field. J. Soc. Inf. Disp. 2003, 11, 191–198. [Google Scholar] [CrossRef]
- Seeling, P. Visual User Experience Difference: Image Compression Impacts on the Quality of Experience in Augmented Binocular Vision. In Proceedings of the IEEE Consumer Communications and Networking Conference (CCNC), Las Vegas, NV, USA, 9–12 January 2016; pp. 931–936. [Google Scholar]
- Pan, C.; Xu, Y.; Yan, Y.; Gu, K.; Yang, X. Exploiting neural models for no-reference image quality assessment. In Proceedings of the 2016 Visual Communications and Image Processing (VCIP), Chengdu, China, 27–30 November 2016; pp. 1–4. [Google Scholar]
- Scholler, S.; Bosse, S.; Treder, M.S.; Blankertz, B.; Curio, G.; Mueller, K.R.; Wiegand, T. Toward a Direct Measure of Video Quality Perception Using EEG. IEEE Trans. Image Proc. 2012, 21, 2619–2629. [Google Scholar] [CrossRef] [PubMed]
- Bosse, S.; Müller, K.R.; Wiegand, T.; Samek, W. Brain-Computer Interfacing for multimedia quality assessment. In Proceedings of the 2016 IEEE International Conference on Systems, Man, and Cybernetics (SMC), Budapest, Hungary, 9–12 October 2016; pp. 002834–002839. [Google Scholar]
- Davis, P.; Creusere, C.D.; Kroger, J. The effect of perceptual video quality on EEG power distribution. In Proceedings of the 2016 IEEE International Conference on Image Processing (ICIP), Phoenix, AZ, USA, 25–28 September 2016; pp. 2420–2424. [Google Scholar]
- Lindemann, L.; Magnor, M.A. Assessing the quality of compressed images using EEG. In Proceedings of the 18th IEEE International Conference on Image Processing, Brussels, Belgium, 11–14 September 2011. [Google Scholar]
- Acqualagna, L.; Bosse, S.; Porbadnigk, A.K.; Curio, G.; Müller, K.R.; Wiegand, T.; Blankertz, B. EEG-based classification of video quality perception using steady state visual evoked potentials (SSVEPs). J. Neural Eng. 2015, 12, 026012. [Google Scholar] [CrossRef] [PubMed]
- Arnau-Gonzalez, P.; Althobaiti, T.; Katsigiannis, S.; Ramzan, N. Perceptual video quality evaluation by means of physiological signals. In Proceedings of the 2017 Ninth International Conference on Quality of Multimedia Experience (QoMEX), Erfurt, Germany, 31 May–2 June 2017; pp. 1–6. [Google Scholar]
- Bauman, B.; Seeling, P. Towards Predictions of the Image Quality of Experience for Augmented Reality Scenarios; Cornell University Library: Ithaca, NY, USA, 2017. [Google Scholar]
- Bauman, B.; Seeling, P. Towards Still Image Experience Predictions in Augmented Vision Settings. In Proceedings of the IEEE Consumer Communications and Networking Conference (CCNC), Las Vegas, NV, USA, 8–11 January 2017; pp. 1–6. [Google Scholar]
- ITU-T. Recommendation ITU-T P.910: Subjective Video Quality Assessment Methods for Multimedia Applications. Available online: https://www.itu.int/rec/T-REC-P.910-199608-S/en (accessed on 15 May 2017).
- Ponomarenko, N.; Jin, L.; Ieremeiev, O.; Lukin, V.; Egiazarian, K.; Astola, J.; Vozel, B.; Chehdi, K.; Carli, M.; Battisti, F.; et al. Image database TID2013: Peculiarities, results and perspectives. Signal Proc. Image Commun. 2015, 30, 57–77. [Google Scholar] [CrossRef] [Green Version]
- Seeling, P. Visual Interface Evaluation for Wearables (VIEW). Available online: http://people.cst.cmich.edu/seeli1p/VIEW/ (accessed on 30 June 2017).
- Seeling, P. Visual Interface Evaluation for Wearables (VIEW). Available online: http://patrick.seeling.org/VIEW/ (accessed on 30 June 2017).
- Hipp, D.R. SQLite. Available online: http://www.sqlite.org (accessed on 30 June 2017).
- Jain, R. The Art of Computer Systems Performance Analysis: Techniques for Experimental Design, Measurement, Simulation, and Modeling; Wiley: Hoboken, NJ, USA, 1991. [Google Scholar]
Figure 1.
Overview of the methodology for creating and evaluating the Visual Interface Evaluation for Wearables (VIEW) datasets, including relevant sections in this paper; : Coefficient of determination; MAE: Mean Absolute Errors.
Figure 1.
Overview of the methodology for creating and evaluating the Visual Interface Evaluation for Wearables (VIEW) datasets, including relevant sections in this paper; : Coefficient of determination; MAE: Mean Absolute Errors.
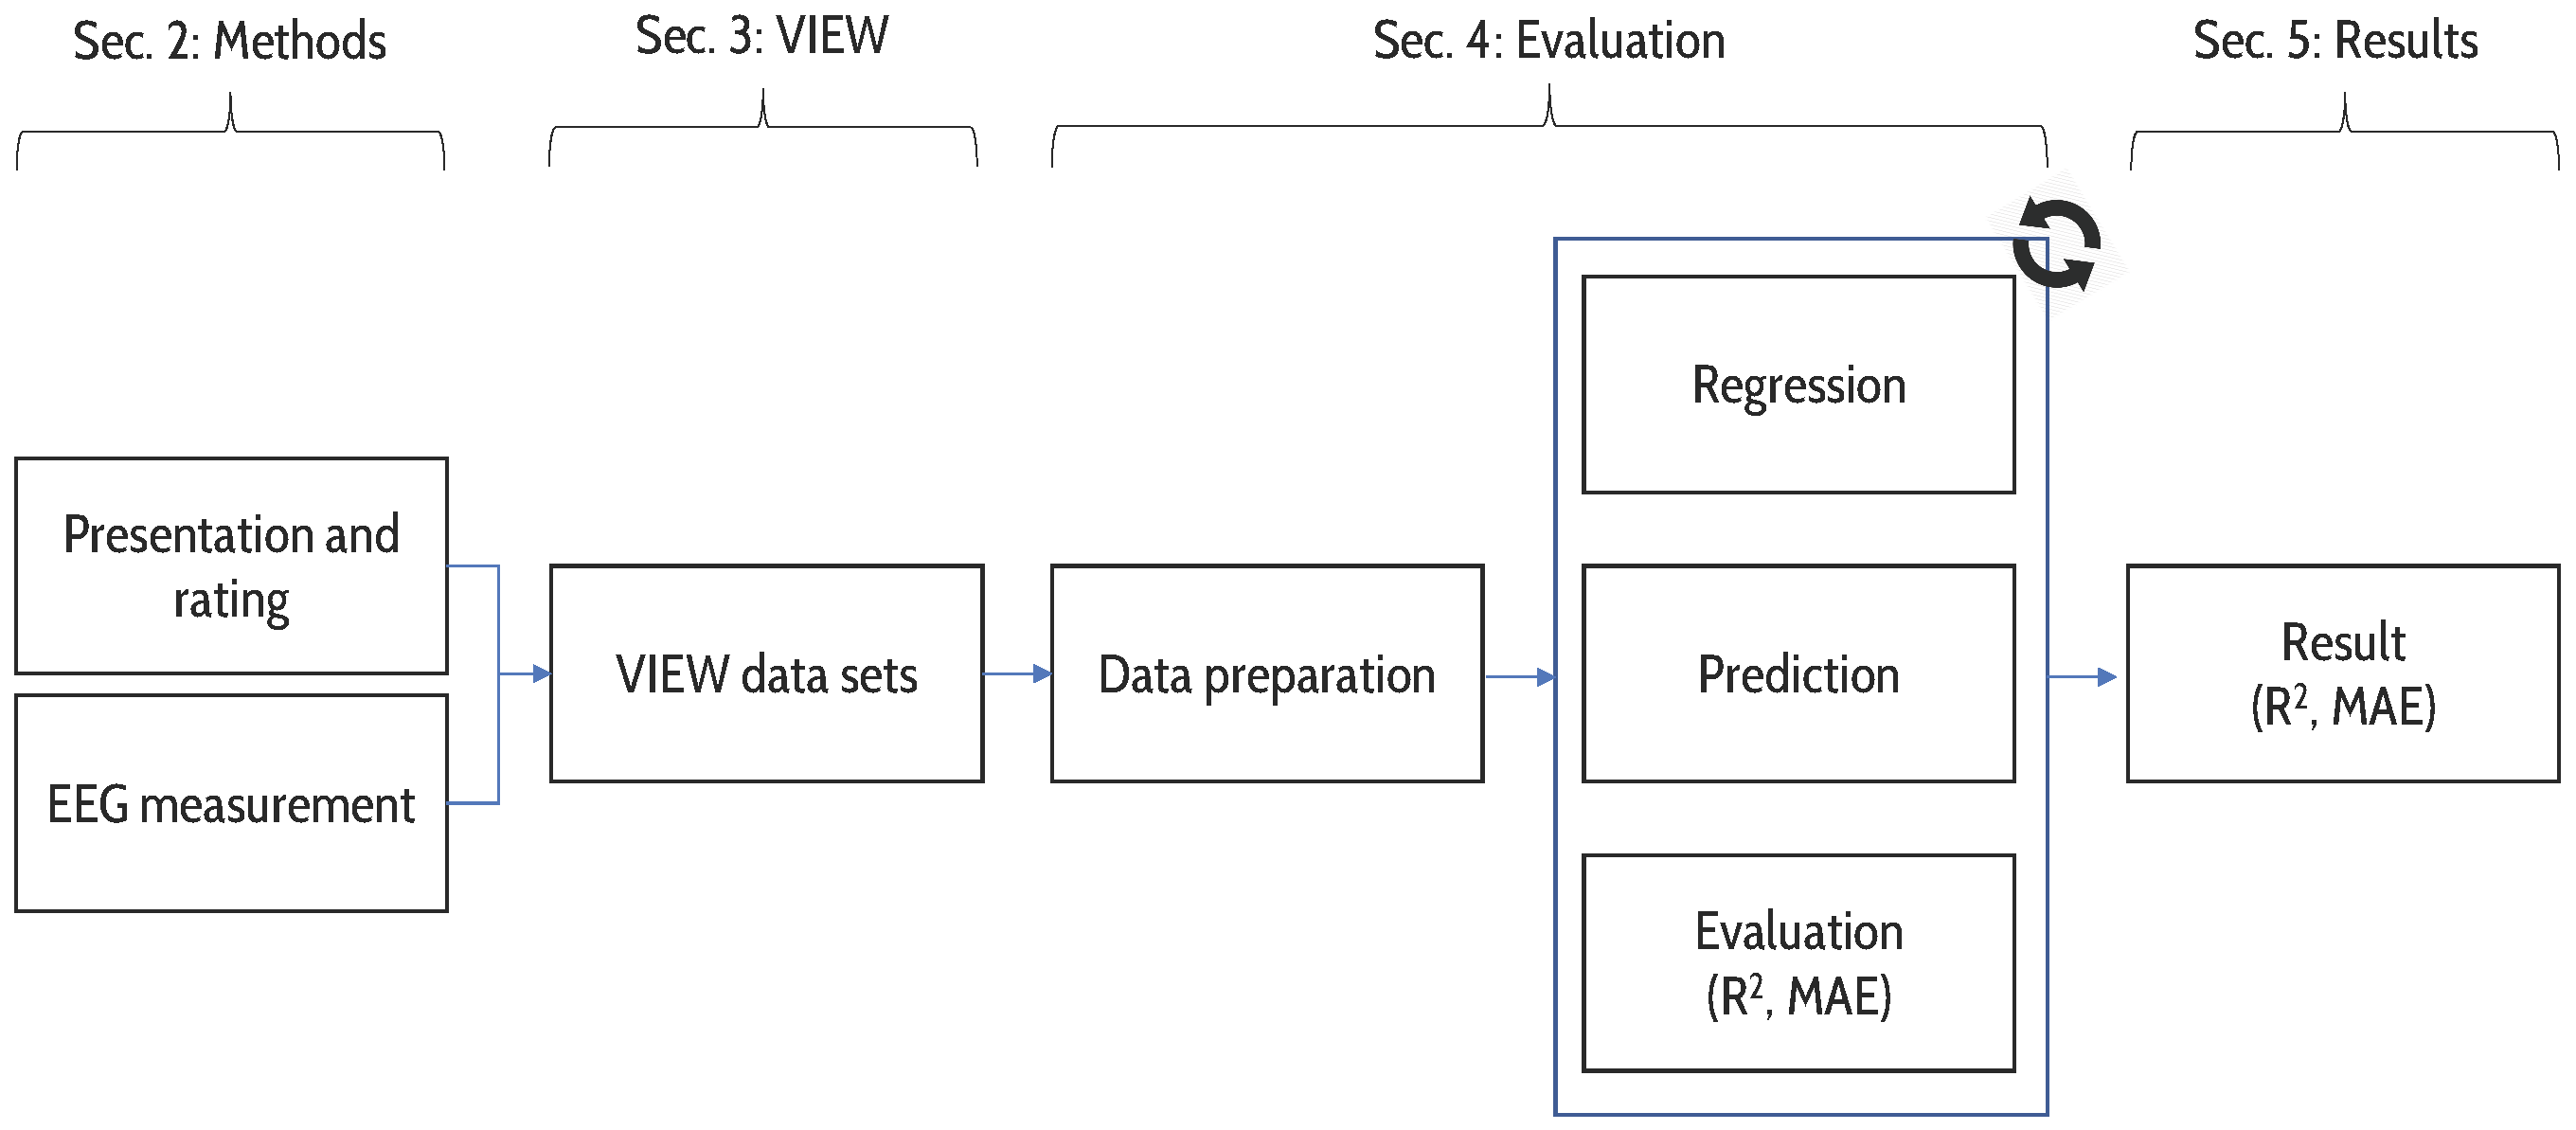
Figure 2.
Overview of the Tampere Image Database from 2013 (TID2013) images employed in the Augmented Reality (AR) scenario.
Figure 2.
Overview of the Tampere Image Database from 2013 (TID2013) images employed in the Augmented Reality (AR) scenario.

Figure 3.
Overview of the spherical images employed in the SAR scenario; (a): a Bamboo hut; (b): a view of rocks and a Beach House; (c): a backyard Garden; (d): a Golf course; (e): a Mosque and the plaza in front; (f): an underwater Ocean scene.
Figure 3.
Overview of the spherical images employed in the SAR scenario; (a): a Bamboo hut; (b): a view of rocks and a Beach House; (c): a backyard Garden; (d): a Golf course; (e): a Mosque and the plaza in front; (f): an underwater Ocean scene.
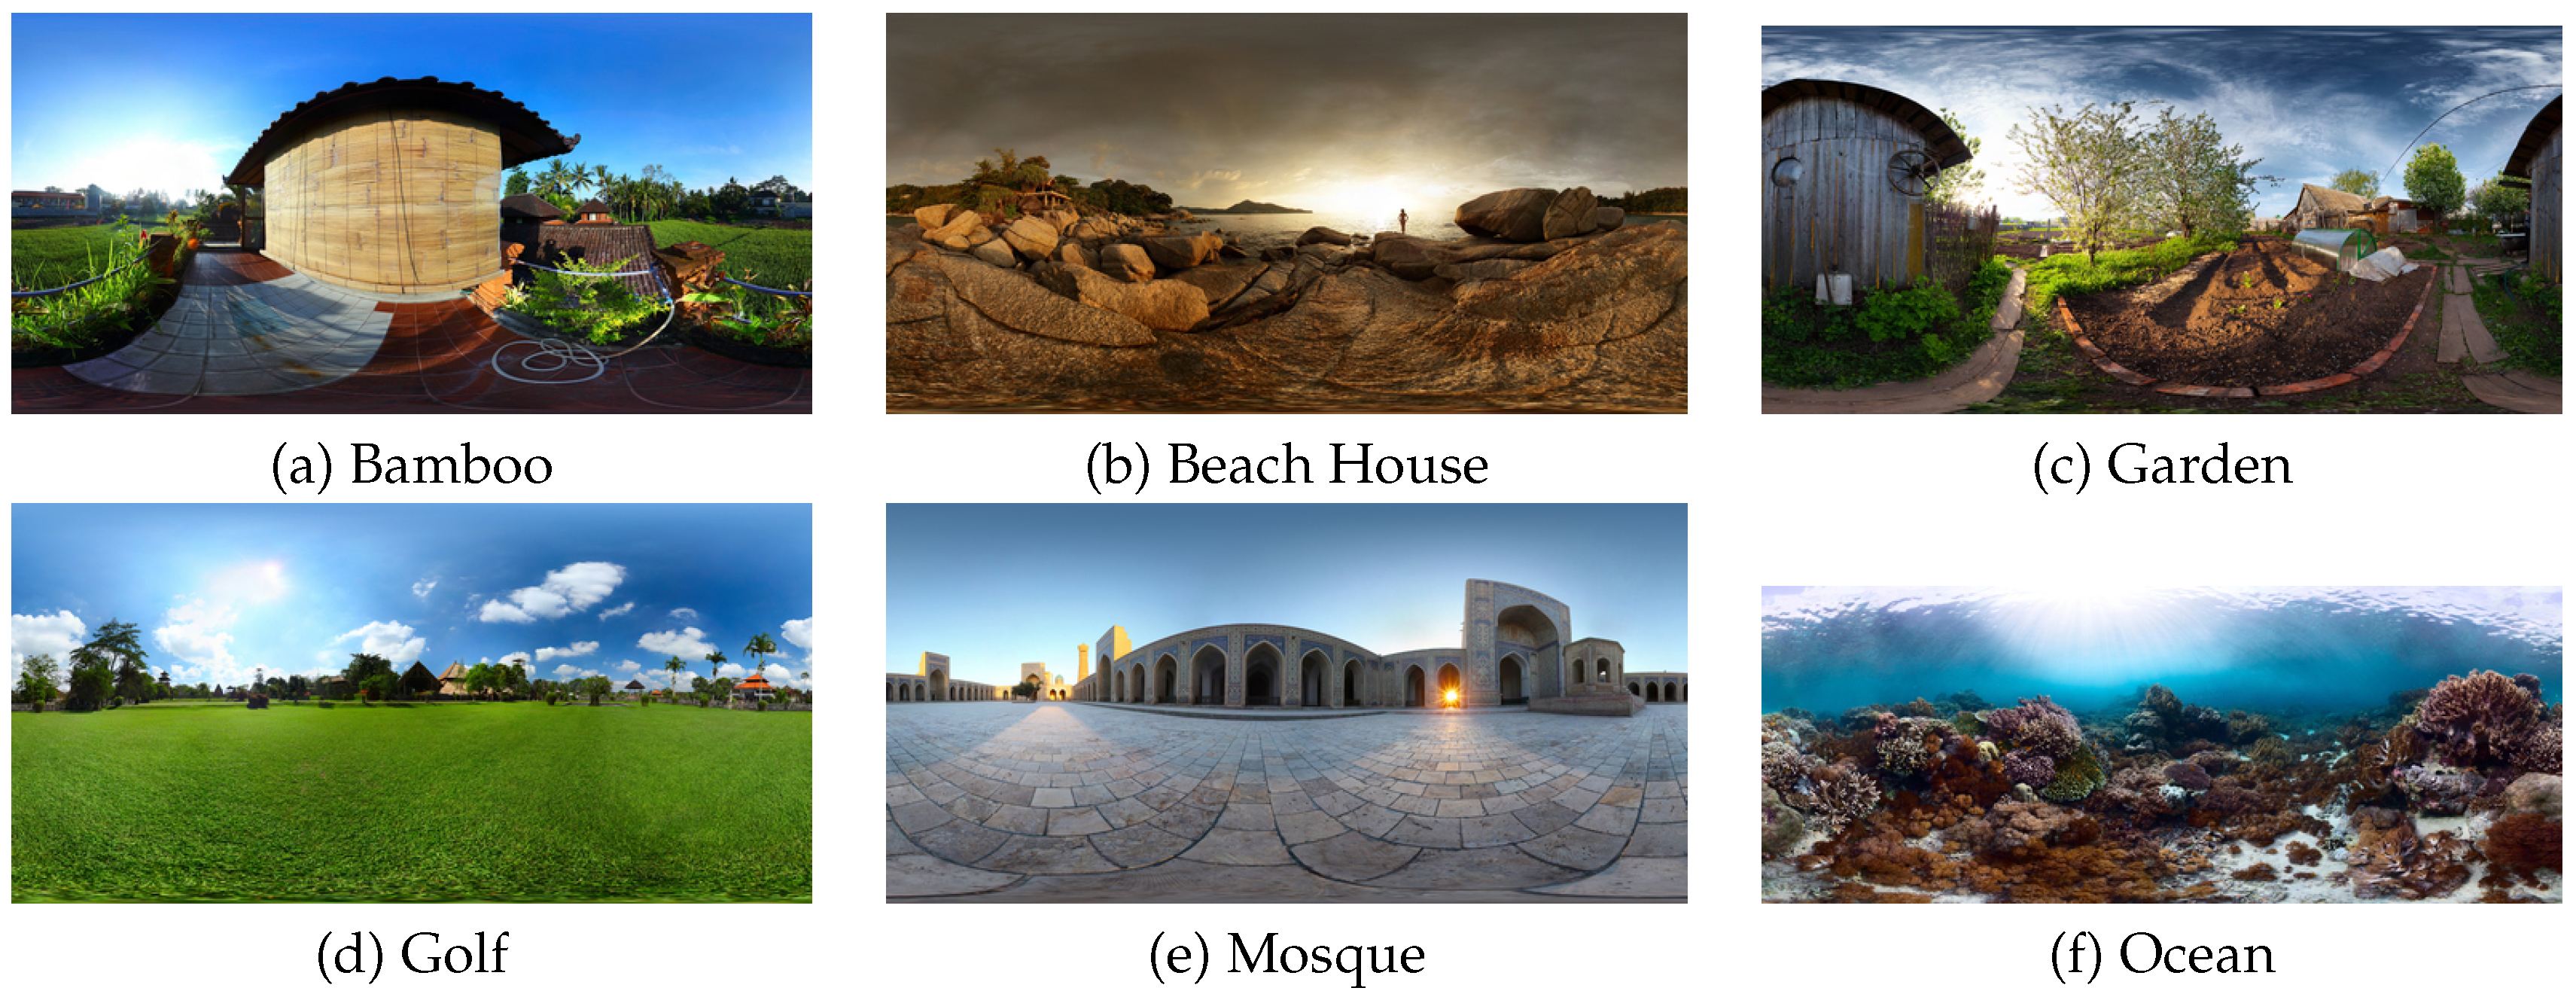
Figure 4.
Mean Absolute Errors (MAE) for the regular image (AR) condition averages and standard deviations for subject ratings (QoE) and impairment level (QoS) prediction performance analysis of individual subjects.
Figure 4.
Mean Absolute Errors (MAE) for the regular image (AR) condition averages and standard deviations for subject ratings (QoE) and impairment level (QoS) prediction performance analysis of individual subjects.
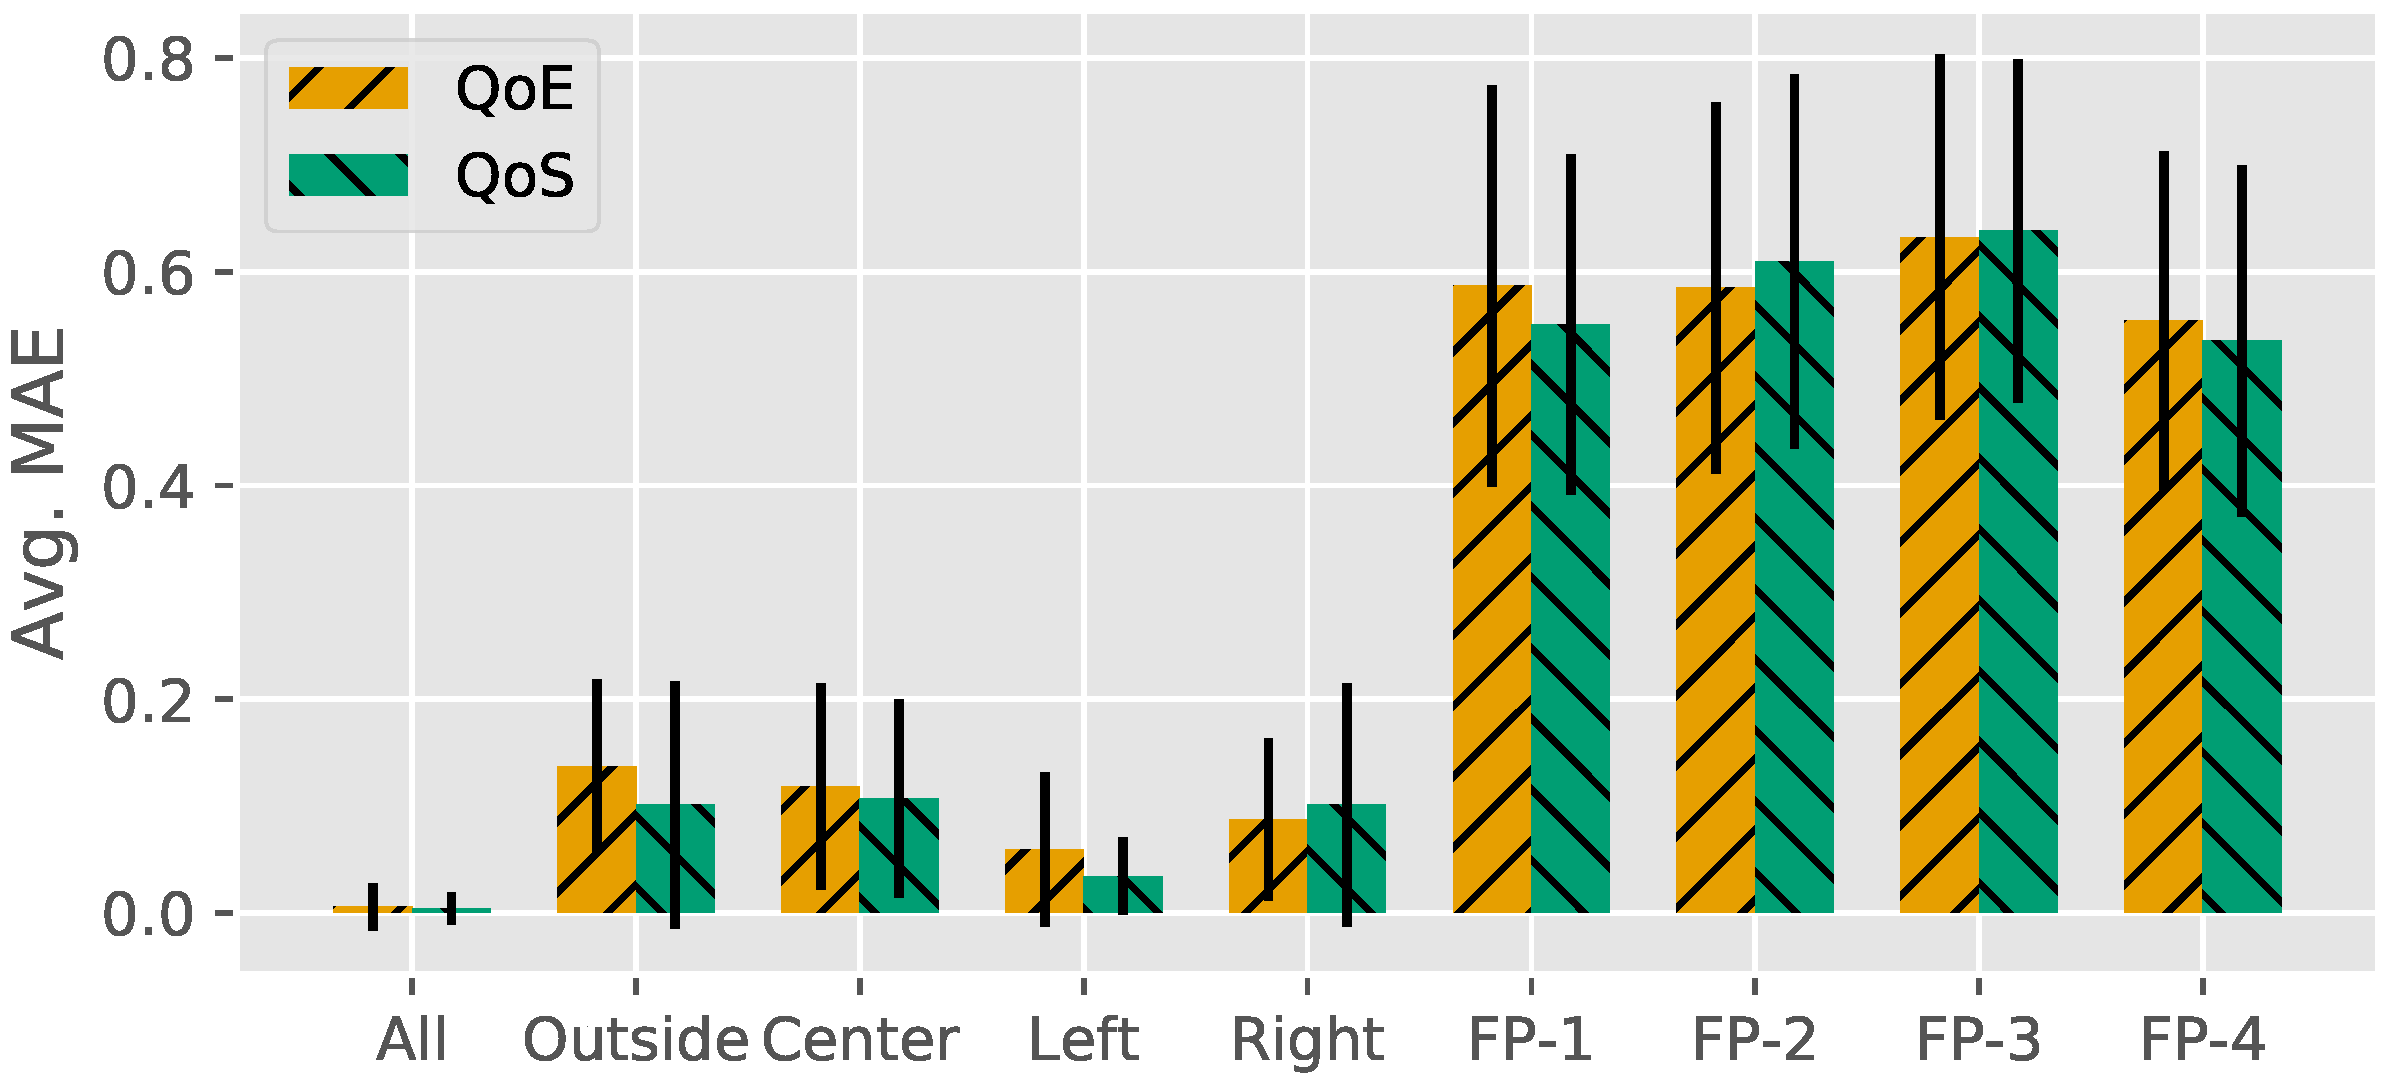
Figure 5.
scores for the regular image (AR) condition averages and standard deviations for subject ratings (QoE) and impairment level (QoS) prediction performance analysis of individual subjects.
Figure 5.
scores for the regular image (AR) condition averages and standard deviations for subject ratings (QoE) and impairment level (QoS) prediction performance analysis of individual subjects.
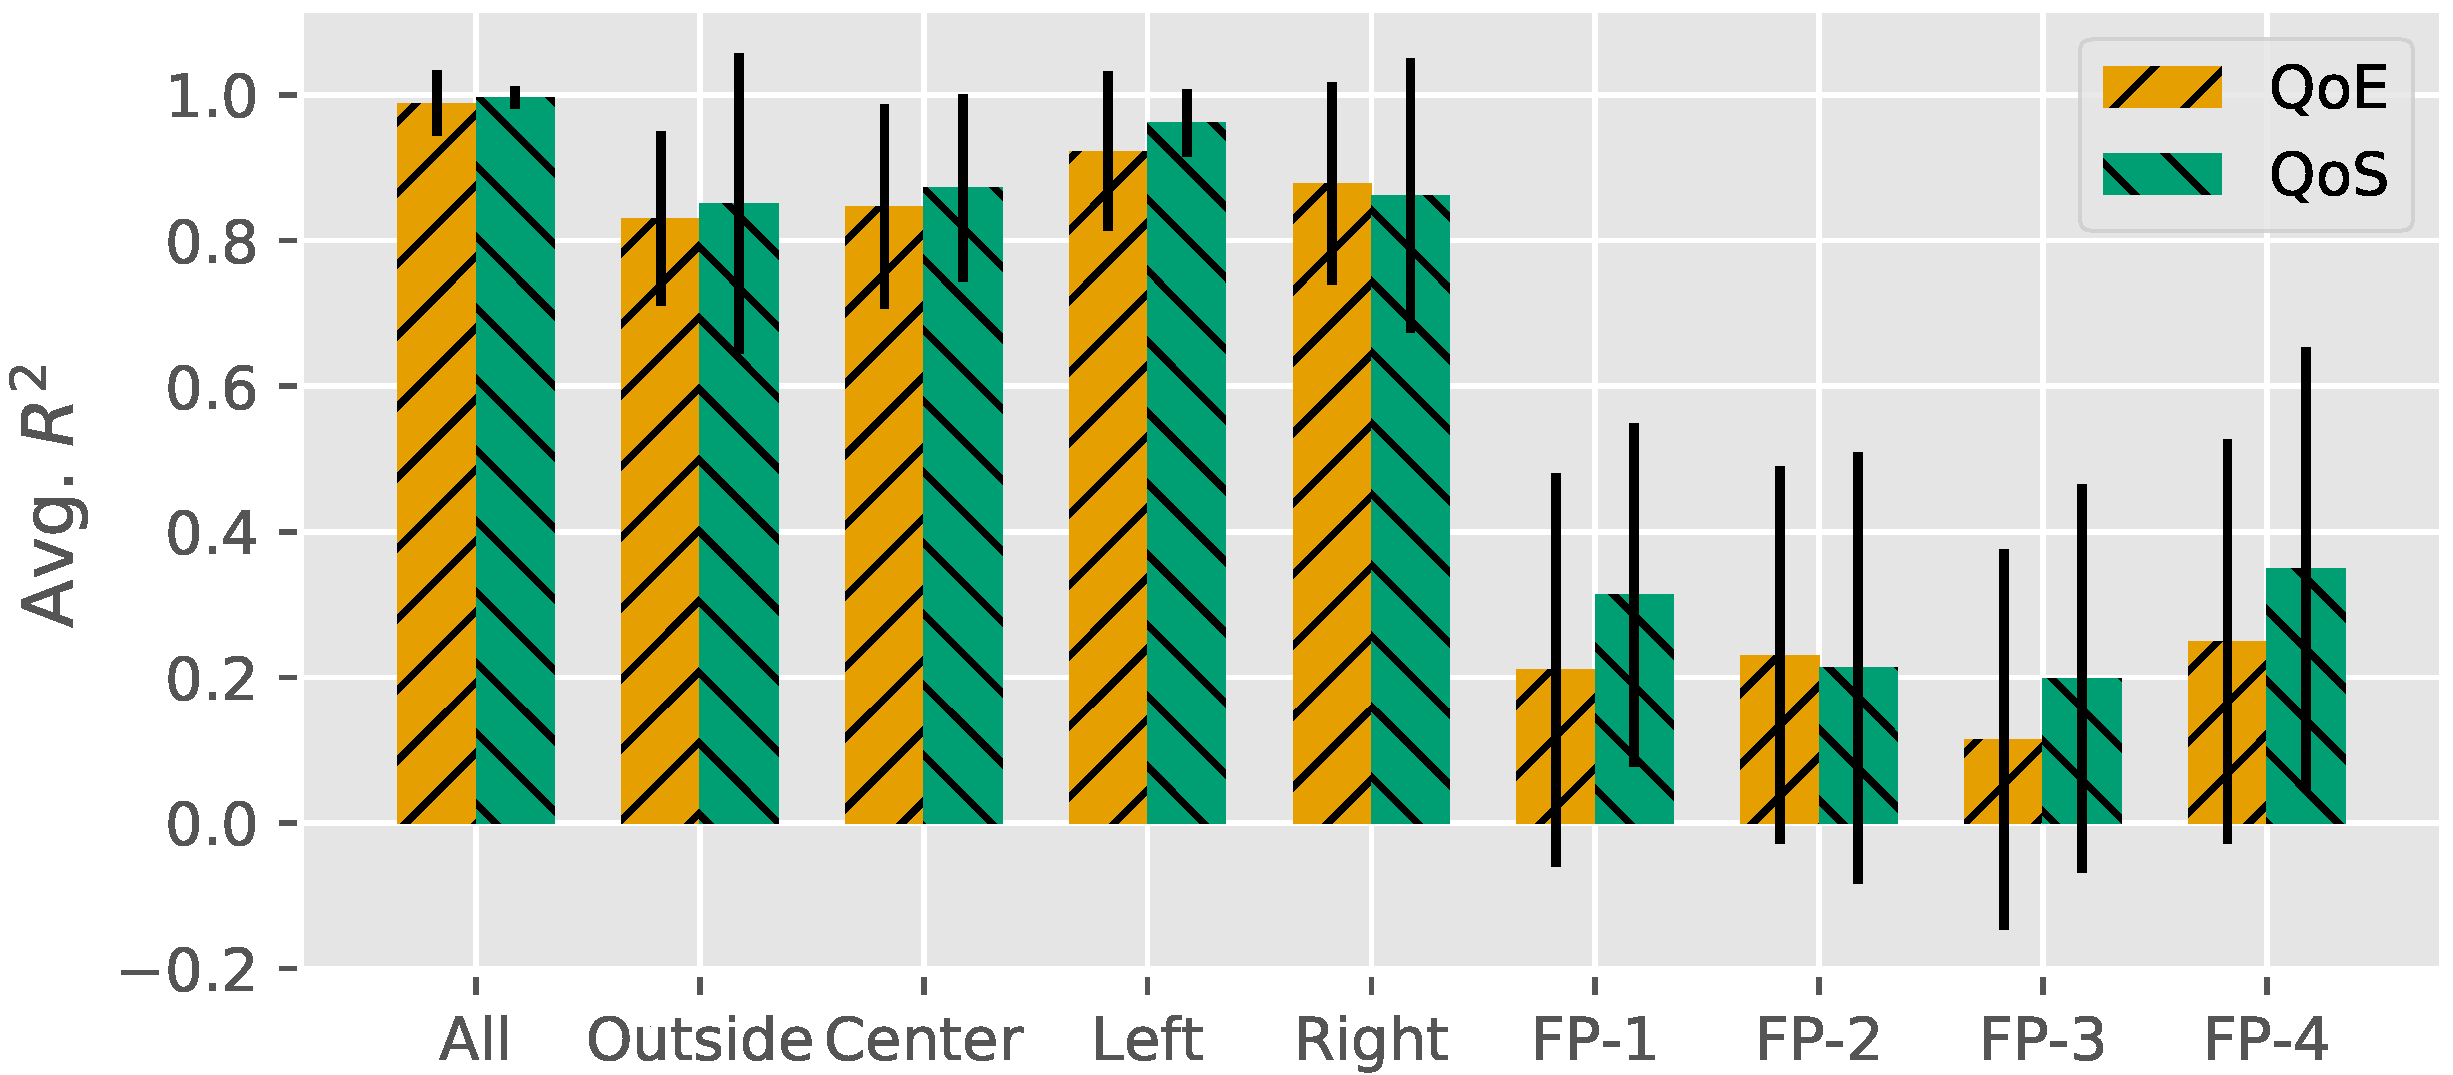
Figure 6.
Mean Absolute Errors (MAE) for the spherical image (SAR) condition averages and standard deviations for subject ratings (QoE) and impairment level (QoS) prediction performance analysis of individual subjects.
Figure 6.
Mean Absolute Errors (MAE) for the spherical image (SAR) condition averages and standard deviations for subject ratings (QoE) and impairment level (QoS) prediction performance analysis of individual subjects.
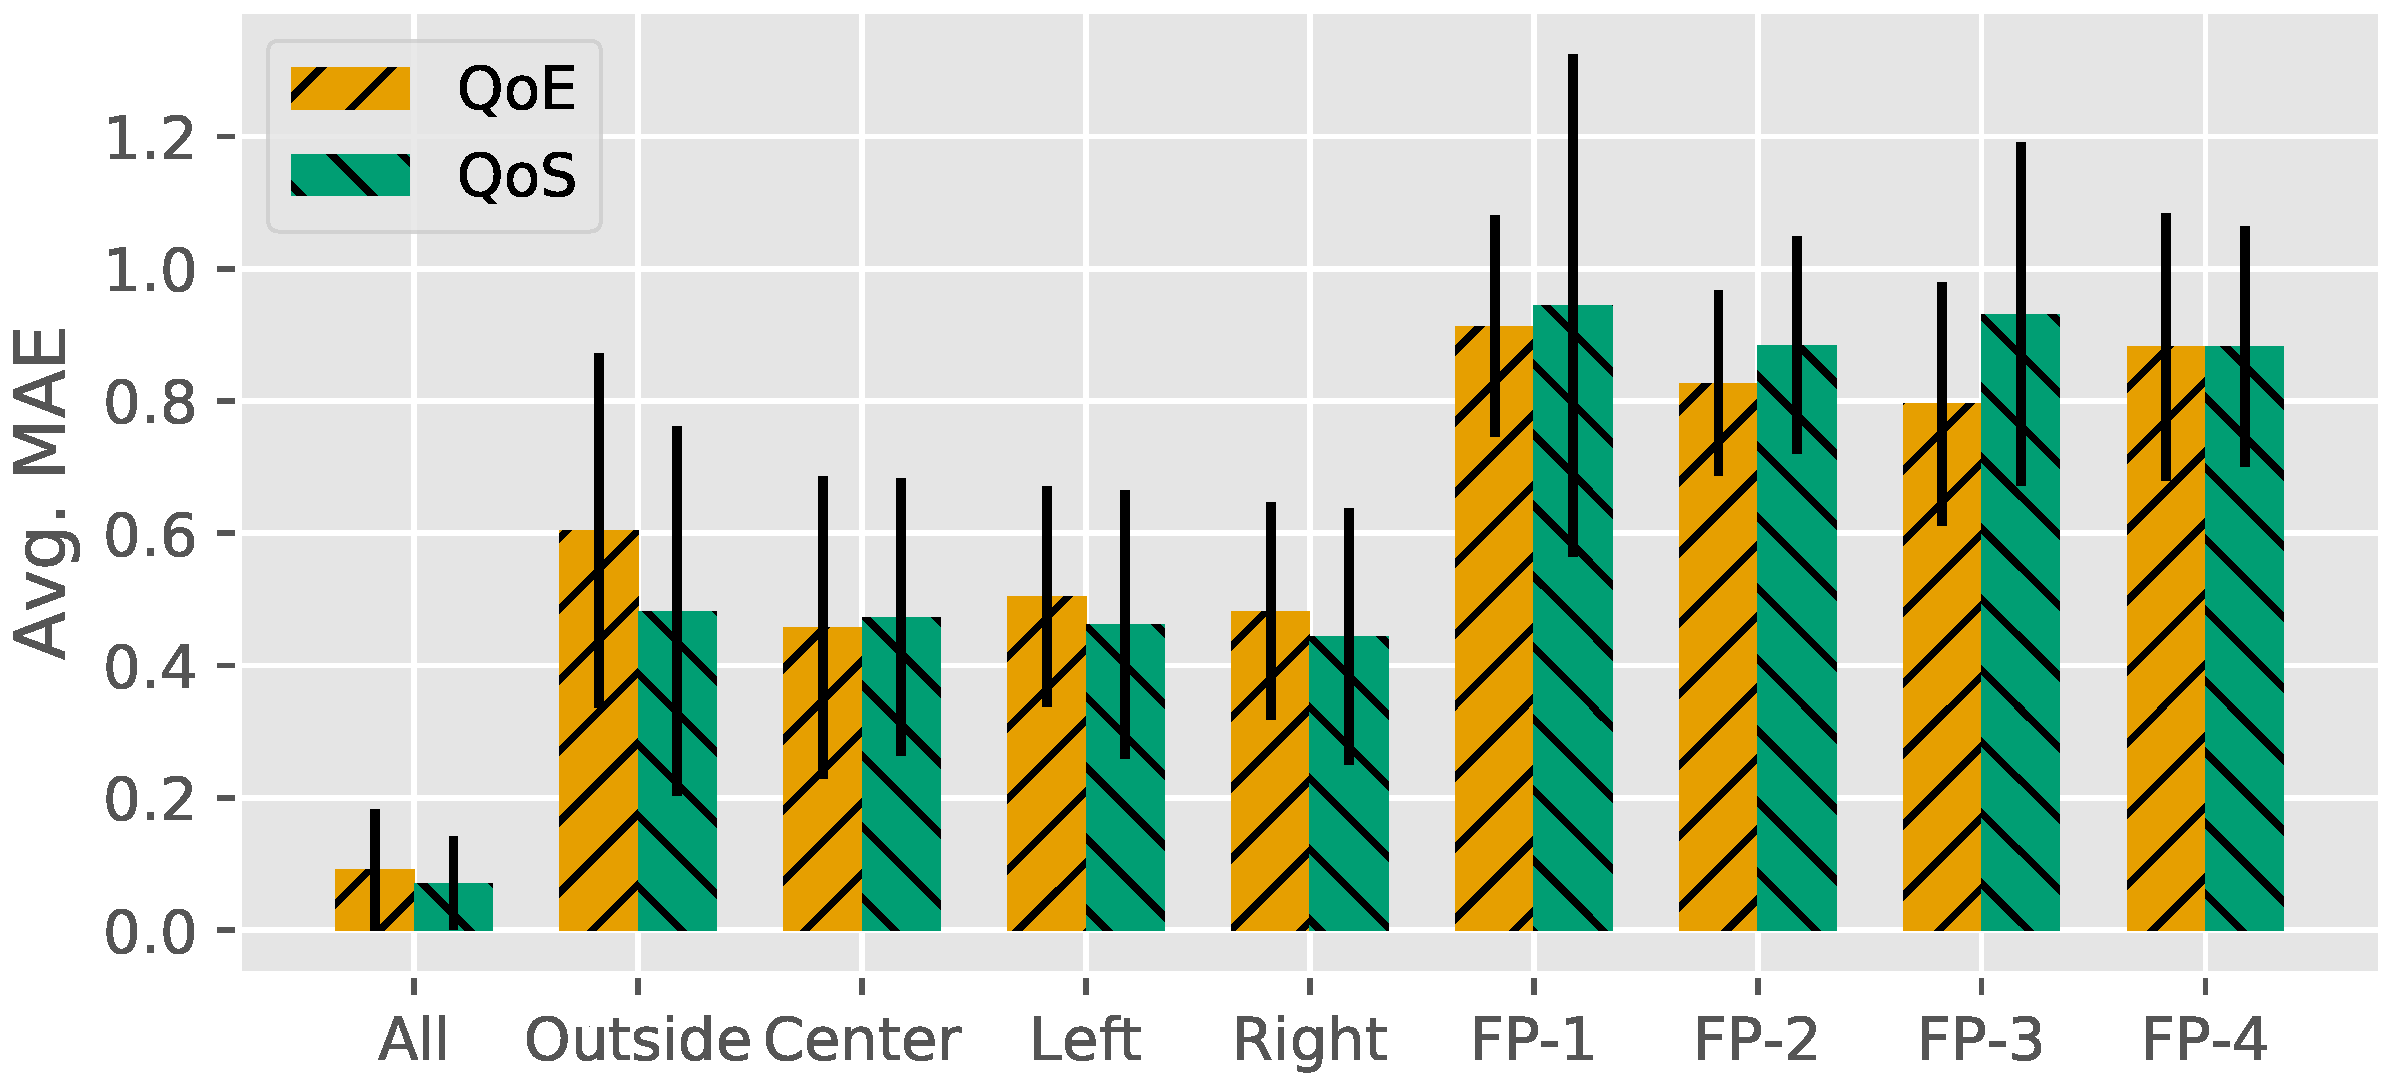
Figure 7.
scores for the spherical image (SAR) condition averages and standard deviations for subject ratings (QoE) and impairment level (QoS) prediction performance analysis of individual subjects.
Figure 7.
scores for the spherical image (SAR) condition averages and standard deviations for subject ratings (QoE) and impairment level (QoS) prediction performance analysis of individual subjects.

Table 1.
Database table schema for subject u media presentation and ratings; Text: SQLite variable-length string data type; Integer: SQLite integer number data type; Real: SQLite floating point number data type.
Table 1.
Database table schema for subject u media presentation and ratings; Text: SQLite variable-length string data type; Integer: SQLite integer number data type; Real: SQLite floating point number data type.
| Subject_{u}_ratings | ||
|---|---|---|
| Field | Type | Description |
| file name | Text | Name of the image file shown |
| image i | Text | Description/image name |
| level l | Integer | Impairment level |
| start time | Real | Presentation start timestamp for image i with impairment l |
| end time | Real | Presentation end timestamp for image i with impairment l |
| rating | Integer | User rating for the presentation |
Table 2.
Database table schema for subject u EEG (electroencephalography) values measured (in order TP9, Fp1, Fp2, TP10).
Table 2.
Database table schema for subject u EEG (electroencephalography) values measured (in order TP9, Fp1, Fp2, TP10).
| Subject_{u}_eeg | ||
|---|---|---|
| Field | Type | Description |
| time t | Real | Measurement timestamp |
| low{1 …4}, | Real | Low bands (2.5–6.1 Hz) |
| alpha{1 …4}, | Real | Alpha bands (7.5–13 Hz) |
| beta{1 …4}, | Real | Beta bands (13–30 Hz) |
| delta{1 …4}, | Real | Delta bands (1–4 Hz) |
| gamma{1 …4}, | Real | Gamma bands (30–44 Hz) |
| theta{1 …4}, | Real | Theta bands (4–8 Hz) |
© 2017 by the authors. Licensee MDPI, Basel, Switzerland. This article is an open access article distributed under the terms and conditions of the Creative Commons Attribution (CC BY) license (http://creativecommons.org/licenses/by/4.0/).
Share and Cite
MDPI and ACS Style
Bauman, B.; Seeling, P. Visual Interface Evaluation for Wearables Datasets: Predicting the Subjective Augmented Vision Image QoE and QoS. Future Internet 2017, 9, 40. https://doi.org/10.3390/fi9030040
AMA Style
Bauman B, Seeling P. Visual Interface Evaluation for Wearables Datasets: Predicting the Subjective Augmented Vision Image QoE and QoS. Future Internet. 2017; 9(3):40. https://doi.org/10.3390/fi9030040
Chicago/Turabian StyleBauman, Brian, and Patrick Seeling. 2017. "Visual Interface Evaluation for Wearables Datasets: Predicting the Subjective Augmented Vision Image QoE and QoS" Future Internet 9, no. 3: 40. https://doi.org/10.3390/fi9030040
Note that from the first issue of 2016, this journal uses article numbers instead of page numbers. See further details here.