Proposed Fuzzy-NN Algorithm with LoRaCommunication Protocol for Clustered Irrigation Systems


1
Department of Mathematics, University of Ioannina, 45110 Ioannina, Greece
2
Department of Business Administration, TEI of Western Macedonia, 51100 Grevena, Greece
3
Opera Department—Wireless Communications Group, Universitélibre de Bruxelles, 1050 Bruxelles, Belgium
4
Department of Accountancy, TEI of Eastern Macedonia and Thrace, 65404 Kavala, Greece
*
Author to whom correspondence should be addressed.
Future Internet 2017, 9(4), 78; https://doi.org/10.3390/fi9040078
Submission received: 28 August 2017
/
Revised: 31 October 2017
/
Accepted: 1 November 2017
/
Published: 7 November 2017
(This article belongs to the Special Issue Big Data and Internet of Thing)
Abstract
:Modern irrigation systems utilize sensors and actuators, interconnected together as a single entity. In such entities, A.I. algorithms are implemented, which are responsible for the irrigation process. In this paper, the authors present an irrigation Open Watering System (OWS) architecture that spatially clusters the irrigation process into autonomous irrigation sections. Authors’ OWS implementation includes a Neuro-Fuzzy decision algorithm called FITRA, which originates from the Greek word for seed. In this paper, the FITRA algorithm is described in detail, as are experimentation results that indicate significant water conservations from the use of the FITRA algorithm. Furthermore, the authors propose a new communication protocol over LoRa radio as an alternative low-energy and long-range OWS clusters communication mechanism. The experimental scenarios confirm that the FITRA algorithm provides more efficient irrigation on clustered areas than existing non-clustered, time scheduled or threshold adaptive algorithms. This is due to the FITRA algorithm’s frequent monitoring of environmental conditions, fuzzy and neural network adaptation as well as adherence to past irrigation preferences.
1. Introduction
Effective irrigation of agricultural land is a very significant issue, not only addressed by areas and countries with limited water supplies. To overcome challenges such as water scarcity and seasonal shortage, numerous irrigation systems have been designed to automate the process. Most of those systems are composed of three distinct parts: (a) the environmental sensors component; (b) the decision-state machine component where the control logic resides; and (c) the actuator component [1].
Modern irrigation systems with excellent performance maintain less water consumption, while ensuring maximum crop productivity. This critical performance point is in most cases a tradeoff between water supply and gross crop production. The determination of this optimal point is hard to indicate since it is affected by a number of static parameters such as field elevation, slope and cultivation as well as dynamic parameters such as micro-climate conditions, seasonal plant diseases, soil enrichment and fertilization et al.
The already existent sensory-based irrigations systems include IoT actuators and sensors. The Koubachi Company (Zurich, Switzerland) offers a smart watering product that consists of a soil sensor and a central controller. It uses a self-learning watering algorithm with statically assigned weights [2]. Parameswaran and Sivaprasath proposed an Arduino-based smart drip irrigation system that is continuously monitoring pH, temperature and moisture levels [3]. Kumar and Srenivasa proposed an automation of Irrigation System based on Wi-Fi Technology and IoT [4]. Harunet al. proposed an IoT precision irrigation system for greenhouses, which use a wireless sensor network [5].
The implementation of smart algorithms into IoT devices, equipped with environmental sensors, has been developed, by setting aside existing time-scheduled watering algorithms and algorithms based on static on/off thresholds. Such simple IoT algorithms could lead to the increase of production from 25 to 30% while reducing considerably water excess [6].
The implementation of fuzzy [7,8] and neural network algorithms [9] to the irrigation process, also known as smart irrigation algorithms, has results according to human (Artificial Intelligent, A.I. algorithms)-driven decisions and not according to the calibration of static thresholds. However, such smart algorithms require a network infrastructure for cloud uploads, cloud storage and bi-directional data exchange between controllers and application services for post-processing evaluation of sensory measurements. No matter how promising the experimental results from such systems are, they still have significant complexity, scalability, interoperability issues, and big power consumption, all of which constitute expensive solutions for agricultural placement and present communication disruption problems.
By taking into consideration the irrigation plans, which are determined by the requirements of the agricultural land and are assisted by the IoT devices for precise agriculture, new adaptive, sensory-assisted decision algorithms and smart irrigations systems using A.I. logic have been implemented. A smart irrigation system is defined as a system that controls field irrigation without user interference. Smart irrigation systems are divided into two main categories: (i) the weather sensory adaptive; and (ii) and the soil moisture-soil sensory adaptive.
In the weather-based decision processes, irrigation decisions are based on feedback taken from a weather-monitoring system. Such a system collects data from sensors that measure the rain level, humidity, temperature, wind and solar radiation, located in the agriculture field of interest [10]. Weather feedback irrigation systems can monitor severe weather conditions in order to avoid irrigation in cases of extreme meteorological conditions [10]. Moreover, it should measure the rainfall and stop the irrigation when it starts raining. Solar radiation and leaf wetness are also needed in order to calculate the dehydration of the plants and the evapotranspiration [11].
In order to avoid the installation cost of weather stations, it is provided that some irrigation systems collect weather data from weather websites [12]. Specifically, such systems require Internet access through a 3G/GPRS/4G transponder. Using the LTE network the system could have access not only to historical weather data, but to future prediction models as well. The main benefit of such systems is that they can postpone a scheduled irrigation if though weather prediction is known that we are going to have a rainfall. As web-based irrigation systems have continuous access to the Internet, they can be monitored and real-time controlled through a website or a smartphone [13]. Furthermore, alerts and notifications can be sent from the system to the end user.
Another interesting category of smart irrigation systems is soil moisture sensor-based systems. Such systems measure the soil moisture using sensors [14] and decide whether irrigation is needed or not. Such systems are provided by companies such as Gardena [15] or Hunter [16] and implement static thresholds with delay transition irrigation algorithms. These systems are less accurate from the weather-based irrigation systems even if they measure soil humidity close to the plant root delivering plant water demands instantly. Their failure is mainly based on the implemented irrigation algorithms used. Another disadvantage of soil moisture systems compared to the weather system is that they cannot foresee future rainfalls or measure atmospheric conditions and provide an accurate prediction of plant water demands.
Experimental soil moisture systems are also presented at [6,17]. Authors at [17] suggest a new adaptive automatic irrigation system for arable areas, called Low-power long-Range Agriculture (LoRAgri). The LoRAgri system uses low-power long-range transceivers and gateways for data upload. Soil sensory adaptive systems’ decisions are based on either a neural network or fuzzy algorithm that have as input periodically collected measurements from a number of soil moisture and temperature sensors set on the field [6].
Furthermore, a hybrid smart irrigation system that combines web-based services for weather prediction and soil moisture sensors for direct and precise moisture measurements near the roots of the plants is presented at [18].
In order to achieve a proper and efficient function of a smart irrigation system, a proper wireless communication system, capable of controlling the actuators and the sensors, is required. This capability is covered by the RFM69, IEE802.15.4 Zigbee [19,20], LoRa and LoRaWaN technologies [21]. For deciding which wireless communication protocol is more suitable for IoT irrigation, many factors should be examined. Some of them are: cover range, power consumption, throughput, scalability, operational cost and security options. In terms of precision farming and irrigation, where the application areas may be located at distant places without a power supply, both the cover range and the power consumption are considered as critical factors. Table 1 shows the main characteristics of the wireless communication technologies mentioned.
According to Table 1, if power consumption is acritical factor, then Bluetooth LE (BLE) is the best technology. The main drawback of BLE is its limited coverage. Next eligible choices are the ZigBee or 802.15.4 capable devices [19,26]. IEEE 802.15.4 devices offer a cover range of 1000 m with 250 kbps throughput and current transmission consumption of about 65 mA [26]. If throughput is not as important as both high coverage and low power consumption, the most attractive technology is the narrowband, spread spectrum LoRa modulation or/and MAC layer LoRaWAN technology and infrastructure [27,28]. It offers more than a 15 km cover range at 5 kbps throughput with only 40 mA current consumption at transmission. If coverage distances are more than 15 km, the only available technology is 3G/4G technology. The main drawback of LTE technology is its excessive power consumption. Another drawback is the monthly subscription costs, which need to be paid to the provider.
The rest of the paper is organized as follows: In Section 2, authors analyze the proposed irrigation system architecture. In Section 3, authors describe the proposed FITRA algorithm and the OWS architecture network protocol over LoRa as proposed by authors, and in Section 4, the experimental results are presented.
2. Proposed Irrigation System Architecture
Authors propose a smart irrigation system based on equipment and technologies supported by the open source community. The system is called Open Watering System (OWS). The OWS system was implemented by focusing on low price, low power consumption and long-range coverage for data measurements transmission.
The proposed OWS system includes the following parts: (i) The microcontroller processing module (ATMega328P) that controls the sensors, the actuator that is responsible for data upload to the AS; (ii) the system soil moisture sensors; (iii) the actuator electro valve (servo-valve), with its attached sensors (luminosity sensor, temperature sensor and flow meter sensor); (iv) the communication transponder module and (v) the Application Server service (AS) for measurement storage, smart algorithm (FITRA) implementation and data visualization. OWS uses at least one soil moisture sensor [29] and up to 8 sensors, which are controlled by a cheap MCU controller unit. The limit of 8 sensors per actuator was enforced by the microcontroller’s capacity of 8 analog ports. If more analog ports are needed per actuator, a microcontroller with more analog ports can be used instead.
In Figure 1 and Figure 2, two versions of the proposed OWS system are presented. Both versions use the same set of sensors and actuator but different communication technologies. In Figure 1, the OWS implementation that uploads data to the Application Server (AS) using a 3G transponders presented. For the purpose of minimizing 3G excessive energy consumption, the sensory data are uploaded periodically using a static upload period Tp followed by a receive control interval Tk. During the upload and control intervals the data as described by the FITRA application protocol (see Section 4.3) are sent via the 3G transponder to the Application Service (AS). Afterwards the transponder enters the sleep mode until the next upload interval. The FITRA protocol header and payload are encapsulated over UDP and sent to the AS.
According to Figure 1, 3G technology is an easily deployed solution (ad-hoc) and exempts the user from maintaining a network infrastructure of its own carrying out the messages to the AS. However, as far as the implementation of Figure 1, authors observed the following disadvantages: (i) the costto the farmer of 3G provider services adds up; and (ii) it requires a significant amount of energy to operate autonomously. Specifically, it requires up to 6–10 times more transmission energy than narrowband LoRa, as shown in Table 1.
Focusing on finding a way to minimize the disadvantages of 3G OWS implementation, the OWS solution over LoRa was implemented by the authors (see Figure 2). OWS LoRa system uses a single-channel LoRa concentrator device called a gateway. The gateway was implemented using an RPi microprocessor [30], which is connected to the RFM96 LoRa transponder via the USB UART [31]. The RPi microprocessor is responsible for controlling the LoRa channel data uplinks from the actuator’s microcontroller as well as uploading the microcontroller messages to the AS via UDP using either Ethernet or 3G/4G Internet connectivity. Due to the long-range capabilities of the LoRa technology (see Table 1) the LoRa gateway can be installed into a location that provides both landline network connectivity and uninterruptible power, thus diminishing 3G provider costs.
According to Figure 2, the RPi microprocessor gateway system collects and uploads sensory data to the AS and receives control commands from the AS, as well as irrigation decision commands. It also controls the operation of the actuator’s microcontroller module by carrying forward the AS commands to the actuator’s microcontroller. The RPi gateway system also controls and forwards commands to all nearby microcontroller modules that are registered to the gateway. Proposed FITRA application protocol and its encapsulation over Lora are described in Section 3.2 and Section 3.3.
The actuator of the OWS system also includes on its hose top a digital flow meter sensor, connected to the AtMega328 microcontroller and it is used for measuring daily water dispenses. Moreover, the system includes a 1-wire DS18B20 temperature sensor and/or a luminosity sensor (an LDR sensor taking out one of the soil moisture sensor analog ports or an i2c luminosity sensor such as Sparkfun TSL2561), for identifying solar outburst intervals.
The microcontroller unit can adequately capture soil moisture, with the use of cheap analog sensors, provided by Sparkfun (Colorado, United States). The need of proper calibration is vital for each sensor prior to use. Each sensor is using electrodes, which can be lengthened up to 25 cm. Typical sensor measurements range from a value of 150 (slushy soil) to value of 1023 (very dry soil). Field clustered areas that can be adequately covered by one actuator controller and 8 sensors have been sized up to 100–500 square meters. The analog readings of the soil moisture sensors can be used to locally measure the volumetric water content of soil upon the perforce of manual calibration.
Soil moisture sensor depth can also be adjusted by using depth plastic regulators attached parallel to the sensor’s electrodes. Ideally the calculated values of soil sensors deployed into a cultivated field on the same monitoring depth are affected by the following parameters: electrode cable length from the soil moisture sensor controller, soil depth penetration, type of cultivated plants and soil chemical composition.
Based on the authors’ depth calibration measurements, the depth of electrodes may vary moisture sensor measurements with a variation of ±3% per cm for a min-max depth of no greater than 10 cm. Soil consistency is a constant parameter for the specific location of cultivated land where measurements have been taken. Furthermore, another critical parameter that the authors took into consideration is the sensor’s distance from the actuator. The sensors’ cable resistance over its length affects soil moisture sensor accuracy with a sensor analog value reduction of 3–5% per m, for a multi-core 20 AWG sensor-electrode cable length above 3 m.
3. Irrigation Systems Algorithms
There are different types of algorithms that can be used by the farmer at the AS. All these algorithms are mainly implemented at the microcontroller unit and they receive information about the thresholds and metric values from the AS. A short description of existing irrigation algorithms follows:
- Precise Time Controlled algorithm (PTC): This algorithm is an assisted algorithm either by the farmer or an external mechanism such as meteorological predictions. The farmer/external mechanism sets at the Application Service (AS) the precise time per month that the actuator will be set to the “on” state as well as the time duration that it will remain at this state. This algorithm may also use sensor measurements as feedback in order to perform adaptively, reducing daily watering time. It is the case that the sensors indicate an excitation value above statically set sensory thresholds PTCthres [3,10,13].
- Majority Vote Algorithm (MVA): MVA algorithm is similar to the LWA algorithm and requires more than two sensors (a majority of sensors to approve irrigation). MVA algorithm sets the actuator to the “on” position when the average value of the soil moisture sensors is above an Athres threshold value. MVA Athres and lower-upper bound sensor values are set by the farmer using the AS web interface [2,6]. For error detection, the MVA algorithm uses two boundary values, the Upper and Lower sensor value bounds. If the sensor’s value is above or below of the Upper and Lower values accordingly then this sensor is not taken into account by the MVA for the actuator “on”/“off” selection process.
- Exponential Weight Moving Watering Algorithm (EWMWA):This algorithm requires at least one soil moisture sensor and averages its sensor values based on the following equation: Sv = a·Svc + b·Svavg, where coefficient b = 1 − a. Coefficient a is a parameter that adjusts the current soil moisture sensor value influence on the final sensor value assessment, over the average sensor value. Coefficient parameter a value is between 0.1 < a < 0.9 and it is set by the farmer at the AS web interface. In case of multi-sensors, EWMWA algorithm follows the LWA algorithm approach and sets the actuator to the “on” position when the majority of sensor values ceil (N/2) + 1 is above Athres threshold value set by the farmer. Average sensor values are reset daily and re-calculated at the AS, based on the previous day measurements [6,14].
- Proportional Integral Control algorithm (PIC): This is a control loop feedback process based on an average daily water consumption metric value measured in lt or m3. The PIC algorithm does not use feedback information from soil moisture sensors but from a flow meter sensor placed before the actuator. In OWS architecture the PIC algorithm can be used at the flow meter placed before the actuator for the purpose of identification and reporting of erroneous states. The PIC algorithm uses a maximum water consumption metric Wm, set by the farmer at the AS. The PIC algorithm will reach up to that daily water consumption. In existing implementation of the PIC algorithm the watering time is also statically set by the farmer at the AS. When the PIC algorithm sets the actuator to the “on” state it starts to measure water consumption using the flow meter value Fv. When the daily Fv value is close to the Wm value or exceeds this value, then an error metric is measured as Errori = Wv − Fv/i per daily basis. All daily Errors are added to a total Error value: Errortotal = Σi=1nErrori. The n + 1 day on watering flow meter value Fvn+1 shall be set automatically as follows: Fvn+1 = K·Errorn + (K/n) Errortotal + (Errorn − Errorn−1), where K is a statically assigned gain coefficient and n are the n days of Fv flow meter measurements [7,8,16].
Irrigation algorithms, such as PIC, leave the “on” state decision to the farmer, using statically assigned watering intervals. These algorithms do not use external sensory feedback information and in terms of irrigation decisions are not intelligent at all. The PIC algorithm tries to amend by calibrating the watering interval. The LWA and MVA algorithms try to make decisions both for the watering time as well as the interval. Nevertheless, their decisions are not smart and therefore smooth enough and are prone to errors when the number of sensors increases. These algorithms may easily overwater or underwater a field.
The EWMWA algorithm is a better algorithm in terms of adaptive decision, since it takes into account averages of past watering data. However, the decision is based on statically assigned weights and if the decision is mainly taken from past knowledge, it may take a lot of time intervals to compensate for an overestimation that needs immediate compensation. Daily resets of average values are also an EWMWA drawback, since the average estimation always floats and fluctuates. Deep knowledge and immediate adaptation is a necessity in order to make the right decisions over time.
Apart from PTC, the LWA, MVA, PIC and EWMWA algorithms turn the actuator to the “on” position at a daily interval such as: summer at high temperatures, midday, or at a winter night at freezing temperatures. Such picked-up watering times may dry out or freeze the watering plants.
- Fuzzy algorithms: This category includes algorithms of fuzzy decisions based on a pre-defined set of rules and Degree of Membership calculations upon sensor values (metrics) [7,8]. Fuzzy algorithms are fast and smart adaptive algorithms and may also include error control capabilities similar to the PIC algorithm. Proposed by the authors, the FITRA algorithm is partly a fuzzy algorithm and when the irrigation system is in a stable state it is transformed to a neural network algorithm (NN) [32].
- FITRA algorithm: the FITRA algorithm is a neuro-fuzzy algorithm proposed by the authors and presented in a following section. FITRA at first instantiates as a fuzzy algorithm. Analytical description of the algorithm follows.
3.1. Proposed FITRA Algorithm Supporting the OWS Architecture
OWS architecture constitutes of a servo valve actuator and analog soil moisture sensors (maximum 8 sensors MCU controller A/D 10-bit chip), as shown in Figure 2. The analog sensors are connected to the 10-bitanalog-to-digital component of the MCU (ATMega328P 8-bit microprocessor). Analog values are mapped into 10-bit digital values that range from 0 to 1023. Based on the authors’ soil moisture sensor calibration field tests measurements, values less than 120 denote a soil sensor that measures water conductivity, while values greater than 1020 correspond to sensors that measure dry sand conductivity. Sensor values above 1020 lead the authors to infer that the sensors are open-circuited or lost ground contact. Sensor values bellow 120 are considered erroneous and such values are interpreted as short-circuited electrodes.
The average sensor values are stored to the MCU controller EEPROM and at periodic intervals are transmitted back to the AS with the use of a UART 3G transponder connected to the MCU SPI bus. The FITRA system actuator is a four-state servo valve. The valve has 3/4-inch diameter and is connected to a pressurized 5–7 bar water supply network. The valve has four placement states (expressed in valve rotation degrees): On(0°), off(90°), middle(30°) and little(60°). In the middle state the valve is half-open (actual hose diameter set to 1/2″ inch), while in little state the valve is opened with an actual hose diameter between 1/8″and 2/8″ of an inch. The actuator state transitions are controlled by the FITRA algorithm.
Authors propose a new adaptive algorithm for clustered irrigation systems called FITRA (named after the Greek word for seed). FITRA high-level functionality is illustrated in Figure 3. FITRA initializes its irrigation decisions based on a fuzzy control process. Except for the collection of satisfactory amount of irrigation data and corresponding daily satisfaction feedback indicated by a farmer, FITRA switches from fuzzy to a neural network (NN) irrigation process, with weights that are back-propagated from the farmer and confirmed as an exceptional seasonal dataset.
Each one of the OWS system soil sensors, which supports the FITRA algorithm, is a uniform analog soil moisture sensor. Calibration is required to define sensor boundary values that depend on the type of soil in the installation area and environmental conditions. After the experimentation part with the soil sensor for the identification of sensor–environment boundary values in temperate climate conditions of Epirus Greece, for fields of light slopes (<10°), the identified sensor boundary values were close to 130 (more than 120) for wet soil and close to 1021 (less than 1023) for dry soil. Intermediate values are spread out uniformly. Values of more than 1021 denote an off-the-ground open circuit sensor. While values less than 130 indicate short-circuited sensor electrodes or electrodes immersed into water without soil contact [33].
The FITRA algorithm uses a daily-calculated metric called Sum of Daily water Activity (SDA). The SDA metric is given by the following formula and its values are equal to the total daily irrigation minute time (number of minutes the actuator was set to on):
where isv_openi = 1 if the vane is opened the current minute i and 0 otherwise. The isv_openi binary value is evaluated by the actuator’s flow meter. Upon FITRA initialization, there is no knowledge about sensor relative position from the actuator valve and that position is statically assigned to be of: Close (C), Normal (N) or Long (L) distance from the actuator. Then FITRA algorithm enters the initial fuzzy state. It filters the soil measurement results, calculates membership functions from results based on a fuzzy process. When the outcome of the fuzzy process is confirmed it enters the neural network process. Using the fuzzy process output, it calculates neural network weights based on fuzzy training datasets. Concluding, the FITRA algorithm includes two main states: (i) the initial fuzzy state; and (ii) the neural network (NN) state (see Figure 3). A detailed description of the algorithm follows:
FITRA Fuzzy state: Initially the FITRA algorithm makes its “on” decisions using an MVA process with irrigation time partitioning based on two thresholds: Athres and Bthres (Athres < Bthres and Bthres − Athres > 250), set by the farmer, or calculated as 2/3 × 1023 = 682 and 1/3 × 1023 = 341 of the soil moisture sensors upper boundary value.If the average value of the sensors is under Athres the actuator is set to “off”. If the average value of the sensors is above Bthres then the actuator is set to “on”. If the sensor average value is between Athres and Bthres, a fuzzy control process takes place of four fuzzy input states per sensor: (i) adequate moisture; (ii) normal moisture; (iii) fair moisture; (iv) minimal moisture. There are also four fuzzy output states for the actuator: (i) “Off”: uε [−1, −0.5); (ii) “A few drops”: uε [−0.5, 0]; (iii) “Conservative watering”: uε (0, 0.5] and (iv) “Pour”: uε (0.5, 1]. The membership function for each one of the input states is calculated using the following Gaussian-like bell formula:
where σ is the daily standard deviation of each sensor values, k = 1.4 are the four input fuzzy states and for each state the ck coefficient value is calculated as follows:
Based on the inputs the fuzzy process interpolates them using Sugeno fuzzy inference for each crisp input MF value based on the following Equation (4):
where a = 1, b = 0.5, c = −0.5 and d = −1, are the constant weights for each one of the fuzzy inputs. If the output value u > 1 or u < −1 then the output value is set to u = 1 or u = −1 accordingly. Because watering decision is not dependent on only one sensor value, but on a number of N sensor values, the aggregated output U is calculated based on Equation (5):
If the output value U is “off” then the actuator remains to the “off” state. If the output value u is on the “on” or “a few drops” or “conservative” watering states, then from the U value Equation (5) the “on” watering time period Tw is calculated as follows (Twmin = 1 min, Twmax = 10 min set by the farmer):
FITRA immediate interrupt state: This state can either be enabled or disabled at the AS and requires a flow meter placed before the actuator. If the FITRA interrupt state is enabled then its state decisions have higher priority than of FITRA fuzzy or FITRA neural network (NN) states. That is, the FITRA interrupt state will interrupt the watering “on” decision and set an alert notification at the AS in one of the following cases:
- Identification and reporting of erroneous “on” states due to actuator misuse or malfunction.
- Identification and reporting of excess daily water consumption, when water consumed exceeds a certain high water consumption threshold Wthres.
- Identification and reporting of leaks when there is water flowing and the valve is in the “off” state.
For extreme weather condition irrigation interruption, FITRA uses the OWS temperature readings from the microcontroller one wire DS18B20 temperature sensor. Based on the temperature readings an ancillary fuzzy algorithm is used, called Watering Temp Control algorithm (WTC). WTC algorithm uses five input sets (Very Low Temperatures, Low Temperatures, Medium Temperatures, Normal Temperatures and High Temperatures) as shown in Figure 4.
Figure 4 shows the degree of membership [0, 1] of each fuzzy set over the crisp input temperature values. Based on the degree of membership (DOM) and using linear interpolation for the temperature value measured, the corresponding sets and the degree of membership is calculated. The maximum DOM value criteria are the assignment criteria for a crisp input to the most significant set. The watering decision control inference based on temperature (Watering Temp Control WTC) is performed as presented in Table 2:
“Little on” and “middle on” state references in Table 2 define the actuator’s servo rotation angle. That is, if the actuator valve is a servo valve actuator, then when the irrigation decision is “on” and the interrupt state decision is “little on”, the actuator is rotated only a few degrees towards the on actuator position (25–30°). If the irrigation decision is “on” and the interrupt state decision is “middle on” then the actuator is rotated up to 70° towards the “on” actuator position (90°).
FITRA Neural Network decision state: the FITRA algorithm is capable of maintaining seasonal data per day, per week, per month and per year at the Application Server. These data include timestamps, sensor values and “on”/“off” actuator state values. Upon an adequate dataset recording, the farmer can select and assign for the following months or weeks either a per month or a per week training dataset from the Application Server database. If such a selection is performed, then a FITRA Neural Network (NN) process is instantiated, using N sensory inputs (8 ≥ N ≥ 2), according to the number of soil moisture sensors used. This NN process includes a three node neuron input, one hidden layer and two node outputs. The FITRA NN process is depicted in Figure 5.
In the FITRA NN process, each one of the soil moisture sensors is classified as a member of one of the three input neurons, based on the sensor-actuator distance set by the farmer using the Application Service web interface. There are three distance classes: (i) the close actuator distance class; (ii) the normal distance class; and (iii) the long distance class. The hidden layer maintains three neurons that include the weights calculated using back-propagation from the training dataset. The final irrigation output is taken from two output neurons. One corresponding to the “on” actuator value and one to the “off” actuator value. The NN weights are trained using those elected by the farmer seasonal dataset and the back-propagation method is used. Upon training, the FITRA NN follows its own watering decision for the interval assigned, re-calculating and adjusting its weights accordingly.
Each one of the N sensor value inputs is assigned to a specific distance level class. Each class signifies the sensor’s distance from the actuator. The classes are the: (i) close to actuator (Close to Controller, CC); (ii) normal to actuator (Normal to Controller, NC); and (iii) the far from actuator (Distant from Controller, DC). The input classification is not so critical for a watering system of uniform pressure. However, for non-uniform pressurized systems it is quite important for the classification to be performed accurately. The classification is performed in a semi-automatic way by setting the distance of each input from the actuator in meters (m). Then the distance is normalized based on Equation (7):
The distancei metric values are measured in meters. If a sensor’s distance is the maximum distance in the system and Di > 0.4, then that sensor belongs to the far from actuator class (DC). The Close level Class the sensors belong to those that are in a close proximity of the vane. That is: Di ≤ 0.1. In the normal level class all sensors are set to be at a normal level distance from the vane 0.1 < Di ≤ 0.4. The number of sensors that belong to the normal level distance class can also be calculated as the remaining number of sensors: .
In order to present the FITRA algorithm neural network (NN) process in a complete manner, the authors assume that both N = 8 sensors are functional and send measurements to the Application Server (AS). The steps described below are the steps performed by the FITRA neural process. The FITRA neural process forward steps are also depicted in Figure 5. The FITRA process includes one hidden layer and perceptions with no bias, where neural weights are calculated: Weight ai and a P-distance indexed weight value pi.
FITRA NN Step 1: FITRA synaptic weight values ai, i = 1…N are calculated using a back-propagation process assisted by a selected watering dataset by the farmer for its satisfying watering results. Prior to ai calculations and based to actuator distance classification process, all sensors are classified by the system into the three classes (CC, NC, DC). According to Figure 5, U1.8 are the values of the N = 8 sensors and aL, aN and aC are the mean u values of each one of the three classes DC, NC and CC accordingly. These values are calculated based on Equations (8) and (9), where ath is the fuzzy process Athres value:
The per-sensor ai measured value classification control process sets ai values into the following two categories:
Category 1: . In this case, the ai value represents a sensor correctly placed to a class close or far from the average value for each class accordingly.
Category 2: . This is an erroneous sensor value case where the value ai is close to the threshold value Athress or too far away from the threshold value, but the mean value of ai values in that class are not close to the threshold value. In that case sensor i measurement is set as an erroneous measurement. The i sensor value is removed from the next round calculation process and is re-calculated for that class.
FITRA NN Step 2: With the assumption that all sensors fall into Category 1, that is, all sensors are correctly classified and with the use of ai values as input, the back propagation process initiates based on the training data set. Since ai values are greater than 1, there are normalized with the mean class aC, aN, aD values, giving a normalized ci value calculated as: , where 0.1 ≤ ci ≤ 4. For the forward NN pass the pi values of the hidden layer perceptrons are calculated as:
And then the results are squashed using the logistic function: . The same process is repeated for the output layer neurons: , where So is the metric value of the valve set to be open while Sc is the metric value of the valve set to be closed. The max (So,Sc) signifies whether the actuator should be set to “on” or “off” position accordingly. The total error and errors for So and Sc for the backward pass are calculated using Equation (11):
where U is the value taken for FITRA fuzzy process Equation (5). If Etot ≤ 0.05 then the back-propagation calculation process terminates and the weights w, w′ and w″ are used for the forward pass neural network process.
FITRA error correction state: In FITRA NN state, another error assessment mechanism is used on a daily basis (similar to PTC algorithm). This mechanism records the total daily watering time DTw and compares it with the average daily watering time DavTw, as calculated from the training DavTw dataset. If |DTw−DavTw| > 0.05, then the NN training dataset is considered to be erroneous for this season, the NN state is abandoned and the fuzzy state is initiated for the following day. Moreover, in such case an appropriate message is set at the AS web interface in order for the farmer to re-train theneural network.
3.2. FITRA Communication Protocol
The FITRA communication protocol uses LoRa radio as its physical transmission medium. LoRa is a long-range and low-power communication protocol. It was developed by SemTech (Neuchâtel, Switzerland) and it is the prevailing technology for IoT networks [34,35]. LoRa EU radio frequencies are in the ISM band of 868 MHz and 433 MHz. The 868 MHz band LoRa uses seven channels [0–6] of 125 KHz bandwidth, followed by two 250 KHz special purpose channels and a RX2 channel [36,37]. The 868 MHz band is mainly used inurban areas forming the smart cities IoT grid. For agricultural applications, the 433 MHz band can achieve better distances with less attenuation over distance. Nevertheless, in the 433 MHz band the channels that can be used are limited to three channels: (433.175 MHz, 433.375 MHz and 433.575 MHz). Moreover, even if the specification defines the 433 MHz LoRaWAN band use, existing devices in the market utilize only the 868 MHz band for LoRa Mac layer and infrastructure.
The LoRa radio medium includes a higher data link protocol called LoRaWAN. LoRaWAN protocol is standardized by the LoRa Alliance [37] and so far include three protocol transmission classes: (i) Class A for synchronous periodic transmission with reception windows; (ii) Class B that sets periodic reception windows set by LoRaWAN gateways; and (iii) class C that extends class A by keeping the receiver window open until next node periodic transmission [21,28,37]. Apart from the class-based collision avoidance mechanism, LoRaWAN also includes adaptive rate transmissions, specific infrastructure, addressing, security provisions and management capabilities [21].
LoRaWAN addressing is based on a 64-bit unique identifierdevice and a 64-bit unique application for the application devices identifier. It supports join requests (ABP and OTAA) to the gateway send to the Application service backend [21,28,36]. LoRaWAN security is based on three security keys set for the application, the network and the session. The encryption algorithm used is the AES-128 [36,37]. LoRaWAN includes a frame integrity code called MIC (Message Integrity code) similar to radio physical layer checksum. MIC uses the AES-CMAC algorithm. It also includes frame counters at the gateways in order to prevent frame replay attacks [37].
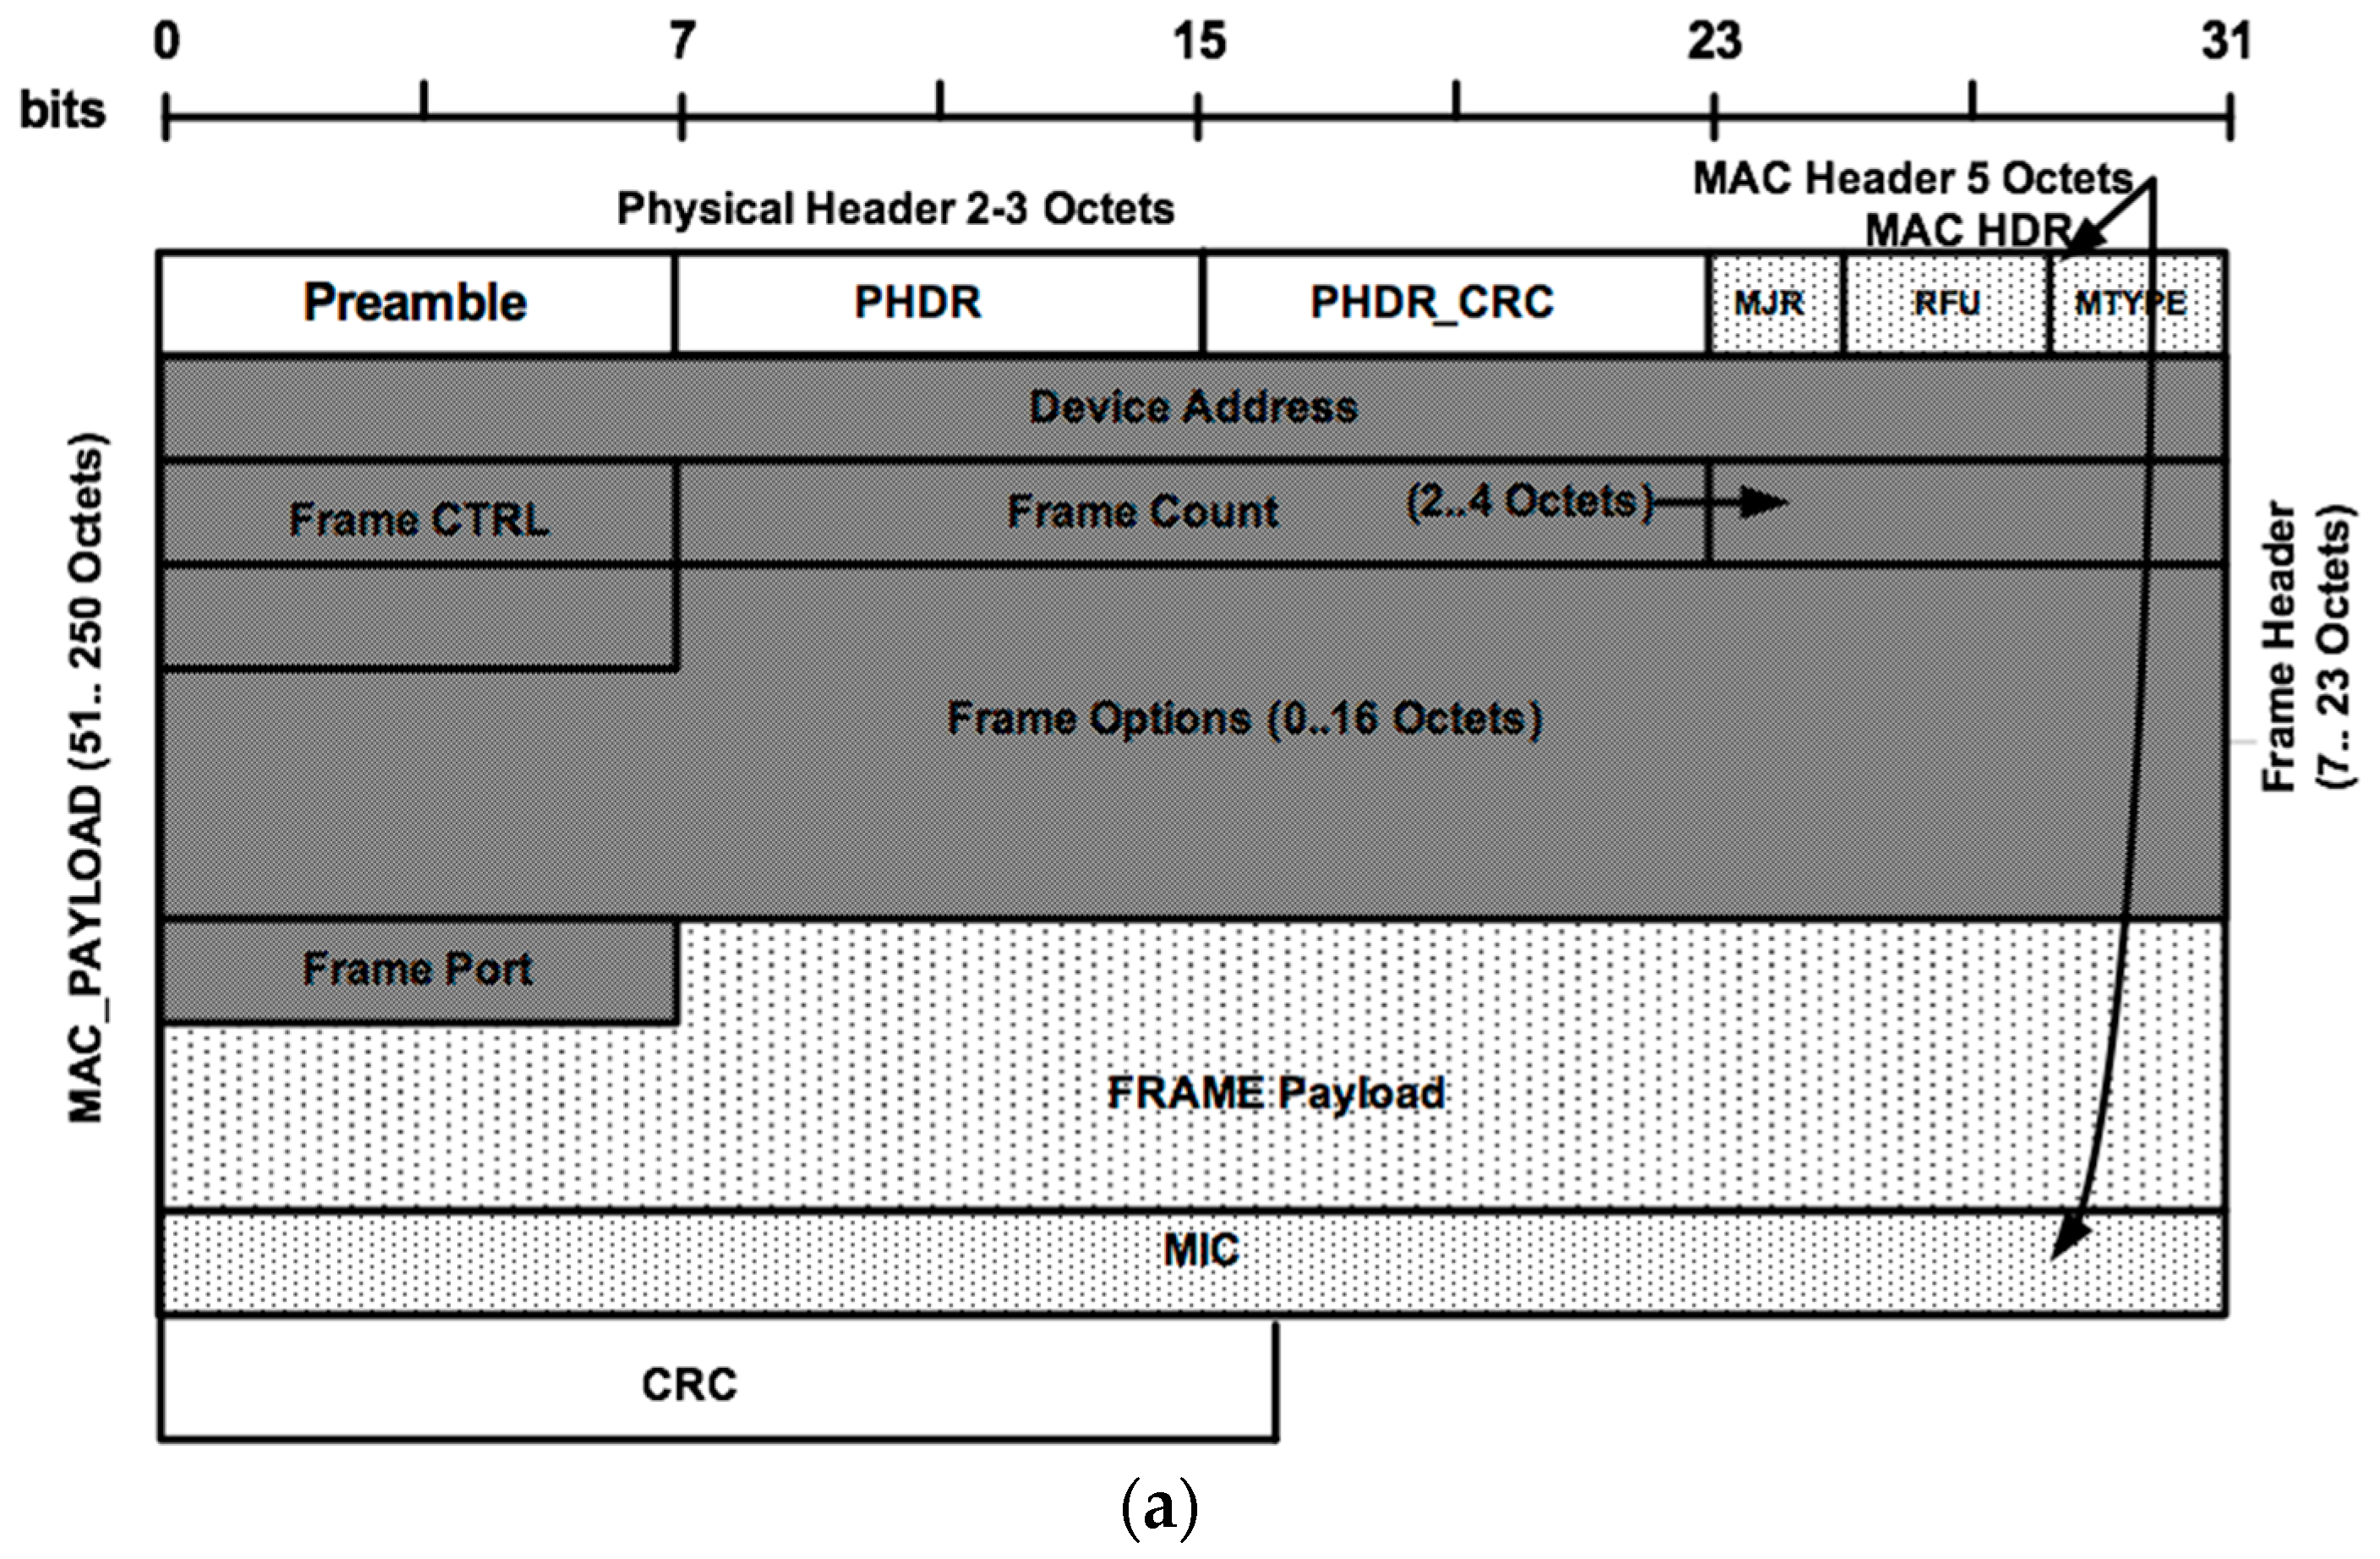
LoRaWAN also maintains an adaptive data rate mechanism for the control of the end nodes data rate transmission [36,37]. The PHDR fields for LoRa physical layer data transmission and LoRaWAN packet structure for class-A data transmissions are presented in Figure 6a.
Focusing on LoRa radio only, LoRa physical layer frame is consisted by a 1-byte 0 × 34 value preamble (8 bytes if LoRaWAN MAC header is included), followed by PHDR and PHDR_CRC field. PHDR contains the frame length in bytes, the coding rate CR value (1 byte) and the existence or not of a 16-bit CRC field apart from PHDR_CRC for CR [4/5…4/8] [37]. The PHDR contents apart from CR field (Flags) used by LoRaWAN higher protocol, maintains a 1-byte synchronization preamble, low-level source address, destination address, message ID and flags Field (where CR value is set) [37].
LoRaWAN protocol strengthens LoRa radio integrity, security and scalability. However, for non-urban areas where 433 MHz transponders adequately perform, there is no existing infrastructure support in terms of gateways nor a full stack implementation of open source LoRaWAN over 433 MHz radio. The 433 MHz band limited available channels are left to the amateur radio developers in order to implement data protocols using the physical LoRa medium.
The authors suggest that the FITRA communication protocol over LoRa radio does not use the LoRaWAN MAC layer implementation and uses only the physical layer header implemented for the RH_RF95 devices [22,31]. The RH_RF95 LoRaRadioHead physical header is shown in Figure 6b and includes the following fields:
- Preamble consisted of 1 octet for synchronization purposes.
- LoRa concentrator destination address (1 octet), which is the address of the LoRa gateway device. The number of 0xFF, while 0x00 is the network broadcast address. Since the address fields are 1 octet long there is a limitation of 253 devices under single LoRa radio channel concentrator control. For the three default channels of the 433 MHz band there can be used up to three gateways and a total of 759 devices.
- Source address (1 octet).
- Message ID (1 octet), used in order to differentiate different messages derived from LoRa devices. The Message ID field is set to 0x00 for the FITRA protocol implementation and the message differentiation was moved to the application layer FITRA protocol.
- Flags (1 octet). Flags include one ACK bit, which indicates whether it is a normal or an acknowledgment frame, then there are 3 reserved bits for future use and the last 4 bits have the value of 0x08 that indicate that the payload that follows is part of the FITRA application protocol.
- Frame CRC field (2 octet).
On top of the physical header the authors implemented the FITRA application protocol as shown in Figure 6b.
The FITRA Application protocol includes the following fields:
- (1)
- Application ID field uniquely identifies all FITRA actuator controllers, controlled by a single-channel gateway. The purpose of the Application ID is to differentiate among controllers that are controlled by different gateways placed on the same agricultural area of interest. Gateways only respond to messages received from actuators with the same application ID. Application ID can also be characterized as network ID, giving the system the capability of maintaining up to 256 gateways on the same channel.
- (2)
- Valve ID is a 1 octet field that uniquely identifies each actuator controller, controlled by a gateway. With reserved values of 0x00 and 0xFF this identifier limits that number of actuators per gateway to 253 (a limit set by the physical layer RadioHead library. See source and destination address Figure 6a).
- (3)
- Sequence number is a 16-bit value, incremented by the actuator controller upon successful reception of an ACK FITRA frame. The initial sequence number is randomly generated.
- (4)
- Valve status field indicates the current valve status. A status value of 0x00 means that the actuator is at the “off” position and a value of 0x01 that the actuator is at the “on” position. A value above 0x01 indicates a partly open valve. Then the value corresponds to the rotation degrees that the valve is open (if the actuator is a servo actuator value then the rotation degree angle increases 0.7°/value) or the steps that the valve is open (if the actuator is a stepper one—up to 253 steps/180° rotation angles). 0xFF value indicates an erroneous valve status.
- (5)
- Sensors LEN field indicates the number of sensor values included in the frame payload. It also indicates weather the sensor is in a disabled state. For example, a value of b00110101 indicates that the payload shall include 4 sensor values for sensors 1, 3, 5 and 6. The other sensors are in a disabled state either due to erroneous readings or non-existent ones.
- (6)
- Sensor value vector field is a variable-length field, whose length is determined by Sensors LEN field. In this vector the sensor values are placed and for each 10-bit sensor value a 2 octet value field is used.
- (7)
- Monitor day field is used to indicate the actuator’s monitoring day. Each system actuator is capable of storing to its EEPROM up to 256 days of “on” valve time statistical data (1 byte long), starting from day 0 (actuator startup day) up to day 0xFF and start over again from day 0. If signaled by a gateway ACK frame the actuator can send the daily on valve value in minutes for a specific day. By default, the actuator transmits only the “on” valve time value of its current counted day. Since these values are stored to the EEPROM, in case of power outage, the actuator controller can identify from its EEPROM the last EEPROM address that has a value different than zero as the current count day. If all EEPROM addresses have values different than zero then the controller zeros all EEPROM values and starts from day 0.
- (8)
- Valve on Time field is a statistical field that indicates the minutes that the actuator was in a position other than “off”. It is a 1 octet value meaning that the maximum daily “on” actuator time cannot exceed 255 irrigation minutes per day (4.25 h/day). If this happens then the valve on time field does not overflow to zero but it remains at the value of 0xFF.
For each transmitted LoRa frame by the actuator controller using the FITRA application protocol, an appropriate acknowledgment packet is send back through the FITRA gateway. The response ACK packet is illustrated in Figure 6c and includes the following fields: if it is a single ACK packet, then it includes the gateway Application ID the actuator’s valve ID, and the ACK number which is the same as the transmitted frame sequence number that this ACK frame responds to.
Apart from acknowledging frame reception, the FITRA protocol is capable of sending commands to the actuator. There are three types of commands that the FITRA protocol supports: (i) statistical commands; (ii) actuator control commands and (iii) both statistical and control commands:
Statistical commands include the monitor day request field and use padding of 1 for the values of next status and next tx interval fields. The monitor day request field pinpoints to the actuator the day that the actuator will send on its next frame upload its valve “on” time in minutes.
Control commands may include one or more of the following fields:
- (1)
- Valve next status field: This value corresponds to the actuator’s valve status. If the value is 0x00 then the actuator has to be set to “off” state immediately. If the value is 0x01 then the actuator must move to the “on” state. Any other value between 0x02 and 0xFD indicates either the degrees or steps that the actuator must set the servo or stepper valve state.
- (2)
- Valve next transmission interval value: This value increases or decreases the actuator’s periodic data transmission interval. In case of nodes frame collision or node frame loss, the gateway is responsible for modifying microcontroller nodes processing module transmission periods in order to enforce an adequate data transmission gap upon devices registered in the network. The microcontroller node next transmission interval value is a 2 octet value and is measured in seconds. This gives as an approximate maximum increase or decrease (Δtx) of periodic transmission interval up to 18.2 h: Tperiod = (Tp + Δtx) + Tk + Toff, where Tp is the statically assigned microcontroller processing module period, Tk is the receive device time usually set to 1–2 s and Toff is the channel idle time restriction set by the ITU for the 433 MHz band. The ITU restriction for LoRa transmissions on the 433 MHz band is of 1% duty cycle channel utilization. This means that the same 43 3 MHz sub-band cannot be used by the same transponder again for duration of Toff seconds: Toff = (Ttime_on_air/0.01) − Ttime_on_air. For FITRA communication protocol the Ttime_on_air ≤ 128 ms, thus giving a maximum Toff value of: Toff = 12.672 s. A value of 0xFFFF indicates no transmission interval variations (Δtx) for the device.
3.3. FITRA Protocol Logic
The FITRA communication protocol is an application protocol that relaysits network and transport capabilities into lower RF96 LoRa MAC protocol capabilities. Its protocol logic is independent from lower-layer protocols. That is, the FITRA protocol can be encapsulated on top of both GPRS TCP/IP stack and RF96 LoRa radio stack.
FITRA protocol logic includes the following: (i) registration to a gateway or to a GPRS service provider; (ii) periodic measurement uploads to the Application Service (AS); and (iii) AS statistical frames and AS control frames send to the actuator’s microcontroller. Apart from LoRa frames, FITRA application protocol can also be encapsulated over UDP packets for the purpose of data transmission over GPRS or Ethernet links.
The FITRA application protocol node registration is based on the protocol Application ID value. All nodes (microcontrollers attached to actuators) that belong to the same farmer have the same application ID value to their frames and a different valve ID value for each irrigation cluster accordingly. Upon reception of a FITRA frame with a new valve ID, the AS recons the existence of a new FITRA node in a farmer’s network, updates its nodes table for that network and acknowledges that frame. If a node does not upload data for an interval called maximum periodic interval (1 h ≤ Tperiod_max ≤ 24 h) then that node is considered to be non-reached and is removed from the AS table of known network nodes. If a node’s transmission interval is close to Tperiod_max(0.9Tperiod_max) then the period control process is initiated for that node.
The FITRA statistical information report frames include the “on” request report of watering minutes per day from the node to the AS. The AS sets the request day in the past using the Monitor Day request field of an acknowledgment frame. Then the node responds by setting both the monitoring day field as well as the valve “on” time field on the next periodic interval frame.
The FITRA application protocol acknowledges each received frame and monitors frame flow per node using a sequence numbering schema. A packet loss is indicated if the next frame sequence number is bigger than the previous ACK frame acknowledgment field value. If this difference is more than a value of maximum interval frame loss (3 ≤ MIFL ≤ 10), then the period control process is initiated in order to increase the node’s transmission period.
The FITRA AS control frames include two distinct control commands: (i) the decision for the next interval watering command send back to the node using the ACK valve next status field; and (ii) the period control command (Δtx). The period control process is initiated for nodes of long periods close to the maximum periodic interval or experience frame losses, in order to modify their transmission intervals.
Performance comparison results of the two different OWS implementations proposed both using the FITRA protocol are presented in Table 3. This experimental scenario included two nodes, one using the OWS GPRS infrastructure (Figure 1), sending UDP data streams to the AS and one using the OWS LoRa infrastructure (Figure 2), sending LoRa frames to the AS. Both nodes were equipped with a 5 Ah–6 V battery, placed on the same irrigation field. LoRa node distance from the gateway was set to 1 km. The performance metrics that have been measured were the total number of packets sent to the AS until battery depletion and the average round trip time (RTT) of each frame send and corresponding ACK frame received, measured at the microcontroller nodes.
From the experimental results, it is obvious that the LoRa capable OWS system node achieved 5.4 more total frames transmission that the GPRS OWS system node, until battery depletion. Both nodes were using the FITRA protocol. The existence of an intermediate node (in our case the gateway for the LoRa OWS system set 1 km away) for the operation of the LoRa OWS system, increased the RTT frame time of the LoRa node up to 100–160 ms. For a watering system, such RTT variations are not significant. Moreover, closer gateway placements of less than 1 km can further increase frame count and decrease by more than 50% the Lora average RTT time.
4. Experimentation and Evaluation Results
In order to test and validate the FITRA irrigation algorithm, the authors constructed two similar independent OWS systems, one using the MVA algorithm, and another using the FITRA algorithm. Both systems utilize 8 ground moisture sensors that have been scattered into two neighboring fields of 100 m2 accordingly. The position of the sensors relevant to the actuator was almost identical for both systems. The high-level architecture of the two OWS systems was similar to that of Figure 2. The only distinction of the two irrigation systems was the decision algorithm that controls the actuator. In the first system the decision algorithm was based on the majority algorithm (MVA), while in the second system used the proposed by the authors’ fuzzy state and then NN state of the FITRA algorithm. The thresholds (Athress) for the soil moisture sensors were set to 700, since the sensor produced values between 130 and 1023. The 1023 value corresponds to total dry ground while the 130 value corresponds to muddy ground. The threshold 700 (≈2/3 × 1023), was chosen and the plantations used was that of tomatoes using the same tomato variety (Belladona). The authors used 100 tomato plants per field, using sparse planting of 60 cm horizontal plant distance 120 cm vertical row distance (statistically 1 plant per square meter). Values from the ground moisture sensors, actuator states and water consumption has been monitored and stored to a MySQL database at the Application Server. The experiment lasted 150 days (March–July 2017). The first four months, March–June, used the fuzzy FITRA algorithm, while the other month (July) used the neural network FITRA algorithm implementation, with the March month dataset as the training dataset.
4.1. Water Consumption Results
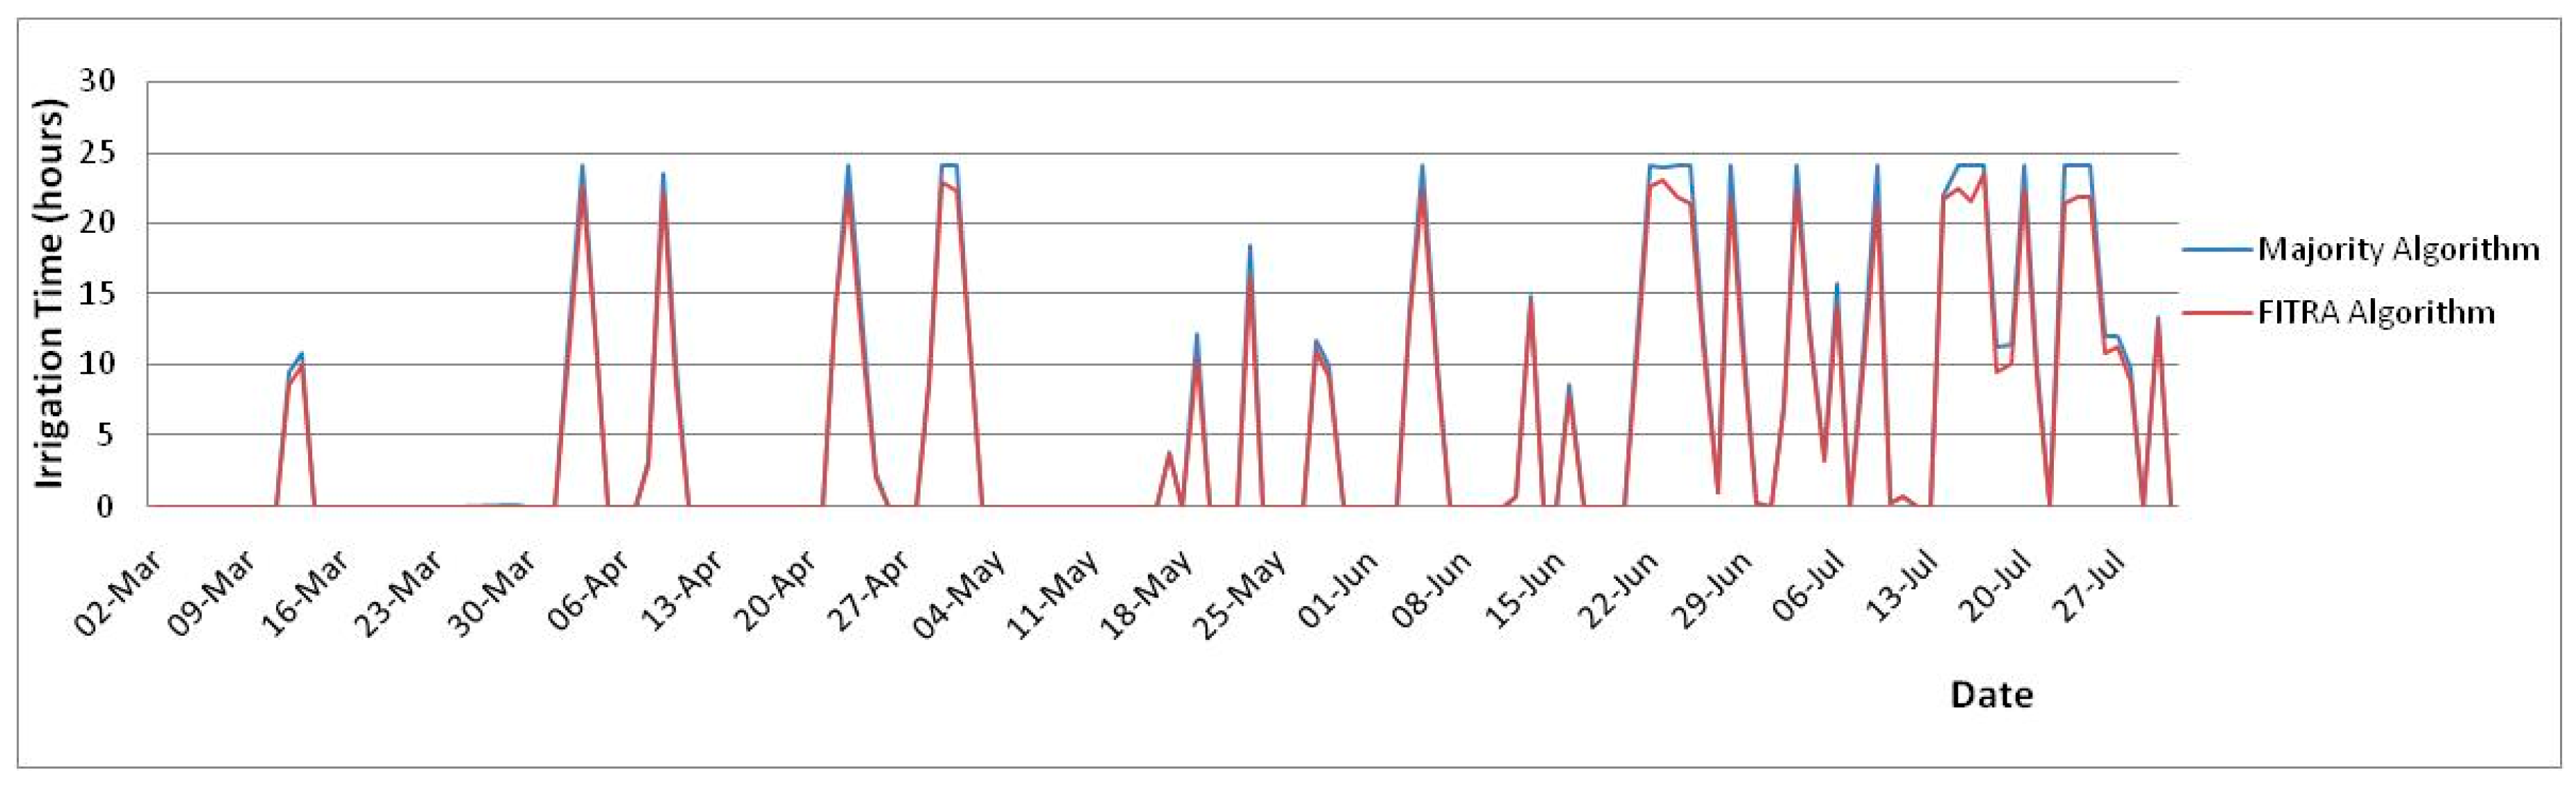
From the experimental results, Figure 7 depicts irrigation time in minutes per day for dates from 2 March 2017 to 31 July 2017 for the majority algorithm. It is obvious that as we move towards the summer the irrigation time per day constantly increases, with the exception of heavy rain days (30 June and 11–12 July).
The total irrigation time for the first scenario using the MVA algorithm was 883.9 h for a period of 150 days, which results to 5.89 h of irrigation time per day. The watering time for the second scenario was 821.36 h, which corresponds to 5.48 h of irrigation time per day. The FITRA algorithm saved 62.54 irrigation hours, which results in 7% less water consumption for the same and even better confirmed tomato plantation results. Tomato crops per field gave an average of 7.8 kg tomatoes per plant per month for the MVA field and 8.9 kg tomatoes per plant per month for the field using the FITRA algorithm (production increase of 14%).
4.2. Ground Humidity Results
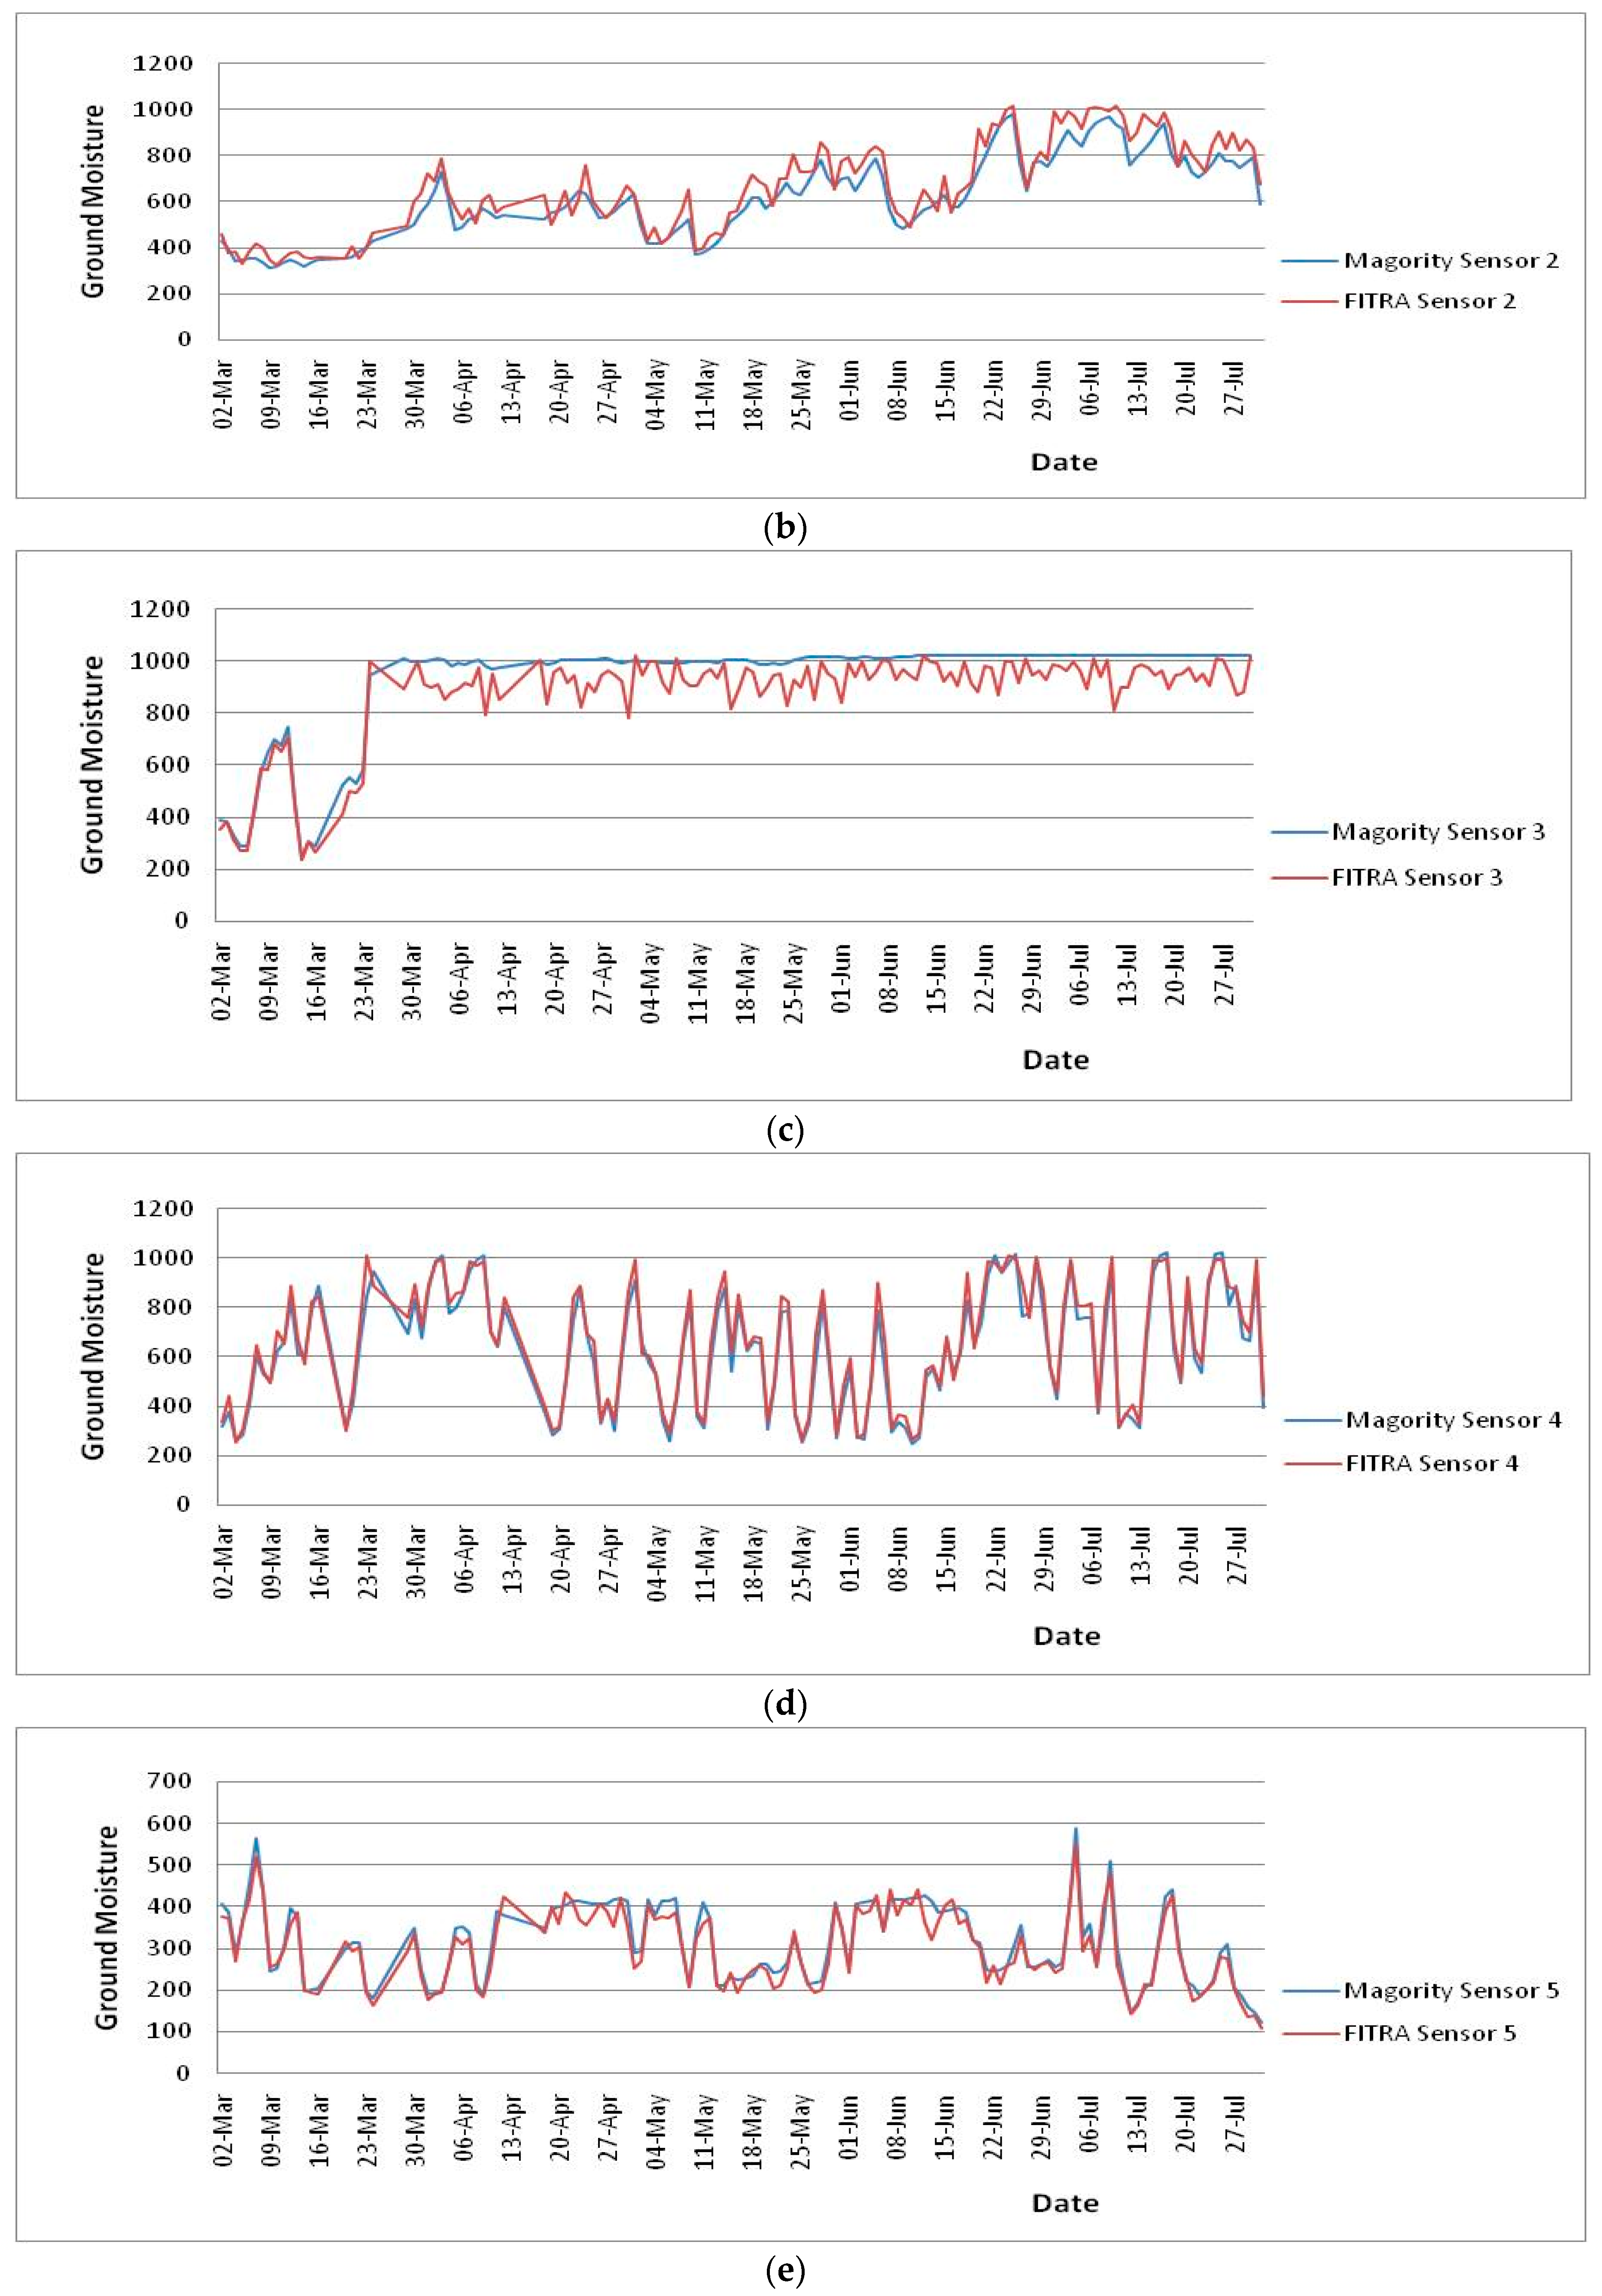
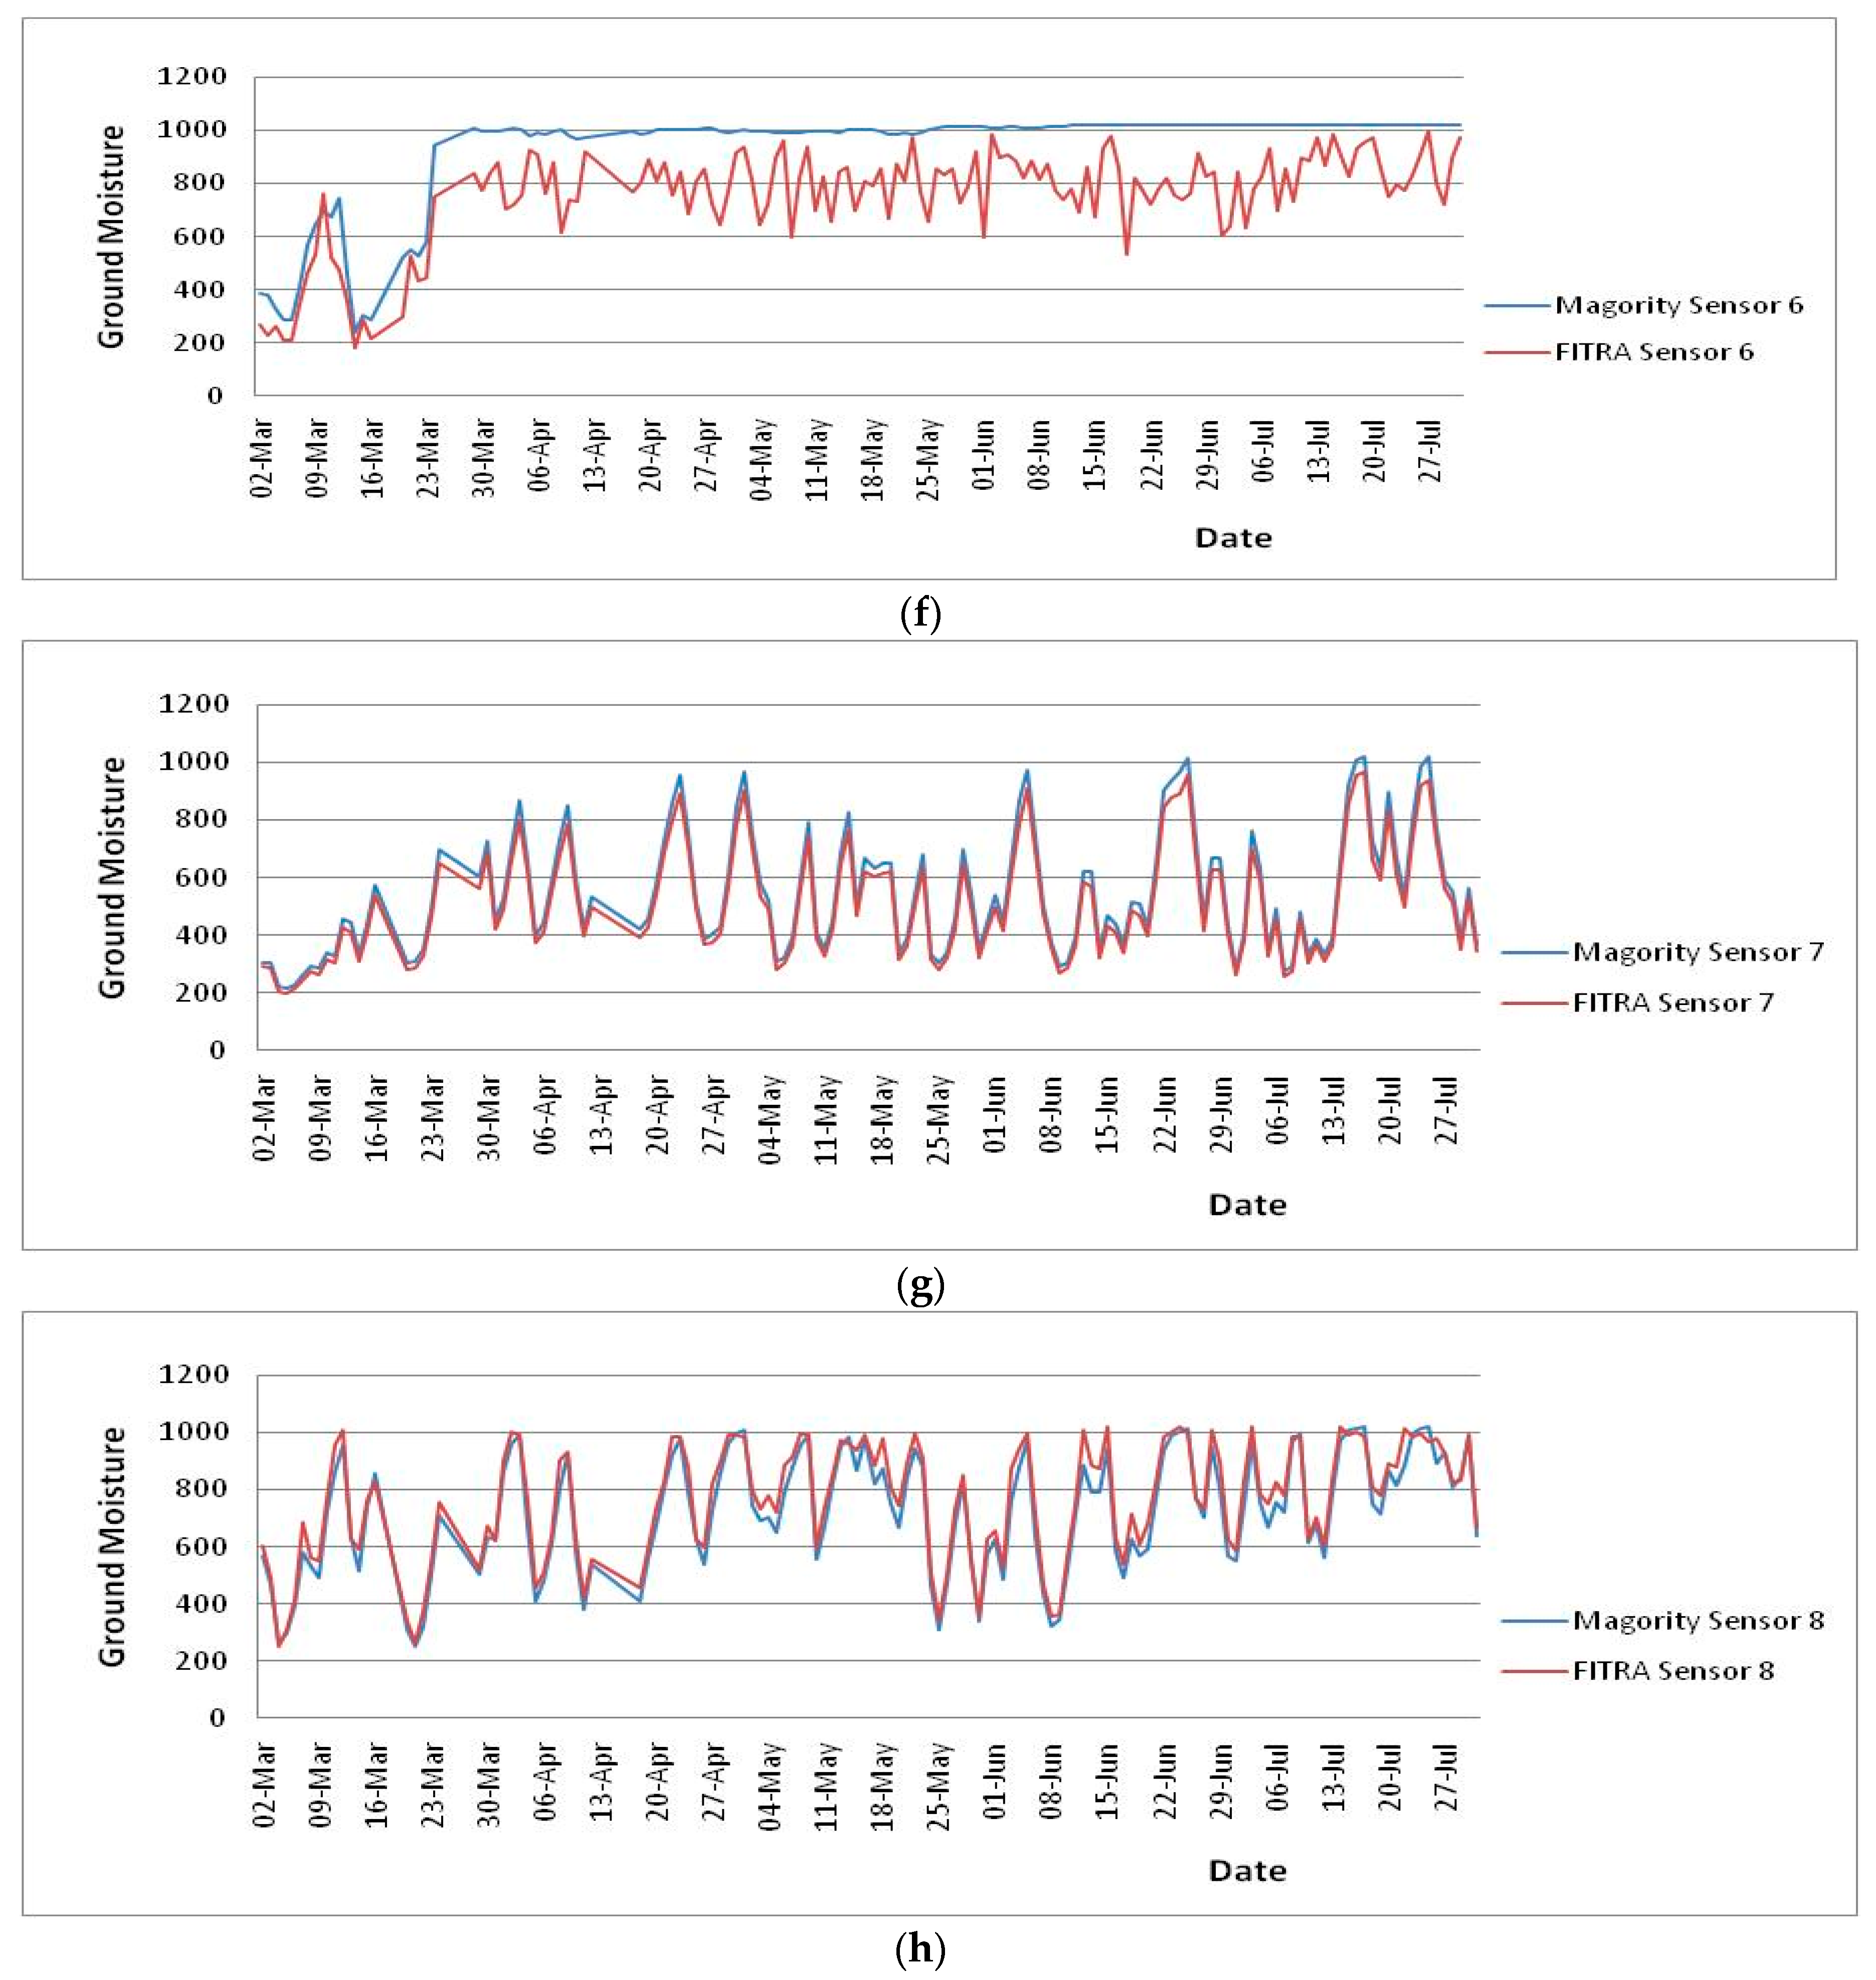
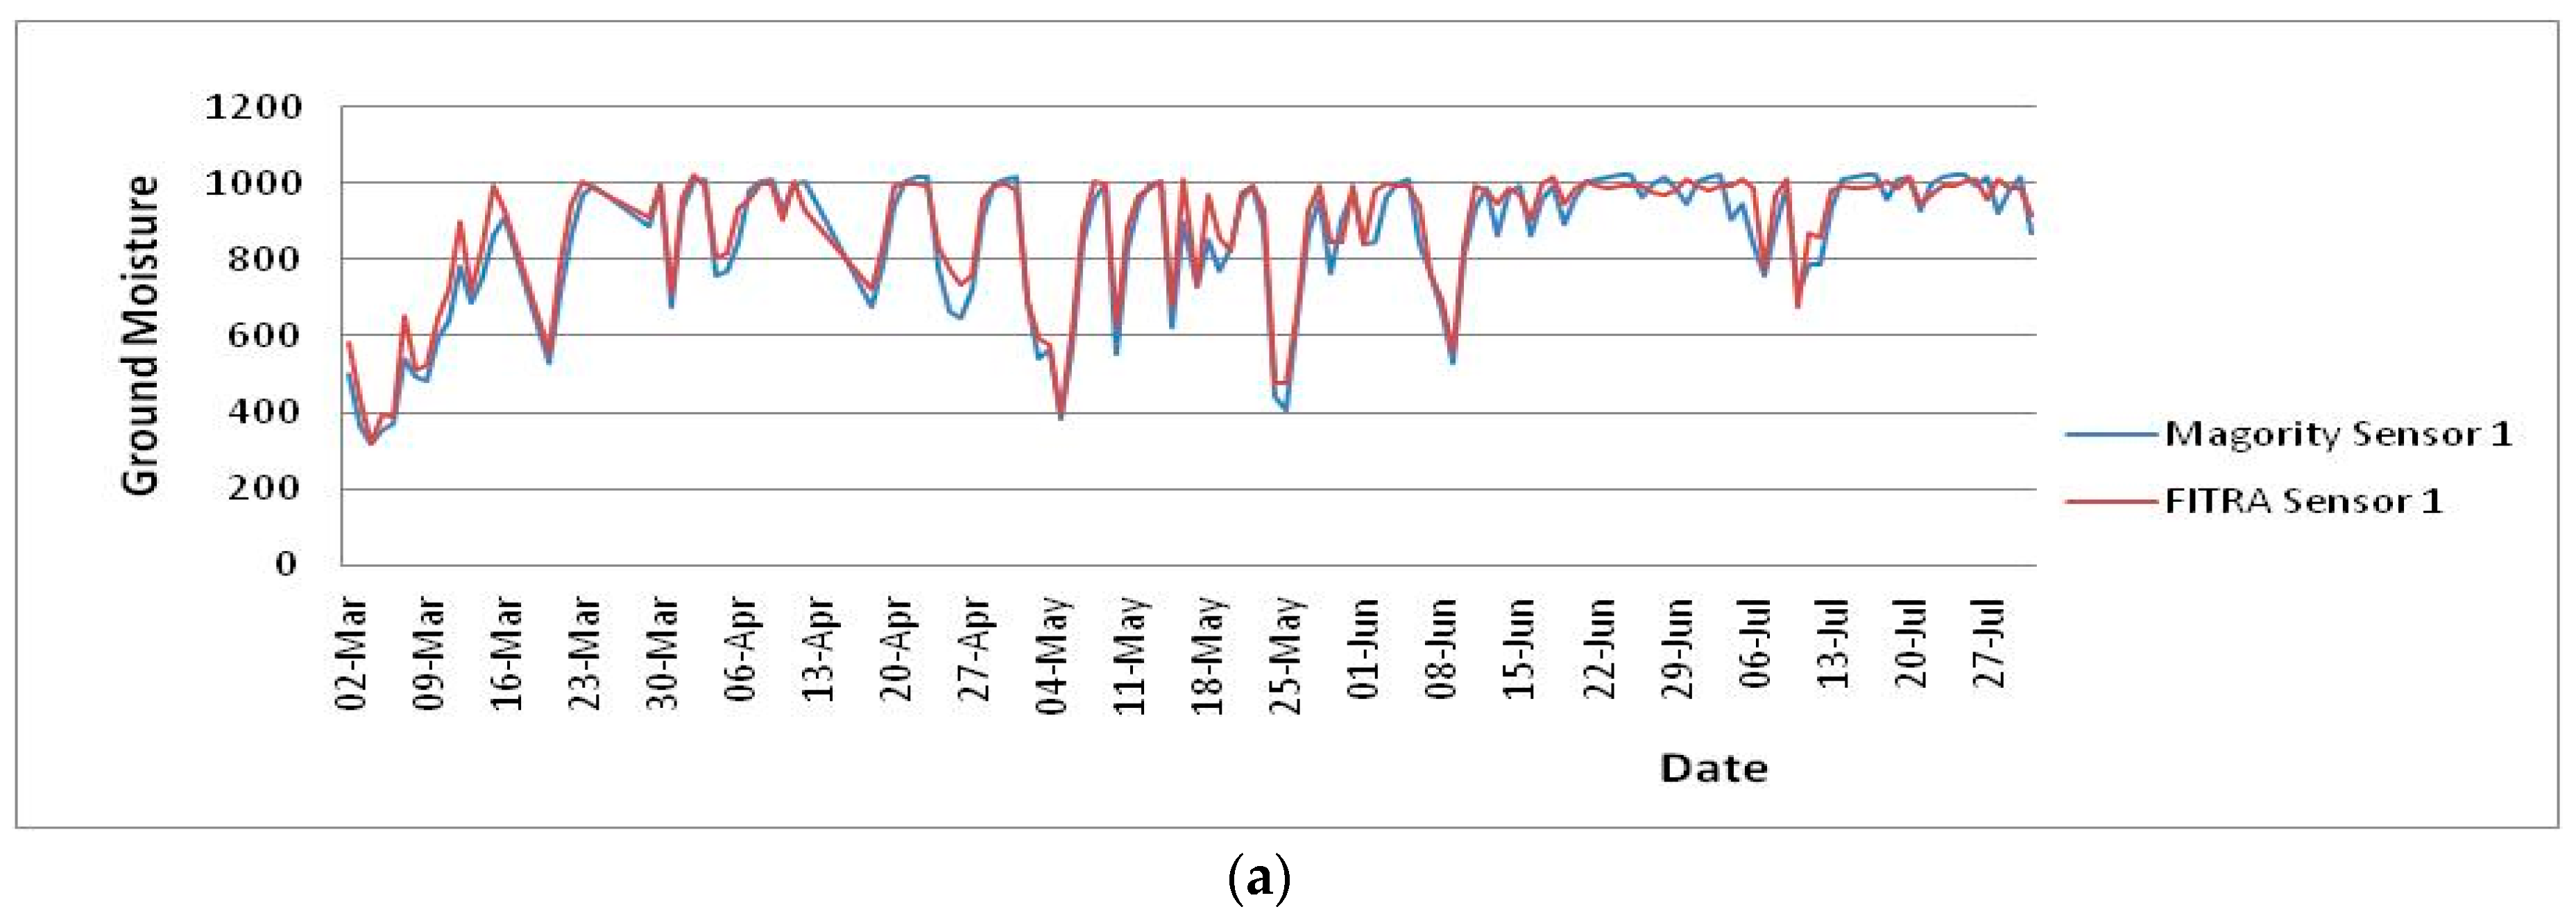
The average value per day of each ground humidity sensor for the two scenarios are depicted in Figure 8a–h.
Both MVA and FITRA behave normally according to the previous figures. The only figures where two sensors of the MVA algorithm group of sensors present an erroneous and upper boundary sensor behavior are in Figure 8c,f. In these figures the electrodes of these two sensors have been blocked and left open-circuited. The authors deliberately left this malfunction of those electrodes to carry on, as they wanted to test the error control capabilities of the MVA algorithm. That is, for the MVA algorithm only 6 out of the 8 electrodes carried out the actuator selection process. Moreover, both FITRA and MVA sensor upper lower bounds of accepted values interval has been set to 1020 and 120 respectively. From the algorithm error control experimentation, it has been proven that both algorithms enforced successfully their error control phases, and values outside of that interval have not been taken into account.
The average ground moisture sensor values of the MVA scenario was 695.8, while the average ground moisture sensor of the FITRA scenario was 608.13. This means that the ground moisture of the FITRA scenario was 12.5% higher than the MVA scenario. This difference is due to the fact that the FITRA algorithm opens and closes the central watering valve fewer times but for longer periods. So the water manages to penetrate deep into the soil or it even evaporates. On the other hand, the majority algorithm opens and closes the valve more often for shorter intervals. The water stays on the surface of the soil and minimizes ground evapotranspiration.
Comparing the two scenarios, the authors observed that the ground moisture sensors present similar values since they are closely scattered on each field. The weather conditions, the soil ingredients and the sensor placements in relation to the watering system were similar for both test cases (MVA and FITRA fields). However, the irrigation time in the FITRA scenario was smaller by 7% compared to the MVA scenario, while the ground moisture was 12.5% higher in the FITRA irrigated field than the MVA irrigated field. These differences are due to the different algorithms that control the actuator of the two irrigation systems.
4.3. Comparison Results of the Two Algorithms Set on Close-By Tomato Fields
The FITRA irrigation algorithm prevails over the majority MVA algorithm at the following:
- It can save water up to 7%. Comparing the results with the majority algorithm, the FITRA irrigation algorithm manages to keep ground moisture 12.5% wetter with 7% less water consumption.
- The FITRA algorithm can achieve higher crop yield that existing algorithms by up to 14%.
- The FITRA algorithm pours water smoother than the majority algorithm, assisted by adaptive fuzzy or NN process and achieving more targeted watering cycles according to the plant’s needs. The result of such adaptation is that with the central valve changes it takes fewer times for smaller time intervals and when needed. Moreover, the FITRA watering temp control process prevents the algorithm from extreme temperature condition irrigation.
- The farmer can weigh the sensors value based on the sensor’s distance from the actuator, while in the majority algorithm all sensor measurements have the same weight.
- As well as ground moisture, the FITRA algorithm monitors the air temperature. It capable of interrupting (WTC process) the irrigation in extreme temperatures, so as to avoid the freezing or the burning of the plants.
- The FITRA algorithm monitors the sensor values for errors or transition to erroneous states. If a value is out of logical range it is skipped and is not taken into consideration for the next calculation interval.
5. Conclusions
Water scarcity is a major problem in the 21st century. The Internet of Things followed by smart A.I. irrigation algorithms can lead to adaptive precision farming, improving crop yield, reducing water consumption, and further increasing crop productivity and product quality.
Authors designed and implemented an Open Watering System (OWS) architecture that can communicate and exchange sensory data information with an Application Server connected to the Internet. Focusing on capabilities of existing IoT communication protocols, such as: IEEE 802.15.4, BLE, LoRa, and 3G/4G, the authors proposed their OWS IoT irrigation system infrastructure over LoRa radio. This LoRa radio implementation is targeted on low-cost and low-node energy consumption. The authors also proposed an application protocol called the FITRA application protocol, which can be used both over LoRa OWS and 3G/4G OWS systems and described its states and functionality.
The authors propose a new fuzzy neural network transition algorithm called FITRA that controls state of the irrigation system actuator. The authors measured the performance of their proposed algorithm towards MVA algorithm on two nearby tomato crop fields. From the experimental results it is easily proven that the FITRA protocol prevails over the majority MVA algorithm. The FITRA algorithm manages to save 7% of water consumption while maintaining 12.5% more ground moisture and producing 25% more monthly crop yield.
Furthermore, experiments proposed by the author’s FITRA application protocol for the communication between the OWS system and the Application server have shown that LoRa OWS can send the same amount of data up to 1 km away with 80% less node energy consumption thana node that uses a 3G network transponder. For future work, the authors plan to compare the FITRA algorithm with other known irrigation systems and algorithms.
Author Contributions
All authors equally conceived and designed the experiments, performed the experiments, analyzed the data, and wrote the paper.
Conflicts of Interest
The authors declare no conflict of interest.
References
- FAO Corporate Document Repository. Irrigation Water Management: Training Manual No. 1—Introduction to Irrigation. Available online: ftp://193.43.36.92/agl/AGLW/fwm/Manual1.pdf (accessed on 15 October 2017).
- Koubachi Company. The Plant Sensor for your Home and Garden. Available online: http://www.koubachi.com (accessed on 15 October 2017).
- Parameswaran, G.; Sivaprasath, K. Arduino Based Smart Drip Irrigation System Using Internet of Things. Int. J. Eng. Sci. 2016, 5518. [Google Scholar] [CrossRef]
- Kumar, M.K.; Srenivasa, R.K. Automation of Irrigation System based on Wi-Fi Technology and IOT. Indian J. Sci. Technol. 2016, 9. [Google Scholar] [CrossRef]
- Harun, A.N.; Kassim, M.R.M.; Mat, I.; Ramli, S.S. Precision irrigation using Wireless Sensor Network. In Proceedings of the IEEE International Conference on Smart Sensors and Application (ICSSA 2015), Kuala Lumpur, Malaysia, 26–28 May 2015; pp. 71–75. [Google Scholar]
- Kumbhar, R.S.; Ghatule, A.P. Microcontroller based Controlled Irrigation System for Plantation. In Proceedings of the International Multi Conference of Engineers and Computer Scientists, Hong Kong, China, 13–15 March 2013; Volume 2, pp. 662–665. [Google Scholar]
- Touati, F.; Al-Hinti, M.; Benhmed, K.; Tarish, R. A fuzzy logic irrigation system enhanced with wireless logging applied to the state of Qatar. Comput. Electron. Agric. 2013, 98, 233–241. [Google Scholar] [CrossRef]
- Bahat, M.; Inbar, G.; Yaniv, O.; Schneider, M. A fuzzy irrigation controller system. Eng. Appl. Artif. Intell. 2000, 13, 137–145. [Google Scholar] [CrossRef]
- Rajalakshmi, P.; Mahalakshmi, S.D. IOT Based Crop-Field Monitoring and Irrigation Automation. In Proceedings of the IEEE 10th International Conference on Intelligent Systems and Control, Coimbatore, India, 7–8 January 2016; Volume 1, pp. 24–32. [Google Scholar] [CrossRef]
- Halahan, P.B.; McIntyre, J.P.; Coopersmith, M.; Puckett, M. System and Method for Smart Irrigation. U.S. Patent US20120303168 A1, 2 February 2015. [Google Scholar]
- Ko, J.; Piccinni, G. Corn yield responses under crop evapotranspiration-based irrigation management. Agric. Water Manag. 2009, 96, 799–808. [Google Scholar] [CrossRef]
- Allen, R.G.; Pereira, L.S.; Raes, D.; Smith, M. Crop Evapotranspiration-Guidelines for Computing Crop Water Requirements FAO Irrigation and Drainage; FAO: Rome, Italy, 1998; Volume 300, p. D05109. [Google Scholar]
- Migliaccio, K.W.; Morgan, K.T.; Fraisse, C.; Vellidis, G.; Andreis, J.H. Performance evaluation of urban turf irrigation smartphone app. Comput. Electron. Agric. 2015, 118, 136–142. [Google Scholar] [CrossRef]
- Majone, B.; Viani, F.; Filippi, E.; Bellin, A.; Massa, A.; Toller, G.; Salucci, M. Wireless sensor network deployment for monitoring soil moisture dynamics at the field scale. Elsevier Procedia Environ. Sci. 2013, 19, 426–435. [Google Scholar] [CrossRef]
- Gardena Soil Moisture Sensor. An Automatic Water Saving Irrigation Component for Small Field Irrigation. 2015. Available online: http://www.gardena.com/int/water-management/water-controls/soil-moisture-sensor (accessed on 15 October 2017).
- Hunter Industries. Soil Clik Moisture Sensor Irrigation System. 2014. Available online: http://www.hunterindustries.com/irrigation-product/sensors/soil-cliktm (accessed on 15 October 2017).
- Pratim, R.P. Internet of things for smart agriculture: Technologies, practices and future direction. J. Ambient Intell. Smart Environ. 2017, 9, 395–420. [Google Scholar] [CrossRef]
- Navarro-Hellín, H.; Martínez-del-Rincon, J.; Domingo-Miguel, R.; Soto-Valles, F.; Torres-Sánchez, R. A decision support system for managing irrigation in agriculture. Elsevier Comput. Electron. Agric. 2016, 124, 121–131. [Google Scholar] [CrossRef] [Green Version]
- Mihajlov, B.; Bogdanoski, M. Overview and Analysis of the Performances of ZigBee based Wireless Sensor Networks. Int. J. Comput. Appl. 2011, 29, 28–35. [Google Scholar]
- ALLIANCE, ZigBee. ZigBee 2007 Specification. Available online: http://www.zigbee.org/Specifications/ZigBee/Overview.aspx (accessed on 15 October 2017).
- Augustin, A.; Yi, J.; Clausen, T.; Townsley, W.M. A Study of LoRa: Long Range & Low Power Networks for the Internet of Things. Sensors 2016, 16, 1466. [Google Scholar]
- RadioHead Packet Radio Library for Embedded Microprocessors. 2015. Available online: http://www.airspayce.com/mikem/arduino/RadioHead/ (accessed on 15 October 2017).
- Alam, M.M.; Hamida, E.B. Surveying Wearable Human Assistive Technology for Life and Safety Critical Applications: Standards, Challenges and Opportunities. Sensors 2014, 14, 9153–9209. [Google Scholar] [CrossRef] [PubMed]
- LoRa Alliance. LoRaWAN A Technical Overview of LoRa and LoRaWAN; Tech Report; The LoRa Alliance: San Ramon, CA, USA, 2015. [Google Scholar]
- Tomtsis, D.; Kokkonis, G.; Kontogiannis, S. IoT Evolution Dissemination through Existing Wireless Technologies. In Proceedings of the IEEE 8th South-East Europe Design Automation, Computer Engineering, Computer Networks and Social Media Conference, Kastoria, Greece, 23–25 September 2017. [Google Scholar]
- Baronti, P.; Pillai, P.; Chook, V.W.C.; Chessa, S.; Gotta, A.; Hu, F.Y. Wireless sensor networks: A survey on the state of the at and the 802.15.4 and ZigBee standards. Comput. Commun. 2007, 30, 1655–1695. [Google Scholar] [CrossRef]
- Orange Connected Objects & Partnerships. LoRa Device Developer Guide. 2016. Available online: https://partner.orange.com/wp-content/uploads/2016/04/LoRa-Device-Developer-Guide-Orange.pdf (accessed on 15 October 2017).
- Sinha, R.S.; Wei, Y.; Hwang, S.H. A survey on LPWA technology: LoRa and NB-IoT. Elsevier ICT Express 2017, 3, 14–21. [Google Scholar] [CrossRef]
- LU, R.-J.; Li, P.; Zhou, S. Application of SHT10 sensor in humidity-and-temperature monitoring system. Transducer Micro Syst. Technol. 2012, 9, 40. [Google Scholar]
- Raspberry Pi Foundation. Raspberry Pi, the Low Cost Embedded Hardware Computer System. 2011. Available online: https://www.raspberrypi.org (accessed on 15 October 2017).
- Adafruit Inc. Adafruit Feather 32u4 with HopeRF RFM95/96 LoRa Radio Module. 2016. Available online: https://learn.adafruit.com/adafruit-feather-32u4-radio-with-lora-radio-module (accessed on 15 October 2017).
- Umair, S.M.; Usman, R. Automation of Irrigation System Using ANN based Controller. Int. J. Electr. Comput. Sci. 2010, 10, 41–47. [Google Scholar]
- Kokkonis, G.; Kontogiannis, S.; Tomtsis, D. A Smart IoT Fuzzy Irrigation System. IOSR J. Eng. 2017, 7, 15–21. [Google Scholar] [CrossRef]
- SemTech.SX1272/3/6/7/8 LoRa Modem Design Guide. 2015. Available online: https://www.loriot.io/lorawan.html (accessed on 15 October 2017).
- Prajzler, V. LoRa, LoRaWAN and LORIOT.io. 2016. Available online: https://www.loriot.io/lorawan.html (accessed on 15 October 2017).
- Knight, M. Reversing Lora. 2016. Available online: https://github.com/matt-knight/research (accessed on 15 October 2017).
- Sornin, N.; Luis, M.; Eirich, T.; Kramp, T.; Hersent, O. LoRaWAN Specification V1.0. 2015. Available online: https://enablingsupport.zendesk.com/hc/en-us/article_attachments/202357691/LoRaWAN1.0.1_d3.pdf (accessed on 15 October 2017).
Figure 1.
Proposed OWS (3G-UMTS) high-level system architecture. The authors are using a 3G UART transponder connected to the microcontroller software-serial interface.
Figure 1.
Proposed OWS (3G-UMTS) high-level system architecture. The authors are using a 3G UART transponder connected to the microcontroller software-serial interface.
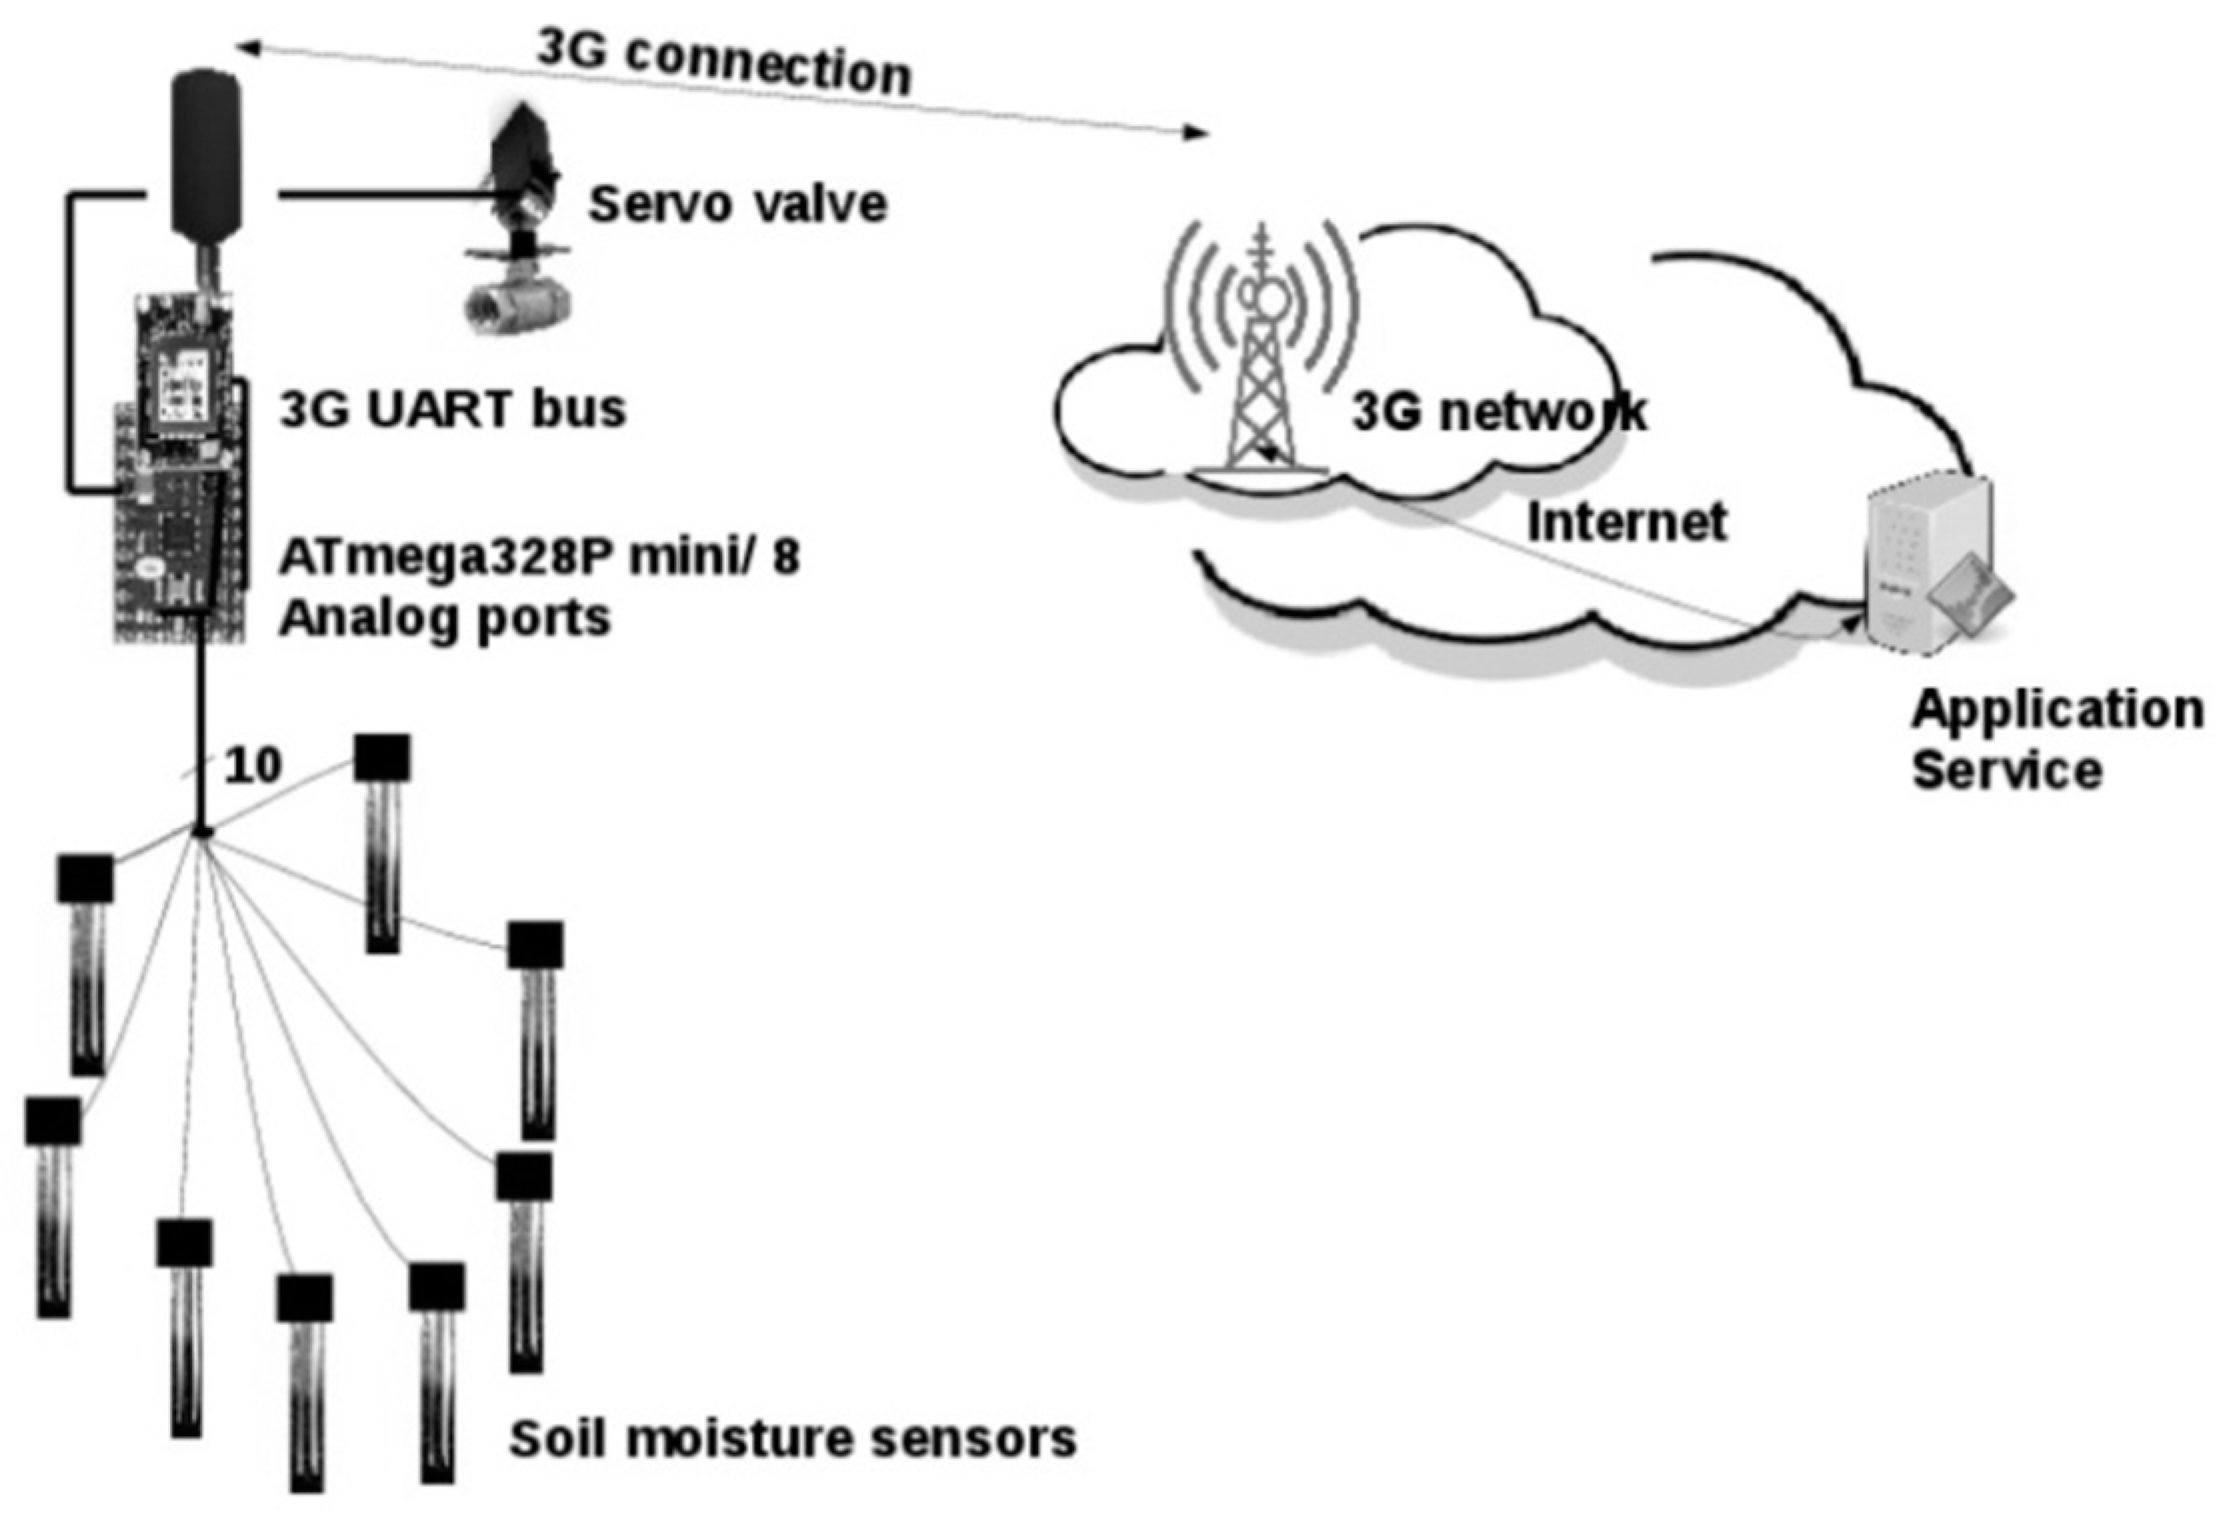
Figure 2.
Proposed OWS LoRa High level system architecture. Authors are using the RFM96 LoRa transponder connected to the SPI microcontroller bus [22].
Figure 2.
Proposed OWS LoRa High level system architecture. Authors are using the RFM96 LoRa transponder connected to the SPI microcontroller bus [22].
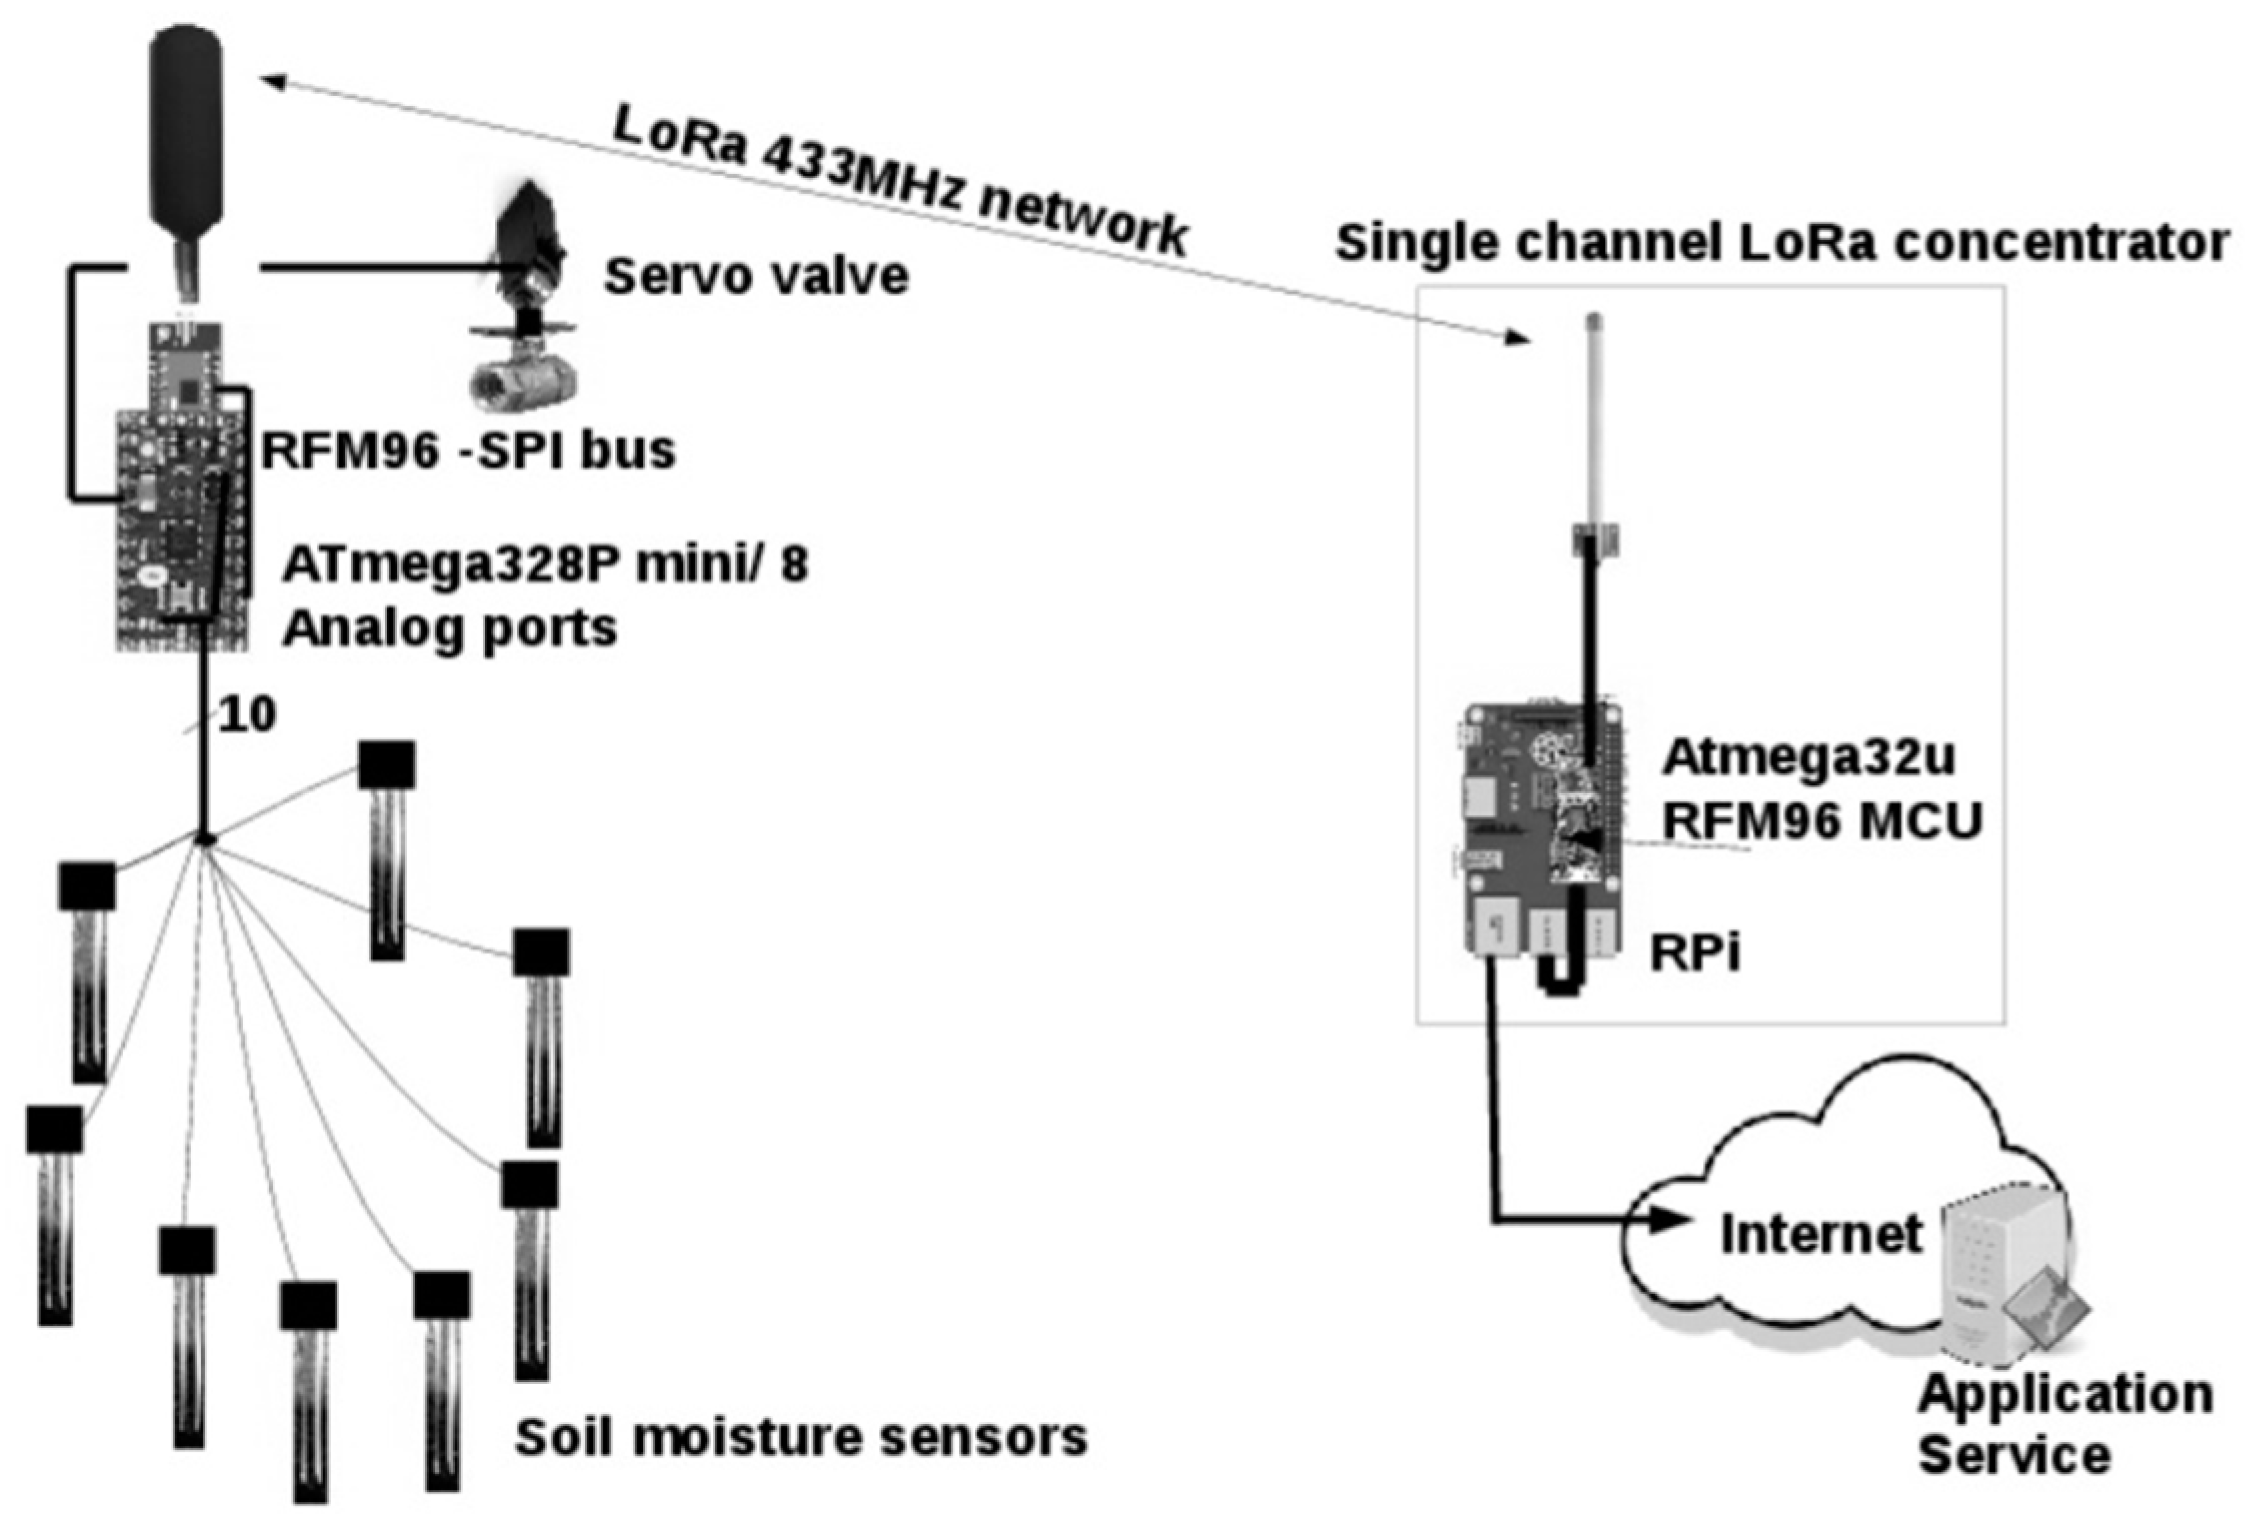
Figure 3.
FITRA algorithm operation block diagram.
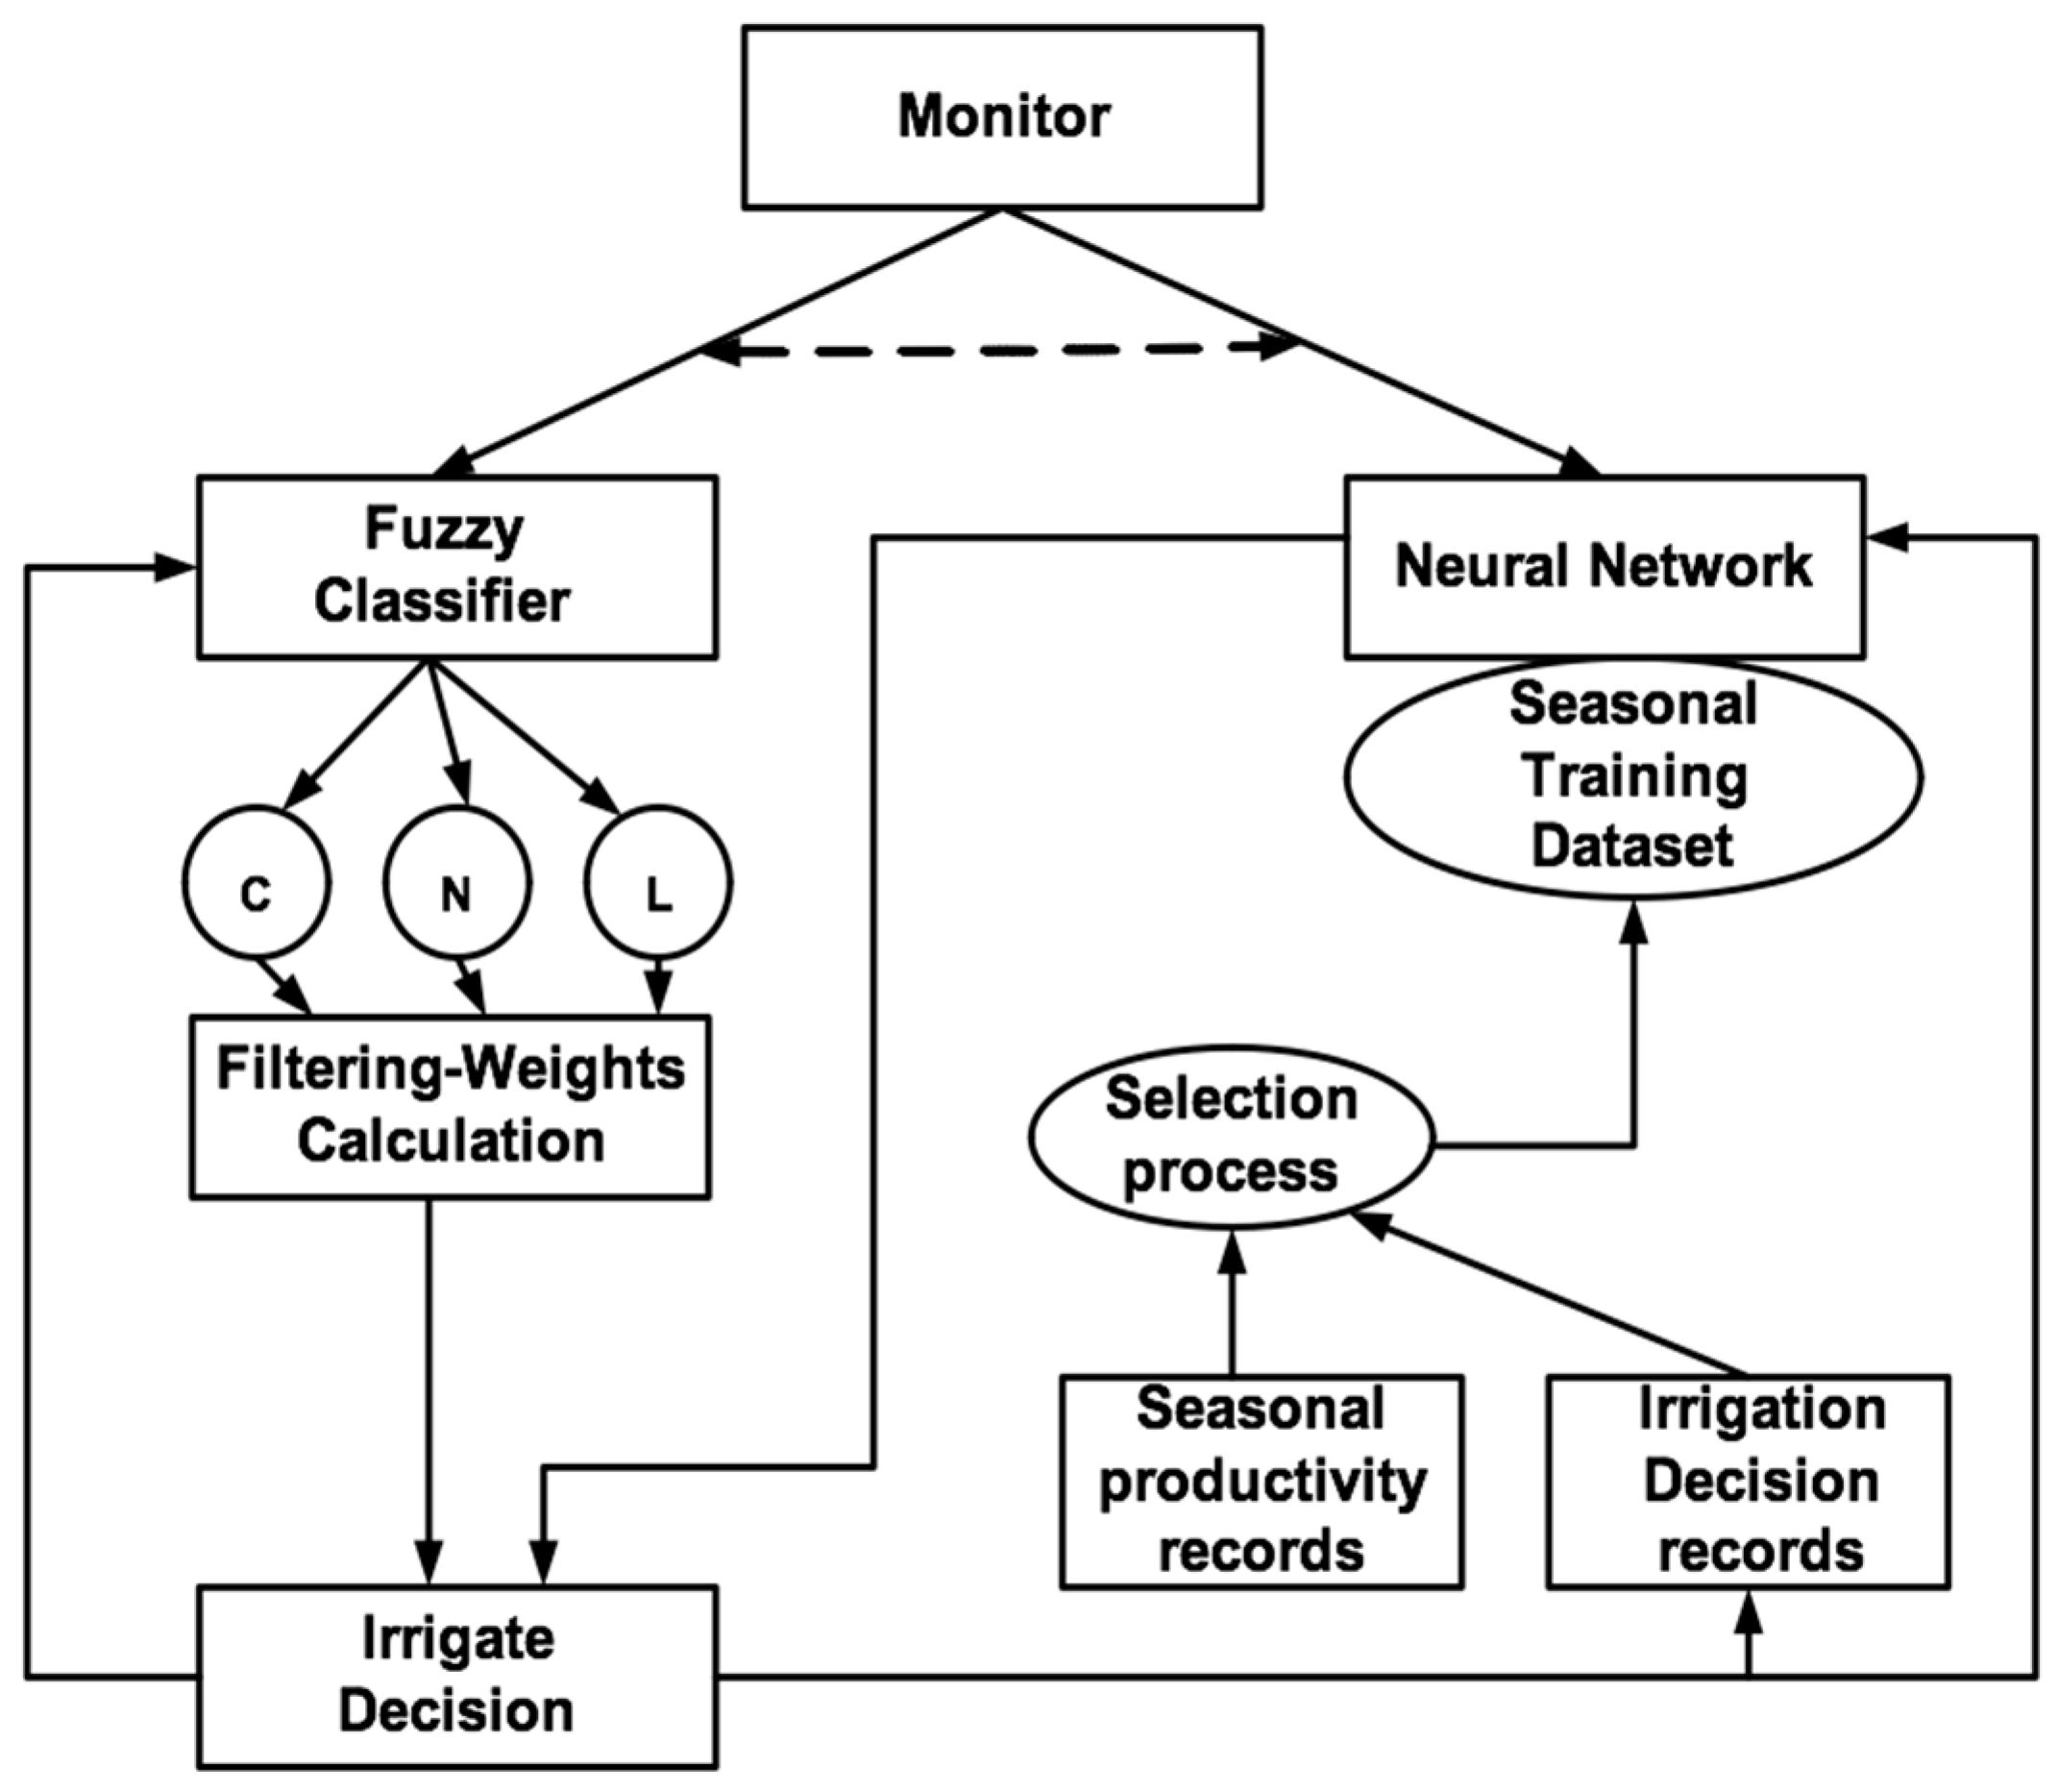
Figure 4.
Watering Temp Control Fuzzy sets over crisp input values.
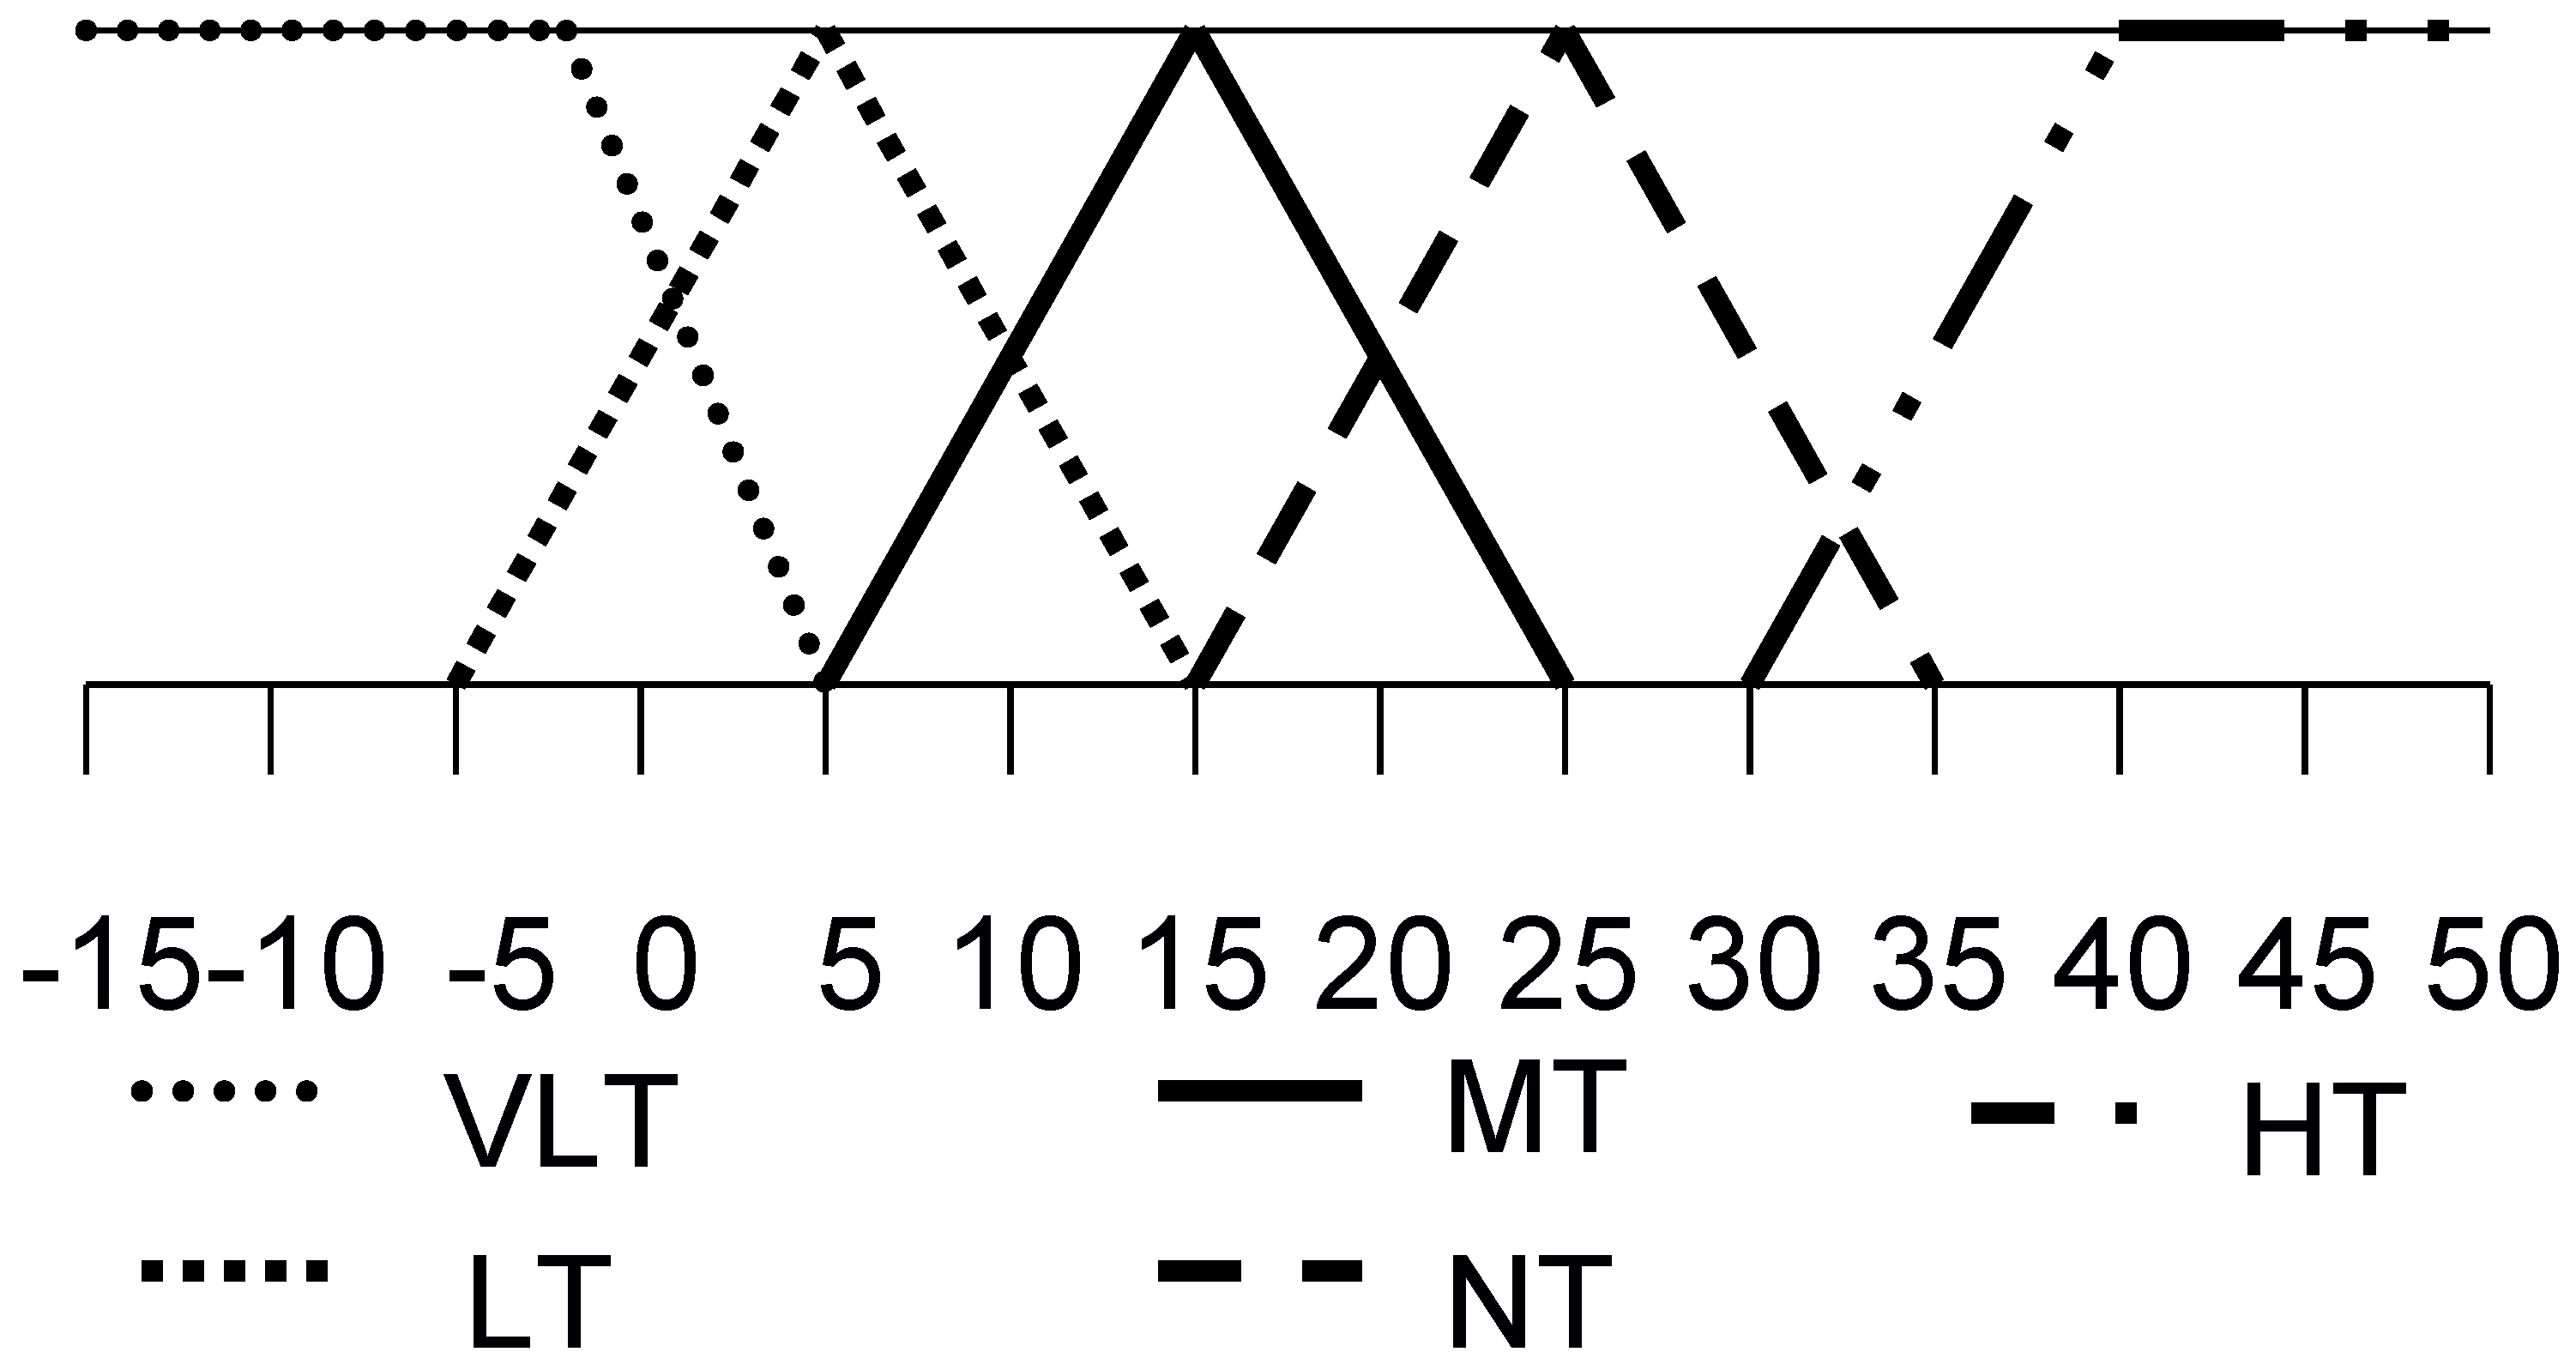
Figure 5.
FITRA NN algorithm state for the calculation of vane’s operation.
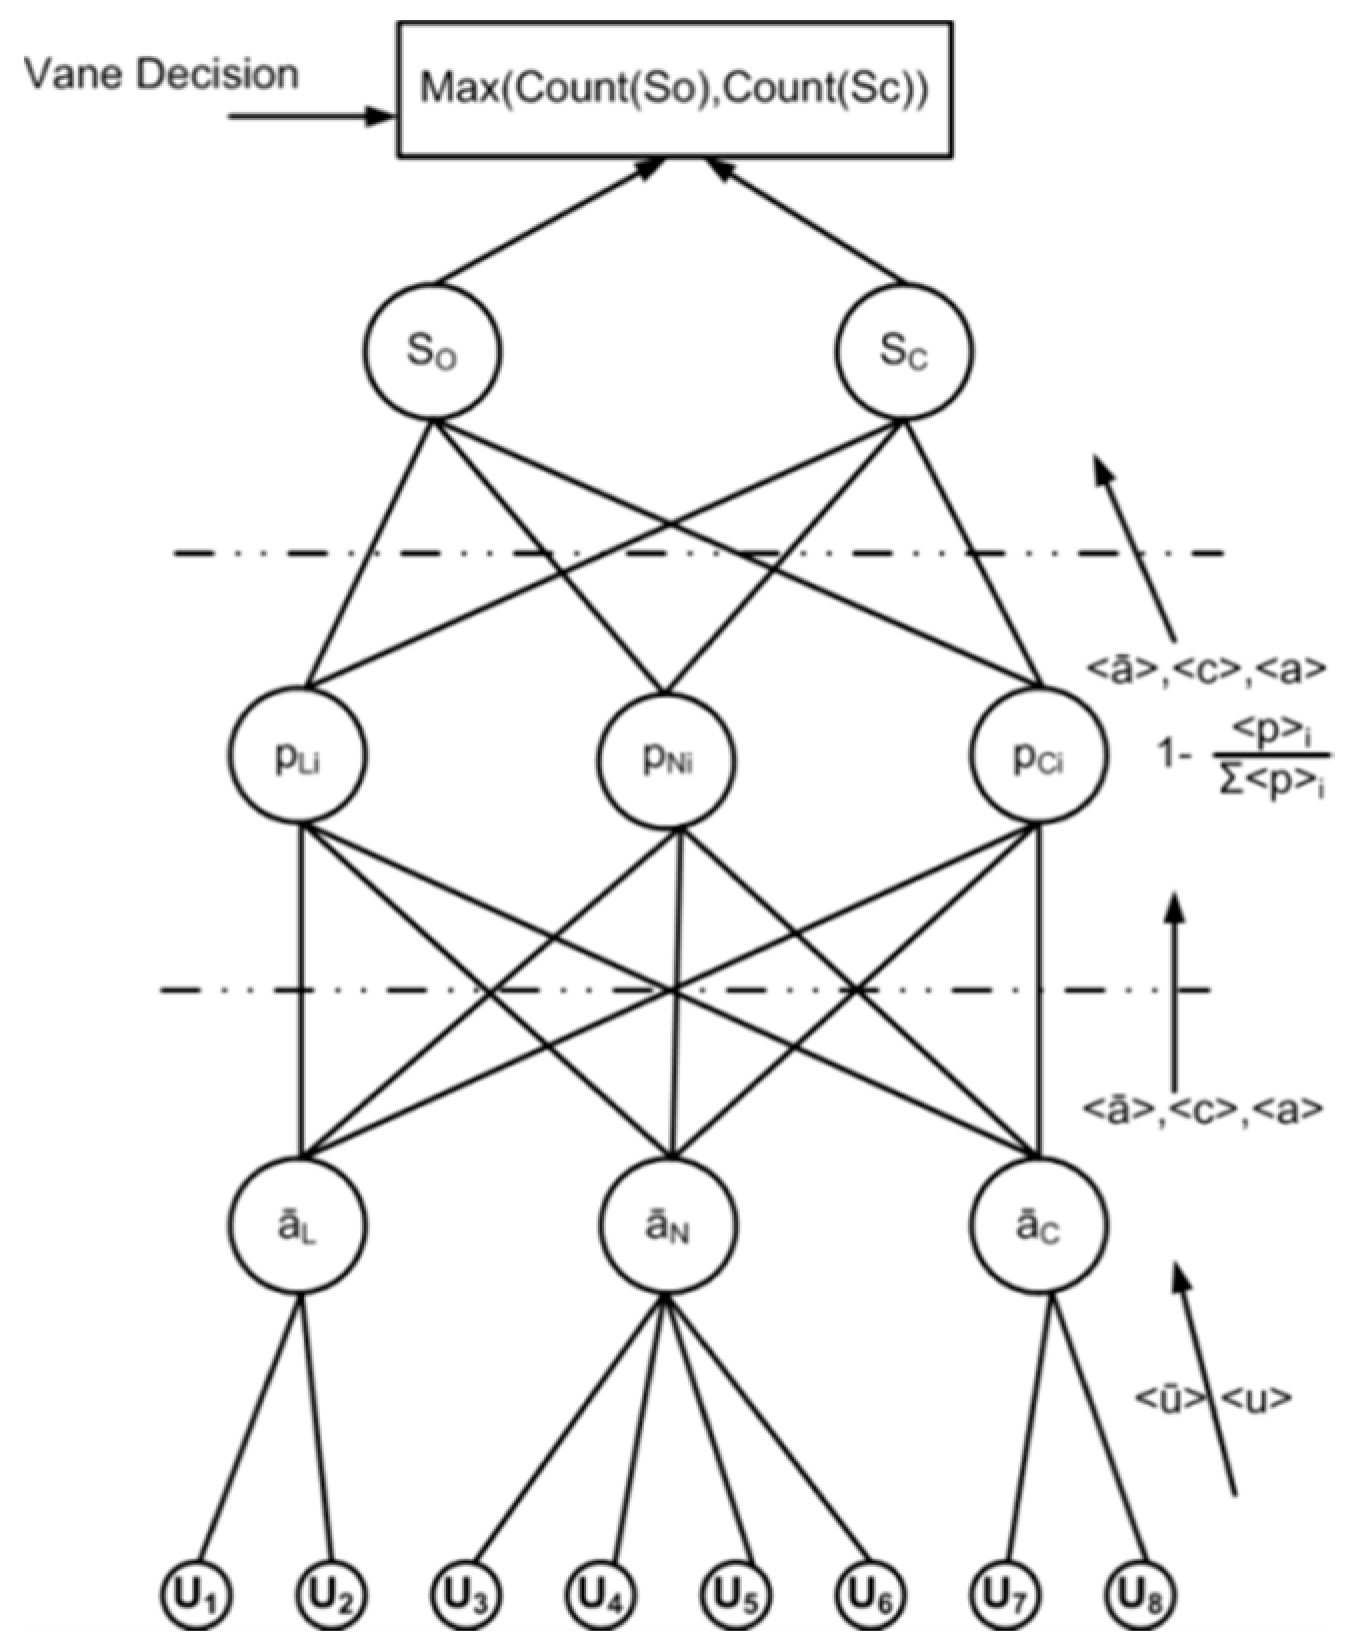
Figure 6.
(a) LoRaWAN communication protocol packet structure for class A transmission over LoRa 868 MHz network [37]; (b) FITRA communication protocol packet structure for transmission over LoRa radio 433 MHz network; (c) FITRA concentrator communication protocol ACK packet structure for transmission over LoRa 433 MHz network.

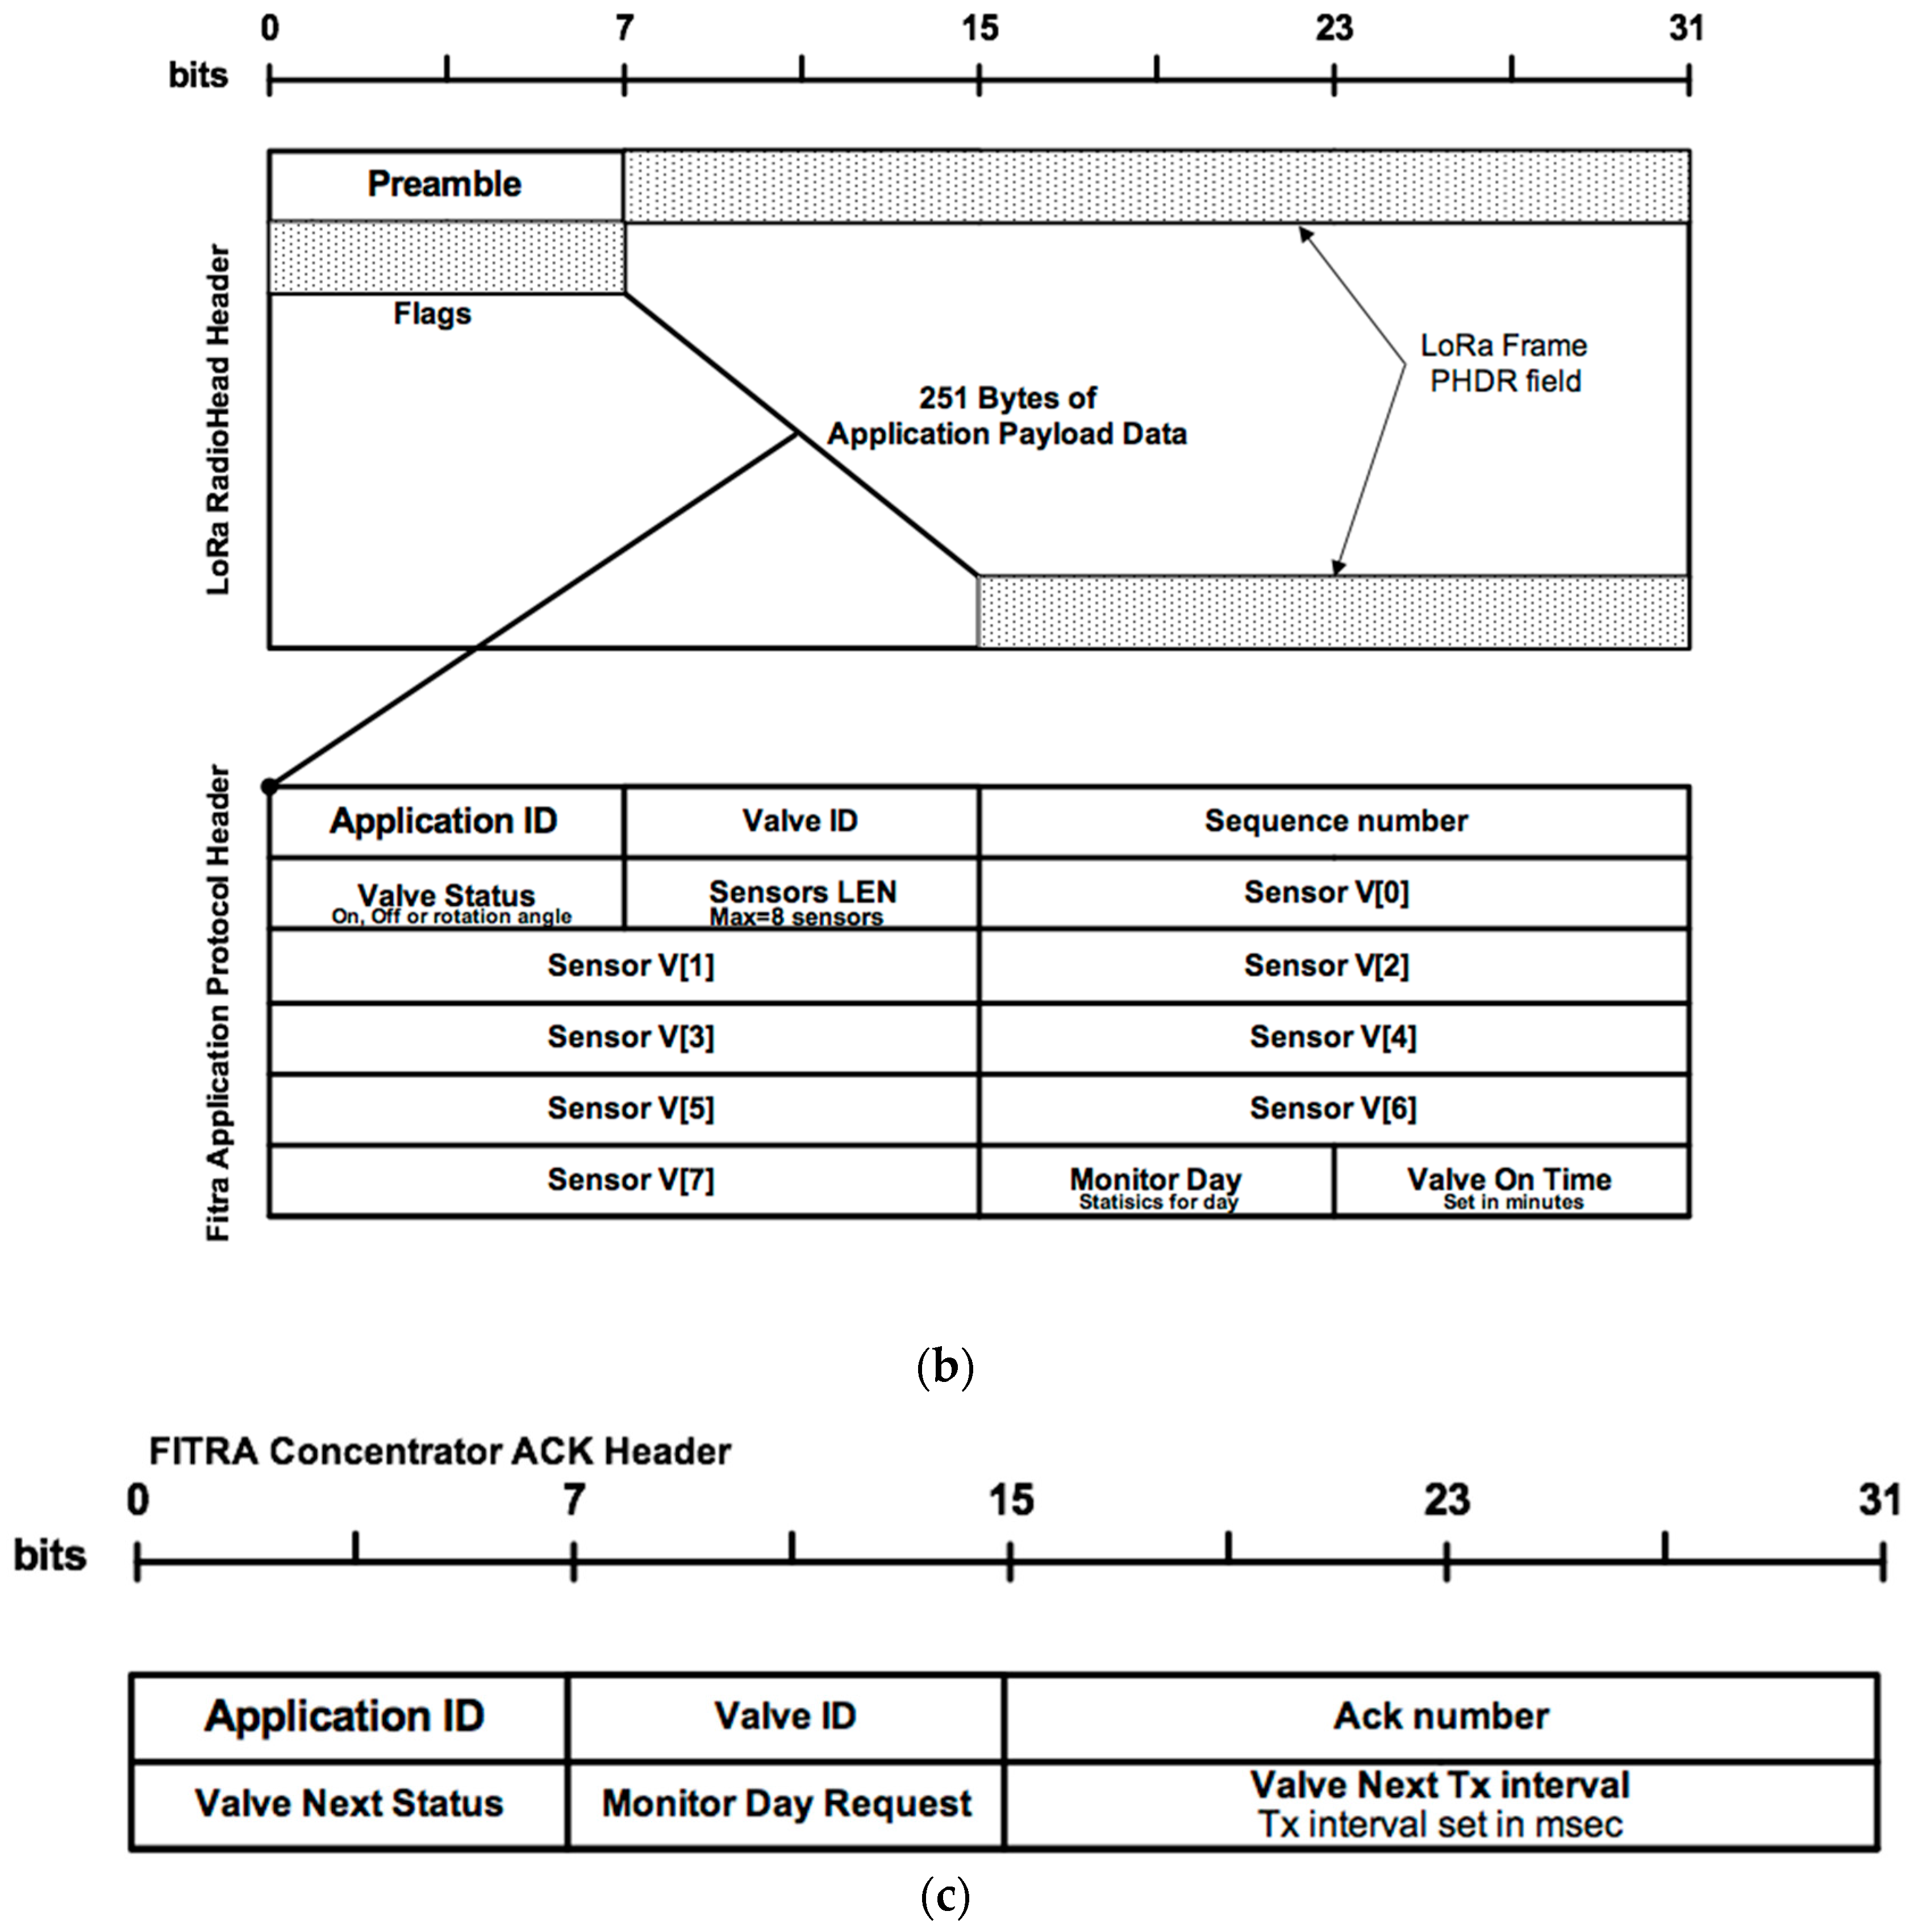
Figure 7.
Irrigation time in hours per day based on the majority and FITRA algorithm.

Figure 8.
(a) Mean value per day of ground moisture sensor 1 for the two scenarios; (b) Mean value per day of ground moisture sensor 2 for the two scenarios; (c) Mean value per day of ground moisture sensor 3 for the two scenarios; (d) Mean value per day of ground moisture sensor 4 for the two scenarios; (e) Mean value per day of ground moisture sensor 5 for the two scenarios; (f) Mean value per day of ground moisture sensor 6 for the two scenarios; (g) Mean value per day of ground moisture sensor 7 for the two scenarios; (h) Mean value per day of ground moisture sensor 8 for the two scenarios.


| Wireless Communication Technology | Maximum Coverage Range (m) | TX Current Consumption (mA) | Throughput | Scalability/Max Nodes |
|---|---|---|---|---|
| 3G/4G LTE | Cellular Network | 260–370 | 1–50 Mbit/s | 1155 active transmissions/site |
| LoRa/LoRaWaN | 12,000 | 40 | 5 Kbit/s | 5000–20,000 nodes (LoRaWAN) (50 Bytes payload, 7.3 packet/hour) |
| RFM69 | 500 | 80 | 100 Kbit/s | 65,536 |
| ZigBee | 100–1000 | 35–65 | 1 Mbit/s–250 Kbit/s | 65,536 |
| Bluetooth LE | 50 | <25 | 1 Mbps | 7 |
Table 2.
FITRA Interrupt state degree of memberships table.
| Input DOM Value | Valve Status | |
|---|---|---|
| Very Low Temp (VLT) | Any | Off |
| Low Temp (LT) | >0.7 | Off |
| Low Temp (LT) | ≤0.7 | Little On/Off |
| Medium Temp (MT) | Any | Middle On/Off |
| Normal Temp (NT) | Any | On/Off |
| High Temp (HT) | ≤0.7 | Little On/Off |
| High Temp (HT) | >0.7 | Off |
Table 3.
FITRA Communication Protocol Performance results over GPRS and LoRa OWS system.
| Frame Count | Av. RTT | |
|---|---|---|
| GPRS | 4850 | 420 ms |
| LoRa | 26,580 | 580 ms |
© 2017 by the authors. Licensee MDPI, Basel, Switzerland. This article is an open access article distributed under the terms and conditions of the Creative Commons Attribution (CC BY) license (http://creativecommons.org/licenses/by/4.0/).
Share and Cite
MDPI and ACS Style
Kontogiannis, S.; Kokkonis, G.; Ellinidou, S.; Valsamidis, S. Proposed Fuzzy-NN Algorithm with LoRaCommunication Protocol for Clustered Irrigation Systems. Future Internet 2017, 9, 78. https://doi.org/10.3390/fi9040078
AMA Style
Kontogiannis S, Kokkonis G, Ellinidou S, Valsamidis S. Proposed Fuzzy-NN Algorithm with LoRaCommunication Protocol for Clustered Irrigation Systems. Future Internet. 2017; 9(4):78. https://doi.org/10.3390/fi9040078
Chicago/Turabian StyleKontogiannis, Sotirios, George Kokkonis, Soultana Ellinidou, and Stavros Valsamidis. 2017. "Proposed Fuzzy-NN Algorithm with LoRaCommunication Protocol for Clustered Irrigation Systems" Future Internet 9, no. 4: 78. https://doi.org/10.3390/fi9040078
Note that from the first issue of 2016, this journal uses article numbers instead of page numbers. See further details here.