Article

Correlation between Aerosol Particulates, Carcass Dirtiness, and Hygiene Indicators of Bovine Carcasses in the Abattoir Environment: Results of a Study in Italy

by
Beniamino T. Cenci-Goga
1,2,
Emma Tedeschini
3,
Egidia Costanzi
1,
Margherita Maranesi
1,
Musafiri Karama
2,
Saeed El-Ashram
4,5,
Cristina Saraiva
6,7,
Juan García-Díez
6,
Massimo Zerani
1,
Ebtesam M. Al-Olayan
8 and
Luca Grispoldi
1,*
1
Department of Veterinary Medicine, University of Perugia, 06123 Perugia, Italy
2
Faculty of Veterinary Science, Department of Paraclinical Sciences, University of Pretoria, Pretoria 0028, South Africa
3
Department of Agricultural, Food, Environmental Sciences, University of Perugia, 06123 Perugia, Italy
4
College of Life Science and Engineering, Foshan University, 18 Jiangwan Street, Foshan 528231, China
5
Zoology Department, Faculty of Science, Kafrelsheikh University, Kafr El-Sheikh 33516, Egypt
6
Veterinary and Animal Research Centre, University of Trás-os-Montes e Alto Douro, 5000-801 Vila Real, Portugal
7
Department of Veterinary Sciences, School of Agrarian and Veterinary Sciences, University of Trás-os-Montes e Alto Douro, 5000-801 Vila Real, Portugal
8
Department of Zoology, College of Science, King Saud University, Riyadh 11451, Saudi Arabia
*
Author to whom correspondence should be addressed.
Microbiol. Res. 2024, 15(2), 598-613; https://doi.org/10.3390/microbiolres15020039
Submission received: 28 February 2024 / Revised: 25 March 2024 / Accepted: 17 April 2024 / Published: 22 April 2024
(This article belongs to the Special Issue Molecular Microbiology Underlying Foodborne Viruses)

Abstract

:
The objective of this study was to demonstrate the possible correlation of visible carcass contamination and abattoir aerosol quality with microbial hygiene criteria. A total of 279 bovine carcasses were analyzed on 23 different working days. The aerobic colony count and total coliforms on the carcasses were calculated together with the presence of Escherichia coli. To determine the visible contamination of carcasses, we used a 100 cm2 sheet of transparent, adhesive plastic material, applied to the side of the carcass, to collect all the particles, which were then counted against both black and white backgrounds. The daily particulate index in the abattoir aerosol was determined using an air sampler device. The results showed that aerobic colony counts, which ranged from 1.41 to 2.40 log cfu cm−2, total coliforms (from 0.00 to 0.73 log cfu cm−2), and E. coli presence (from 0.00% to 60% of the sampled carcasses per day) are not correlated with the carcasses’ visual dirtiness or the aerosol quality. The factor analysis showed a correlation between the three groups of variables investigated: group 1, representing “aerosol quality”, group 2, representing the “microbiology of the carcass”, and group 3, the “visual dirtiness of the carcass”. Thus, even though microbiology analysis is useful in diagnosing the microorganisms which the official veterinarian is unable to detect during the post-mortem inspection, it is ineffective in evaluating slaughtering procedures. Aerosol monitoring and the visual classification of carcass dirtiness, instead, could provide good indications of the slaughtering process and the quality of the abattoir environment, and guarantee control of manufacturing practices, protecting both animals’ and operators’ health.

1. Introduction

Ensuring food safety during the food manufacturing process is necessary to ensure food hygiene and to protect the health of working staff and consumers. Food safety must be ensured by producers, within the guidance of official controls formed by competent authorities. In this regard, meat production presents unique challenges. Abattoirs are unique among factories in that they handle both live animals and the food they produce simultaneously. This is why particular attention must be paid to ensure the hygiene of the process and the safety of the meat.
The hygienic state of bovine carcasses at abattoirs and their exposure to microorganisms are mainly linked to contact with contaminated surfaces, tools, and materials. It is generally agreed that the majority of microorganisms on a dressed bovine carcass are the result of a contaminated hide and a ruptured gastrointestinal tract, followed by workers’ contaminated instruments, hands, and clothes [1,2]. The main critical points for meat contamination are considered to be animal skinning and evisceration. However, the level of animal cleanliness at the time of slaughter is of considerable importance, as indicated both by the Codex Alimentarius (“…the degree of contamination of the external surfaces of the animal is likely to compromise hygienic slaughter and dressing…”) and by EU Regulation 853/2004 (“…Food business operators operating slaughterhouses… must guarantee that each animal or, where appropriate, each lot of animals accepted into the slaughterhouse…is clean…”) [3,4]. The hygiene of the entire slaughtering process is of the utmost importance to ensure the safety of meat: in the EU, process hygiene criteria are evaluated on the basis of EU Regulation 2073/2005 [5]. Moreover, in the last decade, the European Food Safety Authority (EFSA) has introduced the concept of harmonized epidemiological indicators [6]. An epidemiological indicator is defined as the prevalence or incidence of a hazard at a certain stage of the food chain or an indirect measure of the hazards that correlates with a human health risk caused by a hazard. The European Commission and the Member States can use the indicators to consider when adaptations in meat inspection methods may be relevant and to carry out risk analysis to support such decisions [7,8].
One frequently overlooked source of contamination is the air. In fact, everything that is airborne constantly comes into contact not only with the carcasses, but also with tools, surfaces, and with the workers themselves [9]. Biological contaminants present in the air, known as bioaerosol, include bacteria, fungi, viruses, and pollen. Bioaerosol usually consists of two phases: a gaseous phase represented by the air and a solid phase represented by organic and inorganic particulates [6]. Microbial particles can be transported not only by solid elements, such as powders, but also by liquid elements, which are mainly suspended water droplets. Among the main sources of microorganisms in bioaerosols within an abattoir environment are wastewater, rinse water, and animal material that is aerosolized. Once in suspension, microorganisms are spread throughout an abattoir environment by the main air currents and by air conditioning and forced-ventilation systems [10]. Other factors influencing the quality and distribution of aerosols include operator activities, equipment such as sinks and floor drains, and the use of high-pressure systems for cleaning. The presence of microorganisms in an aerosol is not only a route for the contamination of meat, but also a potential health risk. Contaminated bioaerosols from livestock and poultry housing units and manure management operations have been reported to cause health issues for both farm workers and animals [11].
Post-mortem inspection only identifies pathological lesions caused by organisms that are insignificant to public health or lesions related to animal welfare issues and animal diseases that are endemic in intensive farming systems [12,13]. Based on the recommendations of their scientific advisory panels, regulatory bodies adopted new guiding principles for addressing major meat safety challenges. Minimal handling of carcasses and offal on the slaughter line and visual-only inspection is applied for animal categories with a negligible risk of tuberculosis and cysticercosis, such as pigs and veal. As such, a reallocation of inspection activities has been planned based on the scenarios described by the European Food Safety Authority (EFSA).
These scenarios now emphasize the need for interventions to reduce contamination in meat production lines [14,15,16]. These measures in risk-based meat inspection involve scheduled slaughter, preventing evisceration leaks, and sanitizing carcasses. Public veterinary officers ensure compliance with food laws, while managers in risk-based meat inspection must identify and address the root causes of issues. Evidence-based actions are crucial, and compliance verification by public veterinary officers is emphasized. If contamination is detected, a reduction in slaughter speed may be required until control is regained. The withdrawal or destruction of contaminated carcasses aims to correct non-compliance, with interventions planned for prevention [17].
Throughout the slaughter process, bovine hides continue to be a significant source of contamination. Although contradicting papers are available studying the relationship between the visual cleanliness of the animal’s hide and the contamination with pathogens such as E. coli, it is good practice to control and/or reduce the amount of fecal matter entering abattoirs, and many countries are known to implement the so-called Clean Livestock Policies, like the one implemented by the Food Standards Agency in the UK, which was initially proposed by the Meat Hygiene Service in 2007. These policies aim to classify the cleanliness of live animals at intake into five different categories, helping to categorize the risk and adjust the process as necessary [1,2,18]. Regulation (EC) 853/2004, as amended, states that food business operators which operate abattoirs where domestic ungulates are slaughtered must comply with the following requirement in Annex III, Section I, Chapter IV, Point 4: “animals must be clean”. During ante mortem inspection, which means “the verification, prior to slaughtering activities, of human and animal health and animal welfare requirements, including, where appropriate, the clinical examination of each individual animal, and the verification of the food chain information”, as stated in Section III of Annex II to Regulation (EC) No 853/2004, it remains crucial that officials carry out a visual assessment of the hide and ensure the FBO’s compliance with Point 4, stated above. To a lesser extent, feces and gut contents also contribute to carcass contamination. Adherence to good manufacturing practices and correct evisceration techniques, including the rodding of the esophagus and the bunging of the rectum, are known to be effective in reducing the risk [19].
One of the most challenging approaches is the definition of a method for the assessment of carcass cleanliness [18]. We have set up a procedure to count and keep records of the macroscopic particles of dirt (fecal debris, fragments of straw, hair, etc.) that contaminate the carcass (we named this the visual dirtiness score). For this, a 100 cm2 sheet of transparent, adhesive plastic material was applied to the side of the carcass to collect all the particles. At a later stage, the particles are counted first against a black background and then against a white background.
With these considerations in mind, the objective of this study was to investigate the correlation between several factors in a controlled environment. These factors include the visual dirtiness score, the daily visual dirtiness score, the number of slaughtered animals per day, the daily average distance of travel, the aerobic colony count, the total coliforms, the visual dirtiness score, the daily particulate index, and the slaughtering hours particulate index. We also aim to measure their relationship with the likelihood of E. coli being present on the carcasses.

2. Materials and Methods

2.1. Experimental Design

All sampling was carried out in an abattoir located in central Italy, during workdays dedicated to bovine slaughter. The abattoir has a horizontal layout, with a maximum capacity of approximately 40 cattle per hour. A total of 279 bovine carcasses, sampled on 23 different workdays, were analyzed. The hygienic conditions of the carcasses were evaluated using classic microbiological methods, the method described below to evaluate macroscopic carcass dirtiness, and an assessment of the abattoir’s aerosol particulates. Each workday, animals for sampling were randomly chosen from the abattoir database: all the animal identification numbers were printed, cut out, and then randomly drawn from a hat.

2.2. Microbiological Analysis

For the microbiological analysis, samples were taken after slaughter, but before chilling. Sampling sites were identified in compliance with the ISO standard 17604:2015 [20]. Samples were taken from each half of the carcasses at four points: neck, brisket, rump, and belly. This was carried out using a sterile sponge soaked in 25 mL of peptone water (PW, Oxoid, Basingstoke, Hampshire, UK) on an area of 100 cm2. After correct labeling, the samples were transported in a refrigerated container to the laboratory for further analysis. Ten-fold dilutions were prepared in sterile tubes with 9 mL of maximum recovery diluent (MRD, Oxoid). Using a sterile pipette, 0.1 mL of each sample and dilution was transferred from the bag to Petri dishes and spread homogeneously on the surface of the agar with a sterile L-shaped spatula. For the total aerobic colony count, samples were inoculated on plate count agar (PCA, Oxoid) and incubated at 37 °C for 24 h. To count the total coliforms, the samples were inoculated on violet red bile lactose agar (VRBL) and incubated at 30 °C for 24 h. After incubation, the colonies were counted on all the plates using a colony counter pen under a colony count viewer, and the results were converted into logs. The colonies were transferred from the VRBL plates, using the replica plating technique [21], onto tryptone bile X-glucuronide agar (TBX, Oxoid) to evaluate the production of beta-glucuronidase. TBX was incubated at 30 °C for 24 h. Colonies with morphological characteristics attributable to Escherichia coli on both VRBL and TBX were isolated and inoculated into brilliant green bile broth (BGBB, Oxoid) with a Durham tube at 44 °C for 24 h and in PW at 44 °C for 24 h for confirmation (growth at 44 °C with gas and indole production).

2.3. Visual Dirtiness Score

To evaluate the visible contamination of carcasses, we used a 100 cm2 sheet of transparent, adhesive plastic material applied to the side of the carcass to collect all the particles. Then, macroscopic particles of dirt (fecal debris, fragments of straw, hair, etc.) were counted first against a black background and then against a white background. Materials such as blood and fat were not counted and were considered to be an integral part of the carcass. Four different operators evaluated all the samples, counted the impurities, and calculated the arithmetic mean for each sample (visual dirtiness score). The arithmetic mean for each workday (daily visual dirtiness score) was then calculated for further statistical analysis.

2.4. Slaughtered Animals per Day and Daily Average Distance

Data from the slaughterhouse database include the number of animals slaughtered per day and the daily average distance they are transported (Table 1). These data were analyzed to investigate potential relationships between animal load, transportation distance, and animal dirtiness. One hypothesis being explored is that longer transportation distances may correlate with increased animal dirtiness.

2.5. Aerosol Monitoring

Aerosol samples were collected during the day of bovine slaughter by applying a daily volumetric air sampler VPPS 1000 (Lanzoni, Bologna, Italy), which is commonly used in the health sector. This sampler sucks a constant air flow corresponding to lung ventilation (10 L/min). The instrument is equipped with an aspiration chamber where the sampling plane is placed. Without a liquid medium or filter, the air impacts on a transparent solid surface measuring 2 × 48 mm2 placed on a mobile slide (airflow exposure speed 2 mm/h). The amount of particulate was calculated at two-hourly intervals (4 mm), using the digital image processing computer program ImageJ (National Institutes of Health, USA), which reports absorbance as pixel grey level. The total amount of particulate on the slides was calculated to obtain the daily particulate index. To obtain the daily distribution, the particulate index for slaughtering hours (from 5 a.m. to 2 p.m.) was calculated (slaughtering hours particulate index). Considering the source of airborne particles and the height of the building, the device was positioned approximately 250–270 cm above the ground, equidistant from the slaughtering, evisceration, and skinning station.

2.6. Statistical Analysis

Statistical analysis of data was performed using StatView 5.0.1 for Mac OS 9 (SAS Institute, Cary, NC, USA) and GraphPad Prism 8.4.3 for macOS (GraphPad Software, LLC, Boston, MA, USA). A Pearson correlation coefficient was computed to assess the linear relationship between the variables. Logistic regression was used to analyze the relationship between the variables and the presence of E. coli on the carcasses; a p-value of less than 0.05 was considered statistically significant. Factor analysis was then performed to understand the possible relationships between all the variables investigated.

3. Results

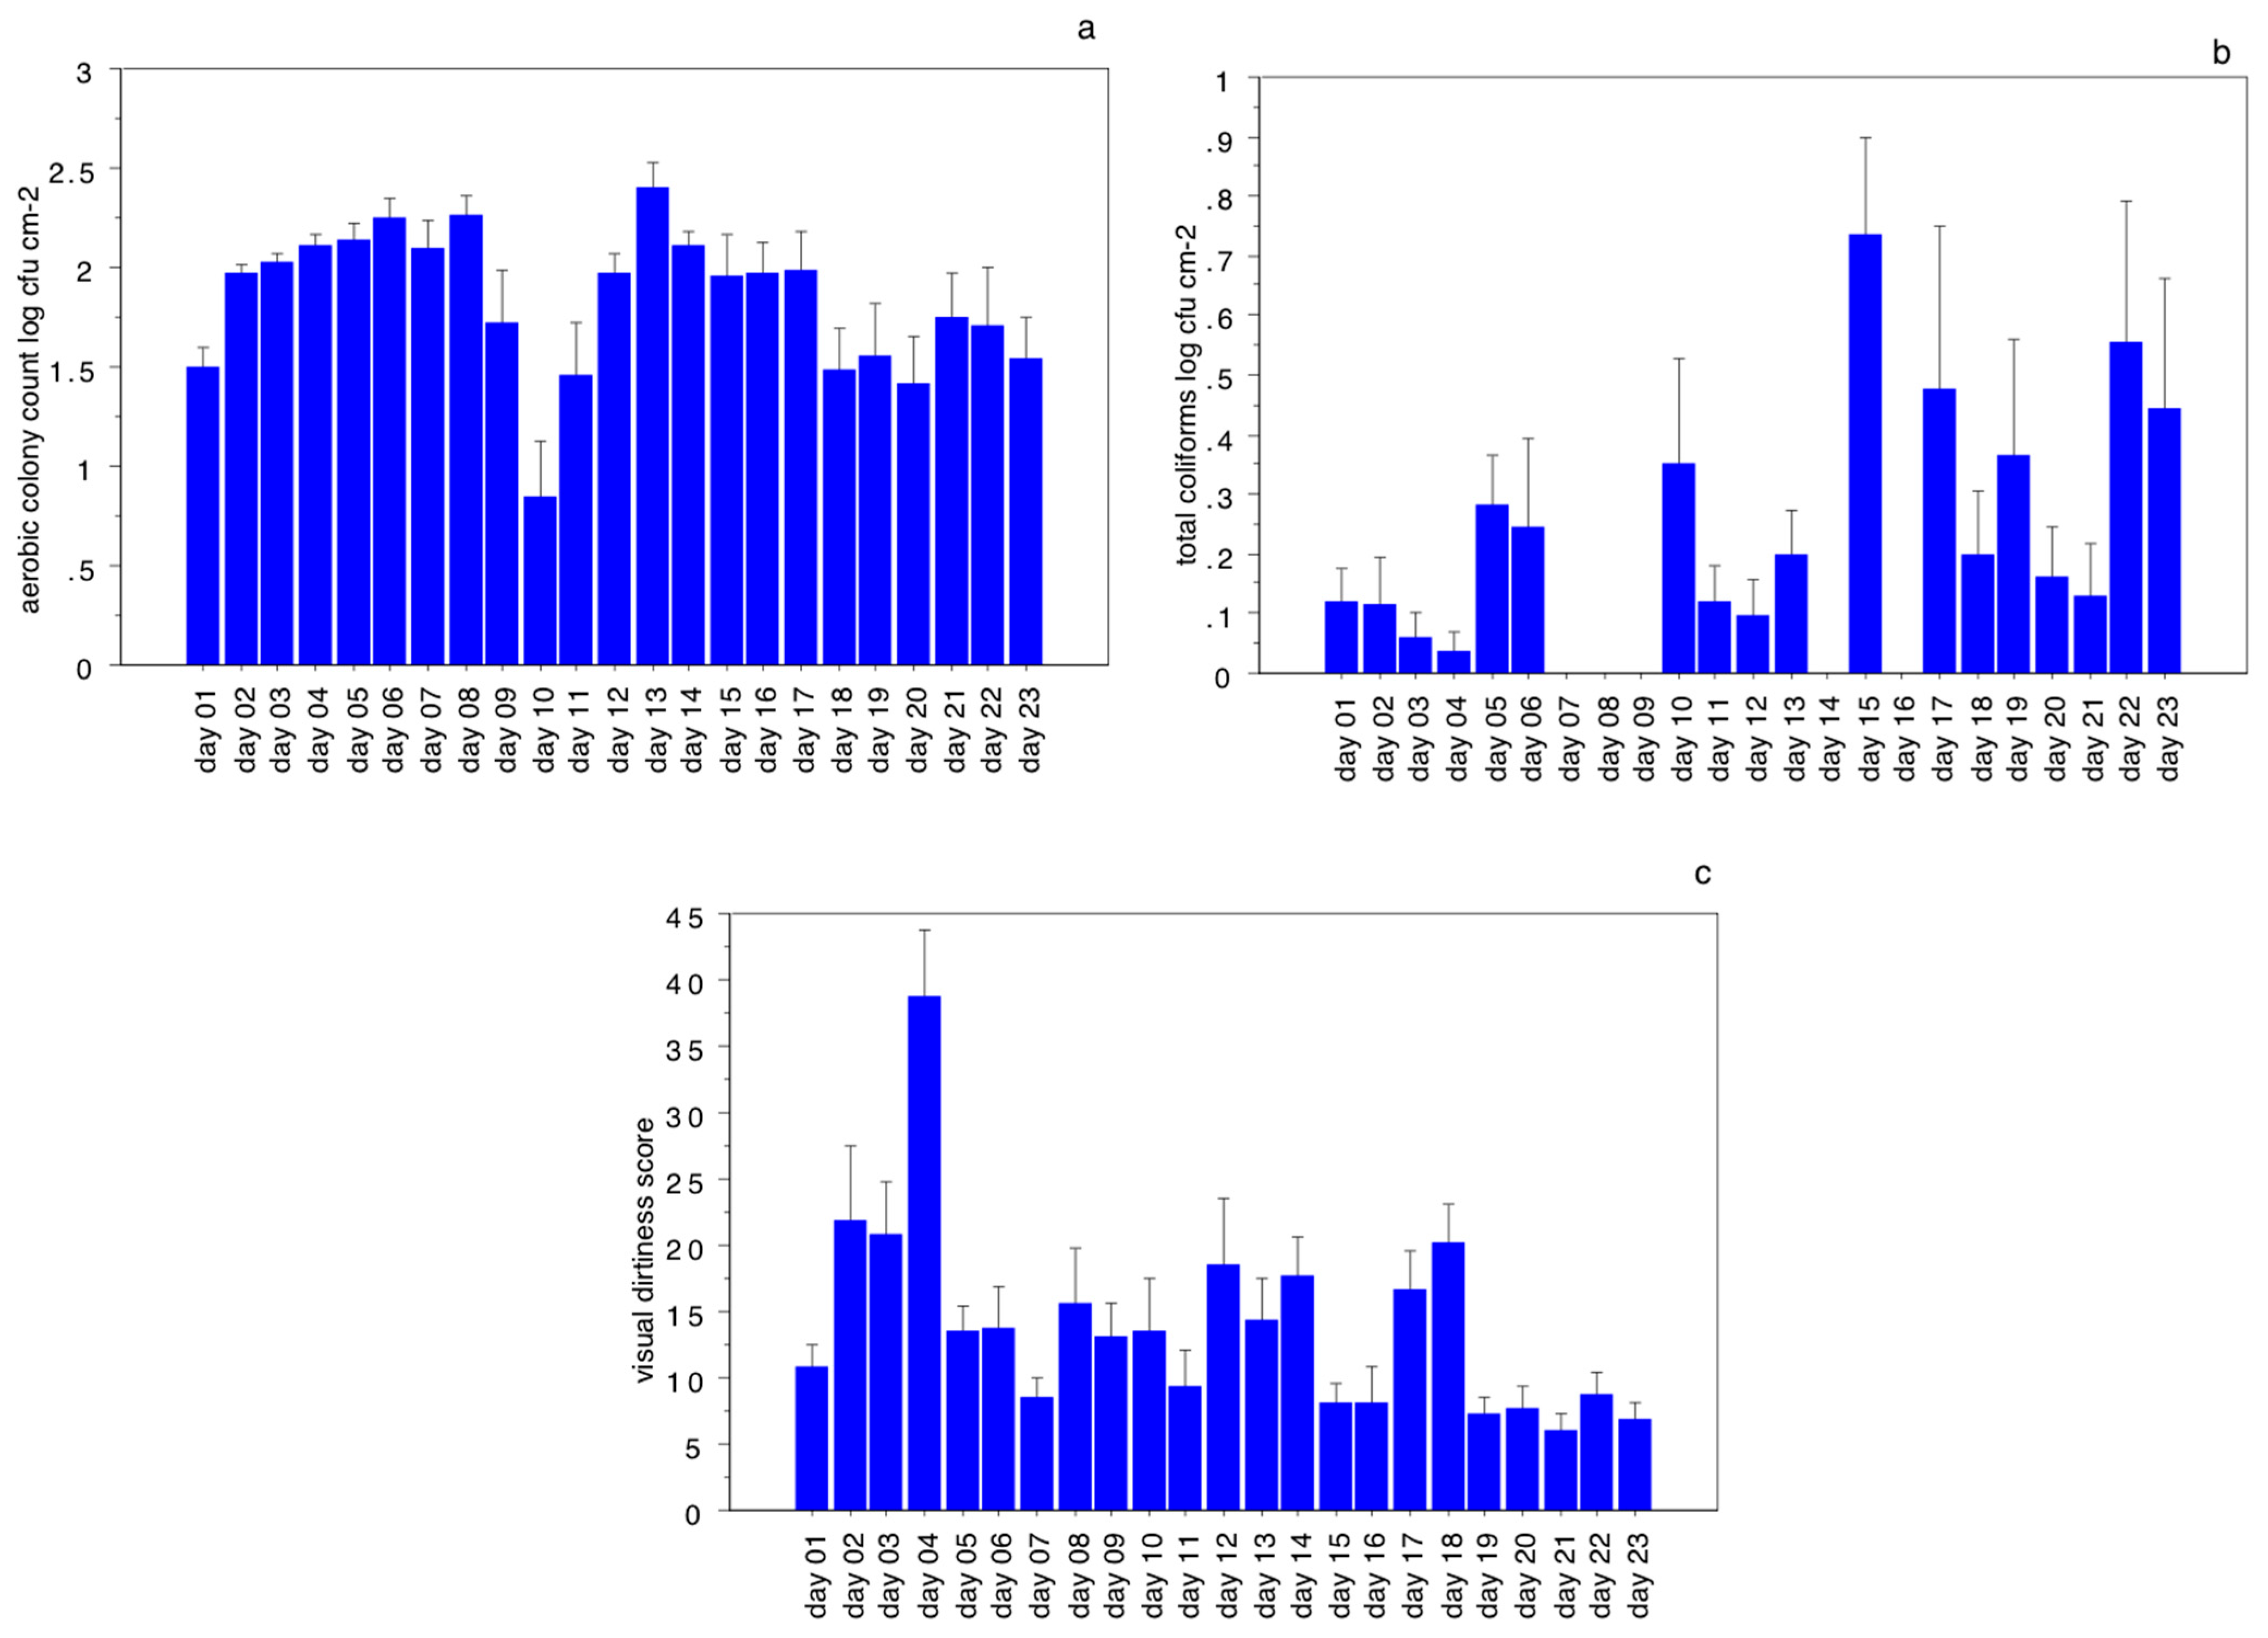
3.1. Microbial Count and Detection

Table 1 and Figure 1 show the results of the microbiological analysis. A total of 279 bovine carcasses were assessed throughout the entire study. The aerobic colony count showed a mean concentration value of 1.85 ± 0.60 log cfu/cm2 (minimum: 0 log cfu/cm2, maximum: 2.86 log cfu/cm2). All samples analyzed showed aerobic colony count values that were compliant with EU Regulation 2073/2005, which sets the following limits as process hygiene criteria for bovine carcasses: m = 3.5 log cfu/cm2 daily mean log and M = 5 log cfu/cm2 daily mean log. Total coliforms showed a mean concentration value of 0.20 ± 0.41 log cfu/cm2 (minimum: 0 log cfu/cm2, maximum: 2.10 log cfu/cm2). The presence of E. coli was detected in 45 carcasses (16.13%) out of the 279 analyzed. On 8 out of the 23 working days analyzed, none of the sampled carcasses showed the presence of E. coli. On 6 out of the 15 working days when E. coli was detected, only one carcass was positive.

3.2. Visual Dirtiness Score

Table 1 and Figure 1 show the results of the visual dirtiness score. A total of 279 bovine carcasses were assessed throughout the entire period analyzed. Regarding the visual dirtiness score for each animal, 77 carcasses (27.60%) were classified as not contaminated, 107 (38.35%) were classified as minimally contaminated, 55 (19.71%) were classified as moderately contaminated, 18 (6.45%) were classified as highly contaminated, and 22 (7.89%) were classified as extremely contaminated. Concerning the daily visual dirtiness score, values ranged from 6.10 (SD 3.87) to 38.85 (SD 21.98), with an average score of 15.25 (SD 14.67). The maximum value was recorded on day 4 and consistently exceeded all others.

3.3. Aerosol Monitoring

Table 1 shows the results of the aerosol monitoring. The index showed a mean value of 748.76 ± 158.14 (minimum: 553.99; maximum: 1061.42). Regarding daytime distribution, the maximum amount of particulate was registered between 5 a.m. and 7 a.m. on seven workdays and between 7 a.m. and 9 a.m. on the other two days. Every workday showed a lower particulate index in the late afternoon and at night, whereas higher values were registered during slaughtering hours, from early morning to noon (Figure 2).

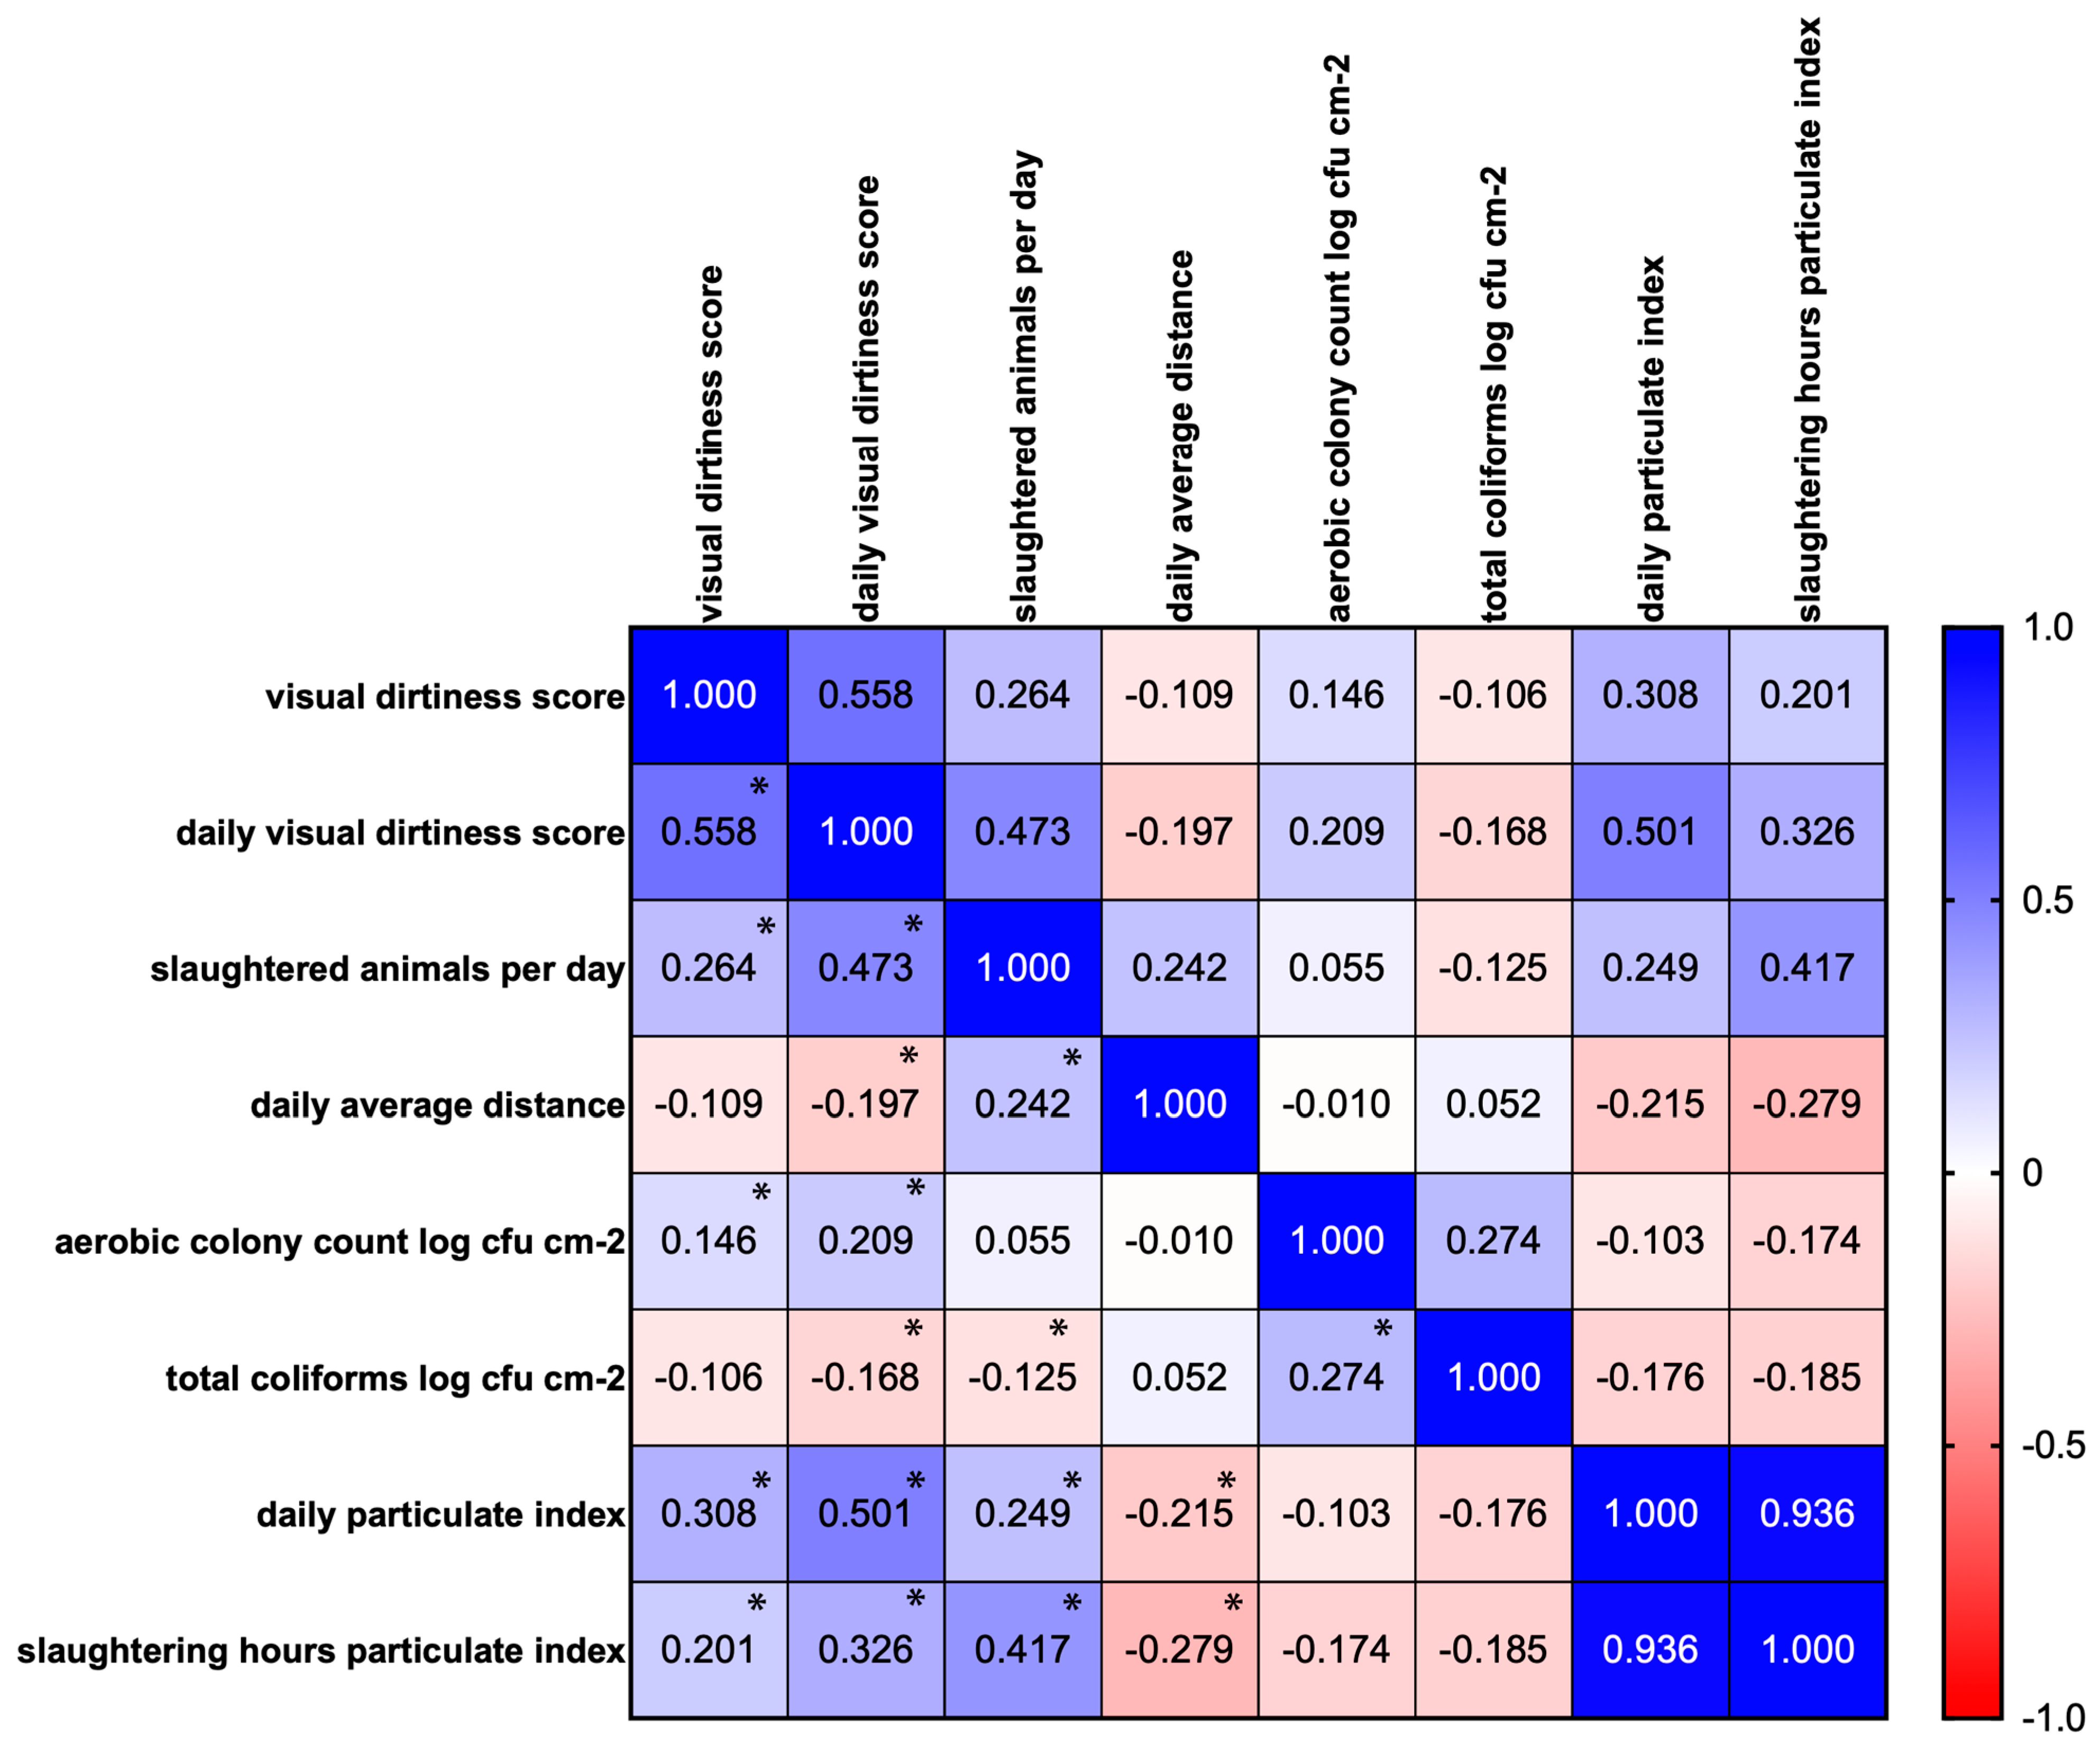
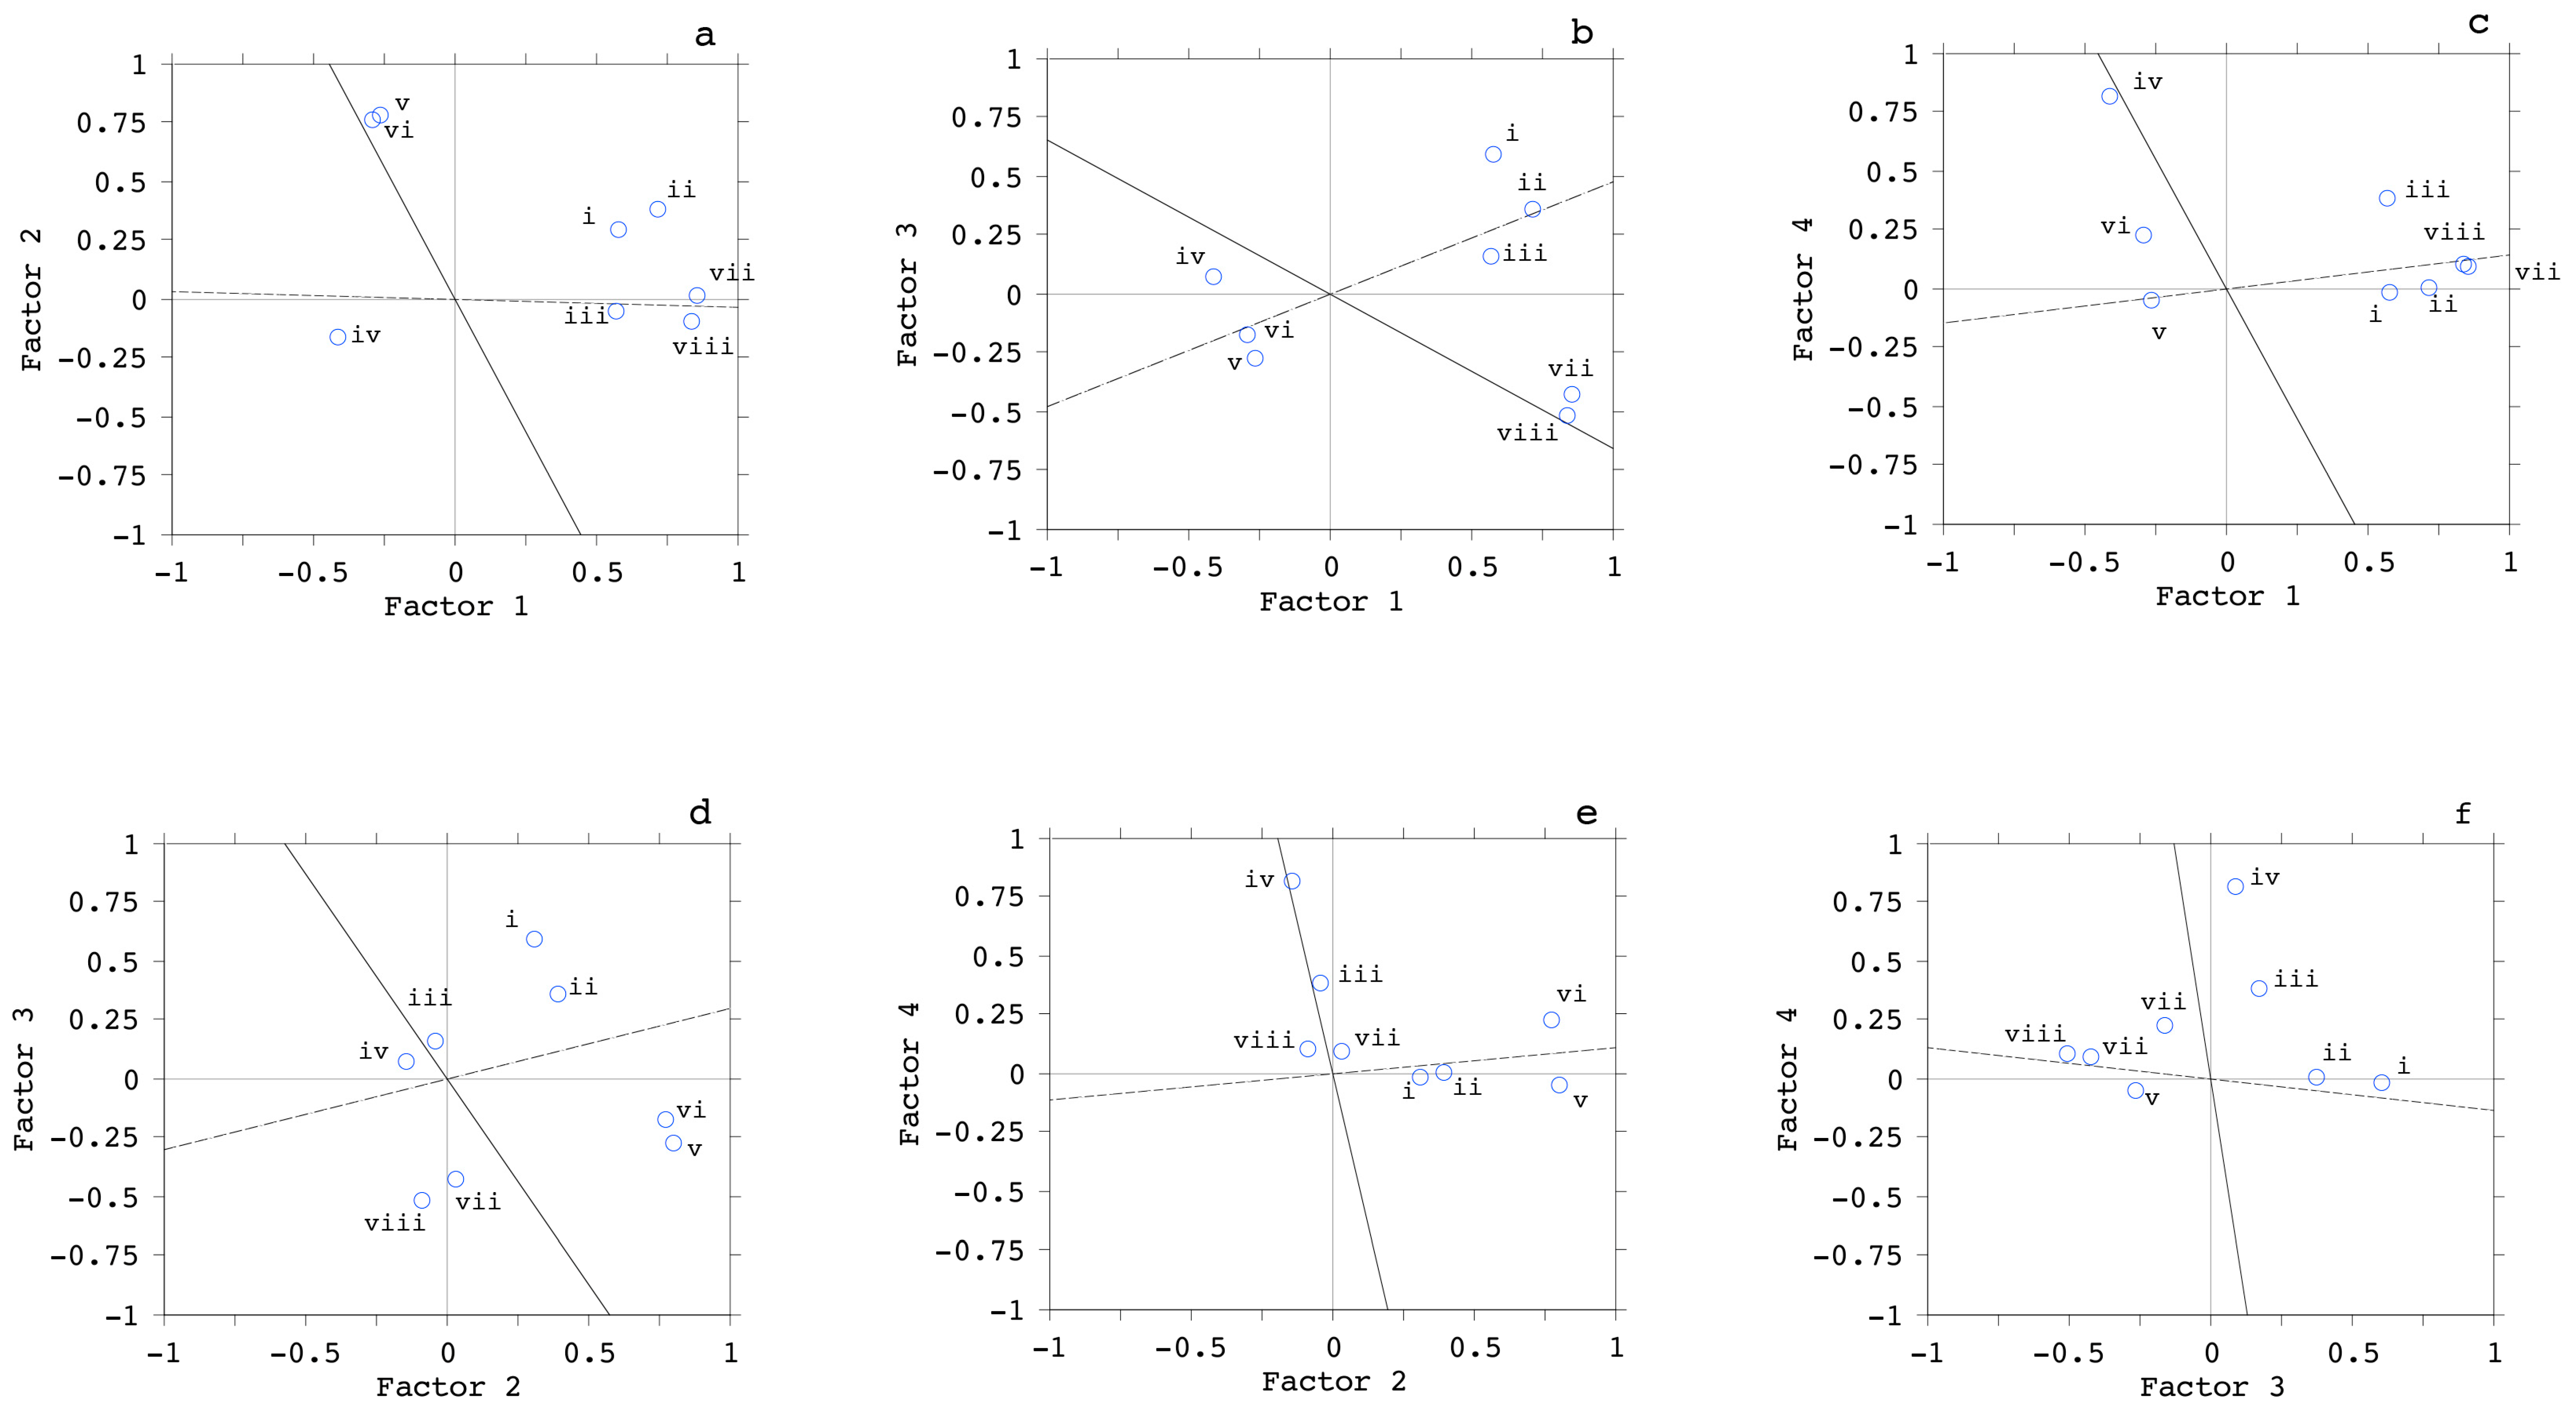
3.4. Correlation Analysis

Pearson correlation showed a positive correlation between the visual dirtiness score and the daily visual dirtiness score (r = 0.558; p < 0.0001), the visual dirtiness score and the daily particulate index (r = 0.308; p < 0.0001), the daily visual dirtiness score and the slaughtered animals per day (r = 0.473; p < 0.0001), the daily visual dirtiness score and the slaughtering hours particulate index (r = 0.326; p < 0.0001), the slaughtered animals per day and the slaughtering hours particulate index (r = 0.417; p < 0.0001), and the daily particulate index and the slaughtering hours particulate index (r = 0.936; p < 0.0001) (Figure 3 and Figure 4).
The logistic regression showed that, holding all other variables constant, the odds of E. coli on the carcass increased (19.884; 95% CI: 5.644–70.058) for a one-unit increase in aerobic colony count, and for total coliforms (32.409; 95% CI: 11.531–91.092), and slightly decreased for daily particulate index (0.998; 95% CI: 0.996–1.000) and the slaughtering hours particulate index (0.990; 95% CI: 0.982–0.999) (Table 2 and Figure 5).
Table 3 shows that the original number of eight variables considered can be reduced to four factors. The significant p-value of <0.001 of the Barlett chi-square test suggests that the collection of coefficients in the correlation matrix differs from zero and most likely does not occur by chance.
Table 4 reports the factor analysis results. It is possible to see from the communality summary that approximately 98% of the variation in the daily particulate index and in the slaughtering hours particulate index is predictable in a linear regression equation using the other seven variables. Computing the sum of the squared loadings results in the final estimate represents the total proportion of variance for each variable that can be predicted by the factors. Results showed that it is possible, by using four factors, to predict approximately 98% of the variation for the slaughtering hours particulate index, 91% of the daily particulate index, 88% of the daily average distance, 80% of the daily visual dirtiness score, 78% of the visual dirtiness score and the aerobic colony count, and 76% of the total coliforms.
This analysis clearly shows that the aerobic colony count and the total coliforms on the carcasses are associated with factor 2 and not with the other factors. On the other hand, the daily particulate index and the slaughtering hours particulate index are associated with factor 1; meanwhile, the visual dirtiness score and the daily visual dirtiness score are associated with factor 3. To better identify the factors, factor 1 could be named “aerosol quality”, factor 2 could be named “microbiology of the carcass”, and factor 3 could be named “visual dirtiness of the carcass”.
The plot of the oblique solution (Figure 6) shows the oblique axes passing through the clusters of points, as they do for the eight variables considered. The fact that the plotted primary axes are not at right angles demonstrates that they are correlated. Moreover, the structure of the oblique solution is simple: the axes pass directly through the clusters of variables or in close proximity. This demonstrates a strong association with the respective factors.

4. Discussion

In the European Union, Regulation 2073/2005 established the surveillance of aerobic colony counts and Enterobacteriaceae as process hygiene criteria for cattle, sheep, goat, horse, and pig carcasses. The aerobic colony count is mainly used as an indicator to monitor the hygiene of the entire meat production process, whereas Enterobacteriaceae are used to assess enteric contamination. These bacterial populations are often referred to as indicator organisms: testing them will give a better indication of the risk of the pathogenic organisms present. This is supported by the vast majority of the studies present in the literature that report a statistical correlation between hygiene indicator microorganisms and potential pathogens, such as E. coli [22,23]. However, it is well known that the presence of pathogens on carcasses is a multifactorial phenomenon, and examples of a lack of significant correlation between hygiene indicator microorganisms and pathogens can be found in the literature [24,25]. Ghafir et al. [26] analyzed the results from the official Belgian surveillance plan from 2000 to 2003, which included the monitoring of E. coli, Enterobacteriaceae, the aerobic colony, and Pseudomonas counts, and revealed no statistically significant correlation between indicator organisms and pathogens.
The cleanliness of cattle destined for slaughter is of great importance in limiting the contamination of carcasses and the plant environment. A relationship between animal dirtiness and the amount of material transferred to carcasses is generally accepted. However, information on the actual level of microbial contamination is unclear [18,27,28]. This is presumably due to the slaughter procedures applied, which can significantly influence the level of contamination, both positively (by carefully handling dirty animal carcasses) and negatively [19]. The application of an evaluation grid of the degree of cleanliness in cattle would allow the classification of the animals and enable practitioners to organize slaughter accordingly. It is thus possible to separately manage the dirtiest animals (similar to the approach applied to animals with suspected pathologies), which must undergo specific slaughtering procedures (times, distance between animals, greater accuracy of operations). The results obtained during this study show the possibility of introducing a similar, desirable classification and risk management system, based on the level of cleanliness or soiling of the carcasses after slaughter.
In a review paper published by Barco et al. [29], five papers [27,28,30,31,32] were considered to provide pertinent information on the potential relationship between fecal contamination of cattle carcasses and the presence of E. coli and Enterobacteriaceae (two of them reported data on E. coli, two on Enterobacteriaceae, and one on both). All five studies were conducted in commercial slaughterhouses and considered naturally contaminated carcasses. It was concluded that the identification of visibly contaminated animals and carcasses and the application of proper corrective measures for dirty animals and carcasses along the slaughter line can be effective approaches to reduce meat contamination.
Although visual inspection appears trivial, it is a very effective control method, as it is simple, quick, and enables all the carcasses to be assessed in real time. More specifically, an inspection for the visual dirtiness of the carcasses is much faster and cheaper than the classic microbiological methods currently used to assess the hygienic process criteria. Recognizing the contaminated carcasses before they enter the refrigerated rooms would enable any contact with the other carcasses to be avoided and allow the site of contamination and probable stage of slaughter to be identified, which would immediately and continually improve the process [33]. The main disadvantage of visual inspection lies in its inability to detect contamination in areas from which the material (feces, soil, or ingestion) has detached or been removed (e.g., rinsed) and continues to leave significant microbial loads on the surface. The results obtained in our study confirm these limitations, as they failed to demonstrate an association between the level of visual dirtiness of the carcass and the microbial loads. This lack of correlation may be related to the practices implemented by abattoir operators in order to clean the carcasses, e.g., washing. These practices should only be carried out in compliance with the guidelines on Good Manufacturing Practice (GMP) and Hazard Analysis and Critical Control Point (HACCP) systems; otherwise, they may have the dual function of removing macroscopic dirt without removing microorganisms, or worse, further spreading them.
At the same time, however, a correlation was demonstrated between visual dirtiness and aerosol particulates: this indicates the importance of evaluating these indicators not only to monitor process hygiene, but also to maintain the healthiness of the work environment and health of both animals and operators inside the abattoir. The literature reports a high variability in the correlation between aerosol quality and carcass contamination. This is not surprising, considering the large number of factors that can influence the results obtained in different studies, especially the abattoir layout, the number of animals processed per day, the temperature, the humidity, and the major air fluxes [34,35]. Various studies suggest there is no correlation between aerosol and carcass contamination levels for beef [36,37]. Another study, conducted in four pork and beef abattoirs, concluded there was a strong association between carcasses and air contamination during the slaughter of animals in the abattoirs investigated [38]. Similar results were reported earlier by other authors [39]. A recent study reported that the same bacterial species (Bacillus pumilus, Staphylococcus spp., E. coli, and Shigella flexneri) were isolated from air samples and carcasses, suggesting a possible cross-contamination, although the authors did not demonstrate the correlation [40]. In general, it has been suggested that it is difficult to make a definitive evaluation of the relationship between aerial and carcass contamination levels [36,41,42].
The results obtained in this study provide a scientific basis for understanding the importance of environmental health in slaughterhouses, which is crucial from a public health perspective. Our research offers valuable insights as it relies on data from a single abattoir and a large number of measurements, ensuring data consistency. While there may be limitations in generalizing our findings to a wider context due to the single-site focus, the study serves as an effective case study, providing a robust estimation of the phenomenon under study.

5. Conclusions

The control of carcass contamination in abattoirs is required by law to evaluate process hygiene criteria and to ensure food safety. Current laboratory methods have been criticized for being expensive and time-consuming. The development of innovative, cheaper, and faster methods is desirable.
The lack of correlation as shown by the Pearson coefficients between the visual dirtiness score or particulate indexes and the microbial load (−0.106 for visual dirtiness score vs. total coliforms, −0.103 for daily particulate index vs. aerobic colony count, −0.176 for daily particulate index vs. total coliforms, −0.174 for slaughtering hours particulate index vs. aerobic colony count, and −0.185 for slaughtering hours particulate index vs. total coliforms) suggests that alternative methods to microbial analysis are not yet adequate. On the other hand, the correlation between the daily visual dirtiness score and the daily particulate index (0.501) demonstrated that aerosol particulate monitoring and a visual classification of carcass dirtiness can provide good indications regarding the slaughtering process and the quality of the abattoir environment, and guarantee control over manufacturing practices and the protection of the animals’ and operators’ health.
Moreover, the results of the logistic regression (which showed a strong relationship between E. coli on the carcass and the aerobic colony count (R = 19.884, 5.644–70.058) or the total coliforms (32.409, 11.531- 91.092) but not with the other variables) demonstrate that, while microbiology analysis is valuable for identifying microorganisms that are undetectable through the official veterinarian’s post-mortem inspection, it seems ineffective in accurately evaluating the hygiene standards of manufacturing practices.
Aerosol particulate monitoring and a visual classification of carcass dirtiness, on the other hand, can provide good indications regarding the slaughtering process and the quality of the abattoir environment, and guarantee control over manufacturing practices and the protection of the animals’ and operators’ health.
The findings of our study were restricted to a single abattoir to maintain the consistency of results in a given controlled environment; as such, they highlight the significance of environmental health in slaughterhouses, offering crucial insights from a public health point of view.

Author Contributions

Conceptualization, L.G., E.T., M.Z. and B.T.C.-G.; methodology, L.G., E.T., M.Z. and B.T.C.-G.; software, S.E.-A. and M.Z.; validation, M.K., C.S. and J.G.-D.; formal analysis, L.G., E.T. and E.C.; investigation, M.M.; resources, B.T.C.-G.; data curation, L.G., E.M.A.-O. and B.T.C.-G.; writing—original draft preparation, L.G., M.Z. and B.T.C.-G.; writing—review and editing, M.K., S.E.-A., C.S. and J.G.-D.; visualization, C.S.; supervision, B.T.C.-G.; project administration, L.G. and B.T.C.-G.; funding acquisition, B.T.C.-G. All authors have read and agreed to the published version of the manuscript.

Funding

This work was supported by (a) European Food Safety Authority EU-FORA action grant [GP/EFSA/ENCO/2018/05—GA6-2020], (b) the University of Perugia, “Fondo Ricerca di Ateneo, edizione 2021” (MMMAINSTREAM project), (c) NextGenerationEU under the Italian Ministry of University and Research (MUR) National Innovation Ecosystem grant ECS00000041–VITALITY, (d) Researchers Supporting Project (RSP2024R111), King Saud University, Riyadh, Saudi Arabia.

Institutional Review Board Statement

Not applicable.

Informed Consent Statement

Not applicable.

Data Availability Statement

Data will be made available on request.

Acknowledgments

The authors wish to express sincere appreciation to members of Polyglot, Perugia for a careful reading and comments on the manuscript.

Conflicts of Interest

The authors declare no conflicts of interest.

References

  1. Diyantoro; Wardhana, D.K. Risk Factors for Bacterial Contamination of Bovine Meat during Slaughter in Ten Indonesian Abattoirs. Vet. Med. Int. 2019, 2019, 2707064. [Google Scholar] [CrossRef] [PubMed]
  2. Grispoldi, L.; Karama, M.; Hadjicharalambous, C.; de Stefani, F.; Ventura, G.; Ceccarelli, M.; Revoltella, M.; Sechi, P.; Crotti, C.; D’Innocenzo, A.; et al. Bovine lymph nodes as a source of Escherichia coli contamination of the meat. Int. J. Food Microbiol. 2020, 331, 108715. [Google Scholar] [CrossRef] [PubMed]
  3. (EC) No 853/2004; The European Parliament and of the Council of 29 April 2004 Laying down Specific Hygiene Rules for on the Hygiene of Foodstuffs. European Parliament and of the Council: Strasbourg, France, 2004.
  4. CAC/RCP 58—2005; Code of Hygiene Practice for Meat. Codex Alimentarius: Rome, Italy, 2005.
  5. (EC) No 2073/2005; The European Parliament and of the Council of 15 November 2005 on Microbiological Criteria for Foodstuffs. European Parliament and of the Council: Strasbourg, France, 2005.
  6. Theisinger, S.M.; Smidt, O. Bioaerosols in the Food and Beverage Industry. In Ideas and Applications toward Sample Preparation for Food and Beverage Analysis; Mark, T.S., Ed.; IntechOpen: Rijeka, Croatia, 2017; Chapter 3. [Google Scholar]
  7. European Food Safety Authority. Opinion of the Scientific Panel on biological hazards (BIOHAZ) on Revision of Meat Inspection for Beef raised in Integrated Production Systems. EFSA J. 2005, 3, 141. [Google Scholar] [CrossRef]
  8. European Food Safety Authority. Technical specifications on harmonised epidemiological indicators for biological hazards to be covered by meat inspection of bovine animals. EFSA J. 2013, 11, 3276. [Google Scholar] [CrossRef]
  9. Anderson, B.D.; Lednicky, J.A.; Torremorell, M.; Gray, G.C. The Use of Bioaerosol Sampling for Airborne Virus Surveillance in Swine Production Facilities: A Mini Review. Front. Vet. Sci. 2017, 4, 121. [Google Scholar] [CrossRef] [PubMed]
  10. Cundith, C.J.; Kerth, C.R.; Jones, W.R.; McCaskey, T.A.; Kuhlers, D.L. Air-cleaning Systems Effectiveness for Control of Airborne Microbes in a Meat-processing Plant. J. Food Sci. 2002, 67, 1170–1174. [Google Scholar] [CrossRef]
  11. Millner, P.D. Bioaerosols associated with animal production operations. Bioresour. Technol. 2009, 100, 5379–5385. [Google Scholar] [CrossRef] [PubMed]
  12. Ceccarelli, M.; Leprini, E.; Sechi, P.; Iulietto, M.F.; Grispoldi, L.; Goretti, E.; Cenci-Goga, B.T. Analysis of the causes of the seizure and destruction of carcasses and organs in a slaughterhouse in central Italy in the 2010–2016 period. Ital. J. Food Saf. 2018, 7, 40–44. [Google Scholar] [CrossRef] [PubMed]
  13. Guardone, L.; Vitali, A.; Fratini, F.; Pardini, S.; Goga, B.T.C.; Nucera, D.; Armani, A. A retrospective study after 10 years (2010–2019) of meat inspection activity in a domestic swine abattoir in tuscany: The slaughterhouse as an epidemiological observatory. Animals 2020, 10, 1907. [Google Scholar] [CrossRef] [PubMed]
  14. Chalias, A.; Grispoldi, L.; Cenci Goga, B. A risk assessment model for Salmonella spp. in swine carcasses. EFSA J. 2022, 20, e200405. [Google Scholar] [CrossRef] [PubMed]
  15. García-Díez, J.; Saraiva, S.; Moura, D.; Grispoldi, L.; Cenci-Goga, B.T.; Saraiva, C. The Importance of the Slaughterhouse in Surveilling Animal and Public Health: A Systematic Review. Vet. Sci. 2023, 10, 167. [Google Scholar] [CrossRef] [PubMed]
  16. Sechi, P.; Cambiotti, V.; Parmegiani, S.; Baldinelli, C.; Iulietto, M.F.; Cenci Goga, B. Isolation of escherichia coli from lymph nodes of bovine carcasses and detection of hlyA gene with PCR. Ital. J. Food Saf. 2012, 1, 23–26. [Google Scholar] [CrossRef]
  17. Trevisani, M.; Rosamilia, A.; Micheli, M.R.; Guidi, E.; Cenci Goga, B. Perspectives in the implementation of risk-based meat safety assurance system (RB-MSAS) in broiler meat production. Food Control 2024, 160, 110308. [Google Scholar] [CrossRef]
  18. Hauge, S.J.; Nesbakken, T.; Moen, B.; Røtterud, O.J.; Dommersnes, S.; Nesteng, O.; Østensvik, Ø.; Alvseike, O. The significance of clean and dirty animals for bacterial dynamics along the beef chain. Int. J. Food Microbiol. 2015, 214, 70–76. [Google Scholar] [CrossRef] [PubMed]
  19. Ferri, M.; Blagojevic, B.; Maurer, P.; Hengl, B.; Guldimann, C.; Mojsova, S.; Sakaridis, I.; Antunovic, B.; Gomes-Neves, E.; Zdolec, N.; et al. Risk based meat safety assurance system—An introduction to key concepts for future training of official veterinarians. Food Control 2023, 146, 109552. [Google Scholar] [CrossRef]
  20. ISO 17604:2015; Microbiology of the Food Chain—Carcass Sampling for Microbiological Analysis. International Standards Organisation: Geneva, Switzerland, 2015.
  21. Lederberg, J.; Lederberg, E.M. Replica plating and indirect selection of bacterial mutants. J. Bacteriol. 1952, 63, 399–406. [Google Scholar] [CrossRef] [PubMed]
  22. European Food Safety Authority. Scientific Opinion on the public health hazards to be covered by inspection of meat (poultry). EFSA J. 2012, 10, 2741. [Google Scholar] [CrossRef]
  23. European Food Safety Authority. Scientific Opinion on the public health hazards to be covered by inspection of meat (bovine animals). EFSA J. 2013, 11, 3266. [Google Scholar] [CrossRef]
  24. Barco, L.; Belluco, S.; Roccato, A.; Ricci, A. A systematic review of studies on Escherichia coli and Enterobacteriaceae on beef carcasses at the slaughterhouse. Int. J. Food Microbiol. 2015, 207, 30–39. [Google Scholar] [CrossRef] [PubMed]
  25. Cenci-Goga, B.T.; Miraglia, D.; Ranucci, D.; Branciari, R.; Budelli, L.; McCrindle, C.M.; Cioffi, A.; Mammoli, R. An in vitro system for the comparison of excision and wet-dry swabbing for microbiological sampling of beef carcasses. J. Food Prot. 2007, 70, 930–936. [Google Scholar] [CrossRef] [PubMed]
  26. Ghafir, Y.; China, B.; Dierick, K.; De Zutter, L.; Daube, G. Hygiene indicator microorganisms for selected pathogens on beef, pork, and poultry meats in Belgium. J. Food Prot. 2008, 71, 35–45. [Google Scholar] [CrossRef] [PubMed]
  27. Blagojevic, B.; Antic, D.; Ducic, M.; Buncic, S. Visual cleanliness scores of cattle at slaughter and microbial loads on the hides and the carcases. Vet. Rec. 2012, 170, 563. [Google Scholar] [CrossRef] [PubMed]
  28. Serraino, A.; Bardasi, L.; Riu, R.; Pizzamiglio, V.; Liuzzo, G.; Galletti, G.; Giacometti, F.; Merialdi, G. Visual evaluation of cattle cleanliness and correlation to carcass microbial contamination during slaughtering. Meat Sci. 2012, 90, 502–506. [Google Scholar] [CrossRef] [PubMed]
  29. Barco, L.; Belluco, S.; Roccato, A.; Ricci, A. Escherichia coli and Enterobacteriaceae counts on pig and ruminant carcasses along the slaughterline, factors influencing the counts and relationship between visual faecal contamination of carcasses and counts: A review. EFSA Support. Publ. 2014, 11, 634E. [Google Scholar] [CrossRef]
  30. Gill, C.O.; Landers, C. Microbiological conditions of detained beef carcasses before and after removal of visible contamination. Meat Sci. 2004, 66, 335–342. [Google Scholar] [CrossRef] [PubMed]
  31. Hauge, S.J.; Nafstad, O.; Røtterud, O.-J.; Nesbakken, T. The hygienic impact of categorisation of cattle by hide cleanliness in the abattoir. Food Control 2012, 27, 100–107. [Google Scholar] [CrossRef]
  32. McCleery, D.R.; Stirling, J.M.E.; McIvor, K.; Patterson, M.F. Effect of ante- and postmortem hide clipping on the microbiological quality and safety and ultimate pH value of beef carcasses in an EC-approved abattoir. J. Appl. Microbiol. 2008, 104, 1471–1479. [Google Scholar] [CrossRef]
  33. Cenci-goga, B.; Amicabile, A.; Karama, M.; El-ashram, S.; Saraiva, C.; García-díez, J.; Finotti, S.; Genna, V.; Moretti, G.; Murari, R.; et al. Effect of delayed refrigeration on the microbial carcass contamination of wild boars (Sus scrofa). Animals 2021, 11, 1434. [Google Scholar] [CrossRef] [PubMed]
  34. Beck, S.H.; Castillo, A.; Kinney, K.A.; Zuniga, A.; Mohammad, Z.; Lacey, R.E.; King, M.D. Monitoring of Pathogenic Bioaerosols in Beef Slaughter Facilities Based on Air Sampling and Airflow Modeling. Appl. Eng. Agric. 2019, 35, 1015–1036. [Google Scholar] [CrossRef]
  35. Jericho, K.W.F.; Ho, J.; Kozub, G.C. Aerobiology of a High-Line Speed Cattle Abattoir. J. Food Prot. 2000, 63, 1523–1528. [Google Scholar] [CrossRef]
  36. Burfoot, D.; Whyte, R.; Tinker, D.; Howell, M.; Hall, K.; Holah, J.; Smith, D.; White, R.; Baker, D.; McIntosh, J. Importance of airborne contamination during dressing of beef and lamb carcasses. J. Food Prot. 2006, 69, 2828–2836. [Google Scholar] [CrossRef] [PubMed]
  37. Fournaud, J.; Bertaud, M. Air contamination in slaughter houses and bacteriological quality of the bovine carcasses. In Proceedings of the Europäischer Fleischforscher-Kongress, Wien, Austria, 24–28 August 1981; pp. 188–191. [Google Scholar]
  38. Rahkio, T.M.; Korkeala, H.J. Airborne bacteria and carcass contamination in slaughterhouses. J. Food Prot. 1997, 60, 38–42. [Google Scholar] [CrossRef] [PubMed]
  39. Sirami, J. La contamination microbiologique de l’air dans le hall d’abattage: Facteurs de variation et influence sur la carcasse. Viande Prod. Carnés 1989, 10, 109–116. [Google Scholar]
  40. Williams, S.K.; Cosenza-Sutton, G.H. Enumeration and Identification of Microorganisms Present in Bioaerosols in a Bovine Harvesting Facility. Direct Res. J. Agric. Food Sci. 2020, 8, 198–207. [Google Scholar]
  41. Okraszewska-Lasica, W.; Bolton, D.J.; Sheridan, J.J.; McDowell, D.A. Comparison of aerial counts at different sites in beef and sheep abattoirs and the relationship between aerial and beef carcass contamination. Food Microbiol. 2012, 32, 325–331. [Google Scholar] [CrossRef] [PubMed]
  42. Prendergast, D.; Daly, D.; Sheridan, J.; McDowell, D.; Blair, I. The effect of abattoir design on aerial contamination levels and the relationship between aerial and carcass contamination levels in two Irish beef abattoirs. Food Microbiol. 2004, 21, 589–596. [Google Scholar] [CrossRef]
Figure 1. (a,b) Microbiological analyses per slaughtering day; (c) visual dirtiness score per slaughtering day (n = 279).
Microbiolres 15 00039 g001
Figure 2. Amounts of aerosol particulates measured at two-hour intervals and expressed as absorbance (pixel grey level). Data are presented as mean ± SD, n = 9.
Microbiolres 15 00039 g002
Figure 3. Pearson r correlation for the eight variables: * indicates statistically significant correlations (p < 0.05).
Microbiolres 15 00039 g003
Figure 4. Scattergrams for: (a) visual dirtiness score vs. daily visual dirtiness score (r2 = 0.311); (b) visual dirtiness score vs. daily particulate index (r2 = 0.095); (c) daily visual dirtiness score vs. slaughtered animals per day (r2 = 0.224); (d) daily visual dirtiness score vs. slaughtering hours particulate index (r2 = 0.107); (e) slaughtered animals per day vs. slaughtering hours particulate index; (r2 = 0.173) (f) daily particulate index vs. slaughtering hours particulate index (r2 = 0.877).
Microbiolres 15 00039 g004
Figure 5. Bar plot (mean and 95% percentile) comparing E. coli negative (blue) and positive (red) samples: (a) visual dirtiness score; (b) daily visual dirtiness score; (c) aerobic colony count log cfu cm−2; (d) total coliform log cfu cm−2; (e) daily particulate index; (f) slaughtering hours particulate index; (g) slaughtered animals per day; (h) daily average distance.
Microbiolres 15 00039 g005
Figure 6. Oblique factor plot, factor analysis. Factor 1 (ac): “aerosol quality”. Factor 2 (d,e): “microbiology of the carcass”. Factor 3 (f): “visual dirtiness of the carcass”. (i) Visual dirtiness score; (ii) daily visual dirtiness score; (iii) slaughtered animals per day; (iv) daily average distance; (v) aerobic colony count; (vi) total coliforms; (vii) daily particulate index; (viii) slaughtering hours particulate index.
Microbiolres 15 00039 g006
Table 1. Results of the microbiological analysis and other variables.
Visual Dirtiness ScoreSlaughtered Animals Per DayCarcasses AnalyzedDaily Average Distance (km)Aerobic Colony Count (log cfu/cm2)Total Coliforms (log cfu/cm2)Daily Particulate IndexSlaughtering Hours Particulate IndexE. coli (n of Positive Carcasses)
meansd meansdmeansdmeansd
Day 110.896.8911019125.70156.571.490.450.120.25n.e.n.e.1
Day 221.9524.4611120138.55164.581.980.180.120.35n.e.n.e.1
Day 320.8916.5912018115.22150.722.030.150.060.18n.e.n.e.1
Day 438.8521.9811720123.12158.032.110.240.040.16n.e.n.e.4
Day 513.537.3410015145.90177.522.140.240.280.31n.e.n.e.9
Day 613.8310.5011312124.38154.492.250.260.250.51n.e.n.e.4
Day 78.504.639510145.68169.992.090.440.000.00n.e.n.e.0
Day 815.6013.4810010145.63171.092.260.290.000.00n.e.n.e.0
Day 913.108.1310410152.70166.271.730.710.000.00n.e.n.e.0
Day 1013.4412.111089138.37162.250.840.800.350.53n.e.n.e.0
Day 119.338.0847934.1744.991.460.720.120.19n.e.n.e.0
Day 1218.6015.4412310117.12157.201.980.280.100.20n.e.n.e.1
Day 1314.3513.1210117186.39165.172.400.380.200.32n.e.n.e.8
Day 1417.709.3912510133.20158.672.110.220.000.00n.e.n.e.2
Day 158.204.648210133.75172.761.960.640.730.52602.98198.875
Day 168.208.4710210131.20156.491.970.490.000.00607.08242.170
Day 1716.708.838010156.79176.481.990.630.480.87779.46251.502
Day 1820.308.7313010104.12156.011.490.670.200.34872.69376.241
Day 197.204.4410210119.51165.601.560.820.370.62890.01378.821
Day 207.705.2510910175.91168.131.410.780.160.281061.42364.180
Day 216.103.877510120.60162.571.750.700.130.28659.86232.520
Day 228.705.6411410155.30159.251.700.920.560.74553.99101.183
Day 236.804.499810154.83160.111.540.690.450.68711.34213.342
Note: n.e.—not evaluated.
Table 2. Factors associated with positivity to E. coli: results of logistic regression for each variable.
FactorR (95% C.I.)p
Visual dirtiness score1.001 (0.980–1.023)0.9232
Daily visual dirtiness score1.004 (0.966–1.044)0.8259
Aerobic colony count19.884 (5.644–70.058)<0.0001 *
Total coliforms32.409 (11.531–91.092)<0.0001 *
Daily particulate index0.998 (0.996–1.000)0.0358 *
Slaughtering hours particulate index0.990 (0.982–0.999)0.0327 *
Slaughtered animals per day0.998 (0.979–1.017)0.8252
Daily average distance1.010 (0.999–1.021)0.771
R: odd ratio, p: p-value, *: p < 0.05.
Table 3. Factor analysis summary.
Number of Variables8
Est. number of factors4
Number of factors4
Degrees of Freedom35
Barlett’s Chi Square481.458
p-value<0.0001
Extraction method factor: principal components. Extraction rule: method default. Transformation method: Orthotran/Varimax.
Table 4. Factor analysis results.
Communality SummaryOblique Solution Reference Structure
SMCFinal EstimateFactor 1Factor 2Factor 3Factor 4
Visual dirtiness score0.3830.782−0.198−1.818 × 10−40.962−0.052
Daily visual dirtiness score0.8570.8030.0620.1420.851−0.075
Slaughtered animals per day0.7910.5000.288−0.1220.4510.344
Daily average distance0.4640.878−0.0010.019−0.0400.878
Aerobic colony count0.3440.7760.0260.883−0.010−0.135
Total coliforms0.3480.7640.0210.8730.1100.151
Daily particulate index0.9810.9140.8040.052−4.405 × 10⁻⁴−0.036
Slaughtering hours particulate index0.9810.9780.8740.022−0.138−0.015
Disclaimer/Publisher’s Note: The statements, opinions and data contained in all publications are solely those of the individual author(s) and contributor(s) and not of MDPI and/or the editor(s). MDPI and/or the editor(s) disclaim responsibility for any injury to people or property resulting from any ideas, methods, instructions or products referred to in the content.

