1. Introduction
Ireland is aiming to produce renewable sources of energy in order to improve the rural economy, strengthen the security of national energy supply and reduce the negative impact that fossil fuels bring to the environment. Biomass, including agricultural crops and residues, can be converted to other more useful forms of energy through mechanical, chemical, biochemical and thermochemical platforms [
1,
2]. Potential sources of biomass in Ireland include agricultural crops and residues, industrial waste and municipal waste. Although waste sources are generally the cheapest, their availability is limited and their structure and composition can be inconsistent, which makes them less suitable for many handling and processing methods. In contrast, agricultural crops and residues tend to be more homogeneous and easier to handle. For this reason, it can be expected that any significant proliferation in the use of biomass for energy will include, to a large extent, the use of biomass from agricultural crops and residues. In most cases, the large scale use of bioenergy will require the construction of large scale facilities being supplied with large quantities of biomass—generally in the range of 200 to 2,000 t per day [
3,
4]. Biomass processing facilities are not currently a significant feature of Ireland’s economy on a large scale, although they are prevalent in many other countries, such as the United States and Brazil, as well as other European Union (EU) countries, such as the United Kingdom (UK), France and Germany [
5,
6].
There are a number of domestic and external drivers of bioenergy technologies. For example, Ireland as an EU member is subject to EU directives, where particular goals are set out regarding bioenergy, such as the Renewable Energy Directive (RED, EU directive 2009/28/EC) and the Biofuels Directive (EU directive 2003/30/EC) [
7,
8]. Another major external driver of renewable energy has been the Kyoto agreement, which sets out targets for reductions in greenhouse gas (GHG) emissions to 13% above 1990 levels and in so doing indirectly drives bioenergy demand [
9]. These external drivers as well as domestic policy goals have lead to two important policy statements by the Irish government—the energy white paper and the bioenergy actions plan [
10,
11]. Refined and unrefined bioenergy products can be sourced both domestically and internationally and indeed considerable global trade in these products already exist. However, in the longer term, as more countries aim to develop their own indigenous energy sources, surplus foreign supplies cannot be entirely relied upon to meet the Republic of Ireland’s domestic demand. For this reason, the authors focus most of this study on domestic supply and use scenarios. Also, using domestically produced biomass considerably shortens both the supply chain and the life-cycle of the final product, resulting in considerably easier measurement of life-cycle greenhouse gas emissions. This is particularly relevant given the requirement for 35% reduction of life-cycle greenhouse gas emissions outlined in the EU directive 2009/28/EC for biofuels up 2017 and a 50% reduction required beyond that to 2020.
Ireland’s landscape is largely dominated by grass species grown in small irregular fields bounded by an almost completely interconnected network of hedgerows, treelines and stone walls with considerable aesthetic and ecological value [
12]. As a result, the boundaries of the nation’s fields also store significant quantities of carbon within the biomass of the flora inhabiting those boundaries. Hedgerows and treelines in particular are diverse sources of permanent habitats and stores of carbon. Ireland has already seen a reduction in the length and distribution of hedgerows, largely due to the consolidation of small fields into larger fields to increase the efficiency of mechanized processes, although it has not been as prevalent as some other countries like the UK and France [
12].
The aim therefore of this paper is to: (1) determine the size and extent of Ireland’s fields and the current contribution of their boundaries to habitats and carbon storage, (2) calculate the impact of field size on the operating costs of biomass sowing and harvesting operations, and (3) determine, using these outputs, if Ireland’s field boundaries are at risk from field consolidation, and if so, what are the potential impacts of meeting bioenergy targets using indigenously sourced feedstock.
2. Methodology
2.1. GIS Analysis
GIS software [
13] was used to determine the extent and distribution of various land uses, soil types and field sizes across the Republic of Ireland. The main source of land use data was the Corine database [
14] and the main source of soil data was the detailed soil map of Ireland [
15,
16,
17]. The detailed soils map of Ireland was used in conjunction with the Corine database to determine the extent of lands within the agricultural area that could be used to grow different biomass crops. The 41 soil classifications within the digitized soils maps were re-classified on a scale of 1–5, based on their potential suitability for the production of a range of potential farm grown biomass crops, including willow, miscanthus and a general arable crops classification. The Corine database was then used to determine those areas within the soils map classifications that were actually available for a land use change that would result from the production of these crops, which for this study was taken to be the non-irrigated arable area, pasture area, and the area classified as complex cultivations. Classifications that were deemed unavailable included classifications such as urban, forestry and raised and blanket peats, bare rock, etc.
Since no detailed data on field sizes or their distribution existed, the data was generated as part of this study. To generate the required data, a survey of Ireland’s fields and their boundaries was conducted using satellite imagery. The survey took 88 points across the Republic of Ireland’s agricultural area with the average field size and boundary density around each point determined. For the purpose of the survey, a field was classified as a clear area of land in agricultural use within physical observable boundaries. Once completed for all 88 points, the data for each point were processed using the GIS software, which was in turn used to interpolate the data to create a general distribution map of field sizes across Ireland. The statistics from the survey were also broken down to county and regional statistics.
2.2. Determining Land Requirements to Meet Bioenergy Targets
In order to determine how much land would be needed to produce the required quantities of biofuels, the gross energy outputs of a range of feedstock and biofuels were calculated using data from various sources [
18,
19,
20,
21]. Once the yield of energy (MJ) per unit mass (kg) of feedstock and the yield of mass per unit area (t/ha) were known, an estimate of the land requirements to meet the national bioenergy targets were determined.
2.3. Efficiency and Operating Cost Calculations
In order to determine what field sizes and consequently what parts of the potential growing area for each crop would be endangered the most from intensive boundary removal, the operating output and economic cost associated with different field operations for each crop was determined. Depending on the feedstock in use, there can be a number of field operations throughout the growth cycle, such as sowing, chemical applications, fertilizer applications and harvesting. In relation to the efficient supply of biomass, the most time-restricted is sowing and harvesting. Sowing may be either an annual operation, for crops such as wheat and oilseed rape, or it may be conducted only once over many seasons, as in the case of the perennial crops willow and miscanthus. As the sowing and harvest date can have a significant impact on the crop production, there exists a time frame in which the optimal establishment and harvesting of the crop can be achieved. Within this generally fixed time frame, the entire area of a particular crop must be either sown or harvested. However, if there are excess machines relative to the total area and available time, then not all machinery owners will be able to efficiently recover their fixed costs; if there are too few machines, then the total crop area will not be processed within the operating time frame and may lay lead to crop losses and higher costs. In order to determine the fixed costs associated with a particular operation, it is necessary to calculate either the time or area that a particular machine is operational over the course of a year. Based on the methodologies described by Hunt [
22] and machinery operating capacities described by various machinery providers [
23,
24,
25], we conducted modeling to determine the efficiency, operating capacities and costs of biomass crop sowing and harvesting operations, in relation to field size.
To determine the fixed cost per unit of time or area, the total annual working time or area must be known. Time is a useful unit because it is a value that can be easily predetermined or alternatively recorded in retrospect by consulting a machines tachometer. However, it does not differentiate between the time spent actually carrying out an intended operation and the time spent doing non-productive work such as road travel, infield turning, etc. The total time that a machine is associated with either planting or harvesting a crop during a working day will be spent effectively in three (assuming no breakdowns) stages. This includes, time spent in the field working and conducting the operation for which it is intended (e.g., actually chipping willow stands), time spent in the field but not conducting the operation for which it was intended (e.g., time spent turning at headlands), and finally time spent outside the field perimeter in transit between fields. Once the time spent during an average working day within each of these time intervals is known, an effective capacity in ha/day or ha/h can be calculated, and once the total number of hours or days available each year is known, a total ha/year value can also be calculated (Equation 1) [
22]:
where:
C = effective capacity (ha/hr)
S = speed (km/hr)
w = rated width of machine/implement
Ew = effective width coverage (decimal of rate width)
L = length of field (m)
D = unproductive time (hr/ha)
t = turning time, (s/turn)
c1 = constant (10)
c2 = constant (2.778)
This equation can be used to determine both productive and unproductive time spent within a field’s boundary. Outside of a field’s boundary, productive time can also be lost resulting from the need to travel to and from each field. This will not affect field efficiency or capacity but will still reduce the overall efficiency and capacity over longer periods. For example, the ratio of road travel time to field time would be expected to be proportionally greater for smaller operating fields than larger fields, which will ultimately have a negative impact on the efficiency and capacity over longer periods of time. Therefore, the impact of field size and related road travel time on efficiency and capacity were calculated by estimating travel speed and road distance. For this calculation, the road distance between each field was considered to be proportional to the field size, e.g., if the average field size was 5 ha then the average road distance between fields was assumed 5 km. Combining these two calculations, an estimate of time spent during a day either conducting productive or unproductive work is achieved and can be used to determine operating efficiency (%) and effective operating capacity (ha/day). Once the daily effective operating capacity of an operation was known for a particular area with a known average field size, the annual capacity of a machine can be determined as the product of the effective daily operating capacity and the total available time or operating window (Equation 2):
where:
A = Seasonal total operating area (ha)
Ct = Effective daily operating capacity (ha/day)
t = Operating window (days)
Having calculated the likely area over which a particular operation can occur based on the average field size within that area, the fixed costs can now be discounted over that area, so as to give the variable costs (fuel, labor, etc.) and determine the total operating cost. The annual fixed costs were calculated for a range of sowing and harvesting operations based on machinery capital costs and other fixed costs such as insurance, maintenance and depreciation costs.
2.4. Measuring Habitat and Carbon Storage Values
Total carbon storage (measured in tonnes of carbon per hectare, tC/ha) is a factor of the amount of biomass contained along the field boundary and the total length of boundary. Habitat size, on the other hand, is a factor of the total length and width of boundary and was measured in hectares per square kilometer (ha/km
2). It was estimated that the average width of a field boundary was 2 m. From the carbon storage perspective, the type of biomass growing in the boundary must be considered. As previously stated, the Republic of Ireland has an almost continuous network of interlinked field boundaries consisting of hedgerows, treelines, stone walls and others such as water bodies, roads, paths, etc., each with different carbon storage capacities. It was estimated using data [
26] and Smals badger and habitat survey [
27] that there are 410,000 km of stone walls, 327,258 km of hedgerows and 54,796 km of tree lines. Data from this study suggests a total boundary length in the Republic of Ireland of 796,616 km, which compares favorably with Aalen’s [
12] given estimate of 830,000 km. Based on this data, an estimate of the distribution of 51% stones walls, 41% hedgerows, 7% tree lines and 1% other is inferred. Based on estimates by [
28], the following carbon storage potentials were used: stone walls, 1.5 tC/ha; hedgerows, 14.5 tC/ha; treelines, 29.9 tC/ha; other, 1.5 tC/ha.
3. Results
3.1. The Demand for Land to Meet Bioenergy Targets
As the targets outlined in the Energy white paper and bioenergy action plan are not particularly detailed about how the targets will be met, some assumptions and scenarios need to be developed to encompass the various potential land-use changes that could occur. The energy white paper gives the target of a 20% reduction in energy consumption across all uses (transport, heat and electricity). Therefore, three scenarios were used as references for future potential energy demand. They included (1) an energy demand growth scenario based on continuous energy demand growth to 2020, (2) an energy savings scenario where a 20% reduction of energy demand is realized, and (3) a no-change scenario where demand neither grows nor declines by 2020 compared with 2007. The main bioenergy targets outlined in the two documents and expected supply from agricultural crops and residues are outlined in
Table 1.
Table 1.
National targets for transport fuel, electricity and thermal energy substitution using biomass based resources.
Table 1.
National targets for transport fuel, electricity and thermal energy substitution using biomass based resources.
| Target | 2020 target | Notes | Proportion of target to come from bioenergy crops |
|---|
| Biofuels | 10% biofuel substitution target | Expected to be derived from crops and food industry by-products | 90% bioethanol,
80% biodiesel |
| Bioheat | 12% renewable heat by 2020 | Bioenergy the key contributor | 80% |
| Bioelectricity | 33% renewable electricity | Can come from many sources including wind, biomass etc. | 10% |
| Bioelectricity | 800 MWe CHP | Emphasis on biomass, more likely natural gas | 40% |
| Bioelectricity | Co-firing in peat powered stations | 30% substitution in the 3 existing peat power stations in energy terms | 100% |
| Energy savings | 20% energy savings | Across all uses, electricity, heat and transport | Not applicable |
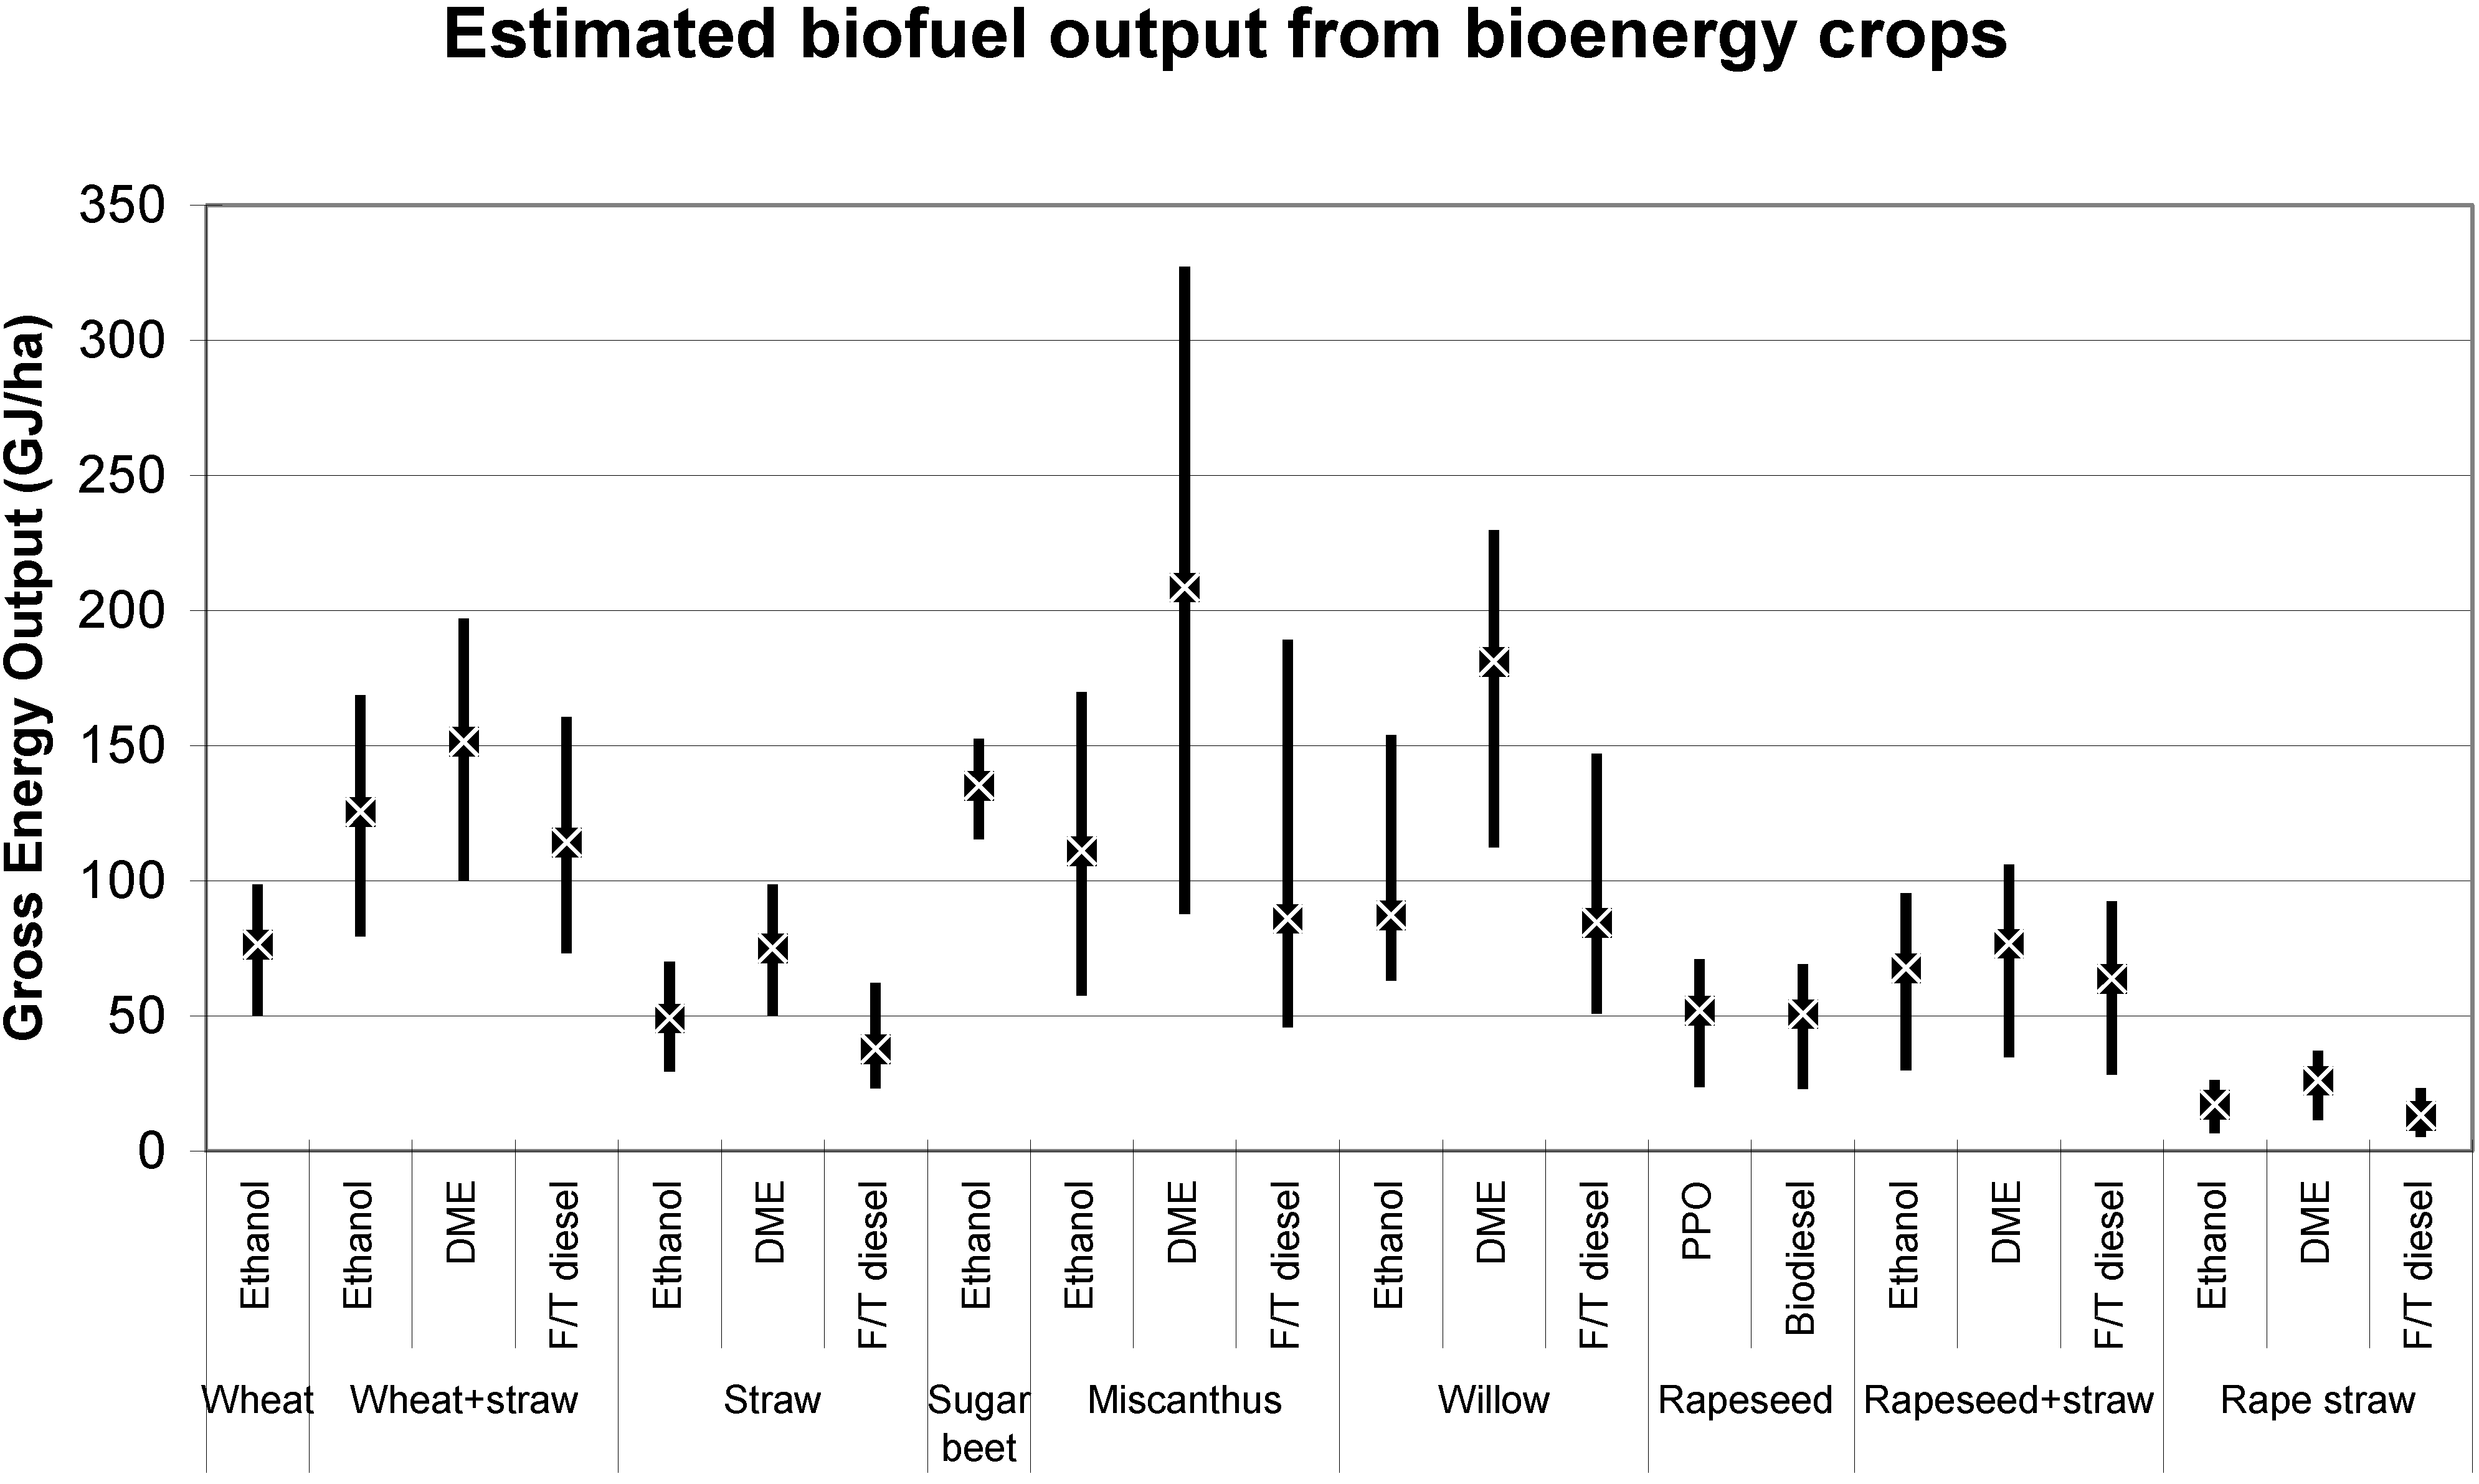
In order to determine how much land would be needed to produce the required quantities of biofuels, the gross energy outputs of a range of feedstock and biofuels were calculated. The calculations included the expected fuel yield per tonne of mass and the expected mass per unit of land (ha). The error bars in
Figure 1 are reflective of expected upper and lower biomass yields and conversion rates from the respective feedstock sources.
This study expects direct petrol and diesel substitutes derived from biomass to be the primary biofuels used to meet the 2020 biofuel target. Therefore, DME was excluded from future calculations, because its widespread use would require significant changes in infrastructure and vehicle engines despite its potential to supply considerable quantities of energy per unit of land input. Also, the use of willow and miscanthus were not considered further, as the technology to use these feedstock are not yet commercialized and these crops are more likely be used to meet the bioheat and bioelectricity targets. Therefore, the only crops considered to meet the biofuels targets were wheat and rapeseed, including their by-product, straw. It was not expected that all feedstock for biofuels would come directly from agricultural crops, for example bioethanol and biodiesel produced in the Republic of Ireland currently come from predominantly non-crop feedstock such as whey, which is a by-product of cheese manufacturing, and used cooking oil, a by-product of the food industry used to produce biodiesel. Therefore, it was assumed that 90% of bioethanol and 80% of biodiesel would come directly from agricultural crops grown in the Republic of Ireland.
Figure 1.
The gross energy yield of transport fuel from various feedstock sources and conversion technologies.
Figure 1.
The gross energy yield of transport fuel from various feedstock sources and conversion technologies.
Wheat to produce ethanol, a petrol substitute and rapeseed to produce biodiesel, a diesel substitute were initially explored as sources of biofuels to meet the biofuels target. The impact of using the straw residues to produce petrol and diesel substitutes was also explored, despite the commercial unavailability of the required technology. There were some limitations on the assumptions used to model the land requirement to supply the feedstock:
The total rapeseed area cannot exceed 25% of the total cropping area in order to satisfy a 1 in 4 rotation.
All feedstock for biofuels will be derived from the products and residues of arable crops, which for this study were taken to be the seeds and straw residues from wheat and rapeseed.
The exportable straw to grain ratio for both wheat and rapeseed was 0.55:1.
A maximum of 50% of the straw that is readily exportable is actually available.
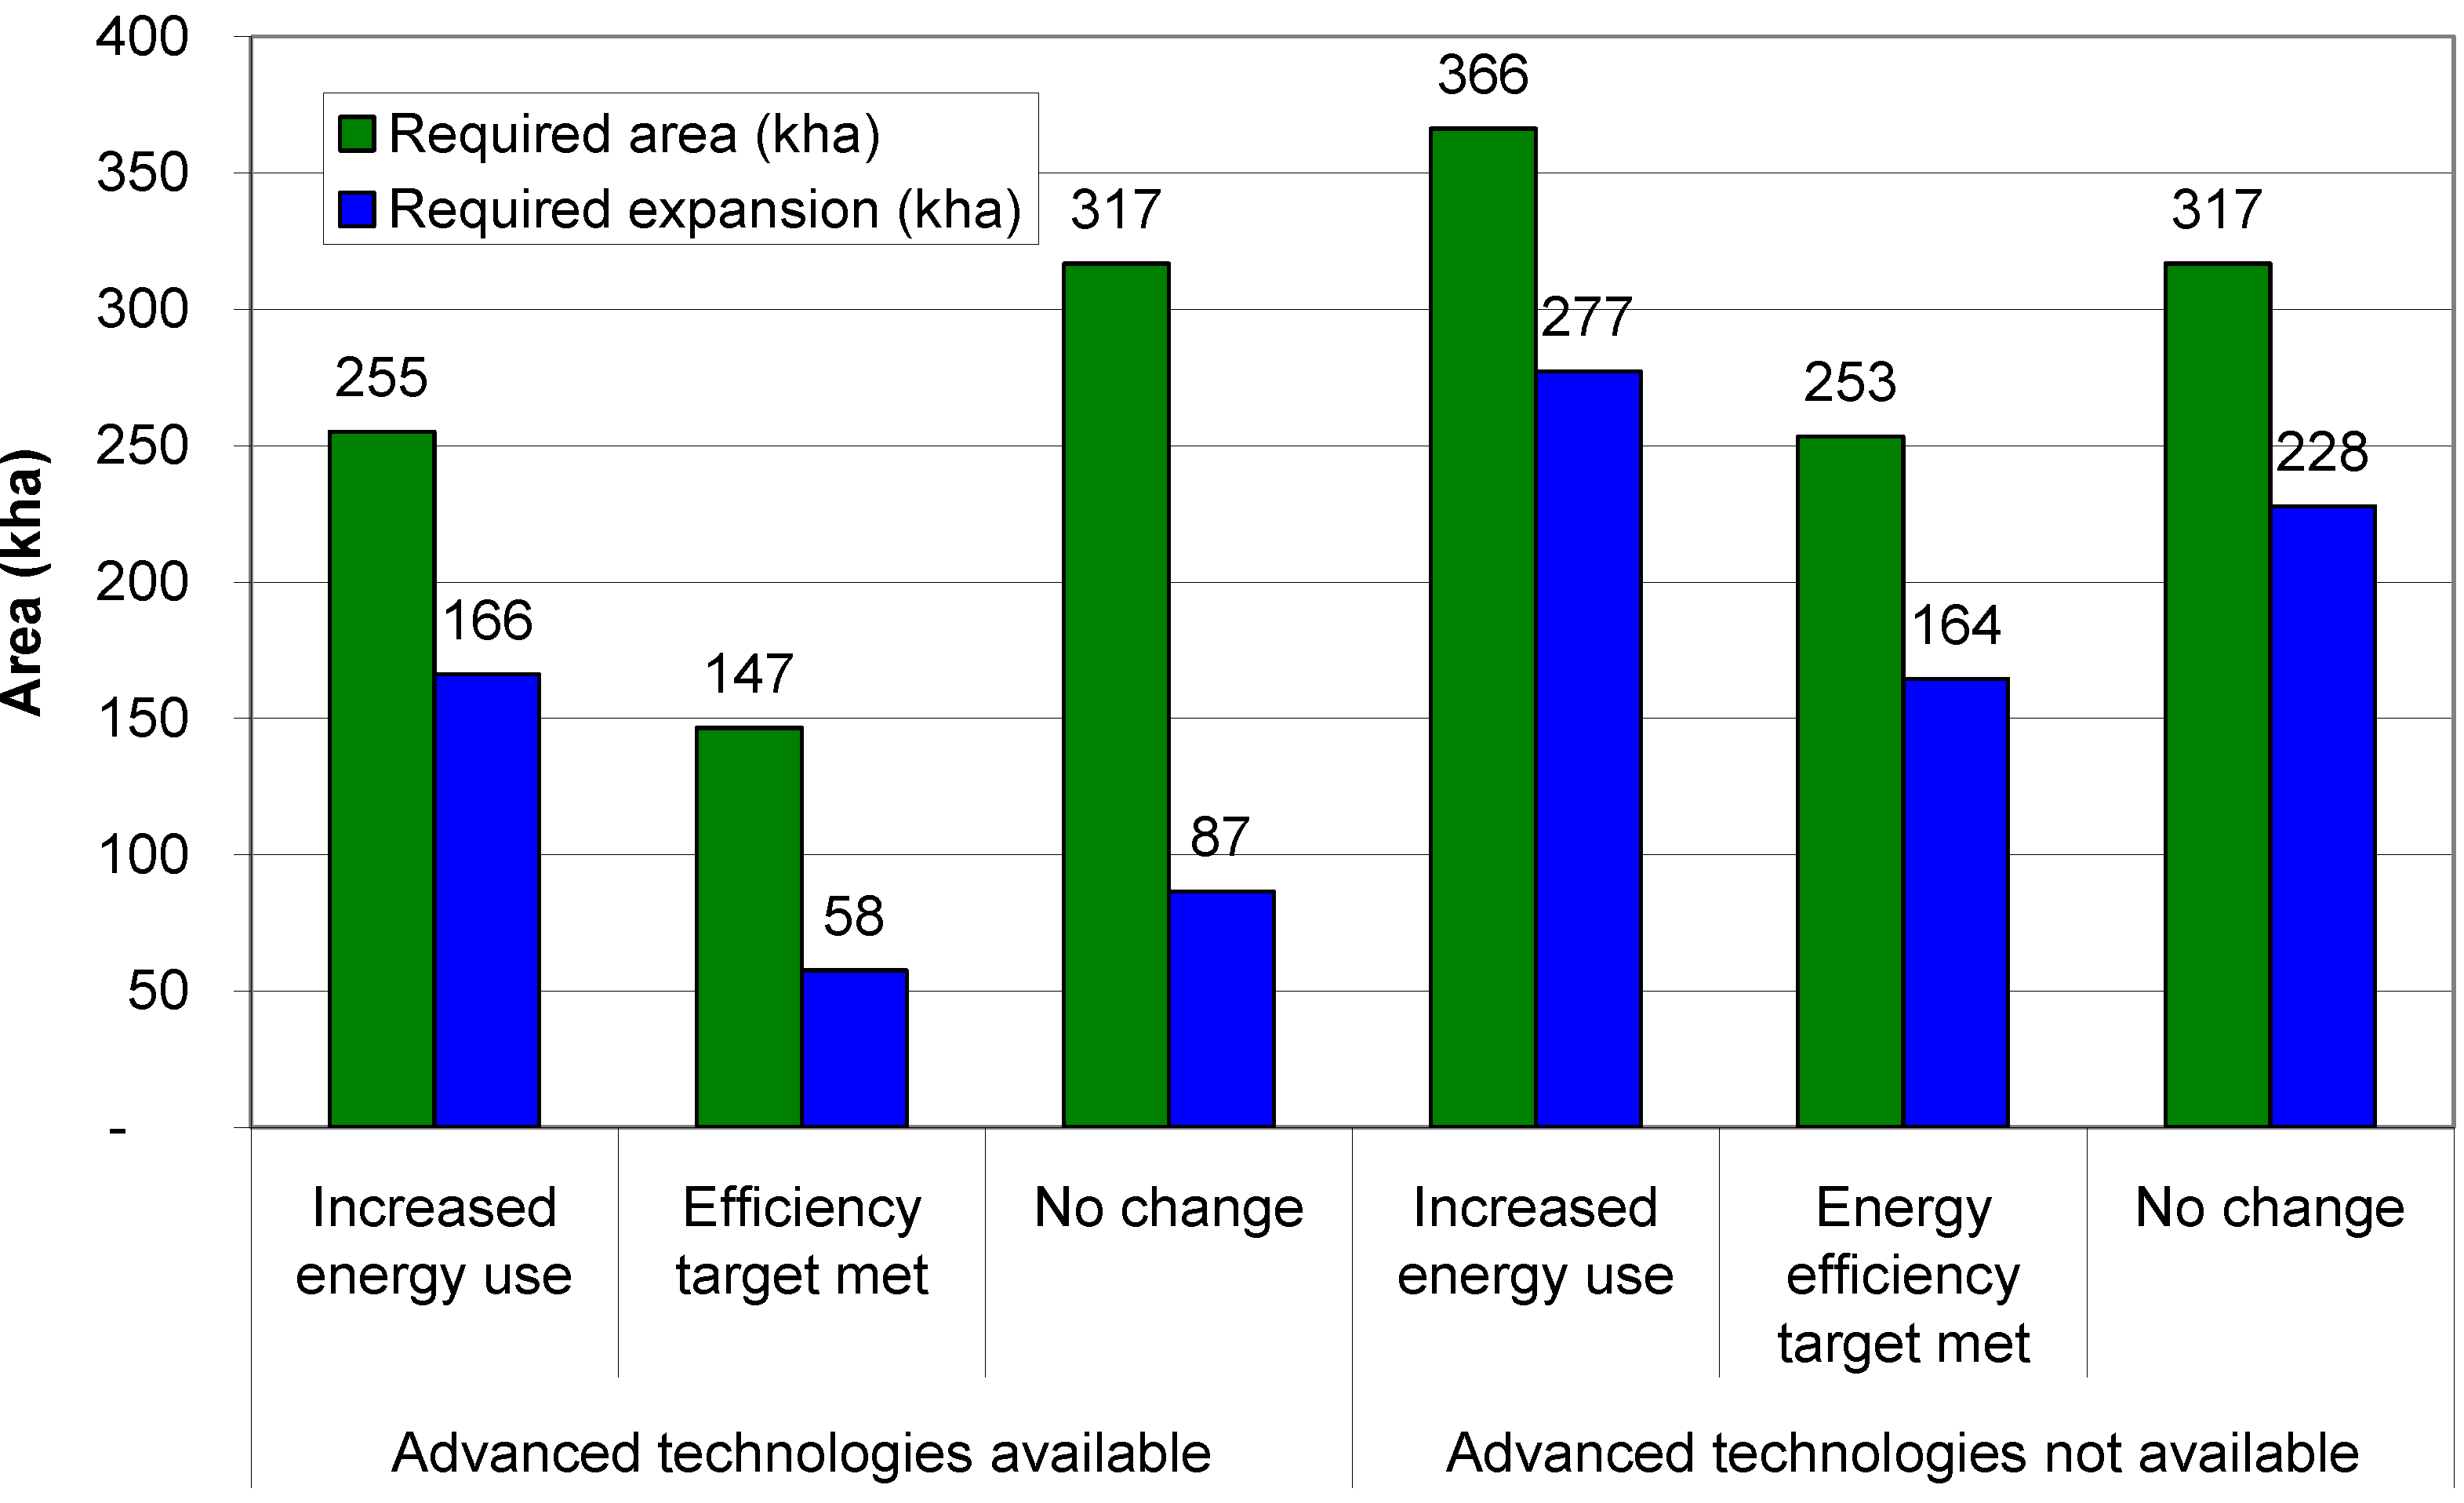
In order to understand the full range of situations that could exist in 2020, the model was used to determine the area of land needed to meet the biofuels target under two groups of scenarios. One scenario determined the land requirement if advanced technologies to produce biofuels from straw residues were available and the other reflects their potential unavailability, such that bioethanol is produced only from wheat and rapeseed is used to produce biodiesel using existing technology. Using the year of 2000as a reference, the quantity of land exceeding the national tillage rotation that would be expected available for non-food/feed uses by 2020 is also calculated. The year 2000 was used as a reference as this is the year of the last detailed agricultural census. 2000 also preceded any changes in the EU policy that significantly impacts land-use. Since 2000 the arable area can expand into the former sugarbeet and set-aside areas. As
Figure 2 shows, the arable area will have to increase by at least 58 kha in order to meet the biofuels target, assuming that the technology to process straw to biofuels exists and the efficiency targets are met. Alternatively, if neither of these assumptions proves true and transport energy consumption in the state continues to rise, then the arable area will have to increase by 277 kha in order to meet the biofuels target.
Figure 2.
The demand for land to meet the biofuels target under various assumptions.
Figure 2.
The demand for land to meet the biofuels target under various assumptions.
3.2. The Demand for Land to Meet the Bioheat Targets
Total bioheat demand will be the sum of the demands generated the 12% renewable heat target and the heat portion of the 800 MW CHP target. Combining these two targets results in a total demand between 56.3 and 66.1 PJ, which will require between 290 and 341 kha of willow or miscanthus
1 depending whether efficiency targets are met or whether energy consumption would continue to grow (
Table 2).
Table 2.
Total land demand generated by meeting national bioenergy targets under various scenarios.
Table 2.
Total land demand generated by meeting national bioenergy targets under various scenarios.
| Scenario | Category | Area (kha) | % of agri. Area | Bioenergy supply (PJ) | % of total energy supply |
|---|
| Increased energy demand | Transport | 255 | 5.80% | 26.6 | 10% |
| Thermal | 341 | 7.70% | 66.1 | 24.90% |
| Electrical | 391 | 8.90% | 34.9 | 12.90% |
| Total | 987 | 22.4% | 127.6 | 15.9% |
| No change | Transport | 176 | 4.0% | 23 | 10.0% |
| Thermal | 319 | 7.2% | 61.8 | 26.9% |
| Electrical | 302 | 6.9% | 33.7 | 14.4% |
| Total | 797 | 18.1% | 118.5 | 17.1% |
| Energy efficiency target met | Transport | 147 | 3.3% | 18.4 | 10.0% |
| Thermal | 290 | 6.6% | 56.3 | 30.6% |
| Electrical | 288 | 6.5% | 32.2 | 17.1% |
| Total | 725 | 16.4% | 106.9 | 19.2% |
3.3. Bioelectricity
Total bioelectricity demand will be the sum of the demands generated by the 33% renewable electricity target and the electricity portion of the 800 MW CHP target. Combining these two targets results in a total demand for between 32.2 and 34.9 PJ, which will require between 288 and 391 kha of willow or miscanthus, which again depends on if the efficiency targets can be met or if the growth in energy consumption continues (
Table 2).
3.4. Total Demand for Land
The total demand generated by all these targets come to 724 kha if energy efficiency targets are met, 796 kha if there is no change in energy use, and 986 kha if recent growth in energy use continues to 2020. This will require between 16.5% and 22.4% of the agricultural area in the Republic of Ireland (
Table 2).
3.5. GIS Analysis Results
Field size distribution survey results
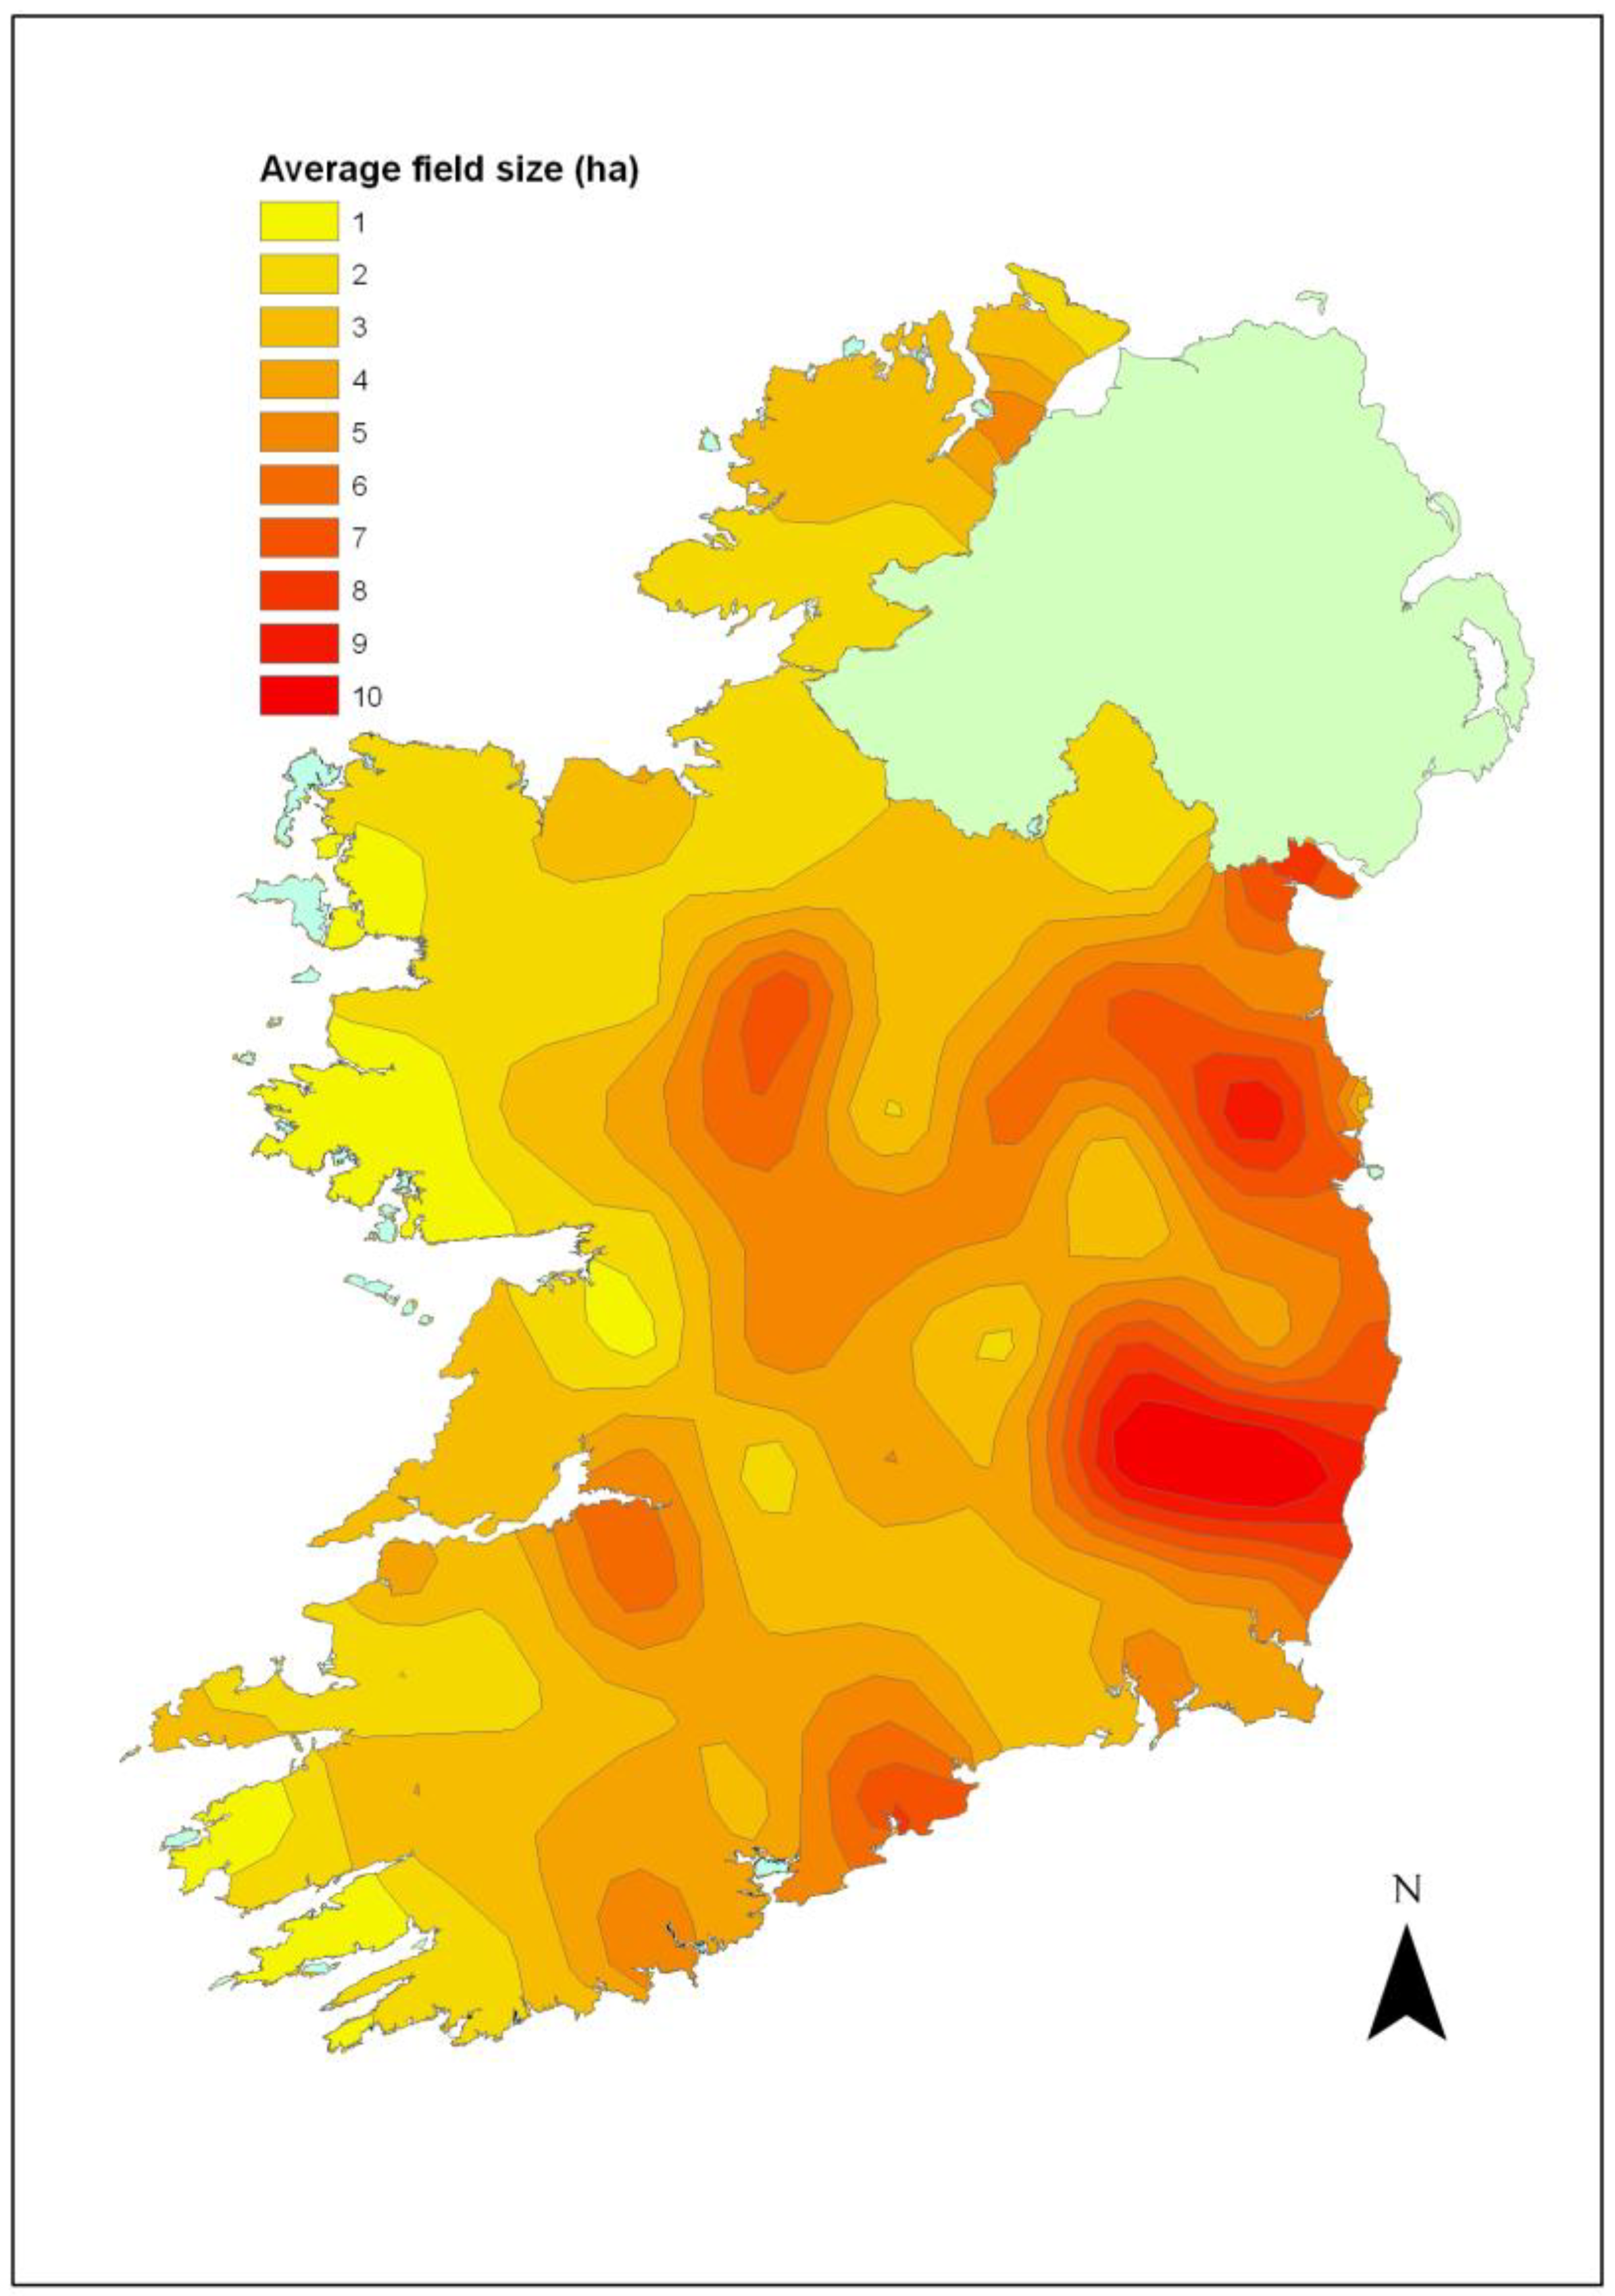
The results from the field size survey were used to produce a general average field size distribution map (
Figure 3), from which the average field size associated with different soil types and land uses within the GIS database were also determined.
Figure 3.
Modeled distribution of field sizes in the Republic of Ireland.
Figure 3.
Modeled distribution of field sizes in the Republic of Ireland.
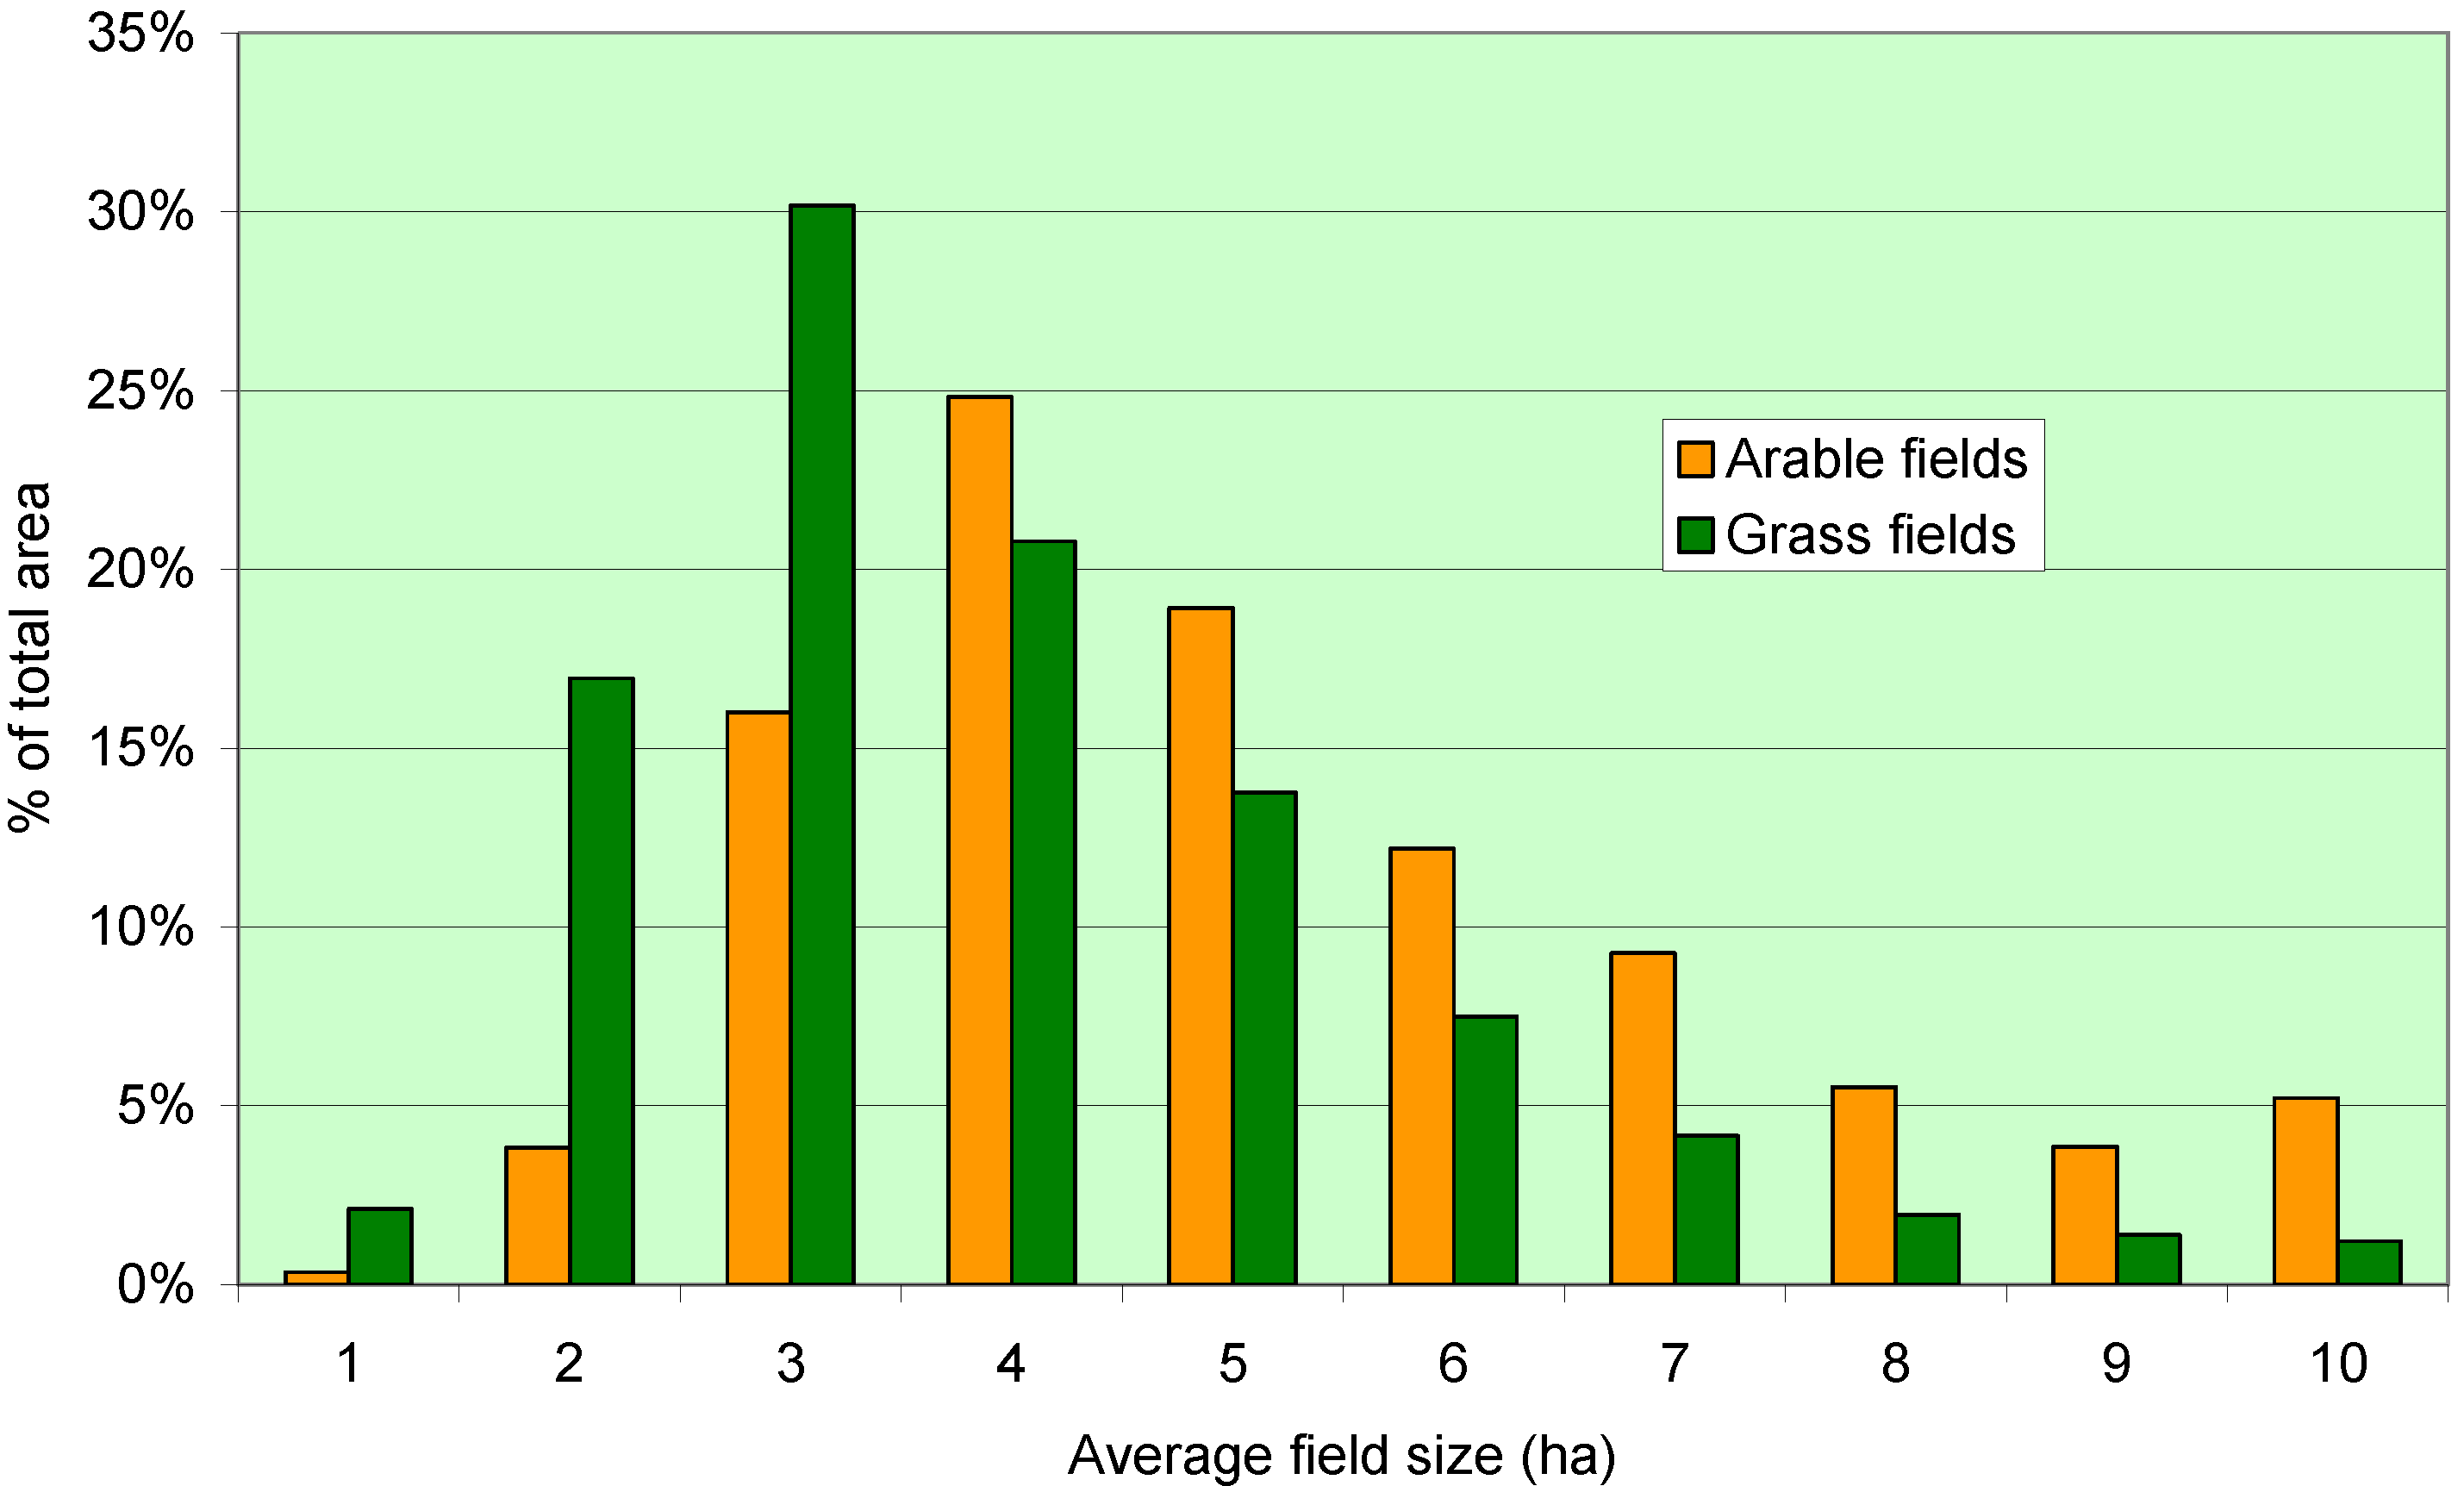
The GIS was used to isolate the average field size data within different land classifications. Arable and grassland are the two major land uses that would most likely be converted to growing biomass crops to satisfy the bioenergy targets. For arable and grassland, it was found that there was a significant difference between average field sizes and distribution associated with each land use. Fields in grassland areas tend to be smaller with an average size of 3.93 ha, with over 70% of the fields smaller than 4 ha, while fields in predominantly arable have larger field sizes, with an average of 5.19 ha and less than 25% of the fields smaller than 4 ha (
Figure 4).
Figure 4.
Distribution of field sizes associated with arable and grasslands.
Figure 4.
Distribution of field sizes associated with arable and grasslands.
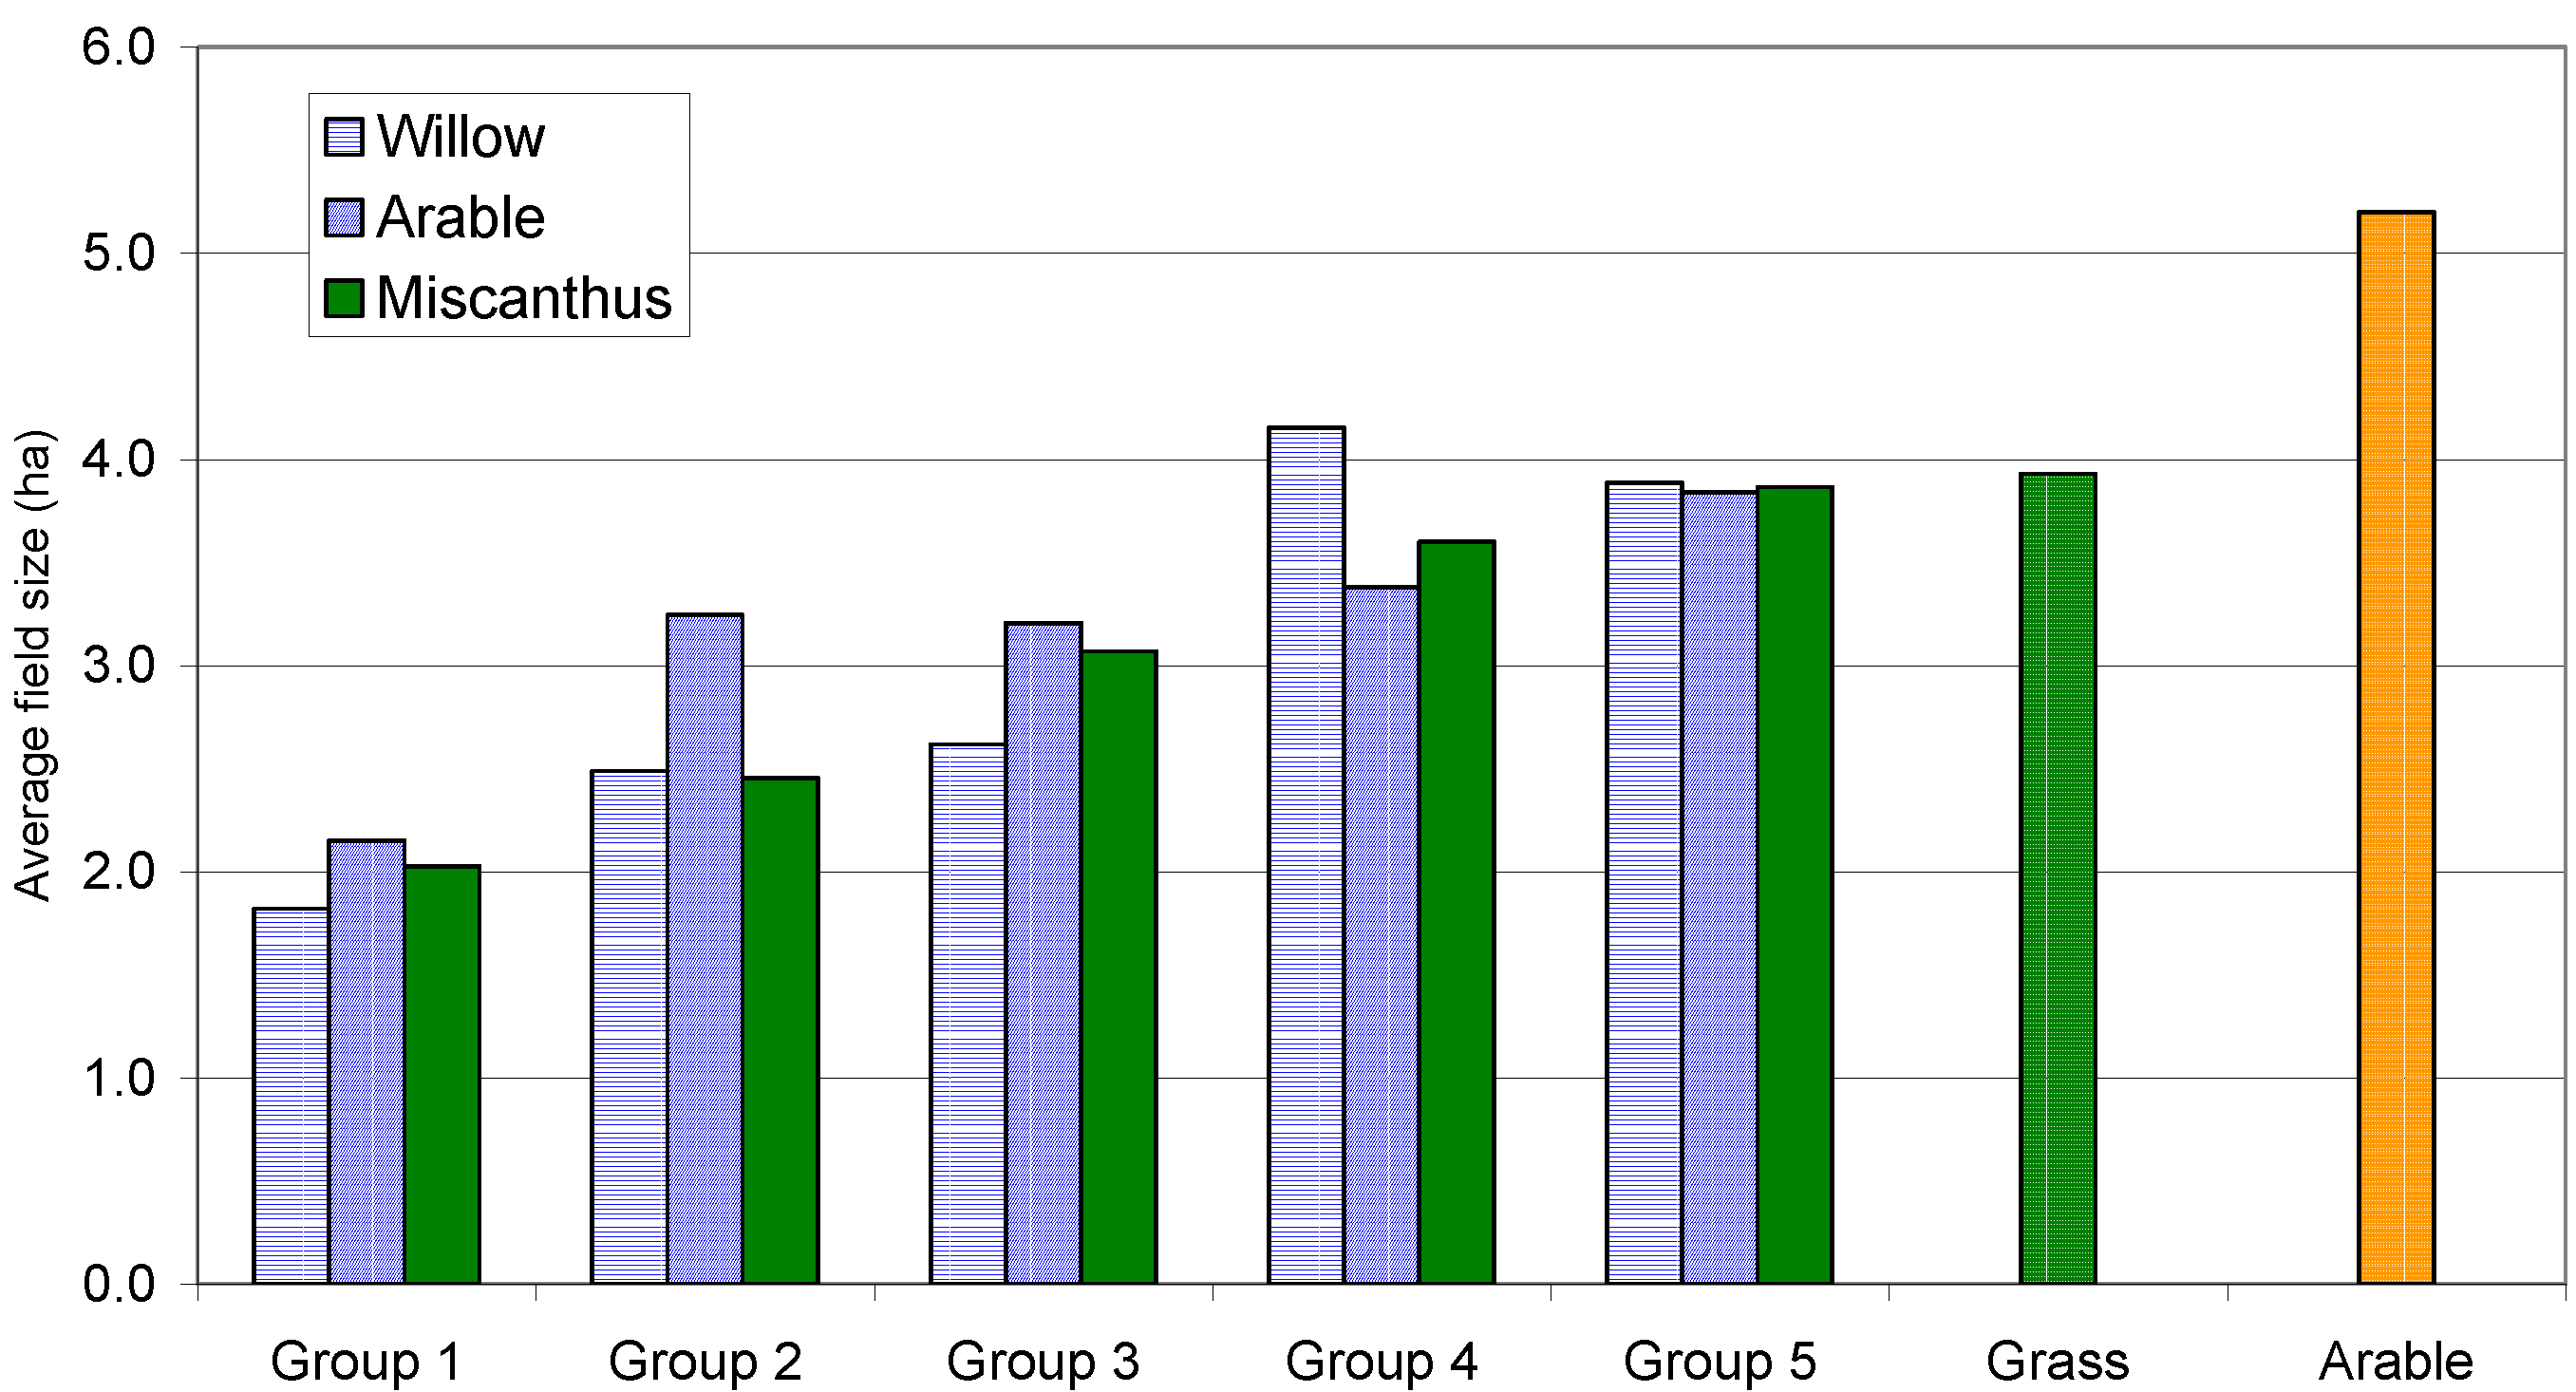
The size of fields associated with different soil types were also determined using the soils classifications described in the methodologies section. It was found that poorer soils tend to have much smaller fields, while more productive soils have larger fields (
Figure 5).
Figure 5.
Relationship between average field size, soil type and land-use.
Figure 5.
Relationship between average field size, soil type and land-use.
3.6. The Impact of Field Size on Field Operating Costs
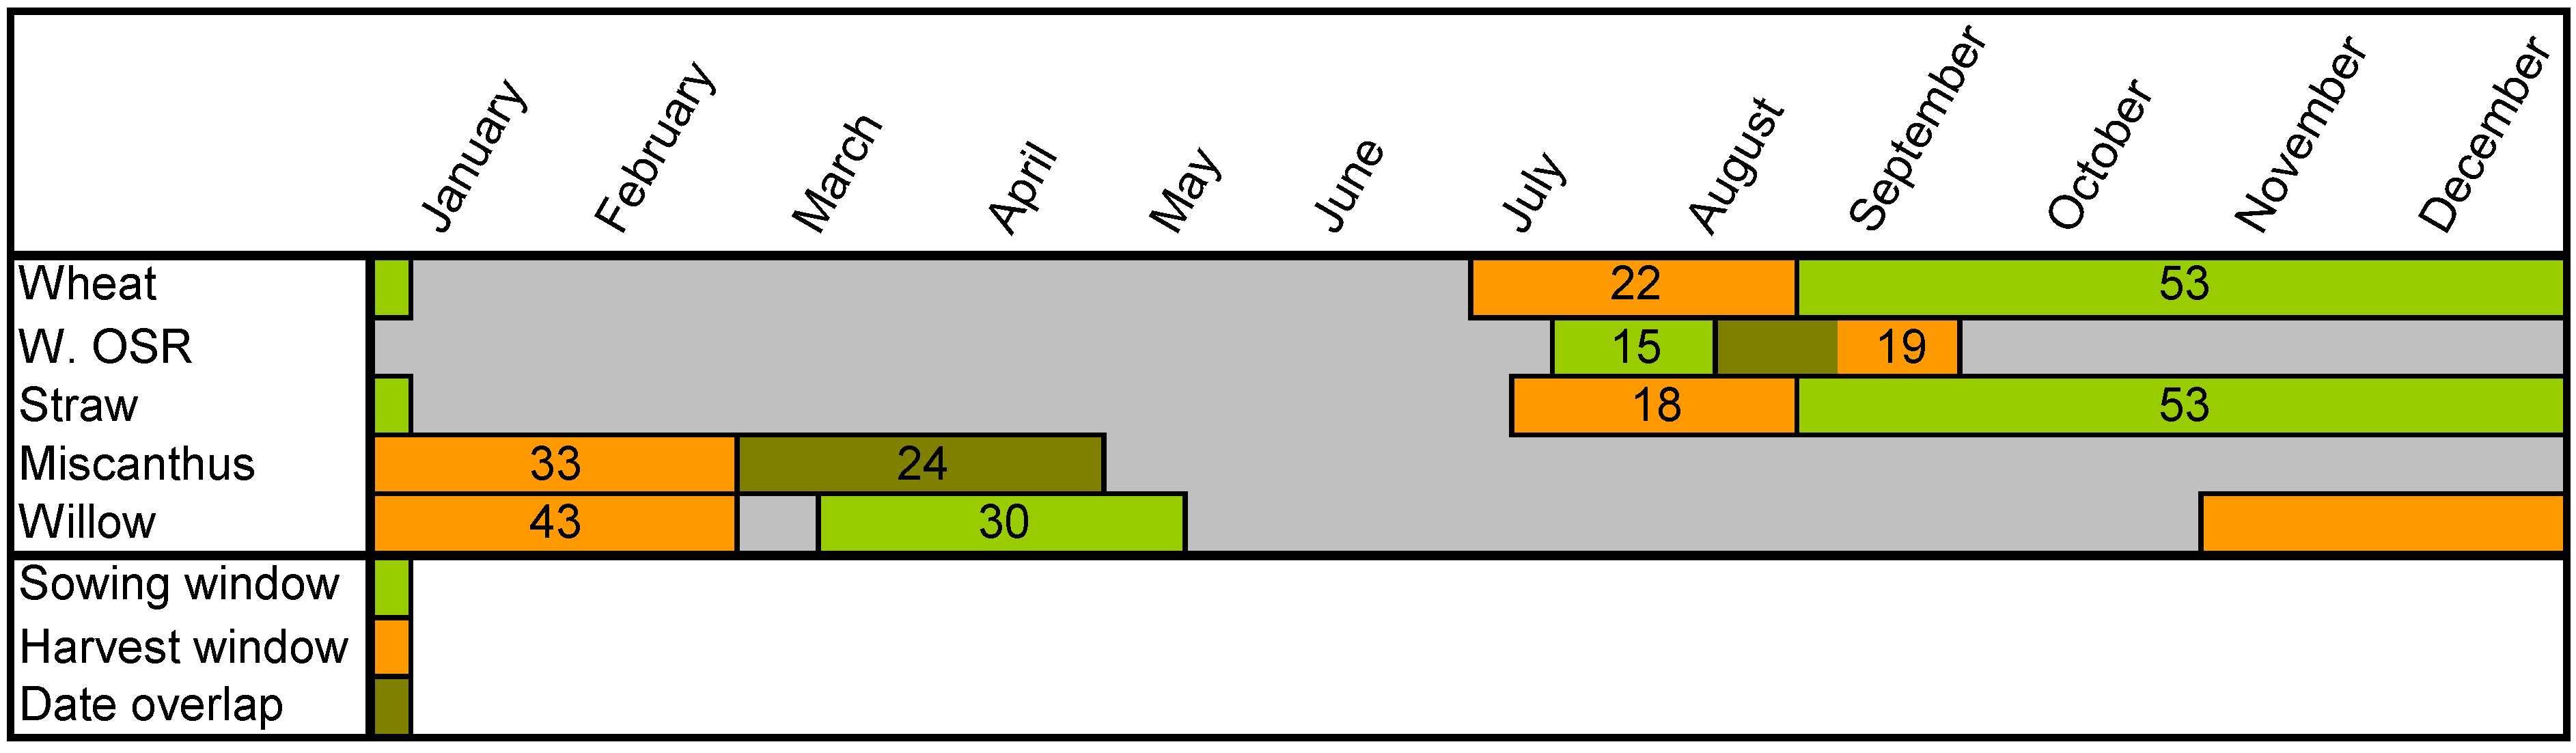
Variable costs were determined for harvesting and sowing willow and miscanthus and fixed costs were discounted over the total annual area achievable. The total achievable area was determined using the operating windows (
Figure 6) and overall efficiencies models described earlier. Using the average field sizes associated with different land uses and soil types, the costs associated with carrying out these operations were determined.
Figure 6.
Harvesting and sowing operating windows for potential bioenergy crops.
Figure 6.
Harvesting and sowing operating windows for potential bioenergy crops.
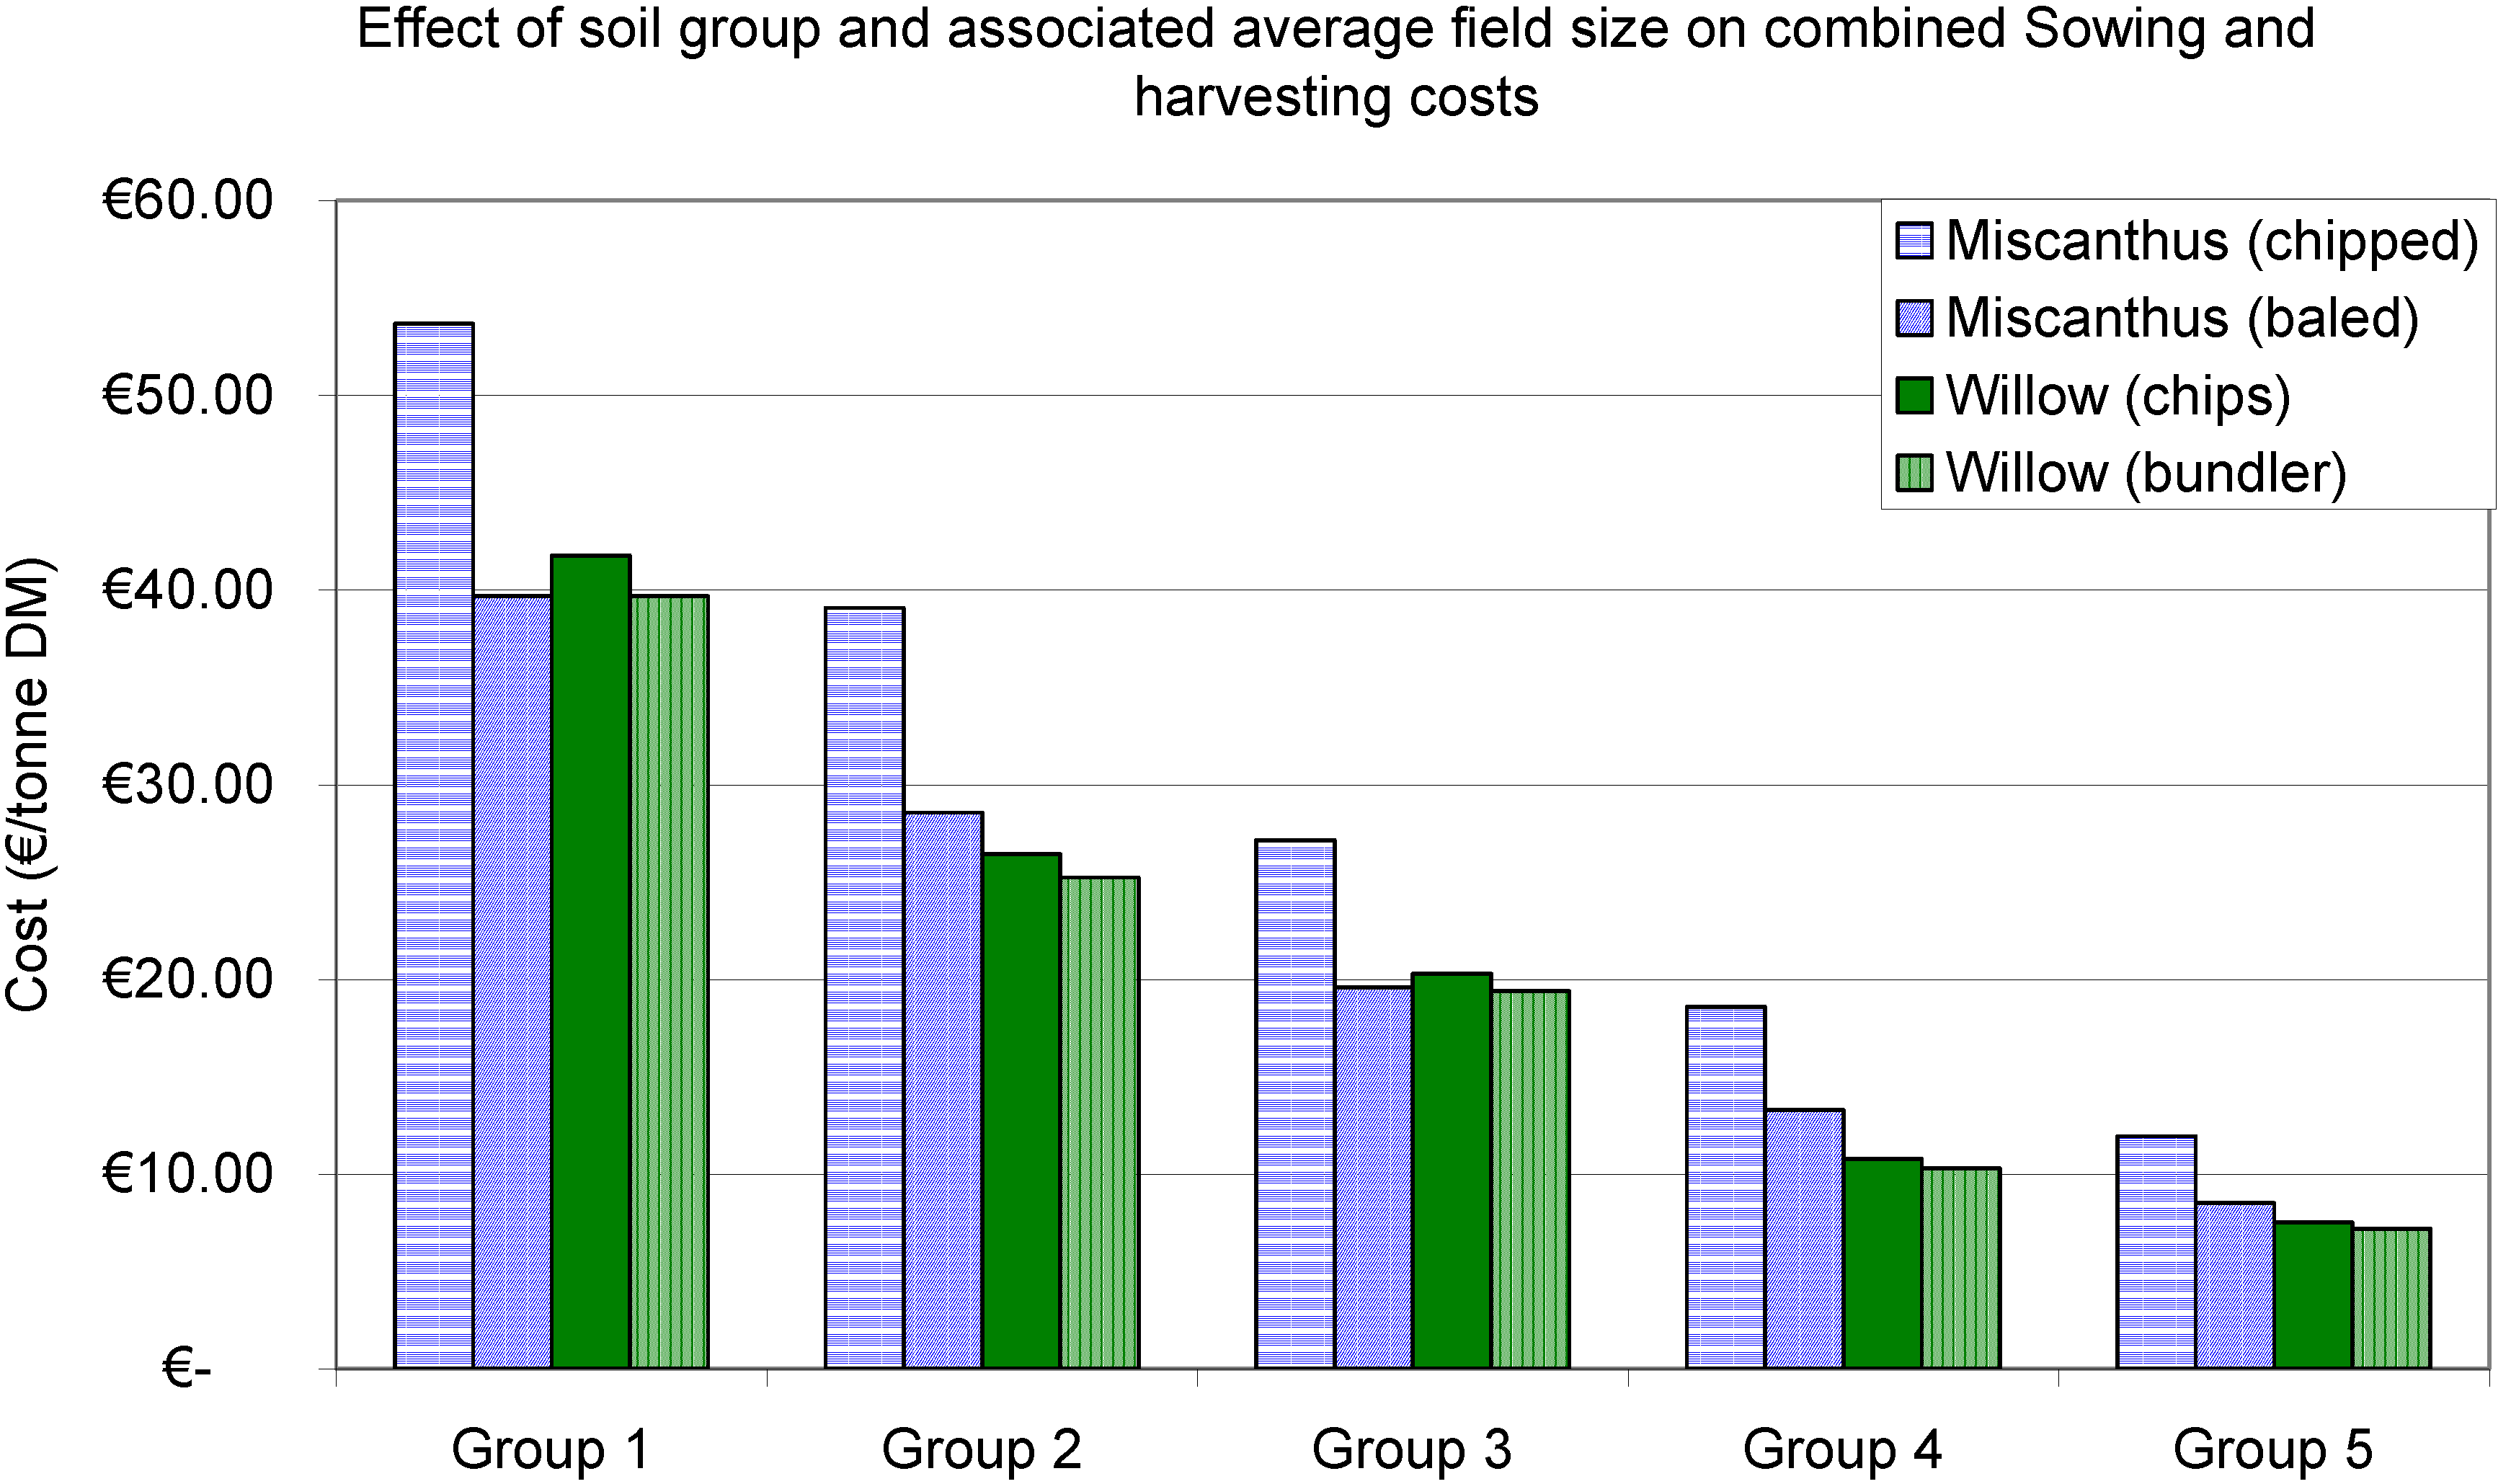
For example,
Figure 7 shows the impact that the smaller fields associated with poorer soils have on combined sowing and harvesting costs. This indicates that the producers will probably not only suffer from a yield penalty due to poor soils types but also see increased operating costs due to reduced efficiency.
Figure 7.
Combined harvesting and sowing costs associated with soil types and associated field sizes.
Figure 7.
Combined harvesting and sowing costs associated with soil types and associated field sizes.
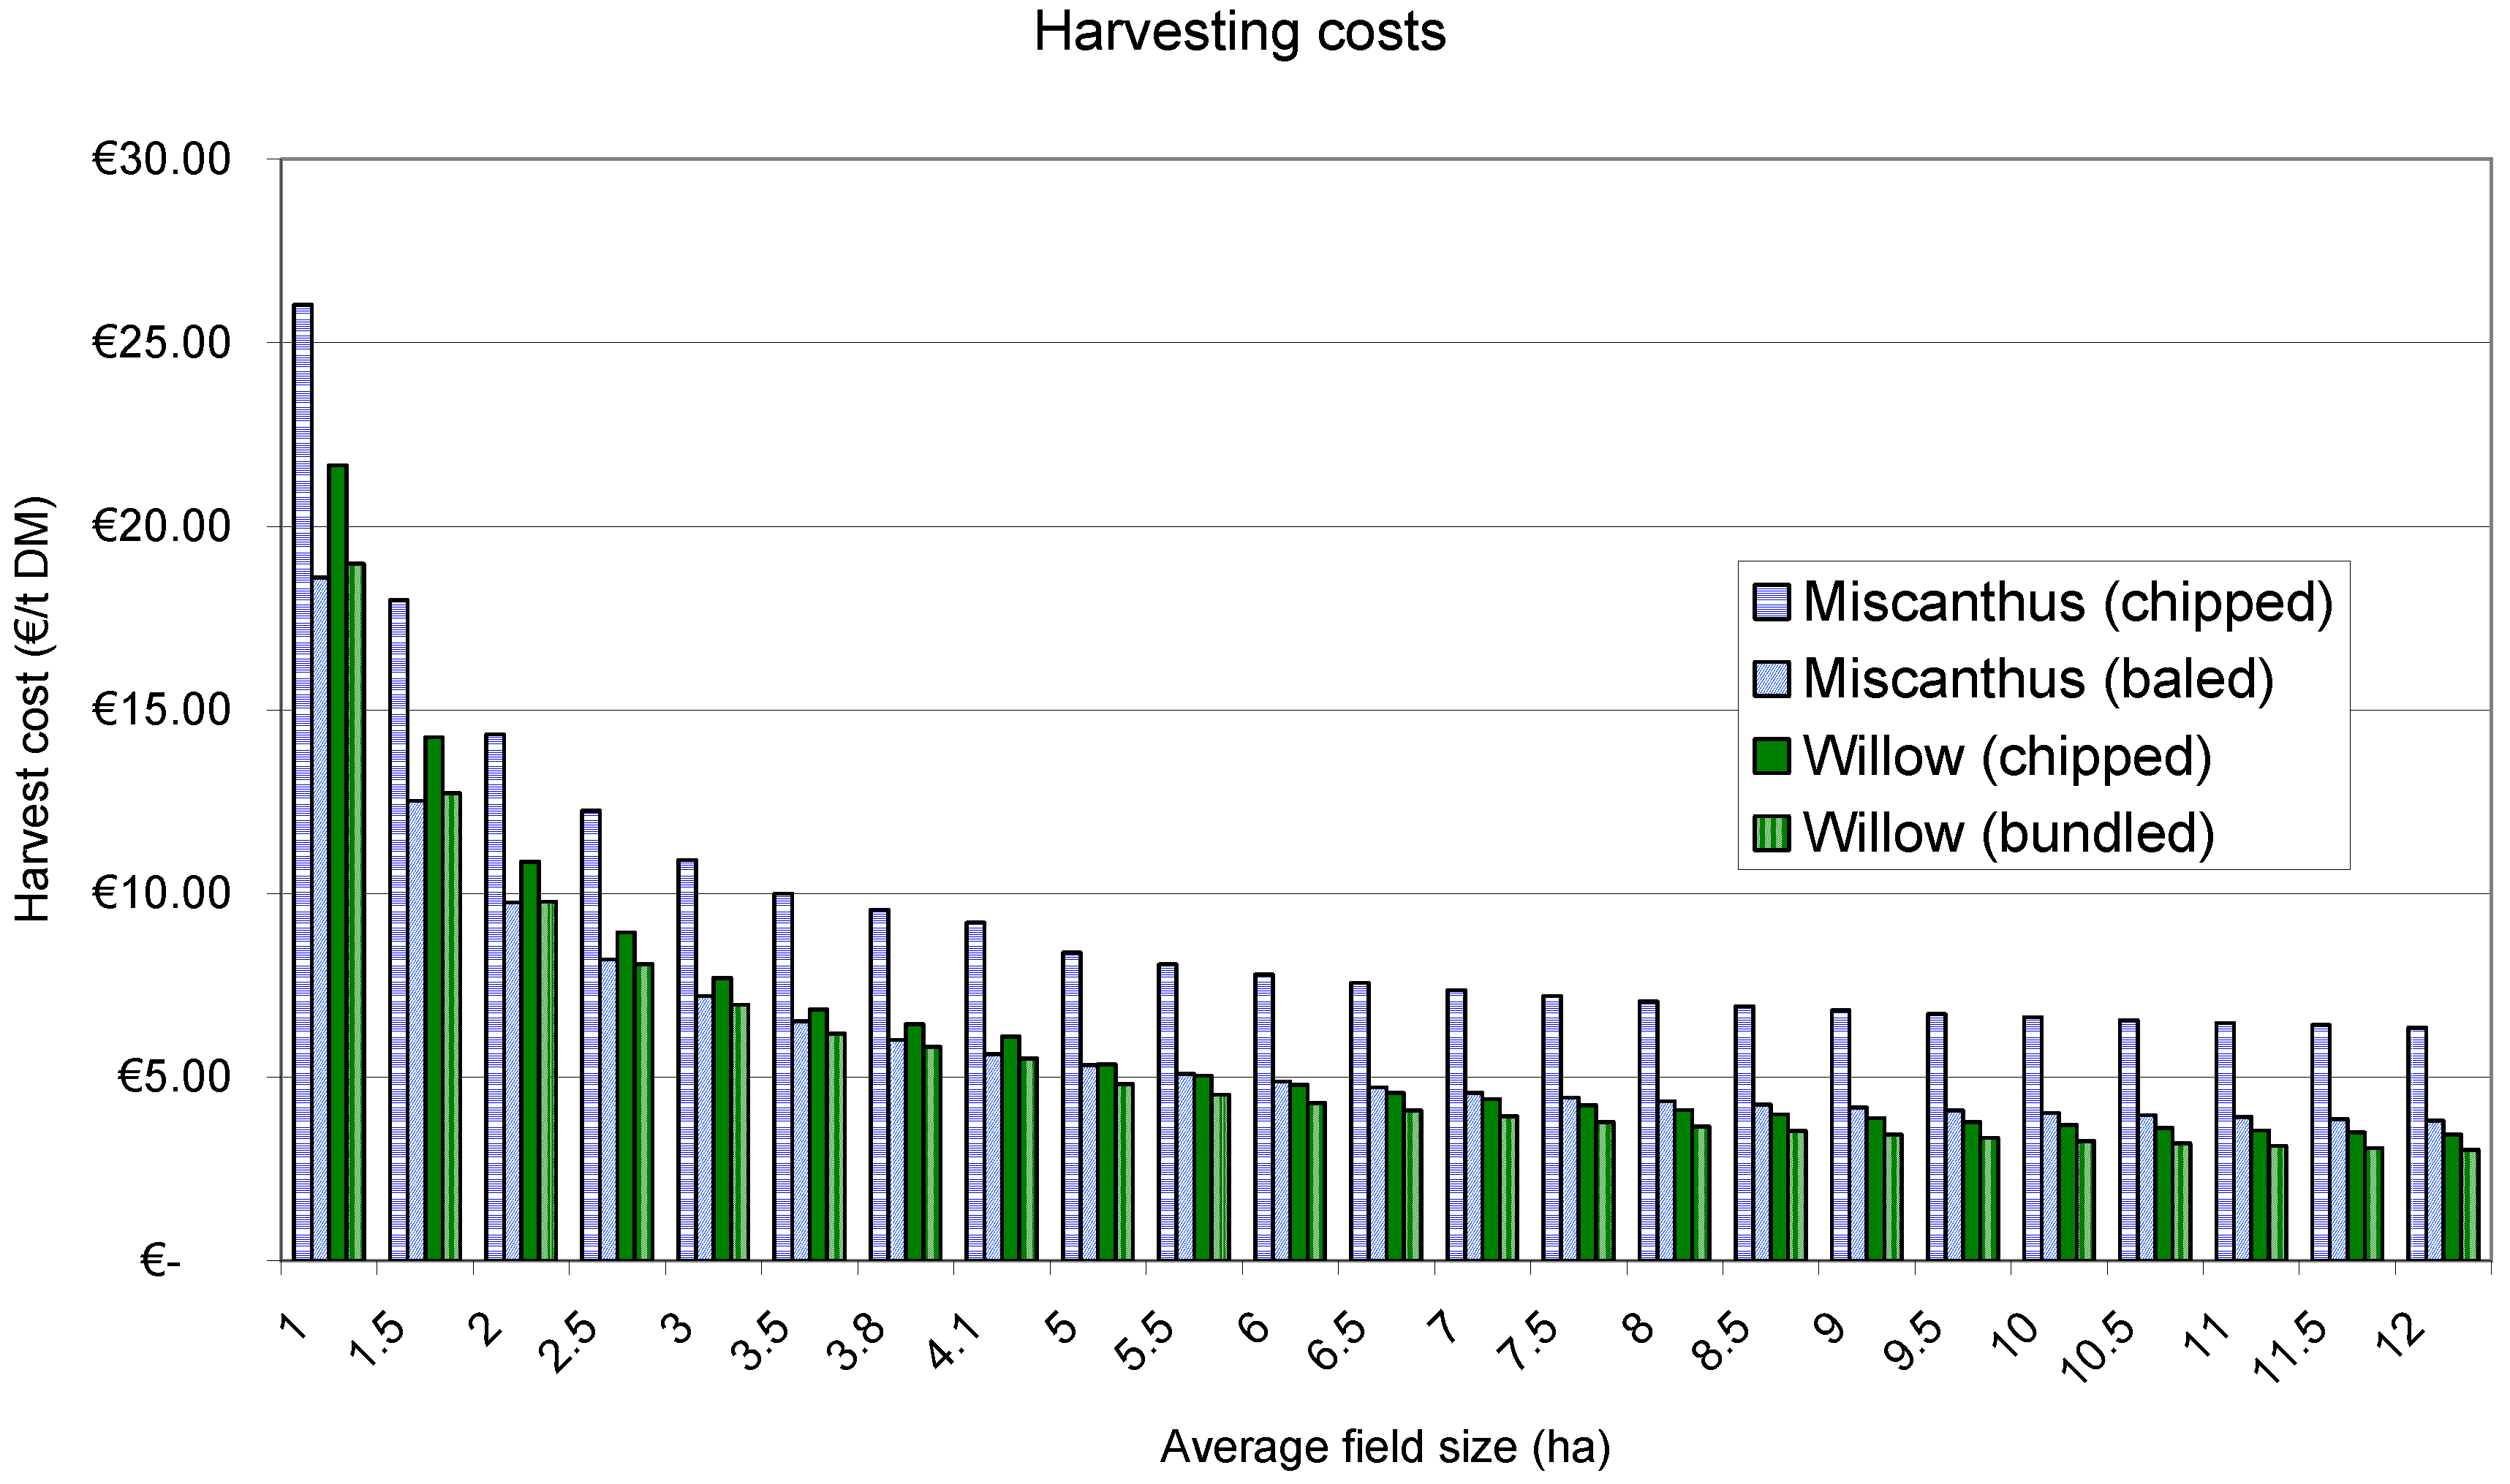
Smaller fields generally increase the cost of carrying out operations over large areas. Where fields are generally very small, costs can be reduced substantially through the consolidation of fields via boundary removal. However, there is a diminishing return as larger fields are consolidated (
Figure 8). For example, if the fields are consolidated such that an area of an average field size of 2.5 ha was increased to 5 ha, a 33% reduction in harvesting costs could be achieved.
Figure 8.
The impact of average field size on sowing and harvesting costs.
Figure 8.
The impact of average field size on sowing and harvesting costs.
3.7. Impact of Boundaries on Habitats and Carbon Store
Calculations suggest that the nation’s field boundaries currently store approximately 1.41 million tonnes of carbon. Based on outputs from [
21], this equates to approximately 7% of the country’s carbon storage in vegetation and soils. Using an estimated boundary width of 2 m, there is approximately 166,560 ha of permanent habitat contained within the nation’s field boundaries. The impact of field consolidation is given in
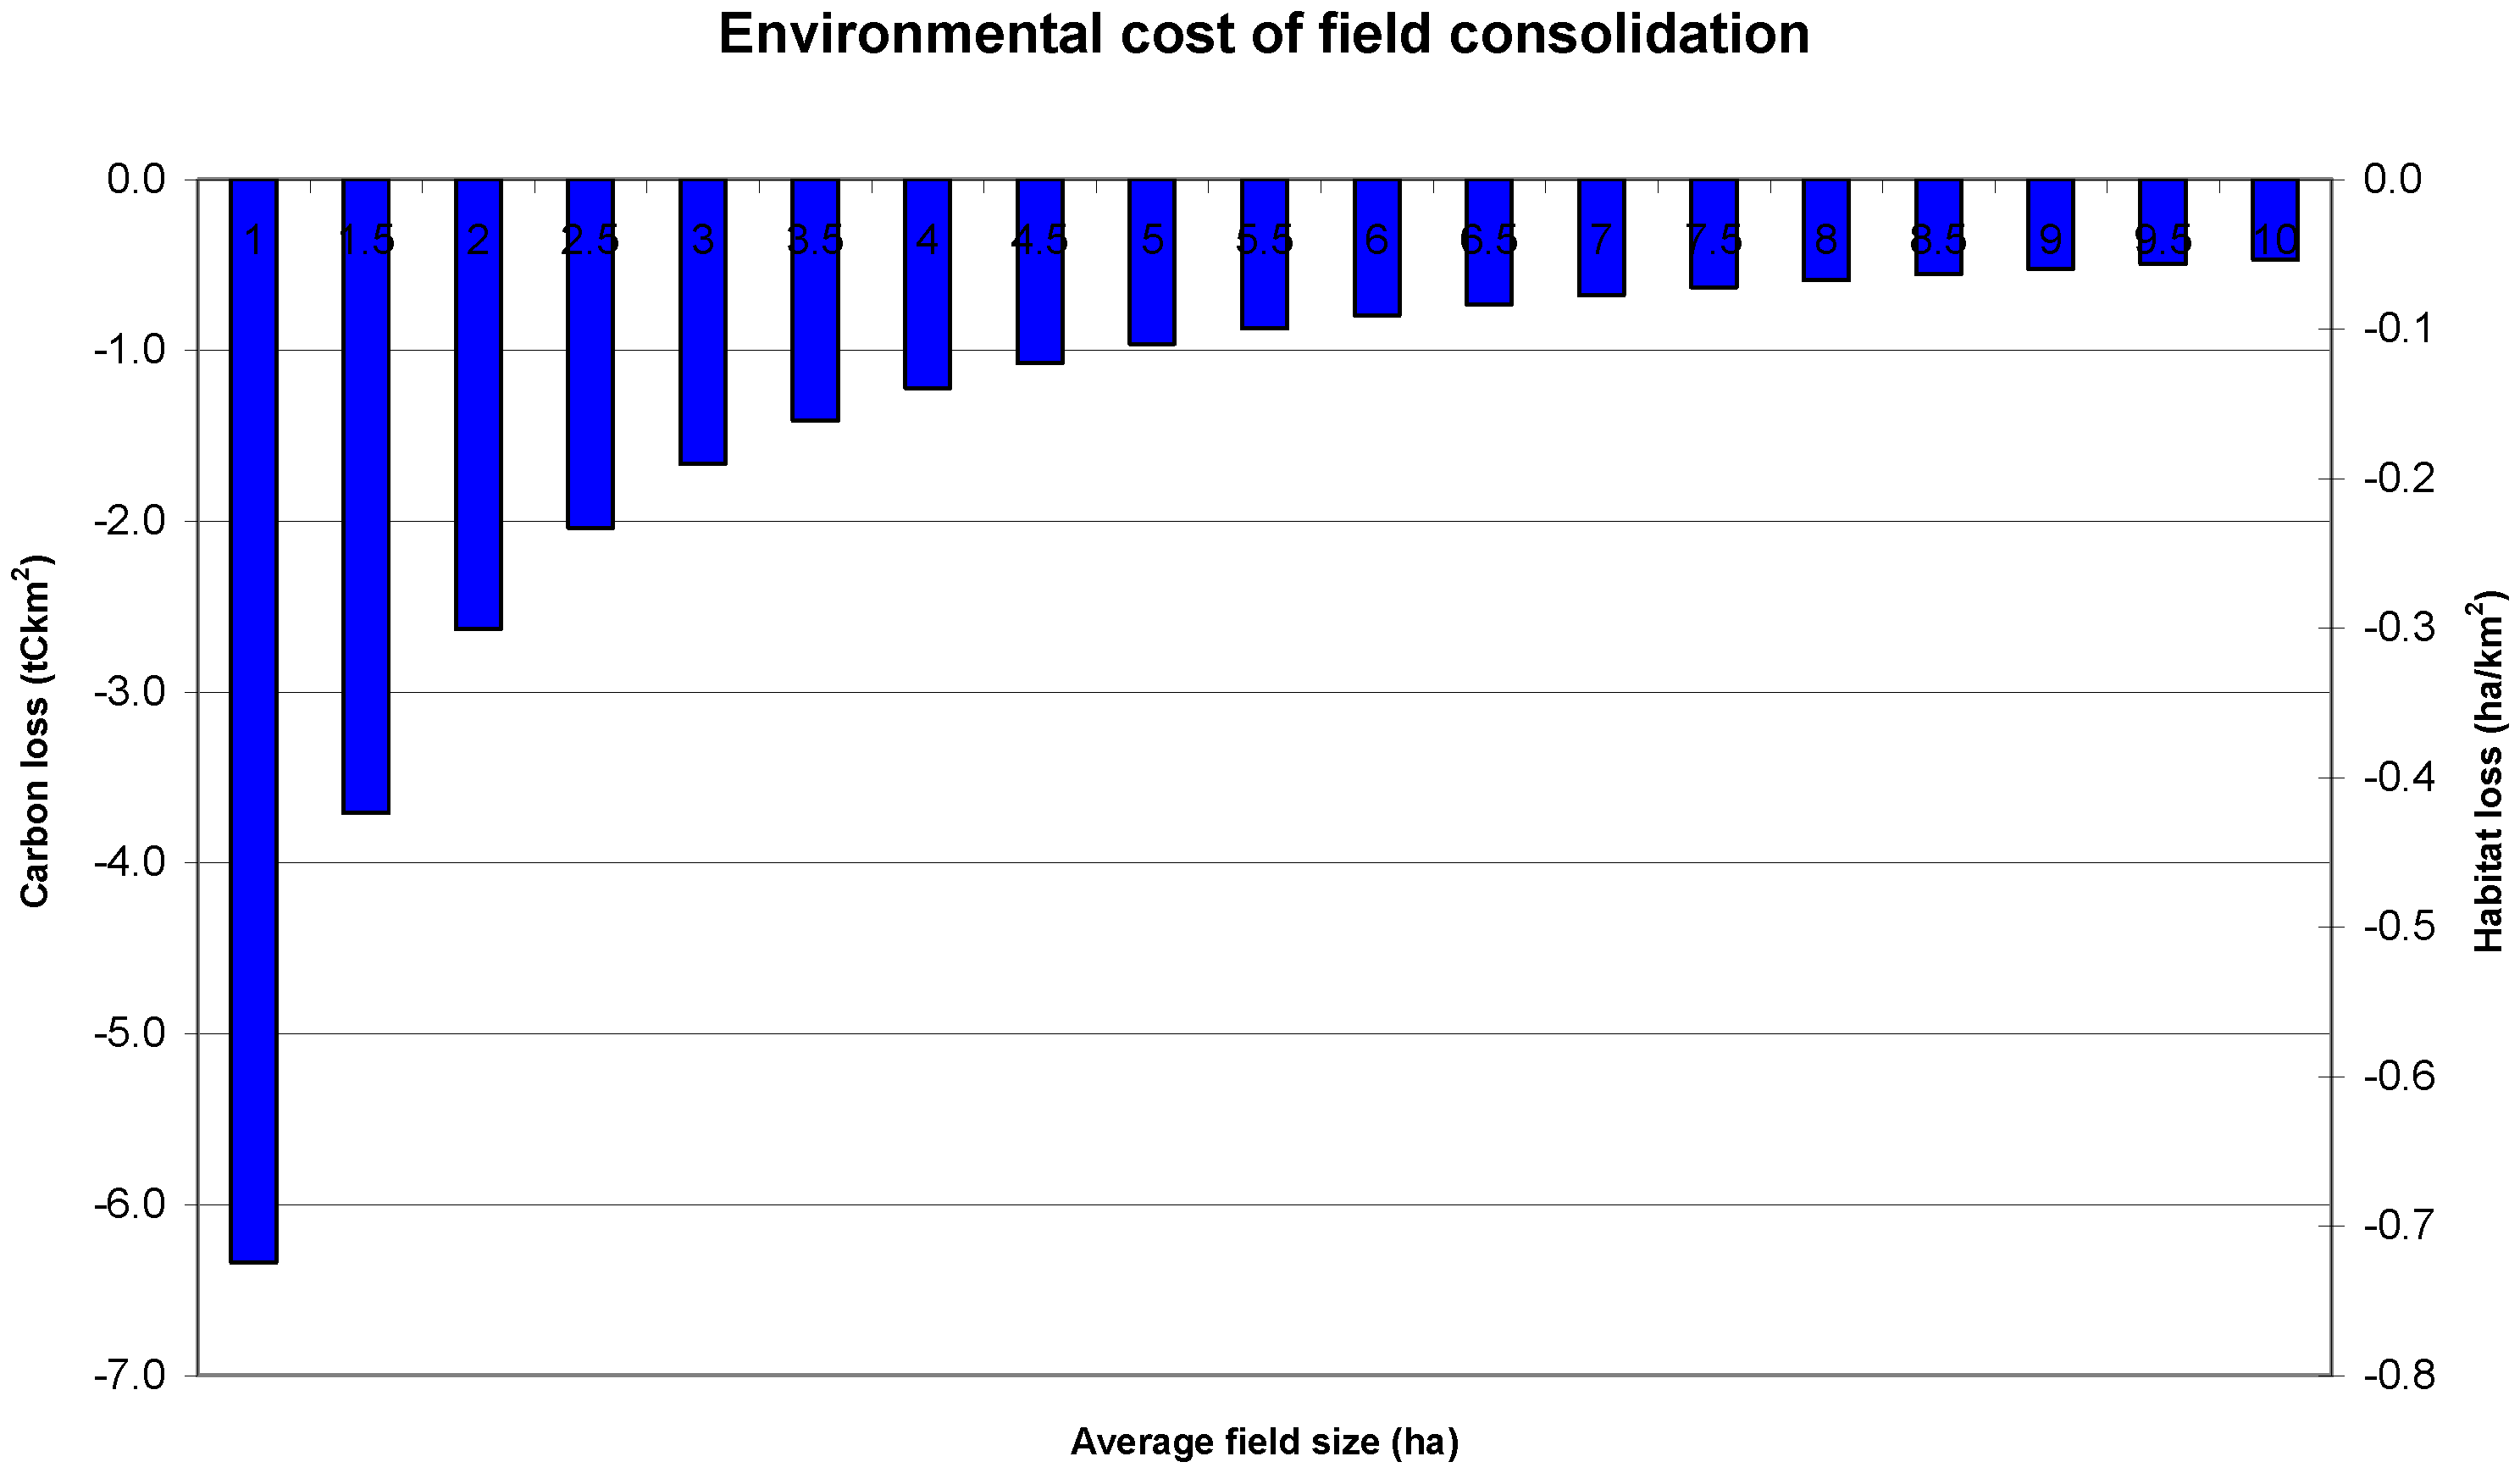
Figure 9, where each bar represents the loss of habitat and carbon stock as the average field size increases by 0.5 ha.
Figure 9.
Potential impact of field consolidation on carbon and habitat loss in the Republic of Ireland.
Figure 9.
Potential impact of field consolidation on carbon and habitat loss in the Republic of Ireland.
The longest finger indicates that the loss of carbon will amount to just over 6 t/km2 and the loss of habitat will amount to 0.7 ha/km2, as the average field size in any given area is increased from 0.5 ha to 1 ha. Similarly, to the economic benefits of field consolidation, the rate of carbon and habitat loss diminishes as larger fields consolidate. If the average field size in the country increases from the current 3.8 ha to a more efficient 5 ha, the total loss of habitat would be approximately 20 kha while the loss of carbon storage would be 171 kt.
3.8. The Availability of Land to Meet Biofuels Targets
The results from the GIS analysis indicate that within the entire grass and arable area, the total area of land that has the combination of a suitable soil type and efficient field size (4 ha or greater) for growing arable crops, willow and miscanthus is 633 kha, 452 kha and 936 kha, respectively (
Table 3).
Table 3.
Area of land with average field sizes greater than 4ha and associated soils groups.
Table 3.
Area of land with average field sizes greater than 4ha and associated soils groups.
| | Fields >4ha |
| Classification | Arable | Miscanthus | Willow |
| Group 1 | 245, 957 | 528,566 | 73,250 |
| Group 2 | 195,323 | 230,985 | 104,754 |
| Group 3 | 467,468 | 142,899 | 393,776 |
| Group 4 | 177,010 | 174,097 | 166,540 |
| Group 5 | 455,667 | 277,790 | 769,235 |
| Total group 4/5 soils | 632,677 | 451,887 | 935,775 |
4. Discussion—Can the Republic of Ireland Meet the 2020 Targets?
Having and meeting bioenergy targets will have several national benefits, including benefits to the rural economy surrounding any bioenergy facilities, as suggested by the example of the US Midwest where ethanol plants have enhanced previously stagnant rural economies. However, the US Midwest is a region particularly efficient for crop production with consistently high yielding soils, a relative absence of field boundaries and prevalent large fields. This allows for a very efficient use of large machinery with favorable economies of scale that ultimately reduce the cost of bioenergy supply and increase their competitiveness relative to conventional, fossil based sources. The Republic of Irelands rural landscape, on the other hand, is noted for its comparably smaller, grass based fields bounded by treelines, hedgerows and stone walls, which have considerable environmental, ecological and aesthetic values. Retention of these boundaries will be detrimental from an efficiency and economic perspective to similar feedstock suppliers competing in a more globalised market. Another potential benefit of a bioenergy economy will be the reduced greenhouse gas emissions compared with an economy based solely on fossil fuels, as stated in the recently published EU RED and scientifically published papers [
29,
30,
31]. Although the reduction is rarely one for one, there is still a considerable benefit. In particular, perennial crops such as miscanthus and willow store carbon in the root mass and indirectly through an increase in soil organic matter for the life of the crop. This considerable benefit over annual crops may become offset as these crops are more likely to grow in poorer soil types, which this study has shown have smaller associated field sizes. If harvesting efficiency is to be maximized, they may be more prone to field consolidation, boundary removal and loss of carbon to the atmosphere.
A rapid and wide expansion of energy crop production in the Republic of Ireland will likely alter considerably the nation’s rural landscape with up to 22.4% of the agricultural area being required for energy crop production, which will inevitably require the displacement of the current agricultural land uses where currently grass-based livestock production systems prevail. As outlined in this paper, the total required area to meet the various energy substitution targets ranges from 724 kha to 986 kha, whereas the total area that will likely have both the required agronomic and efficiency requirements ranges from 633 kha to 936 kha. This indicates the up to 36% of the biomass requirements to meet national targets will need to be imported in order to avoid the requirement for field boundary removal. On the other hand, if crops like willow, with a considerably less specific soil-type requirement and high biomass yield are used to meet many of the targets, Ireland could potentially be at least self-sufficient with regard to meeting national targets while also remaining within the most agronomical and technically efficient areas. It can be argued that, for crops such as willow and miscanthus that have much greater biodiversity values than annual crops like wheat and oilseed rape, the loss of field boundaries is somewhat offset. However, it can also be argued that even these less intensive crops are a far removal from the previously minimally managed natural habitats, albeit covering smaller areas. Also, willow and miscanthus are tall crops usually exceeding 3 m in height, thus widespread cultivation of these crops will result in a lasting alteration to the landscape, which may not be considered as aesthetically pleasing compared with a landscape previously dominated by smaller grass fields.
It remains possible to import either biomass feedstock for further processing or refined bioenergy products to meet national bioenergy targets and reduce the pressure on feedstock producers to consolidate fields. While this is a possible scenario, the clearly preferable scenario from an energy security and national finance perspective would be to develop these supply chains within the national boundary. Also, it would be preferable to use the indigenous feedstock to ensure the sustainable supply chains and the accurate calculation of life-cycle greenhouse gas emissions.
The results of this study indicate a clear option, which is to either (1) retain the national stock of field boundaries and related habitat and carbon stores, progress a bioenergy supply chain from within the most economically efficient and agronomically suitable fields, and rely on foreign imports to meet any deficits, or alternatively (2) consolidate those smaller, less efficient fields that have favorable underlying soils types in order to meet a greater proportion of our national biomass needs from indigenous sources. The latter option is however at odds with stipulations given in the Renewable Energy Directive stating that bioenergy targets cannot be met at the expense of large stores of terrestrial carbon, which is proven by this study on the Republic of Ireland’s hedgerows and treelines. One can thus conclude that the importation of feedstock to meet the bioheat, biofuels and bioelectricity targets will have to be a key component of any future strategies to meet the EU Renewable Energy Directive.
This paper does not endeavor to prove or disprove the merits of meeting stated bioenergy goals but does endeavor to determine a realistic estimation of the nations bioenergy supply using indigenous resources. It also endeavors to prove the importance of the Republic of Ireland’s field boundaries to habitats and carbon stores, as well as the importance of field size and efficiency to the economics of supplying mass.
5. Conclusions
The Republic of Ireland can meet the stated bioenergy targets using solely indigenously grown crops.
There is a relationship between field size and the quality of the underlying soil type with larger fields generally associated with better soils.
There is a significant economic benefit to field consolidation, particularly where field sizes are small.
Meeting stated bioenergy targets will result in the consumption of most of the most efficient and agronomical soils.
Field consolidation causes on average a loss of carbon of between 6 tC/km2 and 0.5 tC/km2 for every 0.5 ha increase in average field size from 0.5 ha to 10 ha.
The area required to meet stated national bioenergy targets for 2020 range from 724 kha to 986 kha.
The total required expansion in the arable area to meet biofuel targets was calculated to be between 58 kha and 277 kha
The area required to meet the targets exceeds the area that is suitable from an agronomic and efficiency standpoint, which suggests that to fully implement national bioenergy targets will likely result in the consolidation of fields, and subsequently, the loss of habitat and the release of carbon retained within these resources, unless refined or unrefined bioenergy sources are imported from outside the state.


