Eco-Efficiency Actions and Firm Growth in European SMEs


Research Group of Industry and Territory, Department of Economics—CREIP, Universitat Rovira i Virgili, Av. Universitat, 1, 43204 Reus, Spain
*
Author to whom correspondence should be addressed.
Sustainability 2018, 10(1), 281; https://doi.org/10.3390/su10010281
Submission received: 28 December 2017
/
Revised: 15 January 2018
/
Accepted: 16 January 2018
/
Published: 22 January 2018
(This article belongs to the Special Issue Environmentally Sustainable Competitive Strategies)
Abstract
:This study investigates the effects of eco-efficiency actions on firm performance in terms of sales growth in an extensive sample of 11,336 small- and medium-sized enterprises (SMEs) located in 28 European countries. Our empirical results suggest that not all eco-strategies are positively related to better performance, at least not in the short term. We found that European companies using renewable energies, and recycling or designing products that are easier to maintain, repair, or reuse, perform better. Those that aim to reduce water or energy pollution, however, seemed to show a negative correlation to firm growth. Our results also indicate that high investment in eco-strategies improves firm growth, particularly in new members that joined the EU from 2004 onwards. Finally, we observed a U-shaped relationship between eco-strategies and firm growth, which indicates that a greater breadth of eco-strategies is associated with better firm performance. However, few European SMEs are able to either invest heavily or undertake multiple eco-strategies, thus leaving room for policy interventions.
1. Introduction
Although in existing research there seems to be a robust understanding of the factors that determine which innovations positively impact the environment [1,2,3], exactly how eco-strategies to reduce environmental impact affect firm performance is still widely debated.
Conventional wisdom among economists, policymakers, and business managers concerning environmental protection was dominated by the idea that eco-strategies necessarily increased internal costs but not profits for firms. Some years later, Porter [4] and Porter and Linde [5] proposed a new green perspective emphasizing that both the environment and the firm can benefit, since stricter regulations may trigger innovation and lead to higher profitability and competitiveness in the long run.
Recently, Barbieri et al., Ambec et al., Dixon-Fowler et al. and Albertini [3,6,7,8] provided reviews and meta-studies summarizing the empirical work on the economic effects of eco-strategies. These studies reveal the presence of considerable diversity in the empirical results, ranging from negative through non-significant to moderately (or even strongly) positive links between eco-innovation and firm performance. Such mixed results suggest that the relationship between eco-innovation strategies and firm performance is complex and poorly understood, indicating the need for greater effort in investigating the linkage. This could provide a conclusive argument to help managers bring about a win-win situation in which both firms and society can benefit from eco-innovation practices. In addition, a better evaluation of the relationship would be useful in designing effective future eco-innovation policies.
In this study we therefore focus on the role played by eco-strategies, and we ask whether firms are creating economic opportunities (in terms of firm growth) by improving their eco-performance or missing out on a sustainable competitive advantage in today’s turbulent environment. To do this we use the European Commission’s Eurobarometer Survey 426 which provides a valuable opportunity to examine the role of eco-strategies in firm growth in SMEs in European countries.
Applying an ordered logistic model for 11,336 European SMEs, our empirical developments offer some interesting results. First, not all eco-strategies are positively related to better performance in terms of growth in turnover. We find that European firms using renewable energies perform better. In addition, undertaking eco-strategies aimed at recycling or designing products that are easier to maintain, repair, or use increase firm growth in the European Union-15 (EU15). Firms seeking to reduce water or energy pollution, on the other hand, seem to show a negative correlation with firm growth patterns. Second, our results indicate that high investment in eco-strategies improves firm growth, particularly in the new member states that joined the EU from 2004 onwards. Finally, we observe a U-shaped relationship between eco-strategies and firm growth, implying that a greater breadth of eco-strategies is associated with higher firm performance. However, few SMEs are able to either invest large amounts or undertake multiple eco-strategies.
This paper contributes to the previous literature in several ways. First, despite the important role that SMEs play in advanced economies, the impacts of eco-strategies on firm performance have received less attention in the literature compared to large firms [9,10]. Nowadays SMEs are the economic backbone of the European Union, representing 99% of European business and accounting for more than two-thirds of employment. As well as being economically important, the analysis of eco-strategies across SMEs is relevant since the costs of investing in these strategies in the short term are high and, at the same time, SMEs face greater financial barriers than larger firms, especially regarding difficulties when accessing external sources of funding [11]. We therefore contribute to the existing debate with a detailed investigation of SMEs.
Second, cross-country analyses of eco-strategies at firm level are still scarce [12,13]. In general, empirical studies are performed focusing on either a single country or a specific sector (examples of specific country analyses include: Italy [14,15], Germany [16,17], Ireland [18], the Netherlands [19], and Slovenia [20]. Analyses of specific sectors include: the automotive sector [9] and the paper industry [21], among others). However, this study enhances previous research by giving more clarity to the relationship between eco-innovation strategies and firm performance across 28 European countries, taking into account both sector and country differences.
Finally, to compare how much eco-strategies vary across countries, we classify the EU28 countries into two clusters. The distinction between established (European Union-15) and new EU members (the group of more recent members that joined the EU from 2004 onward) is of great interest today, bearing in mind that in a considerable number of Central and Eastern European countries have become part of the European project in recent years. Despite the fact that the connection between eco-strategies and firm performance has been examined extensively for countries that have been members of the EU for many years, evidence is virtually non-existent for new members [20,22,23].
The remainder of the paper is structured as follows. Section 2 consists of a literature review. Section 3 presents the database, some descriptive statistics, the variables, and the econometric methodology. Section 4 shows our main findings. The final section presents our conclusions and the consequent policy implications.
2. Eco-Innovation Strategies and Firm Performance
While eco-innovation is expected to have a beneficial effect on the environment, its effect on firms’ performance is less straightforward. Historically, the conventional economic approach held that investing in environmental activities to reduce an externality like pollution involved an additional cost to a firm with no resulting benefits, this in turn eroding a firm’s overall competitiveness [24,25]. However, two decades ago a new green perspective emerged that considered that investments in eco-innovation activities would offset operational costs and increase firm performance in the long term [5].
Recently, scholars have increasingly emphasized the win-win idea (improving the environment with no reduction in firm profits). Relying primarily on case studies, Porter and Linde [5] argue that more stringent but well-designed eco-regulation (mainly in the form of market-based instruments such as pollution taxes and tradable permits) can stimulate innovation which, by enhancing productivity, increases firm benefits. This is generally known in the literature as the Porter Hypothesis (henceforth PH), according to which eco-regulation is a means whereby a firm can benefit from environmental and economic performance. It has, therefore, attracted much attention among researchers and policy-makers because it goes against the conventional wisdom that environmental protection always has a negative effect on economic growth.
Existing Empirical Studies
Given the PH framework, a range of empirical studies have set out to analyse the relationship between eco-strategies and performance at firm-level (see Barbieri et al. [3] for a recent literature review on the economic effects of eco-innovations and also some examples: [9,14,16,18,26,27,28]). Despite the accumulation of empirical work on this topic over the last decade, there is no general consensus on the direction and magnitude of the relationship. The emergence of heterogeneous results can be explained in the light of several dimensions such as the scope of analysis (firm or aggregate level, small or large sample), the variety of performance measures (productivity, growth, profitability), the hybrid indicators to measure eco-strategies (clean technologies, end-of-pipe techniques, pollution prevention, resource efficiency measures, etc.), the empirical approaches adopted, and the availability of data. Concerning the latter, most of the empirical contributions employ two typologies of data sources to analyse the economic effects of eco-strategies: patent data or survey questionnaires (such as the Community Innovation Survey (CIS) or Eurobarometer Special surveys in the European context). Although valuable and based on official datasets, we believe that the value of evidence focusing on patent data is limited because patents are likely to be skewed towards innovation in large firms and technologically intensive sectors, whereas most of the firms in the EU28 are small- or medium-sized and not included in the patent data.
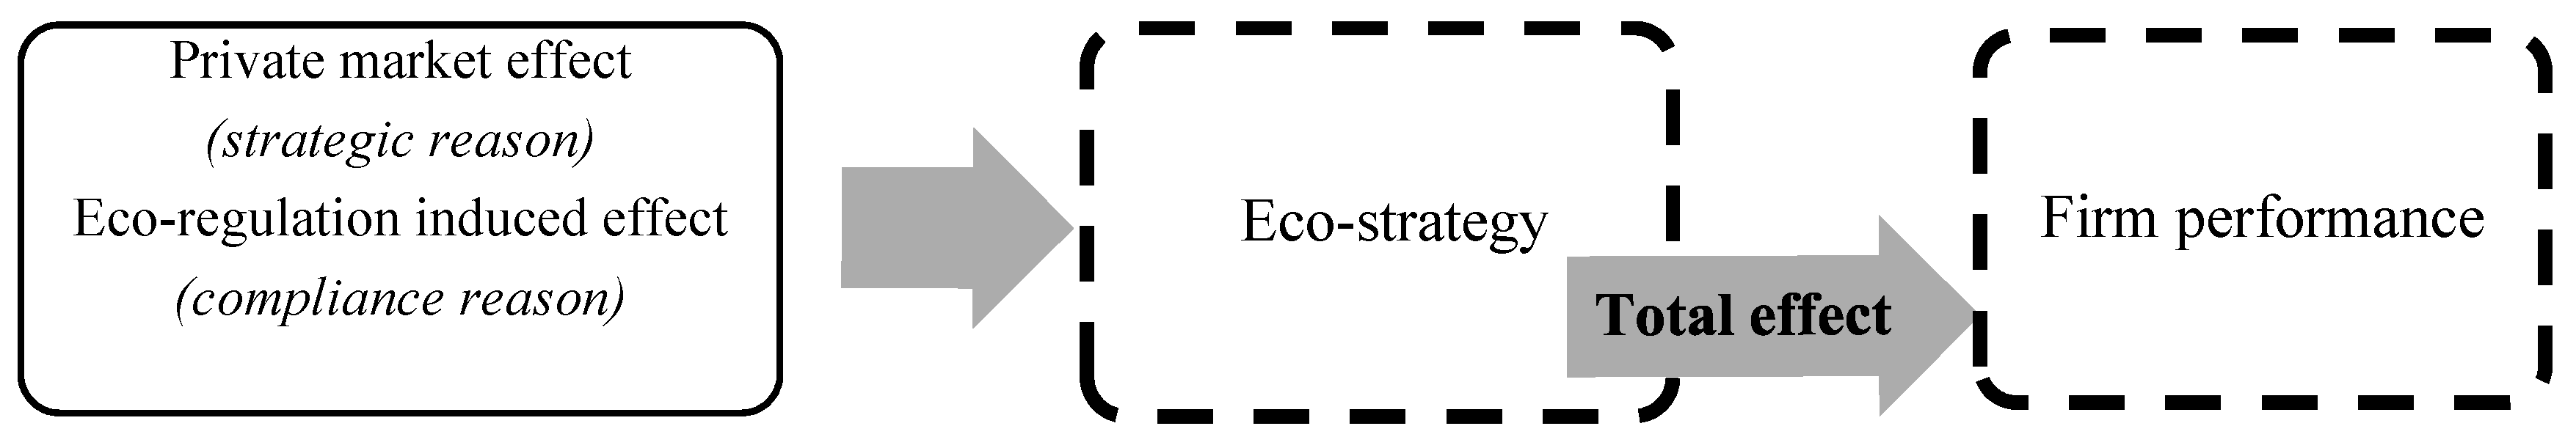
Figure 1 provides a synthetic overview of the framework used in our empirical analysis. Note that our empirical investigation does not examine the full chain of causality from eco-policies to eco-innovation and firm performance, since we cannot disentangle the effects driven by eco-policies and private market (strategic reasoning). Because of data limitation, this analysis focuses on the relationship between eco-innovation strategies and SME performance, and we therefore measure the total effects of eco-strategies (the direct effect stemming from private eco-investment and the indirect effect stemming from policy). Nevertheless, the present study is still relevant for policy-makers, as it indicates whether current eco-policies are sufficient to make eco-strategies profitable or whether policy adjustments are needed.
In the following, a summary is made of the recent empirical literature on the economic effects of eco-strategies on firm performance. Different concepts are used to measure firm performance, such as productivity (including, for example, value added, gross output, and turnover per employee), growth (in terms of sales), and financial measures (e.g., operating margins, return on sales, Tobin’s Q ratio). Table 1 summarizes the relevant literature described in this section according to which dimension of firm performance is considered.
In the European context, Doran and Ryan [18], using a cross-sectional Irish sample, found that firms that engage in eco-innovation in general have higher levels of turnover per employee than firms that do not. Similarly, Hojnik and Ruzzir [20], exploring Slovenian firms, and Przychodzen and Przychodzen [23], examining a sample of Polish and Hungarian firms, suggest that process eco-innovation practices have no adverse effect on firm performance (in terms of profitability and growth) and conclude that it pays to be an eco-innovator. Meanwhile the study by Antonioli et al. [30], which also analyses the general effect of eco-innovation on firm performance for a group of firms in the Emilia-Romagna region in Italy in 2010 and 2011, found that some firms’ productivity performances (such us revenues over total labour cost) are positively related to eco-innovations.
However, contrary to this positive evidence of the impact of eco-innovation strategies on firm performance, some research indicates that not only is there no correlation between the two variables, there is not even a trade-off. For instance, Cainelli et al. [27], using a sample of Italian services firms, show a negative link between eco-motivations and growth in employment and turnover in the short term. Focusing on the paper industry in four European countries (Germany, Italy, the Netherlands, and the United Kingdom), Wagner et al. [35] also provide evidence of a negative relationship, although only for one specific financial performance measure (return on capital employed (ROCE)), and reports no evidence of a significant relationship between two other economic performance indicators (return on sales (ROS) and return on equity (ROE)). On the basis of patent analysis, Marin and Lotti [15] more recently used a sample of Italian manufacturing firms and observed that eco-innovations exhibit a lower return relative to other innovations, at least in the short run. This differential effect seems to be especially true for polluting firms facing higher compliance costs for eco-regulations than other firms. In the context of transition economies, there is some evidence that better pollution prevention strategies generated by improved production processes neither improve nor undermine financial success in the Czech Republic [33].
Beyond the extensive literature that looks at the link between eco-strategies in general and firm performance, some researchers have recently started to claim that most of the empirical studies analysing the relationship between eco-innovation practices and firm competitiveness should go further, distinguishing between different types of eco-strategy, rather than just focusing on the question “whether it pays to be green” [14,16,36].
Based on a German sample, Ghisetti and Rennings [16] considers two typologies of eco-innovation: one aimed at reducing externalities and the other aimed at increasing energy and resource efficiency. Their econometric analysis, based on two waves of the Mannheim Innovation Panel, suggests that innovations leading to a reduction in the use of energy or materials per unit of output have a positive effect on firm competitiveness in terms of higher profits. However, innovations aimed at reducing externalities such as air, water, and noise pollution, and harmful materials, have the opposite effect. Using the same German data for 2009, Rexhäuster and Rammer [17] found similar results, as did Miroshnychenko et al. [32] using over 3000 publicly-traded firms across 58 countries.
Two other recent papers deal with the heterogeneity effect of eco-innovation strategies on firm performance. Doran and Ryan [31], examining a sample of Irish firms, decomposed the eco-innovation variable into nine different types of eco-innovation practices, only two of which (reduced CO footprint and recycled waste, water, or materials) were able to impact positively on firm performance in terms of turnover per employee. These findings suggest that the question as to whether it pays to be green should be reformulated and better qualified in terms of the typologies of eco-innovation orientation. Similarly Leeuwen and Mohnen [19], using a Dutch dataset, investigated the full chain of causality from eco-regulatory stringency to environmental and firm performance. They found that only resource-saving eco-innovations (those that can be assimilated into process-integrated eco-innovations) have a positive effect on total factor productivity (TFP), whereas pollution-reducing or end-of-pipe eco-innovations tend to reduce it.
In terms of firm growth, it is surprising that, despite the great importance of the current policy debate on green and sustainable growth in the European Union, the number of studies that examine the role of eco-innovation orientation in promoting firm growth is relatively small, especially when compared to the number of studies focusing on the growth effects of general innovations. Although technological innovations are generally recognised as contributing to firms’ growth (for a reviewsee Coad [37]), the effects of eco-strategies are still little-researched and unclear [13,27].
Cainelli et al. [27] using the CIS sample of Italian firms, found a negative link between environmental motivations in general and growth in both employment and turnover in the short term. However, Colombelli et al. [13], analysing a sample of over 400,000 firms located in Germany, France, Italy, Spain, and Sweden during the period 2002–2011, shows that those oriented towards eco-innovation (identified on the basis of green patents) are characterized by higher growth rates than those carrying out only generic innovations.
With the aim of understanding and explaining the mixed results of the empirical research into the relationship between eco-strategies and firm performance across European countries, we formulate the following overarching research question: do eco-strategies have a positive link on firm performance? To help us arrive at an answer, we coherently test three hypotheses.
The first of these, following the existing literature mentioned above, looks at the different natures of eco-strategies and their effects on firm performance.
Hypothesis 1 (H1).
The economic effects of eco-strategies on firm growth patterns are heterogeneous and conditioned by the type of eco-strategy considered.
The second is in line with more recent studies that suggest there is a need to investigate the intensity of eco-strategies rather than the fact of their adoption. Antonioli and Mazzanti [38], using a sample of Italian firms, shows that the level of eco-innovation investment plays a role in determining firms’ productivity, whereas a non-significant effect is found for the adoption of eco-innovation investment. The negative or non-significant effects of adoption might be explained by the fact that eco-strategies need time for their effects to be felt, or because a minimum level of intensity is needed to cause a change in production efficiency or demand before any return on these strategies can be reaped [27]. This leads us to the second hypothesis:
Hypothesis 2 (H2).
The intensity of investments in eco-strategies triggers better firm performance.
As mentioned above, firms investing in eco-strategies have high risks and costs in the short term before they start to reap any benefit, because eco-strategies are characterized by a high level of uncertainty, novelty, and the need to go beyond the firm’s core competencies. These characteristics are especially important for SMEs, which face major difficulties in obtaining credit for their eco-investments compared to larger firms, which often have better access to equity and long-term loans [11]. As known from general innovation theory, given the inherent risk of innovation, firms have the incentive to diversify or develop multiple external linkages and strategies in order to maximize their chances of success [39,40,41]. However, diversification comes at a price. A firm needs additional training for its employees, new equipment, and time to integrate and assimilate new strategies.
The empirical results generally suggest that wider horizons regarding innovation objectives and knowledge sources are associated with better performance. However, studies into the effect of a greater breadth of eco-strategies on firm performance are still missing.
Using industry-level data from 12 OECD countries, Soltmann et al. [29] shows that the general relationship between the intensity of green inventions and performance is U-shaped. They concluded that the turning point is quite high and consequently only relevant for a few industries. For most industries, therefore, an increasing level of green inventions has a negative effect on firm performance. The same empirical evidence of a U-shaped relationship between environmental performance and profitability for firms in the manufacturing and service industries was recently provided by [34].
Our third hypothesis is therefore:
Hypothesis 3 (H3).
Firms with a greater breadth of eco-strategies experience better firm performance.
These three hypotheses are calibrated in the econometric work developed below. This analysis was only made possible because of our dataset containing the environmental patterns of European SMEs drawn from the information obtained from a survey of a large sample of SMEs located in EU28 member countries.
3. Methodology and Data
3.1. Database and Descriptive Statistics
The source of the data used in this paper is the Flash Eurobarometer Survey 426 (FLE426) on “Small and Medium Enterprises, Resources Efficiency and Green Markets, wave 3”. It was conducted between 1 and 18 September 2015, and follows earlier Eurobarometers (FL342 in 2012 and FL381 in 2013). The database includes the 28 member states of the European Union, plus Albania, the former Yugoslav Republic of Macedonia, Montenegro, Serbia, Turkey, Iceland, Moldova, Norway, and the US, and covers large companies and SMEs.
In the Flash Eurobarometer Survey 426, a total of 15,020 managers (13,114 from the EU28) were selected using a stratification procedure according to the dimensions of firm size (four categories: 1–9 employees, 10–49 employees, 50–249 employees, and 250 employees or more) and sector (four categories: manufacturing, retail, services, and industry). It is important to stress that, as in any survey, the information gathered relies on the interpretation made by the manager answering the questions. Despite the subjective nature of many of the questions, we believe that, on average, the information obtained via these questions is a good proxy for the general attitude of top management toward eco-issues.
One of the main advantages of the Flash Eurobarometer Survey 426 is that it is an extensive survey that includes three dimensions: country, sector, and firm size. Most environmental empirical databases offer only aggregate information at the country level, so having three dimensions in the same database allows researchers many possible views and perspectives on the data. However, the main drawback is that it is a cross-sectional dataset, and so the problem of simultaneity is somewhat unavoidable. So far this has been a problem common to all studies that use Flash Eurobarometer datasets [42,43].
Due to the focus of our analysis (the effect of eco-strategies on growth in SMEs across the EU28) and the data cleaning procedure (discarding observations with missing values for the relevant variables), the final sample includes 11,336 firms.
To examine the differences between EU countries in some depth, we also classify the EU28 countries into two clusters: the European Union-15 and new members of EU (the group of recent member states that joined the EU from 2004 onwards). Internal differences in eco-performance in these two clusters are found to be important, especially for the new EU members, which operate further from their respective eco-technological frontiers [44,45,46]. Table 2 gives an overview of the final sample. The EU15 group includes 6104 firms and the new members group 5232. The sample is dominated by the services and retail sectors, and by very small firms with one to nine employees in both country groups.
Table 3 displays the characteristics of the sample by country group. About 40% of the firms in the sample say that annual turnover increased over the previous two years while over 25% reported a decrease in their growth rate. When comparing established members against new EU members, SMEs in the first group are more likely to have increased their annual turnover (43% vs. 39%).
Most of the SMEs (86% of the sample) are taking action to become more resource efficient. This may be because the period under observation was one in which major policies were being implemented at EU and national levels (Europe 2020 strategy and subsequent roadmaps). The most common resource efficiency actions taken by the EU28 are those aimed at saving energy (63%), minimising waste (57%), and saving materials (56%). In contrast, SMEs are less likely to be taking actions to use predominantly renewable energy (13%). When we look at all the countries involved, firms are implementing an average of three eco-strategies to become more resource efficient. However, the country group analysis shows a slight degree of variation in the number of resource efficiency actions being taken by SMEs. Firms in the new member states that joined the EU from 2004 onwards are likely to implement fewer green practices than their counterparts.
Overall investment in resource efficiency actions is low, with almost 50% of SMEs that are taking action investing less than 1% of their turnover in this area in the previous two years, and 40% investing 1–5%. Only 10% invested more than 6% in eco-strategies. The small amounts of money assigned to resource efficiency practices may indicate that firms invest the minimum simply to comply with environmental legislation. Otherwise, there are no great differences between country groups in the proportions they invest in eco-strategies, although new members still show less favourable investment indicators.
In short, the values reflected in the two clusters of countries, together with the substantial significance of the t-test, suggest that the profile of SMEs from former EU member countries differs slightly from that of new member countries. The first group presents greater sensitivity to the undertaking of resource efficiency practices to be greener and invests slightly larger amounts of money in fostering them thanks to their own technical expertise and greater external finance.
3.2. Empirical Strategy
We estimate an ordered logit model, where we compare the impact of the various eco-innovation strategies on different exclusive categories of turnover growth: increased, unchanged, and decreased (which is the base case) The models for ordinal outcomes can be described in terms of a latent variable. The structural model is:
where is the latent variable (annual turnover growth of firm i in country c), is a vector of explanatory and control variables, and is the idiosyncratic error term. The latent variable can be divided into M ordinal categories, so the observed variable is:
and the probabilities of observing are given by:
where F denotes the logistic cumulative distribution function. The three categories for our growth variable are: decreased (j = 1), unchanged (j = 2), and increased (j = 3).
To test our first hypothesis, we include a dummy variable indicating whether or not a firm is undertaking any eco-strategy to be more resource efficient (Equation (2)). Then, following the argument that a distinction needs to be made between different typologies of eco-strategy to assess the effects of those innovations on firm growth, we specified Equation (3). Based on the question ‘‘What actions is your company undertaking to be more resource efficient?”, in Equation (3) we include a vector of eight different types of eco-strategy: water reduction, energy reduction, using renewable energy, saving materials, minimizing waste, selling scrap material to another company, recycling, and designing products that are easier to maintain, repair, or use. To examine whether the intensity is more important than the adoption, we then introduce a dummy variable into Equation (4) to account for the intensity of the eco-strategy investment. This variable takes the value one if the firm investment in eco-strategies is higher than five percent of annual turnover.
Moving on to the empirical test of whether the breadth of eco-strategies is associated with positive firm performance, we estimate the models in Equations (5) and (6). First, we introduce the breadth variable that refers to the number of eco-strategies implemented by each firm. Then, to identify any non-linear relationship, we also introduce the quadratic form of breadth.
To minimise any estimation bias due to an omitted variable, we have included in all the equations a series of control variables in line with previous work on the determinants of firm growth (for a review, see Coad [37] for a survey), as well as restricted by the variables available to us in our dataset. Regarding the set of control variables, to take into account relevant observable firm-level characteristics, we introduce the following variables: firm size (micro- (1–9 employees), small- (10–49 employees), and medium-sized (50–249 employees)), age (young), the role of technological and management capabilities within the firm (own technical expertise), and the importance of internal and external financial support in implementing resource efficiency activities (own finance and external finance, respectively).
Then, as the different eco-strategy variables can be correlated with unobserved firm-specific heterogeneity, we also control for firms’ attitudes towards the environment. For instance, positive performance effects due to higher resource efficiency strategies could be a result of better management, especially eco-management. To prevent any potential omitted variable bias, we include two dummy variables that consider the influence of firm eco-orientation by considering whether the environment is one of the top priorities (greenness priority) and whether the firm is aiming to create a competitive advantage or business opportunity by taking actions to be more resource efficient (business opportunity). Finally, we include sector dummies (manufacturing, retail, services, and industry) and country dummies (Appendix A summarizes the list of variables and their definition, Appendix B shows the correlation matrix).
Due to the non-linear form of the ordered logit estimation, the size of the coefficients should not be directly interpreted. The focus should be on the sign and significance of the estimates. Clustered standard errors by country are reported to avoid an underestimation of standard errors due to intra-group error correlation.
Before turning to the regression results, we first address potential concerns about the presence of multicollinearity. Table A2 shows the correlations between the independent and control variables. The correlation coefficients and variance inflation factors raise no concerns regarding multicollinearity. The results of a collinearity diagnostic test on the regression models show that the mean variance inflation factor (VIF) values range between 2.41 and 3.10 (well below 10), thus, confirming the absence of multicollinearity problems in the dataset. The only noteworthy correlation is between the eight eco-strategies and breadth (from 0.37 to 0.70), which will be included in separate model specifications later on.
4. Results
The results of the ordered logit model for the whole database and for both country groups considered in this paper are displayed in Table 4, Table 5 and Table 6. Five specifications have been estimated. Specification I shows the results when the eco-strategy variable makes no distinction between the nature of the eco-strategies. Specification II decomposes the eco-strategy variable into eight different resource-efficiency practices according to the Flash Eurobarometer Survey 426. Specification III considers the intensity of those eco-strategies. Finally, specifications IV and V incorporate the breadth of the eco-strategies and the quadratic form of breadth, respectively, to test whether firms with a greater breadth of eco-strategies experience better firm performance. We must stress that the cross-sectional nature of the dataset we are using constitutes a limitation to the scope of the present analysis and only allows us to comment on correlations between variables rather than proper causations.
We found for all the countries involved that undertaking of an eco-strategy in general to be more resource efficient is associated with reduced growth in terms of turnover. When we split the sample by clusters, the eco-strategy coefficient remains negative, but is non-significant. In general, these results suggest that there is a need to consider the relationships of different eco-strategies in detail, since their effects on firm performance, and especially firm growth, are heterogeneous. At first sight, our main finding would be the negative relationship between eco-innovation strategies and firm growth, meaning that it does not pay to be green. However, going a step further and distinguishing between different types of eco-strategy, we instead find clear confirmation that not all measures to improve resource efficiency have the same effect on growth, and therefore it would be best to decompose them.
Of the eight types of eco-strategy considered, only three have a significantly positive effect on firm performance. Using predominantly renewable energy (e.g., including own production through solar panels, etc.), recycling by reusing material or waste within the company, and designing products that are easier to maintain, repair, or reuse are eco-strategies that relate to positive firm growth. However, firms that aim to reduce water or energy use experience a negative and strongly significant effect on growth. The other eco-strategies under consideration show no significant effect on firm growth. In line with previous literature, this suggests that the effect of eco-strategies on firm performance varies depending on the specific sub-type of resource efficient strategy considered [16,31].
Regarding the two country groups, the results for EU15 show that firms that undertake an energy reduction eco-strategy see a decrease in firm performance, whereas two resource efficiency practices—the use of renewable energies and the design of products that are easier to maintain, repair, or reuse—seem to play a more important role in firm growth. As for the new member group, only one of the eight eco-strategies—the predominant use of renewable energy– exerts a positive and strongly significant effect on firm growth. In addition, firms in these countries that implement water and energy reduction activities show the worst performance.
Other reasons for the negative relationship between eco-strategies in general and firm performance may be that firms might find it difficult to reap the returns from these resource efficiency practices since they need time before they exert their full effects, or that the intensity of the strategies (which we do not observe in specifications I and II) is not sufficiently high to modify the production process or stimulate demand through environmental innovation dynamics. Regarding the latter, when we include investment in eco-strategies (specification III), it seems that greater investment in resource efficiency strategies trigger an improvement in overall firm performance. However, only a few firms in the sample invest intensely in eco-strategies and turn them out to be profitable in terms of firm growth. In contrast, when we split the analysis into EU15 and new member groups, the large amounts of money spent on resource efficiency strategies are only positive and significant for countries that have recently been incorporated into the EU project.
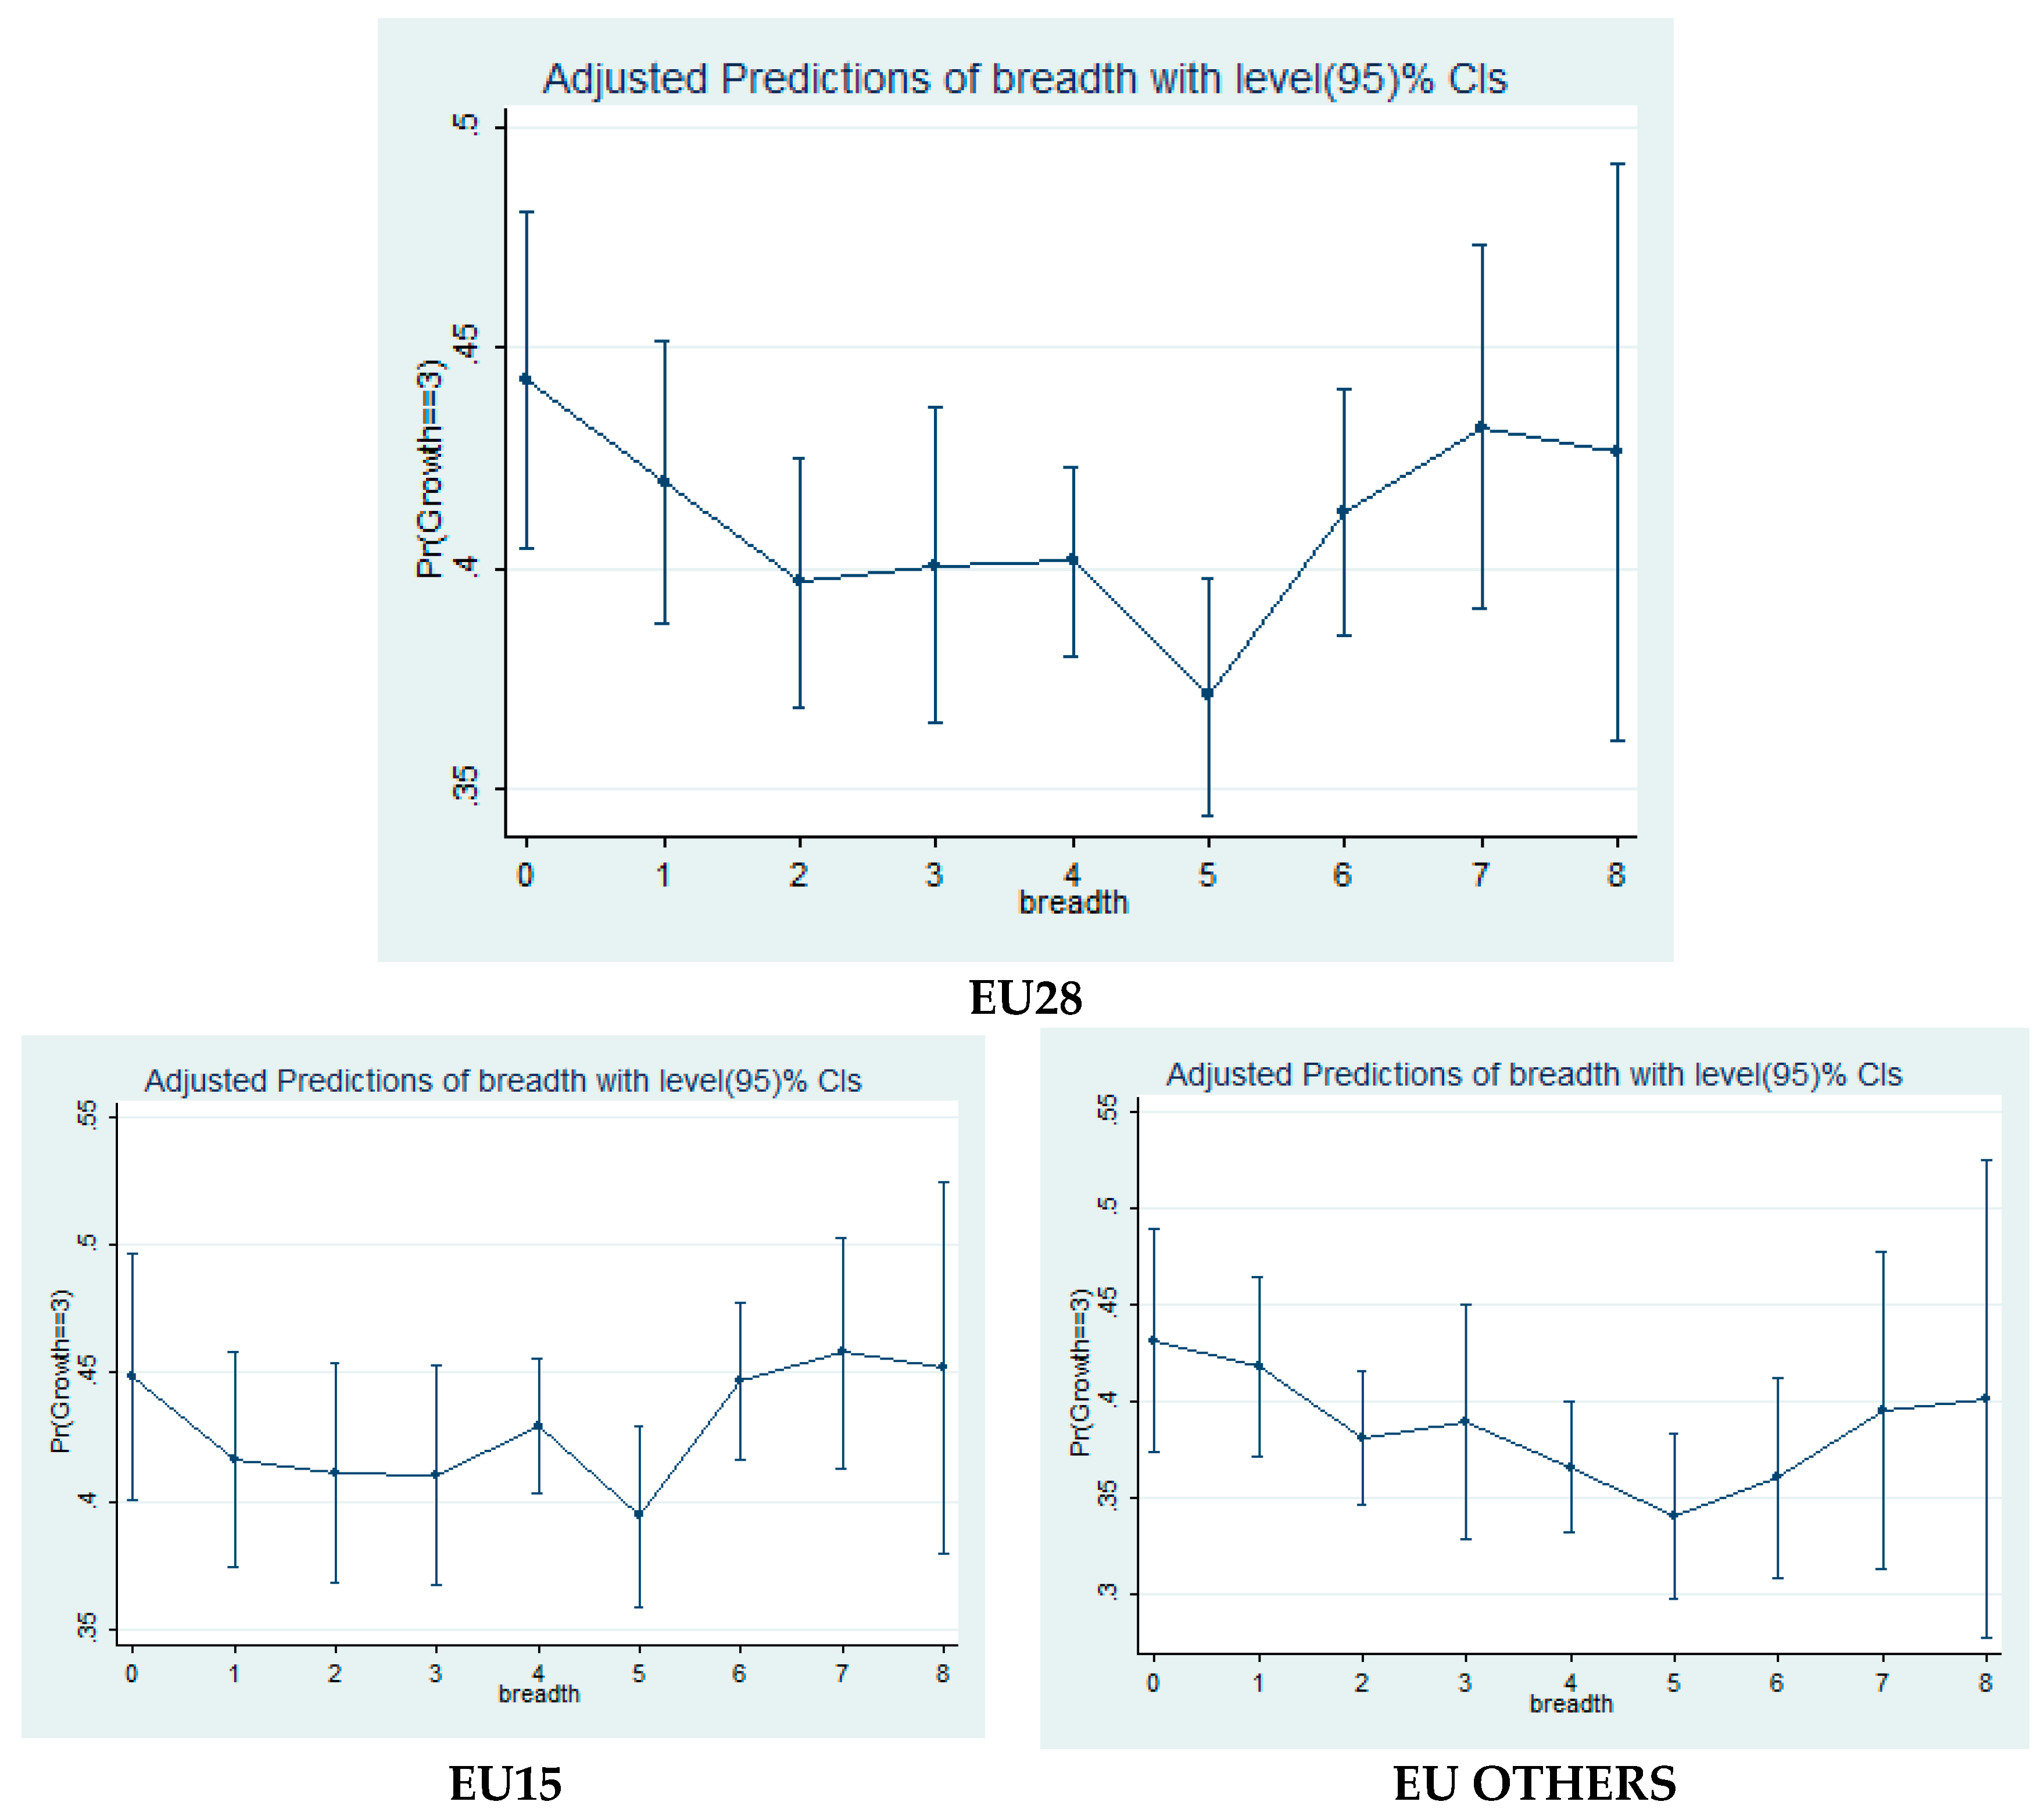
Regarding our third hypothesis, specifications IV and V examine the link between breadth of eco-strategies and firm performance. When breadth is introduced in specification IV a negative relationship is found, although this relationship is not significant. In specification V, however, when we also incorporate the quadratic term, the breadth variable becomes negative and significant, and the quadratic term positive and significant, which suggests that the wider array of eco-strategies influences firm performance more than proportionality. The relationship between firm growth and the number of eco-strategies carried out by firms is U-shaped, in line with the findings of Soltmann et al. [29] using industry-level data. This implies that when the number of eco-strategies undertaken is low, this has a negative impact on firm performance. Conversely, when the number of eco-strategies is high, this triggers firm growth (see Appendix C). However, again only a few firms in the sample undertake a large number of eco-strategies. These results are still robust when we split the sample into our two clusters of countries—the breadth variables and their quadratic forms have the same sign but are not significant.
As for the effects of the control variables employed in our econometric specification, the results reveal that firms that value either the environment as a core priority activity or resource efficient practices as a means of creating a competitive advantage show better firm performance. We note that SMEs in the EU15 group rely more heavily on better eco-management than countries that have more recently joined the EU.
In addition, having good own technical capabilities and expertise, and good access to financial resources (both internal and external) significantly helps European SMEs to improve their firm performance. Our results clearly confirm the conjecture that firm growth is different across country groups. External finance significantly increases firm growth in new member states, although, this variable seems not to be relevant for long-standing members of the EU. Own technical expertise and own financial resources also show a significant positive influence on growth in the EU15 countries. These results are in line with Hölzl [47], finding that technological capabilities seem to be more important in high-growth SMEs in countries that are closer to the technological frontier.
As far as firm characteristics are concerned, age and size are found to be important determinants of a firm’s growth, with a large body of evidence showing that younger and smaller firms are more dynamic and thus more effective in spurring growth [37,48]. Regarding age, our results are in line with the previous literature, with young firms seeming to perform better. Firm size, meanwhile, is positively correlated to firm performance in both country groups in our sample.
Finally, the explanatory variables used in the ordered logit estimation confirm that sector and country factors have an impact on firm growth. Using the Wald test, we also examined the joint significance of the country dummies for the whole sample. The p-value of this test, which is equal to 0.000, allows us to reject the null hypothesis that the coefficients are jointly equal to 0. Indeed, this test shows the relevance of country specificities. Moreover, we obtain this result for all the specifications adopted in the paper.
Additional Analyses—Robustness Check
In this section, the robustness of the ordered logit model (OLM) estimates are tested. A critical assumption of the OLM is that it requires the distance between each category to be equivalent (proportional odds assumption). It also requires the number of categories not be too large and for there to be sufficient variation in each category. Since an ordinal dependent model might violate the proportionality assumption, the estimation requires models that avoid the assumption of equality in the distance between categories [49]. To test whether this assumption is violated in our sample, we used the Brant test [50] in each model specification. Unsurprisingly, the test shows that our models violate the parallel-lines assumption, partly due to the inclusion of the many country dummy variables. If we focus on our independent and control variables, there are few occasions when the parallel regression assumption is violated. The test statistics indicate that the assumption is violated for the following variables: business opportunity, size (50–249 employees), and manufacturing and retail sectors (see Appendix D for further details).
Therefore, as a robustness check for the ordered logit model and as the literature suggests, we provide additional estimates. First, we dichotomize the outcome variable (increased vs. unchanged or decreased firm growth) and use a binary logistics regression. We then also report a model that does not assume proportionality (generalized ordered logit model).
In essence, the results from both models, the logit and the generalized ordered models, convey the same story (not reported here due to space limitations, but available from the authors upon request). Not all eco-strategies have the same impact on firm growth across SMEs in the EU28, and the intensity and breadth of the eco-strategies are relevant regarding firm growth. In short, we can rely on the results from the standard ordered logit model as presented above (The results are not reported here but are available upon request.). In addition, to test the robustness of the estimations we perform two more regressions. First, we run an ordered probit only for manufacturing firms given their innovation potential and environmental pressure. Second, because of the heterogeneity of the EU15 group, we split the cluster into core countries and Mediterranean countries in order to better understand the differences between the two. The results are in accordance with the current results displayed above (the results are not reported here but are available upon request).
5. Conclusions
The aim of this paper was to shed light on how eco-innovation strategies impact on SME growth across European countries. Previous empirical studies on the relationship between eco-strategies and firm performance have often been based on relatively small samples and are usually confined to a single country. Our paper expands this stream of research by using an extensive dataset covering a large sample of SMEs in 28 European countries. In addition, we classify the EU28 countries into two clusters. This distinction between EU15 and new EU members (the group of states that joined from 2004 onwards) allows us to better understand the differences between the two groups of countries.
Through the application of an ordered logistic model, our empirical results suggest that there is a need to distinguish between different eco-strategies and, in line with previous literature, draw attention to the fact that the correct question is not whether ‘it pays to be eco’, but rather ‘when’ and ‘for whom’ it pays to be eco. Firm growth varies greatly according to eco-strategies, and thus, not all eco-strategies are positively related to better performance, at least not in the short term. It would appear that in a European SME context, certain measures in eco-strategies can result in a win-win situation for both the firm and society, while others result in a better environmental situation at the expense of firm performance in terms of growth. We find that European firms using renewable energies perform better. Undertaking eco-strategies aimed at recycling or designing products that are easier to maintain, repair, or reuse also increases firm growth in EU15 members of the EU. However, those firms that aim to reduce water or energy pollution seem to show a negative correlation with firm growth. Consequently, our results also shed light on the idea that the analysis and classification of different types of eco-strategies does matter.
Furthermore, our results indicate that higher investment in eco-strategies improves firm growth, particularly in the new member states that joined the EU from 2004 onwards. In other words, it seems important to be eco-efficient, but it must also happen in a big way. Finally, we observe a U-shaped relationship between eco-strategies and firm growth, meaning that a greater breadth of eco-strategies is associated with better firm performance. However, few SMEs are able to either invest large amounts or undertake large numbers of eco-strategies.
At the same time, we also observe that the conjecture of firm growth is different across country groups. Valuing the environment as a core activity of the firm is more important for EU15 members, whereas new EU members seem to rely more on external finance for growth.
To sum up, our empirical evidence suggests both a negative and a positive relationship between eco-strategies and firm performance that depends, on the one hand, on the types of eco-strategies, and on the other, on the level and intensity of those eco-strategies. Hence the association between eco-strategies and firm performance may be more complex than simply positive, negative, or neutral. This would suggest that the theoretical framework should encompass, at the same time, both perspectives: a positive and negative relationship between eco-strategies and firm performance.
In terms of implications, we find that most European SMEs do undertake eco-strategies but at a low investment intensity. Since the impact of eco-strategies is negative when investment intensity is not considered, this suggests that there is room for policy interventions aimed at raising awareness among SMEs of the advantages of making a minimum level of investment in eco-strategies. The eco-strategies whereby European firms add value vary slightly across different countries. Policy-makers should therefore consider the economic and technological specifications of each group of EU countries so as to choose the best possible instruments for increasing investments in eco-strategies. Furthermore, a greater breadth of eco-strategies is associated with better firm performance, and therefore managers should evaluate not only the benefit of each particular eco-strategy, but also the possible synergies and interactions between different strategies.
The analysis presented has provided useful additional results on the effects of eco-strategies on firm performance. Nevertheless, it is important to highlight some limitations of the paper that could be the object of fruitful future research. The database only allows us to identify the existence of a specific eco-strategies and the intensity of all strategies in general (through categorical values on an interval scale), but we cannot capture individual eco-strategy intensities. We have seen that sometimes carrying out an eco-strategy is not enough; a high level of intensity is also necessary. This suggests that developing more sophisticated proxies of eco-strategies is potential avenue for future research. On the methodological front, our cross-section analysis could be further extended by incorporating temporal dynamics in the analysis as data becomes available. The use of panel data would still correct for any remaining unobserved heterogeneity or omitted variables issues. Finally, because of data limitations, we analysed firm performance using a single measure, and in a categorical dimension. In addition to growth performance, future research may extend the findings using other measures. In an ideal world, one would exploit balance sheet data on profitability rather than self-reported measures, but statistical offices’ understandable anonymization procedures currently prohibit this. Another important extension of this study would be to investigate the economic effects of eco-strategies, not only for firms, but for society as a whole, by looking at measures of productivity or employment instead of firm growth.
Acknowledgments
This paper is part of the research being carried out with the financial support of the Consolidated Group of Research 2014-SGR-1395, the Xarxa de Referència en Economia Aplicada (XREAP), and the Secretaria d’Universitats i Recerca del Departament d’Economia i Coneixement de la Generalitat de Catalunya. The authors thank two anonymous referees and participants at the Workshop on Challenges of Innovation 2017 for useful insights and comments. The usual disclaimers apply.
Author Contributions
Conflicts of Interest
The authors declare no conflict of interest.
Appendix A. Variable Definitions

Table A1.
Variable definitions.
| Variables | Description |
|---|---|
| Dependent variables | |
| Sales growth rate | Categorical variable which takes the value 1 = firm turnover decreased; 2 = firm turnover unchanged; and 3 = firm turnover increased |
| Independent variables | |
| Eco-strategies | 8 dummy variables that take the value 1 if the firm states to undertake the following actions to be more resource efficient; 0 if not Water reduction Energy reduction Predominant use of renewable energy Material reduction Waste reduction Sale of scrap to other firms Recycling Design of products that are easier to maintain, repair, or reuse Breadth: number of eco-strategies undertaken by the firm (range from 0 to 8) High investment: Dummy variable that takes the value 1 if the firm investment in eco-strategies is higher than 5% of annual turnover; 0 if not |
| Control variables | |
| Size | Categorical variable 1–9 employees 9–49 employees 50–249 employees |
| Young | Dummy variable that takes a value equal to 1 if firm is less than 6-years-old; 0 if not |
| Own technical expertise | Dummy variable that takes a value equal to 1 if firm reports internal technical expertise to implement resource efficiency practices; 0 if not |
| Own finance | Dummy variable that takes a value equal to 1 if firm reports self-financed resource efficiency measures; 0 if not |
| External finance | Dummy variable that takes a value equal to 1 if firm reports external support to implement resource efficiency practices; 0 if not |
| Greenness priority | Dummy variable which takes the value 1 if firm reports that the environment is a core priority for the firm, going beyond regulatory requirements; 0 if not |
| Business opportunity | Dummy variable that takes a value equal to 1 if firm considers the creation of a competitive advantage or business opportunity as a main reason to implement resource efficiency practices; 0 if not |
| Sector | Sector-specific dummy variables. This indicates the main activity of the company: manufacturing, retail, services, and industry |
Appendix B. Correlation Matrix
Table A2.
Correlation matrix.
| 1 | 2 | 3 | 4 | 5 | 6 | 7 | 8 | 9 | 10 | 11 | 12 | 13 | 14 | 15 | 16 | 17 | 18 | 19 | 20 | 21 | 22 | 23 | |
|---|---|---|---|---|---|---|---|---|---|---|---|---|---|---|---|---|---|---|---|---|---|---|---|
| 1 | 1.00 | ||||||||||||||||||||||
| 2 | 0.48 * | 1.00 | |||||||||||||||||||||
| 3 | 0.13 * | 0.17 * | 1.00 | ||||||||||||||||||||
| 4 | 0.39 * | 0.42 * | 0.13 * | 1.00 | |||||||||||||||||||
| 5 | 0.39 * | 0.40 * | 0.17 * | 0.42 * | 1.00 | ||||||||||||||||||
| 6 | 0.18 * | 0.19 * | 0.10 * | 0.23 * | 0.26 * | 1.00 | |||||||||||||||||
| 7 | 0.20 * | 0.20 * | 0.14 * | 0.23 * | 0.29 * | 0.19 * | 1.00 | ||||||||||||||||
| 8 | 0.17 * | 0.19 * | 0.14 * | 0.25 * | 0.23 * | 0.18 * | 0.21 * | 1.00 | |||||||||||||||
| 9 | 0.07 * | 0.09 * | 0.09 * | 0.07 * | 0.06 * | 0.05 * | 0.06 * | 0.09 * | 1.00 | ||||||||||||||
| 10 | 0.65 * | 0.67 * | 0.37 * | 0.68 * | 0.70 * | 0.50 * | 0.54 * | 0.49 * | 0.12 * | 1.00 | |||||||||||||
| 11 | −0.06 * | −0.13 * | −0.06 * | −0.08 * | −0.09 * | −0.20 * | −0.06 * | −0.05 * | −0.02 * | −0.16 * | 1.00 | ||||||||||||
| 12 | 0.01 | 0.04 * | 0.01 | 0.01 | 0.02 * | 0.07 * | 0.02 * | 0.01 * | 0.012 | 0.04 * | −0.67 * | 1.00 | |||||||||||
| 13 | 0.07 * | 0.10 * | 0.05 * | 0.08 * | 0.09 * | 0.16 * | 0.04 * | 0.04 * | 0.015 | 0.14 * | −0.44 * | −0.37 * | 1.00 | ||||||||||
| 14 | −0.02 * | −0.05 * | −0.02 * | −0.02 * | −0.03 * | −0.04 * | −0.01 | −0.02 * | −0.01 | −0.04 * | 0.10 * | −0.04 * | −0.07 * | 1.00 | |||||||||
| 15 | 0.18 * | 0.27 * | 0.07 * | 0.27 * | 0.26 * | 0.15 * | 0.17 * | 0.19 * | 0.07 * | 0.34 * | −0.07 * | 0.01 * | 0.06 * | −0.03 * | 1.00 | ||||||||
| 16 | 0.24 * | 0.31 * | 0.07 * | 0.27 * | 0.25 * | 0.17 * | 0.17 * | 0.12 * | 0.08 * | 0.35 * | −0.08 * | 0.02 * | 0.07 * | −0.02 * | 0.15 * | 1.00 | |||||||
| 17 | 0.11 * | 0.14 * | 0.11 * | 0.12 * | 0.15 * | 0.13 * | 0.10 * | 0.08 * | 0.07 * | 0.20 * | −0.12 * | 0.02 * | 0.11 * | −0.01 | 0.01 * | −0.02 * | 1.00 | ||||||
| 18 | 0.21 * | 0.24 * | 0.13 * | 0.20 * | 0.25 * | 0.11 * | 0.21 * | 0.11 * | 0.04 * | 0.32 * | −0.06 * | 0.01 | 0.06 * | −0.01 | 0.16 * | 0.17 * | 0.06 * | 1.00 | |||||
| 19 | 0.10 * | 0.15 * | 0.07 * | 0.18 * | 0.14 * | 0.14 * | 0.10 * | 0.15 * | 0.06 * | 0.22 * | −0.10 * | 0.02 * | 0.08 * | −0.01 | 0.15 * | 0.11 * | 0.09 * | −0.02 * | 1.00 | ||||
| 20 | −0.02 * | −0.04 * | 0.03 * | 0.02 * | 0.02 | 0.03 * | −0.01 | 0.02 * | 0.03 * | 0.01 | −0.02 * | 0.03 * | −0.01 | 0.03 * | 0.04 * | −0.01 | 0.01 | 0.01 | 0.05 | 1.00 | |||
| 21 | 0.05 * | 0.06 * | 0.01 | 0.11 * | 0.10 * | 0.20 * | 0.06 * | 0.12 * | 0.04 * | 0.15 * | −0.15 * | 0.02 * | 0.16 * | −0.04 * | 0.10 * | 0.09 * | 0.04 * | 0.01 | 0.08 * | −0.21 * | 1.00 | ||
| 22 | 0.05 | −0.01 | −0.04 * | −0.08 * | −0.03 * | −0.03 * | −0.01 | −0.06 * | −0.07 * | −0.05 * | 0.11 * | −0.03 * | −0.10 * | −0.03 | −0.07 * | −0.02 * | −0.04 * | −0.01 | −0.04 * | −0.27 * | −0.37 * | 1.00 | |
| 23 | −0.03 * | −0.01 | −0.01 | −0.03 * | −0.05 * | −0.17 * | −0.04 * | −0.06 * | 0.01 | −0.09 * | 0.03 * | −0.01 | −0.02 * | 0.01 * | −0.04 * | −0.05 * | 0.01 | −0.01 | −0.03 * | −0.27 * | −0.37 * | −0.46 * | 1.00 |
* Significant at 5%. 1. Water reduction; 2. Energy reduction; 3. Predominant use of renewable energy; 4. Material reduction; 5. Waste reduction; 6. Sale of scrap to other firms; 7. Recycling; 8. Design of products; 9. High investment in eco-strategy; 10. Breadth; 11. Size: 1–9 employees; 12. Size 10–49 employees; 13. Size 50–249 employees; 14. Young; 15. Own technical expertise; 16. Own finance; 17. External finance; 18. Greenness priority; 19. Business opportunity; 20. Industry; 21. Manufacturing; 22. Retail; 23. Services.
Appendix C. Predicted Probabilities
Figure A1.
Adjusted predictions.

Appendix D. Robustness Checks
Table A3.
Brant test of parallel regression assumption.
| Chi2 | p > chi2 | df | Chi2 | p > chi2 | df | Chi2 | p > chi2 | df | |
|---|---|---|---|---|---|---|---|---|---|
| All | 217.72 | 0.000 | 42 | 226.30 | 0.000 | 50 | 218.79 | 0.000 | 43 |
| Eco-strategies | 0.12 | 0.724 | 1 | ||||||
| Water reduction | 1.45 | 0.229 | 1 | ||||||
| Energy reduction | 0.25 | 0.618 | 1 | ||||||
| Renewable energy | 1.45 | 0.228 | 1 | ||||||
| Material reduction | 1.07 | 0.301 | 1 | ||||||
| Waste reduction | 0.64 | 0.425 | 1 | ||||||
| Sale scrap | 1.32 | 0.251 | 1 | ||||||
| Recycling | 0.21 | 0.647 | 1 | ||||||
| Design products | 3.63 | 0.057 | 1 | ||||||
| High investment | 0.08 | 0.782 | 1 | ||||||
| Breadth | 0.93 | 0.334 | 1 | ||||||
| Breadth2 | 0.66 | 0.417 | 1 | ||||||
| Size 10–49 employee | 2.30 | 0.129 | 1 | 1.80 | 0.180 | 1 | 2.20 | 0.138 | 1 |
| Size 50–249 employee | 7.62 | 0.006 | 1 | 6.02 | 0.014 | 1 | 7.39 | 0.007 | 1 |
| Young | 1.37 | 0.243 | 1 | 1.27 | 0.259 | 1 | 1.34 | 0.247 | 1 |
| Own technical | 0.12 | 0.729 | 1 | 0.14 | 0.712 | 1 | 0.30 | 0.584 | 1 |
| Own finance | 0.01 | 0.904 | 1 | 0.00 | 0.992 | 1 | 0.01 | 0.911 | 1 |
| Greenness priority | 0.42 | 0.519 | 1 | 0.63 | 0.428 | 1 | 0.62 | 0.429 | 1 |
| Business opportunity | 7.79 | 0.005 | 1 | 7.57 | 0.006 | 1 | 7.25 | 0.007 | 1 |
| Manufacturing | 5.22 | 0.022 | 1 | 5.10 | 0.024 | 1 | 4.98 | 0.026 | 1 |
| Retail | 7.72 | 0.005 | 1 | 7.43 | 0.006 | 1 | 7.65 | 0.006 | 1 |
| Services | 1.29 | 0.255 | 1 | 1.33 | 0.249 | 1 | 1.28 | 0.257 | 1 |
| BE | 1.09 | 0.297 | 1 | 1.50 | 0.220 | 1 | 1.08 | 0.300 | 1 |
| NE | 0.13 | 0.719 | 1 | 0.00 | 0.947 | 1 | 0.14 | 0.711 | 1 |
| DE | 20.62 | 0.000 | 1 | 21.64 | 0.000 | 1 | 20.45 | 0.000 | 1 |
| IT | 2.74 | 0.098 | 1 | 3.23 | 0.072 | 1 | 2.52 | 0.112 | 1 |
| LU | 0.58 | 0.446 | 1 | 0.41 | 0.523 | 1 | 0.60 | 0.439 | 1 |
| DK | 0.60 | 0.440 | 1 | 0.77 | 0.379 | 1 | 0.59 | 0.444 | 1 |
| IE | 3.30 | 0.069 | 1 | 2.95 | 0.086 | 1 | 3.26 | 0.071 | 1 |
| GB | 3.33 | 0.068 | 1 | 3.66 | 0.056 | 1 | 3.42 | 0.064 | 1 |
| GR | 11.78 | 0.001 | 1 | 11.11 | 0.001 | 1 | 12.23 | 0.000 | 1 |
| ES | 2.43 | 0.119 | 1 | 2.31 | 0.129 | 1 | 2.54 | 0.111 | 1 |
| PT | 0.81 | 0.368 | 1 | 1.11 | 0.293 | 1 | 0.81 | 0.368 | 1 |
| FI | 4.21 | 0.040 | 1 | 5.07 | 0.024 | 1 | 4.11 | 0.043 | 1 |
| SE | 2.33 | 0.127 | 1 | 3.10 | 0.079 | 1 | 2.30 | 0.129 | 1 |
| AT | 11.31 | 0.001 | 1 | 12.61 | 0.000 | 1 | 11.31 | 0.001 | 1 |
| CY | 1.17 | 0.280 | 1 | 0.93 | 0.335 | 1 | 1.24 | 0.265 | 1 |
| CZ | 11.11 | 0.001 | 1 | 11.78 | 0.001 | 1 | 11.04 | 0.001 | 1 |
| EE | 2.40 | 0.121 | 1 | 2.53 | 0.112 | 1 | 2.06 | 0.152 | 1 |
| HU | 0.53 | 0.466 | 1 | 0.70 | 0.404 | 1 | 0.49 | 0.486 | 1 |
| LV | 0.89 | 0.344 | 1 | 0.67 | 0.414 | 1 | 0.95 | 0.329 | 1 |
| LT | 1.04 | 0.308 | 1 | 0.85 | 0.356 | 1 | 1.15 | 0.284 | 1 |
| MT | 0.06 | 0.810 | 1 | 0.11 | 0.743 | 1 | 0.06 | 0.809 | 1 |
| PL | 5.15 | 0.023 | 1 | 5.77 | 0.016 | 1 | 5.02 | 0.025 | 1 |
| SK | 5.84 | 0.016 | 1 | 6.19 | 0.013 | 1 | 5.87 | 0.015 | 1 |
| SI | 2.00 | 0.158 | 1 | 2.35 | 0.126 | 1 | 1.82 | 0.178 | 1 |
| BG | 1.60 | 0.206 | 1 | 1.81 | 0.178 | 1 | 1.45 | 0.229 | 1 |
| RO | 4.19 | 0.041 | 1 | 4.08 | 0.043 | 1 | 4.43 | 0.035 | 1 |
| CR | 0.05 | 0.824 | 1 | 0.02 | 0.893 | 1 | 0.06 | 0.804 | 1 |
A significant test statistic provides evidence that the parallel regression assumption has been violated.
References
- Horbach, J. Determinants of environmental innovation—New evidence from German panel data sources. Res. Policy 2008, 37, 163–173. [Google Scholar] [CrossRef]
- Bossle, M.B.; Dutra de Barcellos, M.; Vieira, L.M.; Sauvée, L. The drivers for adoption of eco-innovation. J. Clean. Prod. 2016, 113, 861–872. [Google Scholar] [CrossRef]
- Barbieri, N.; Ghisetti, C.; Gilli, M.; Marin, G.; Nicolli, F. A Survey of the Literature on Environmental Innovation Based on Main Path Analysis. J. Econ. Surv. 2016, 30, 596–623. [Google Scholar] [CrossRef]
- Porter, M.E. America’s Green Strategy. Sci. Am. 1991, 264, 168. [Google Scholar] [CrossRef]
- Porter, M.E.; Linde, C. van der Toward a New Conception of the Environment-Competitiveness Relationship. J. Econ. Perspect. 1995, 9, 97–118. [Google Scholar] [CrossRef]
- Ambec, S.; Cohen, M.A.; Elgie, S.; Lanoie, P. The Porter Hypothesis at 20: Can Environmental Regulation Enhance Innovation and Competitiveness? Rev. Environ. Econ. Policy 2013, 7, 2–22. [Google Scholar] [CrossRef]
- Dixon-Fowler, H.R.; Slater, D.J.; Johnson, J.L.; Ellstrand, A.E.; Romi, A.M. Beyond “Does it Pay to be Green?” A Meta-Analysis of Moderators of the CEP-CFP Relationship. J. Bus. Ethics 2013, 112, 353–366. [Google Scholar] [CrossRef]
- Albertini, E. Does Environmental Management Improve Financial Performance? A Meta-Analytical Review. Org. Environ. 2013, 26, 431–457. [Google Scholar] [CrossRef]
- Aragón-Correa, J.A.; Hurtado-Torres, N.; Sharma, S.; García-Morales, V.J. Environmental strategy and performance in small firms: A resource-based perspective. J. Environ. Manag. 2008, 86, 88–103. [Google Scholar] [CrossRef] [PubMed]
- Jo, J.H.; Roh, T.W.; Kim, S.; Youn, Y.C.; Park, M.S.; Han, K.J.; Jang, E.K. Eco-Innovation for sustainability: Evidence from 49 countries in Asia and Europe. Sustainability 2015, 7, 16820–16835. [Google Scholar] [CrossRef]
- Ghisetti, C.; Mancinelli, S.; Mazzanti, M.; Zoli, M. Financial barriers and environmental innovations: Evidence from EU manufacturing firms. Clim. Policy 2016, 3062, 1–17. [Google Scholar] [CrossRef]
- Lanoie, P.; Laurent-Lucchetti, J.; Johnstone, N.; Ambec, S. Environmental Policy, Innovation and Performance: New Insights on the Porter Hypothesis. J. Econ. Manag. Strategy 2011, 20, 803–842. [Google Scholar] [CrossRef]
- Colombelli, A.; Krafft, J.; Quatraro, F. Eco-Innovation and Firm Growth: Do Green Gazelles Run Faster? Microeconometric Evidence from a Sample of European Firms; EconStor: Hamburg, Germany, 2015; Volume 12. [Google Scholar]
- Riillo, C.A.F. Beyond the question “Does it pay to be green?”: How much green? and when? J. Clean. Prod. 2017, 141, 626–640. [Google Scholar] [CrossRef]
- Marin, G.; Lotti, F. Productivity effects of eco-innovations using data on eco-patents. Ind. Corp. Chang. 2017, 26, 125–148. [Google Scholar] [CrossRef]
- Ghisetti, C.; Rennings, K. Environmental innovations and profitability: How does it pay to be green? An empirical analysis on the German innovation survey. J. Clean. Prod. 2014, 75, 106–117. [Google Scholar] [CrossRef]
- Rexhäuser, S.; Rammer, C. Environmental Innovations and Firm Profitability: Unmasking the Porter Hypothesis. Environ. Resour. Econ. 2014, 57, 145–167. [Google Scholar] [CrossRef]
- Doran, J.; Ryan, G. Regulation and firm perception, eco-innovation and firm performance. Eur. J. Innov. Manag. 2012, 15, 421–441. [Google Scholar] [CrossRef] [Green Version]
- Van Leeuwen, G.; Mohnen, P. Revisiting the Porter Hypothesis: An emperical analysis of green innovation for the Netherlands. Econ. Innov. New Technol. 2017, 26, 63–77. [Google Scholar] [CrossRef]
- Hojnik, J.; Ruzzier, M. The driving forces of process eco-innovation and its impact on performance: Insights from Slovenia. J. Clean. Prod. 2016, 133, 812–825. [Google Scholar] [CrossRef]
- Wagner, M.; Van Phu, N.; Azomahou, T.; Wehrmeyer, W. The relationship between the environmental and economic performance of firms: An empirical analysis of the European paper industry. Corp. Soc. Responsib. Environ. Manag. 2002, 146, 133–146. [Google Scholar] [CrossRef]
- Ryszko, A. Proactive environmental strategy, technological eco-innovation and firm performance-case of Poland. Sustainability 2016, 8, 156. [Google Scholar] [CrossRef]
- Przychodzen, J.; Przychodzen, W. Relationships between eco-innovation and financial performance—Evidence from publicly traded companies in Poland and Hungary. J. Clean. Prod. 2015, 90, 253–263. [Google Scholar] [CrossRef]
- Palmer, K.; Oates, W.E.; Portney, P.R. Tightening Environmental Standards: The Benefit-Cost or the No-Cost Paradigm? J. Econ. Perspect. 1995, 9, 119–132. [Google Scholar] [CrossRef]
- Walley, N.; Whitehead, B. It’s not easy being green. Harv. Bus. Rev. 1994, 72, 46–52. [Google Scholar]
- Ambec, S.; Lanoie, P. Does it pay to be green? A systematic overview. Acad. Manag. Perspect. 2008, 22, 45–62. [Google Scholar] [CrossRef]
- Cainelli, G.; Mazzanti, M.; Zoboli, R. Environmentally oriented innovative strategies and firm performance in services. Micro-evidence from Italy. Int. Rev. Appl. Econ. 2011, 25, 61–85. [Google Scholar] [CrossRef]
- Atienza-Sahuquillo, C.; Barba-Sánchez, V. Design of a measurement model for environmental performance: Application to the food sector. Environ. Eng. Manag. J. 2014, 13, 1463–1472. [Google Scholar]
- Soltmann, C.; Stucki, T.; Woerter, M. The Impact of Environmentally Friendly Innovations on Value Added. Environ. Resour. Econo. 2015, 62, 457–479. [Google Scholar] [CrossRef]
- Antonioli, D.; Borghesi, S.; Mazzanti, M. Are regional systems greening the economy? Local spillovers, green innovations and firms’ economic performances. Econ. Innov. New Technol. 2016, 25, 692–713. [Google Scholar] [CrossRef]
- Doran, J.; Ryan, G. The Importance of the Diverse Drivers and Types of Environmental Innovation for Firm Performance. Bus. Strategy Environ. 2016, 25, 102–119. [Google Scholar] [CrossRef]
- Miroshnychenko, I.; Barontini, R.; Testa, F. Green practices and financial performance: A global outlook. J. Clean. Prod. 2017, 147, 340–351. [Google Scholar] [CrossRef]
- Earnhart, D.; Lizal, L. Effect of Pollution Control on Corporate Financial Performance in a Transition Economy. Eur. Environ. J. 2007, 266, 247–266. [Google Scholar] [CrossRef]
- Trumpp, C.; Guenther, T. Too Little or too much? Exploring U-shaped Relationships between Corporate Environmental Performance and Corporate Financial Performance. Bus. Strategy Environ. 2017, 26, 49–68. [Google Scholar] [CrossRef]
- Wagner, M.; Wehrmeyer, W. The relationship of environmental and economic performance at the firm level: A review of empirical studies in Europe and methodological comments. Eur. Environ. 2002, 12, 149–159. [Google Scholar] [CrossRef]
- Kim, K. Proactive versus Reactive Corporate Environmental Practices and Environmental Performance. Sustainability 2018, 10, 97. [Google Scholar] [CrossRef]
- Coad, A. The Growth of Firms: A Survey of Theories and Empirical Evidence; Edward Elgar: Cheltenham, UK, 2009. [Google Scholar]
- Antonioli, D.; Mazzanti, M. Techno-organisational strategies, environmental innovations and economic performances. Micro-evidence from an SME-based industrial district. J. Innov. Econ. 2009, 3, 145. [Google Scholar] [CrossRef]
- Leiponen, A.; Helfat, C.E. Innovation objectives, knowledge sources, and the benefits of breadth. Strateg. Manag. J. 2010, 31, 224–236. [Google Scholar] [CrossRef]
- Tavassoli, S.; Karlsson, C. Innovation strategies and firm performance: Simple or complex strategies? Econ. Innov. New Technol. 2016, 25, 631–650. [Google Scholar] [CrossRef]
- Quintana-García, C.; Benavides-Velasco, C.A. Innovative competence, exploration and exploitation: The influence of technological diversification. Res. Policy 2008, 37, 492–507. [Google Scholar] [CrossRef]
- Marin, G.; Marzucchi, A.; Zoboli, R. SMEs and barriers to Eco-innovation in the EU: Exploring different firm profiles. J. Evolut. Econ. 2015, 25, 671–705. [Google Scholar] [CrossRef]
- Hoogendoorn, B.; Guerra, D.; van der Zwan, P. What drives environmental practices of SMEs? Small Bus. Econ. 2015, 44, 759–781. [Google Scholar] [CrossRef]
- Beltrán-Esteve, M.; Picazo-Tadeo, A.J. Assessing environmental performance in the European Union: Eco-innovation versus catching-up. Energy Policy 2017, 104, 240–252. [Google Scholar] [CrossRef]
- Horbach, J. Empirical determinants of eco-innovation in European countries using the community innovation survey. Environ. Innov. Soc. Trans. 2016, 19, 1–14. [Google Scholar] [CrossRef]
- Davidescu, A.A.M.; Vass Paul, A.M.; Gogonea, R.M.; Zaharia, M. Evaluating Romanian eco-innovation performances in European context. Sustainability 2015, 7, 12723–12757. [Google Scholar] [CrossRef]
- Hölzl, W. Is the R&D behaviour of fast-growing SMEs different? Evidence from CIS III data for 16 countries. Small Bus. Econ. 2009, 33, 59–75. [Google Scholar] [CrossRef]
- Navaretti, G.B.; Castellani, D.; Pieri, F. Age and firm growth: Evidence from three European countries. Small Bus. Econ. 2014, 43, 823–837. [Google Scholar] [CrossRef]
- Long, J.S.; Freese, J. Regression Models for Categorical Dependent Variables Using Stata; StataCorp LP: College Station, TX, USA, 2006; ISBN 1597180114. [Google Scholar]
- Brant, R. Assessing Proportionality in the Proportional Odds Model for Ordinal Logistic Regression. Biometrics 1990, 46, 1171–1178. [Google Scholar] [CrossRef] [PubMed]
Figure 1.
Framework of analysis (own elaboration based on Lanoie et al. [12]).
Figure 1.
Framework of analysis (own elaboration based on Lanoie et al. [12]).

Table 1.
Summary of the related literature.
| Research Themes | Studies | Sample | Main Findings |
|---|---|---|---|
| Eco-strategies and productivity | Riillo [14] Turnover per employee | 890 Italian firms 2007 survey of SMEs Observatory | Green practices are U-shaped related to performance |
| Soltmann et al. [29] Value added | 12 OECD countries Sector level (patents) | ||
| Marin and Lotti [15] Real value added per employee | 11,938 Italian manufacturing firms (Survey on Manufacturing Firm Unicredit) (patents) | Eco-innovations exhibit a lower return relative to other innovations | |
| Leeuwen and Mohnen [19] Gross output per employee | 5989 Dutch firms The Survey on Environmental Costs of Firms, CIS survey, and The Production Statistics survey (PS) | Resource-saving eco-innovations increase total factor productivity effect (TFP), whereas end-of-pipe eco-innovations tend to reduce TFP | |
| Doran and Ryan [18] Turnover per employee | 2181 Irish firms CIS 2008 | Positive and significant effect of eco-innovation on firm performance | |
| Antonioli et al. [30] Value added per employee Total labour cost | 555 Italian firms (own questionnaire) | Some firms’ productivity performances are positively related to eco-innovation +: revenue over total labour cost n.s.: value added per employee | |
| Doran and Ryan [31] Turnover per employee | 2181 Irish firms CIS 2008 | Only two of the nine types of eco-innovation positively impact firm performance (reduced CO ‘footprint’ and recycled waste, water, or materials) | |
| Eco-strategies and growth | Cainelli et al. [27] Turnover growth | 773 Italian service firms CIS II and System of the Enterprise Account (SEA) | Negative effect of eco-innovation on turonver growth, and not significant or even negative effect on labour productivity growth |
| Colombelli et al. [13] Turnover growth | 456,240 firms 6 European countries ORBIS and OECD RegPat Database (patents) | Firms producing eco-innovations are characterized by higher growth rates than those generating generic innovations | |
| Hojnik and Ruzzier [20] Turnover growth | 223 Slovenian firms (own questionnaire) | Positive and significant effect of eco-innovation and firm growth | |
| Eco-strategies and finance performance | Miroshnychenko et al. [32] Tobin’s q and return on equity (ROE) | 3490 publicly-traded companies from 58 countries Thomson Reuters Dataset | Internal green practices (pollution prevention and green supply chain management) are the major eco-drivers of financial performance |
| Przychodzen and Przychodzen [23] ROE, return on assets (ROA) | 439 Polish and Hungarian publicly traded firms Infinancials Database | Green research and development is positively related to financial performance | |
| Ghisetti and Rennings [16] Operating margins | 1063 German firms Mannheim Innovation Panel | Reduction in the use of energy or materials per unit of output positively affects firms’ competitiveness. Contrarily, externality reducing innovations hamper firms’ competitiveness | |
| Rexhäuser and Rammer [17] Operating margins | 3618 German firms Mannheim Innovation Panel | ||
| Wagner et al. [21] Return on capital empoyed (ROCE), return on sales (ROS), ROE | 37 firms from Germany, Italy, The Netherlands, and United Kingdom (own questionnaire) | Negative or not significant relationship | |
| Earnhart and Lizal [33] Operating profits | 436 Czech Republic firms Private data vendor Aspekt | Better pollution control neither improves nor undermines financial success | |
| Trumpp and Guenther [34] ROA and total share return (TSR) | 696 manufacturing and services firms CDP Global 500, S&P 500, and FTSE 350 | U-shaped relationship between corporate enviromental peformance and profitability |
Table 2.
Distribution of the sample by clusters, sectors, and firm size.
| EU15 Members | New EU Members | ||||
|---|---|---|---|---|---|
| Country | Firms | Percent | Country | Freq. | Percent |
| FR—France | 463 | 4.08 | CY—Cyprus | 184 | 1.62 |
| BE—Belgium | 407 | 3.59 | CZ—Czech Republic | 436 | 3.85 |
| NE—The Netherlands | 428 | 3.78 | EE—Estonia | 452 | 3.99 |
| DE—Germany | 358 | 3.16 | HU—Hungary | 423 | 3.73 |
| IT—Italy | 397 | 3.50 | LV—Latvia | 481 | 4.24 |
| LU—Luxembourg | 176 | 1.55 | LT—Lithuania | 466 | 4.11 |
| DK—Denmark | 413 | 3.64 | MT—Malta | 164 | 1.45 |
| IE—Ireland | 429 | 3.78 | PL—Poland | 456 | 4.02 |
| GB—United Kingdom | 375 | 3.31 | SK—Slovakia | 429 | 3.78 |
| GR—Greece | 452 | 3.99 | SI—Slovenia | 471 | 4.15 |
| ES—Spain | 441 | 3.89 | BG—Bulgaria | 411 | 3.63 |
| PT—Portugal | 461 | 4.07 | RO—Romania | 426 | 3.76 |
| FI—Finland | 452 | 3.99 | HR—Croatia | 433 | 3.82 |
| SE—Sweden | 457 | 4.03 | |||
| AT—Austria | 395 | 3.48 | |||
| Total EU15 | 6104 | 53.85 | Total new members | 5232 | 46.15 |
| Firms by sectors | |||||
| Manufacturing (NACE C) | 1274 | 20.87 | Manufacturing | 1286 | 24.58 |
| Retail (NACE G) | 1921 | 31.47 | Retail | 1701 | 32.51 |
| Services (NACE H/I/J/K/L/M/N) | 2134 | 34.96 | Services | 1488 | 28.44 |
| Industry (NACE B/D/E/F) | 775 | 12.70 | Industry | 757 | 14.47 |
| Firms by employees | |||||
| 1 to 9 | 2681 | 43.92 | 1 to 9 | 2346 | 44.84 |
| 10 to 49 | 2228 | 36.50 | 10 to 49 | 1864 | 35.63 |
| 50 to 249 | 1195 | 19.57 | 50 to 249 | 1022 | 19.54 |
Source: Flash Eurobarometer Survey #426, European Commission.
Table 3.
Descriptive statistics by country clusters (mean values).
| Total Sample | EU15 | New Members | Mean Differences | |
|---|---|---|---|---|
| Dependent variable: Turnover growth (% firms) | ||||
| Decrease | 0.2694 | 0.2622 | 0.2779 | 0.0156 |
| (0.4437) | (0.4399) | (0.4480) | (0.0083) | |
| Remain | 0.3167 | 0.3078 | 0.3272 | 0.0193 *** |
| (0.4652) | (0.4616) | (0.4692) | (0.0087) | |
| Increase | 0.4137 | 0.4298 | 0.3948 | −0.0350 *** |
| (0.4925) | (0.4950) | (0.4888) | (0.0092) | |
| Independent variables | ||||
| Resource efficiency eco-strategies (% firms) | 0.8594 | 0.8969 | 0.8157 | −0.0812 *** |
| (0.3475) | (0.3040) | (0.3877) | (0.0065) | |
| Water reduction | 0.4408 | 0.4441 | 0.4369 | −0.0072 |
| (0.4965) | (0.4969) | (0.4960) | (0.0093) | |
| Energy reduction | 0.6289 | 0.6584 | 0.5946 | −0.0638 *** |
| (0.4831) | (0.4742) | (0.4910) | (0.0090) | |
| Predominant use of renewable energy | 0.1293 | 0.1671 | 0.0852 | −0.0818 *** |
| (0.3355) | (0.3730) | (0.2792) | (0.0062) | |
| Material reduction | 0.5578 | 0.5865 | 0.5244 | −0.0620 *** |
| (0.4966) | (0.4925) | (0.4994) | (0.0093) | |
| Waste reduction | 0.5671 | 0.6317 | 0.4917 | −0.1399 *** |
| (0.4954) | (0.4823) | (0.4999) | (0.0092) | |
| Sale of scrap to other firms | 0.3071 | 0.3247 | 0.2866 | −0.0380 *** |
| (0.4613) | (0.4683) | (0.4522) | (0.0086) | |
| Recycling | 0.3782 | 0.4580 | 0.2851 | −0.1728 *** |
| (0.4849) | (0.4982) | (0.4515) | (0.0089) | |
| Design of products | 0.2238 | 0.2644 | 0.1764 | −0.0882 *** |
| (0.4168) | (0.4410) | (0.3812) | (0.0078) | |
| Breadth of strategies (number of strategies) | 3.2332 | 3.5350 | 2.8813 | −0.6537 *** |
| (2.1706) | (2.1431) | 2.1484) | (0.0404) | |
| Resource efficient investment (% firms) | ||||
| Less than 1% of turnover | 0.4959 | 0.4792 | 0.5175 | −0.0076 |
| (0.4522) | (0.4517) | (0.4528) | (0.0093) | |
| 1–5% of turnover | 0.4008 | 0.4193 | 0.3769 | −0.0423 *** |
| (0.4900) | (0.4934) | (0.4846) | (0.0999) | |
| 6–10% of turnover | 0.0696 | 0.0697 | 0.0695 | −0.0001 |
| (0.2546) | (0.2547) | (0.2544) | (0.00519) | |
| 11–30% of turnover | 0.0238 | 0.0233 | 0.0243 | 0.0009 |
| (0.1524) | (0.1511) | (0.1542) | (0.0031) | |
| More than 30% of turnover | 0.0096 | 0.0082 | 0.0114 | 0.0032 |
| (0.0977) | (0.0902) | (0.1065) | (0.0019) | |
| Control variables | ||||
| Size (% firms) | ||||
| 1–9 employees | 0.4434 | 0.4392 | 0.4483 | 0.0091 |
| (0.4968) | (0.4963) | (0.4973) | (0.0093) | |
| 10–49 employees | 0.3609 | 0.3650 | 0.3562 | −0.00873 |
| (0.4803) | (0.4814) | (0.4789) | (0.0090) | |
| 50–249 employees | 0.1955 | 0.1957 | 0.1953 | −0.0004 |
| (0.3966) | (0.3968) | (0.3964) | (0.0074) | |
| Young | 0.0926 | 0.0817 | 0.1047 | 0.0229 *** |
| (0.2895) | (0.2740) | (0.3062) | (0.0054) | |
| Own technical expertise | 0.4972 | 0.5160 | 0.4753 | −0.0407 *** |
| (0.5000) | (0.4997) | (0.4994) | (0.0094) | |
| Own finance | 0.5832 | 0.5647 | 0.6049 | 0.0402 *** |
| (0.4930) | (0.4958) | (0.4889) | (0.0092) | |
| External finance | 0.1826 | 0.2362 | 0.1202 | −0.1160 *** |
| (0.3864) | (0.4248) | (0.3252) | (0.0071) | |
| Greenness priority | 0.3517 | 0.3668 | 0.3340 | −0.0321 *** |
| (0.4775) | (0.4819) | (0.4717) | (0.0089) | |
| Business opportunity | 0.2027 | 0.2239 | 0.1779 | −0.0460 *** |
| (0.4020) | (0.4169) | (0.3825) | (0.0075) | |
| Sector dummies (% firms) | ||||
| Manufacturing | 0.2258 | 0.2087 | 0.2457 | 0.0370 *** |
| (0.4181) | (0.4064) | (0.4305) | (0.0078) | |
| Retail | 0.3195 | 0.3147 | 0.3251 | 0.1043 |
| (0.4663) | (0.4644) | (0.4684) | (0.0087) | |
| Services | 0.3195 | 0.3496 | 0.2844 | −0.0652 *** |
| (0.4663) | (0.4768) | (0.4511) | (0.0087) | |
| Industry | 0.1351 | 0.1269 | 0.1446 | 0.0177 |
| (0.3418) | (0.3329) | (0.3518) | (0.0064) | |
| Observations | 11,336 | 6104 | 5232 | |
Source: Flash Eurobarometer Survey #426, European Commission. Note: Standard deviation parenthesis. Comparison of the two samples by the statistical t-test. *** Significant at 1%.
Table 4.
Ordered logit regression: whole sample.
| (I) | (II) | (III) | (IV) | (V) | |
|---|---|---|---|---|---|
| Eco-strategy | −0.171 * | ||||
| (0.0803) | |||||
| Types | |||||
| Water reduction | −0.171 ** | ||||
| (0.0545) | |||||
| Energy reduction | −0.198 *** | ||||
| (0.0484) | |||||
| Predominant use of renewable energy | 0.221 *** | ||||
| (0.0440) | |||||
| Material reduction | 0.0155 | ||||
| (0.0468) | |||||
| Waste reduction | 0.0228 | ||||
| (0.0410) | |||||
| Sale of scrap to other firms | −0.0108 | ||||
| (0.0525) | |||||
| Recycling | 0.0810 * | ||||
| (0.0321) | |||||
| Design of products, | 0.148 *** | ||||
| (0.0334) | |||||
| High investment | 0.194 ** | ||||
| (0.0680) | |||||
| Breadth | −0.0133 | −0.116 * | |||
| (0.0150) | (0.0480) | ||||
| Breadth2 | 0.0143 * | ||||
| (0.0057) | |||||
| Control variables | |||||
| Size: ref. size 1_9 | |||||
| size_10_49 | 0.525 *** | 0.532 *** | 0.522 *** | 0.524 *** | 0.525 *** |
| (0.0444) | (0.0416) | (0.0440) | (0.0445) | (0.0440) | |
| size_50_249 | 0.872 *** | 0.887 *** | 0.872 *** | 0.874 *** | 0.870 *** |
| (0.0594) | (0.0574) | (0.0587) | (0.0601) | (0.0590) | |
| Young | 0.965 *** | 0.962 *** | 0.967 *** | 0.965 *** | 0.964 *** |
| (0.0658) | (0.0673) | (0.0654) | (0.0662) | (0.0662) | |
| Own technical expertise | 0.0866 * | 0.0717 * | 0.0464 | 0.0645 | 0.0899 * |
| (0.0361) | (0.0320) | (0.0326) | (0.0333) | (0.0355) | |
| Own finance | 0.139 ** | 0.135 *** | 0.0824 * | 0.104 ** | 0.146 *** |
| (0.0439) | (0.0366) | (0.0375) | (0.0366) | (0.0429) | |
| External finance | 0.205 *** | 0.198 *** | 0.171 ** | 0.192 *** | 0.207 *** |
| (0.0556) | (0.0574) | (0.0537) | (0.0582) | (0.0591) | |
| Greenness priority | 0.148 *** | 0.146 *** | 0.126 *** | 0.141 *** | 0.156 *** |
| (0.0337) | (0.0354) | (0.0323) | (0.0362) | (0.0371) | |
| Business opportunity | 0.218 *** | 0.199 *** | 0.199 *** | 0.213 *** | 0.223 *** |
| (0.0432) | (0.0468) | (0.0420) | (0.0453) | (0.0470) | |
| Sector: ref. Industry | |||||
| Manufacturing | 0.161 * | 0.178 ** | 0.161 * | 0.163 * | 0.163 * |
| (0.0679) | (0.0686) | (0.0675) | (0.0683) | (0.0684) | |
| Retail | 0.192 ** | 0.236 *** | 0.202 *** | 0.192 ** | 0.194 ** |
| (0.0605) | (0.0609) | (0.0605) | (0.0608) | (0.0603) | |
| Services | 0.300 *** | 0.343 *** | 0.308 *** | 0.303 *** | 0.304 *** |
| (0.0651) | (0.0645) | (0.0652) | (0.0654) | (0.0655) | |
| Constant cut1 | −0.0982 | −0.0524 | −0.00637 | −0.0301 | −0.105 |
| (0.0845) | (0.0804) | (0.0799) | (0.0813) | (0.0861) | |
| Constant cut2 | 1.355 *** | 1.408 *** | 1.447 *** | 1.423 *** | 1.349 *** |
| (0.0801) | (0.0795) | (0.0813) | (0.0819) | (0.0829) | |
| Country dummies | YES | YES | YES | YES | YES |
| Wald test country dummies | 10,478 *** | 20,840 *** | 8894 *** | 9222 *** | 9454 *** |
| Pseudo R2 | 0.0447 | 0.0475 | 0.0449 | 0.0446 | 0.0445 |
| Observations | 11,336 | 11,336 | 11,336 | 11,336 | 11,336 |
Clustered standard errors by country (28 clusters). *, **, and *** correspond to significance levels of 1%, 5%, and 10%, respectively. Dependent variable: annual turnover growth (1) Decreased, (2) Remained unchanged, (3) Increased.
Table 5.
Ordered logit regression: EU15 members.
| (I) | (II) | (III) | (IV) | (V) | |
|---|---|---|---|---|---|
| Eco-strategy | −0.158 | ||||
| (0.110) | |||||
| Types | |||||
| Water reduction | −0.0968 | ||||
| (0.0737) | |||||
| Energy reduction | −0.152 ** | ||||
| (0.0537) | |||||
| Predominant use of renewable energy | 0.166 ** | ||||
| (0.0520) | |||||
| Material reduction | 0.0177 | ||||
| (0.0583) | |||||
| Waste reduction | 0.0349 | ||||
| (0.0529) | |||||
| Sale of scrap to other firms | −0.0162 | ||||
| (0.0734) | |||||
| Recycling | 0.0908 | ||||
| (0.0500) | |||||
| Design of products | 0.170 *** | ||||
| (0.0341) | 0.100 | ||||
| High investment | (0.0956) | ||||
| 0.0095 | −0.0905 | ||||
| Breadth | (0.0121) | (0.0611) | |||
| 0.0137 | |||||
| Breadth2 | (0.0078) | ||||
| (0.0057) | |||||
| Control variables | |||||
| Size: ref. size 1_9 | |||||
| size_10_49 | 0.546 *** | 0.549 *** | 0.546 *** | 0.542 *** | 0.543 *** |
| (0.0655) | (0.0612) | (0.0654) | (0.0653) | (0.0649) | |
| size_50_249 | 0.774 *** | 0.783 *** | 0.774 *** | 0.770 *** | 0.765 *** |
| (0.0899) | (0.0824) | (0.0900) | (0.0900) | (0.0883) | |
| Young | 1.032 *** | 1.037 *** | 1.032 *** | 1.033 *** | 1.034 *** |
| (0.0910) | (0.0921) | (0.0906) | (0.0901) | (0.0909) | |
| Own technical expertise | 0.134 * | 0.0960 * | 0.104 * | 0.0989 | 0.121 * |
| (0.0549) | (0.0478) | (0.0463) | (0.0506) | (0.0547) | |
| Own finance | 0.149 * | 0.124 * | 0.113 * | 0.107 | 0.137 * |
| (0.0624) | (0.0573) | (0.0543) | (0.0567) | (0.0648) | |
| External finance | 0.129 | 0.106 | 0.104 | 0.100 | 0.114 |
| (0.0690) | (0.0662) | (0.0682) | (0.0680) | (0.0688) | |
| Greenness priority | 0.184 *** | 0.159 *** | 0.166 *** | 0.158 *** | 0.168 *** |
| (0.0336) | (0.0324) | (0.0342) | (0.0327) | (0.0327) | |
| Business opportunity | 0.207 *** | 0.174 ** | 0.192 ** | 0.188 ** | 0.198 ** |
| (0.0602) | (0.0635) | (0.0588) | (0.0608) | (0.0623) | |
| Sector: ref. Industry | |||||
| Manufacturing | 0.148 | 0.154 | 0.149 | 0.146 | 0.147 |
| (0.101) | (0.0991) | (0.101) | (0.101) | (0.102) | |
| Retail | 0.240 ** | 0.273 *** | 0.247 ** | 0.244 ** | 0.250 ** |
| (0.0785) | (0.0804) | (0.0792) | (0.0793) | (0.0780) | |
| Services | 0.362 *** | 0.397 *** | 0.370 *** | 0.373 *** | 0.376 *** |
| (0.0818) | (0.0821) | (0.0806) | (0.0827) | (0.0817) | |
| Constant cut1 | −0.509 *** | −0.390 *** | −0.404 *** | −0.391 *** | −0.481 *** |
| (0.126) | (0.114) | (0.115) | (0.114) | (0.113) | |
| Constant cut2 | 0.922 *** | 1.046 *** | 1.027 *** | 1.040 *** | 0.950 *** |
| (0.105) | (0.108) | (0.106) | (0.105) | (0.101) | |
| Country dummies | YES | YES | YES | YES | YES |
| Wald test country dummies | 41,910 *** | 33,690 *** | 1.4 × 10⁵ *** | 1. × 105 *** | 24,925.20 *** |
| Pseudo R2 | 0.0486 | 0.0504 | 0.0485 | 0.0484 | 0.0489 |
| Observations | 6104 | 6104 | 6104 | 6104 | 6104 |
Clustered standard errors by country (15 clusters). *, **, and *** correspond to significance levels of 1%, 5%, and 10%, respectively. Dependent variable: annual turnover growth (1) Decreased, (2) Remained unchanged, (3) Increased.
Table 6.
Ordered logit regression: new EU members.
| (I) | (II) | (III) | (IV) | (V) | |
|---|---|---|---|---|---|
| Eco-strategy | −0.170 | ||||
| (0.117) | |||||
| Types | |||||
| Water reduction | −0.271 *** | ||||
| (0.0744) | |||||
| Energy reduction | −0.236 ** | ||||
| (0.0799) | |||||
| Predominant use of renewable energy | 0.323 *** | ||||
| (0.0763) | |||||
| Material reduction | 0.0111 | ||||
| (0.0777) | |||||
| Waste reduction | 0.00940 | ||||
| (0.0614) | |||||
| Sale of scrap to other firms | −0.00211 | ||||
| (0.0789) | |||||
| Recycling | 0.0501 | ||||
| (0.0378) | |||||
| Design of products, | 0.110 | ||||
| (0.0680) | 0.305 ** | ||||
| High investment | (0.0929) | ||||
| −0.0433 | −0.140 * | ||||
| Breadth | (0.0292) | (0.0708) | |||
| 0.0136 | |||||
| Breadth2 | (0.0079) | ||||
| Control variables | |||||
| Size: ref. size 1_9 | |||||
| size_10_49 | 0.499 *** | 0.514 *** | 0.491 *** | 0.507 *** | 0.507 *** |
| (0.0620) | (0.0557) | (0.0598) | (0.0625) | (0.0613) | |
| size_50_249 | 0.968 *** | 0.997 *** | 0.968 *** | 0.991 *** | 0.986 *** |
| (0.0726) | (0.0752) | (0.0705) | (0.0735) | (0.0718) | |
| Young | 0.911 *** | 0.898 *** | 0.916 *** | 0.912 *** | 0.910 *** |
| (0.0860) | (0.0892) | (0.0846) | (0.0884) | (0.0876) | |
| Own technical expertise | 0.0307 | 0.0495 | −0.0171 | 0.0300 | 0.0566 |
| (0.0386) | (0.0415) | (0.0416) | (0.0412) | (0.0394) | |
| Own finance | 0.125 * | 0.163 *** | 0.0471 | 0.117 ** | 0.166 *** |
| (0.0581) | (0.0418) | (0.0488) | (0.0443) | (0.0473) | |
| External finance | 0.358 *** | 0.381 *** | 0.314 *** | 0.367 *** | 0.383 *** |
| (0.0827) | (0.0874) | (0.0758) | (0.0901) | (0.0927) | |
| Greenness priority | 0.0975 | 0.124 | 0.0752 | 0.116 | 0.133 |
| (0.0599) | (0.0678) | (0.0536) | (0.0691) | (0.0726) | |
| Business opportunity | 0.232 *** | 0.235 ** | 0.208 *** | 0.250 *** | 0.258 *** |
| (0.0613) | (0.0729) | (0.0597) | (0.0713) | (0.0737) | |
| Sector: ref. Industry | |||||
| Manufacturing | 0.499 *** | 0.514 *** | 0.491 *** | 0.507 *** | 0.507 *** |
| (0.0620) | (0.0557) | (0.0598) | (0.0625) | (0.0613) | |
| Retail | 0.968 *** | 0.997 *** | 0.968 *** | 0.991 *** | 0.986 *** |
| (0.0726) | (0.0752) | (0.0705) | (0.0735) | (0.0718) | |
| Services | 0.911 *** | 0.898 *** | 0.916 *** | 0.912 *** | 0.910 *** |
| (0.0860) | (0.0892) | (0.0846) | (0.0884) | (0.0876) | |
| Constant cut1 | −0.202 | −0.159 | −0.125 | −0.174 | −0.229 |
| (0.107) | (0.0924) | (0.0958) | (0.0935) | (0.117) | |
| Constant cut2 | 1.281 *** | 1.335 *** | 1.359 *** | 1.309 *** | 1.255 *** |
| (0.113) | (0.102) | (0.112) | (0.107) | (0.119) | |
| Country dummies | YES | YES | YES | YES | YES |
| Wald test country dummies | 3656 *** | 35,196 *** | 5345 *** | 9303 *** | 9685 *** |
| Pseudo R2 | 0.0409 | 0.0457 | 0.0415 | 0.0413 | 0.0417 |
| Observations | 5232 | 5232 | 5232 | 5232 | 5232 |
Clustered standard errors by country (13 clusters). *, **, and *** correspond to significance levels of 1%, 5%, and 10%, respectively. Dependent variable: annual turnover growth (1) Decreased, (2) Remained unchanged, (3) Increased.
© 2018 by the authors. Licensee MDPI, Basel, Switzerland. This article is an open access article distributed under the terms and conditions of the Creative Commons Attribution (CC BY) license (http://creativecommons.org/licenses/by/4.0/).
Share and Cite
MDPI and ACS Style
Jové-Llopis, E.; Segarra-Blasco, A. Eco-Efficiency Actions and Firm Growth in European SMEs. Sustainability 2018, 10, 281. https://doi.org/10.3390/su10010281
AMA Style
Jové-Llopis E, Segarra-Blasco A. Eco-Efficiency Actions and Firm Growth in European SMEs. Sustainability. 2018; 10(1):281. https://doi.org/10.3390/su10010281
Chicago/Turabian StyleJové-Llopis, Elisenda, and Agustí Segarra-Blasco. 2018. "Eco-Efficiency Actions and Firm Growth in European SMEs" Sustainability 10, no. 1: 281. https://doi.org/10.3390/su10010281
Note that from the first issue of 2016, this journal uses article numbers instead of page numbers. See further details here.