An Early Warning System for Oil Security in China

1
School of Energy and Power Engineering, Shandong University, Jinan 250061, China
2
Medical Data Research Center, Providence Health & Services, 9205 SW Barnes Road, Portland, OR 97225, USA
*
Author to whom correspondence should be addressed.
Sustainability 2018, 10(1), 283; https://doi.org/10.3390/su10010283
Submission received: 12 December 2017
/
Revised: 18 January 2018
/
Accepted: 19 January 2018
/
Published: 22 January 2018
(This article belongs to the Special Issue Energy Security and Sustainability)
Abstract
:The oil system security in a country or region will affect its sustainable development ability. China’s oil security has risen to the national strategic level. It is urgent to construct an early warning indicator system to reflect the oil security level accurately, as well as to diagnose and assess the oil system status effectively and put forward the corresponding proposals for ensuring oil security. An early warning indicator system of China’s oil system covering 23 sub-indicators from three aspects, i.e., resource security, market security and consumption security, was constructed using the SPSS (Statistical Product and Service Solutions) factor analysis method. It shows that China’s oil system safety level has been seriously threatened and is generally declining. However, due to the strong introduction of energy policies and increasing energy utilization technology in recent years, the increasing proportion of new energy, renewable energy and oil substitutes eases the energy security threats. In response to complex oil security issues, the Chinese government needs to strengthen macroeconomic regulation and control at the policy level continuously, increase efforts to explore resource reserves, upgrade energy conservation and emission reduction technologies, develop new alternatives for oil products, and reduce the dependence on international oil imports.
1. Introduction
As an important pillar of national economy development, energy has been involved in many fields such as industry, building, agriculture, transportation, commerce and the service industry and residential life. It is of strategic significance to maintain energy security for social and economic development. As the largest energy consumer in the world, China accounted for 23% of global energy consumption in 2016 [1,2]. Coal still dominates and oil is the second largest source of energy consumption in China. In order to cope with the complicated situation of the international energy market, China must ensure a stable energy system [3]. From an international trade perspective, energy import demand grows rapidly in China [4,5]. Since March 2017, China has become the world's largest importer of crude oil. Growing oil imports has greatly increased the uncertainty of energy security [6]. With the rapid development of China’s economy, the demand for oil will still increase in the future. Since China’s oil consumption growth rate is higher than the oil production growth rate [7], this has greatly threatened China’s oil security. According to the China Statistical Yearbook [8], China’s oil consumption was 551.62 million tons in 2015, accounting for 18.1% of total energy consumption. The oil system is taken as an example to study China’s energy early warning system. By setting up an indicator system and building a comprehensive evaluation model, the trend of China’s oil security development and the main factors restricting oil security are analyzed. The related conclusions can provide reference for the government to guard oil system security.
A sound and reliable indicator system is the basis of systematic assessment. The quantitative evaluation of indicators can be used to assess and compare the energy security level [9,10]. At present, there is still no standardized method for an energy early warning indicator system. Chalvatzis and Ioannidis [11] found that finance was an important means of ensuring energy access. Improved supply security could be strengthened further if financial resources were directed towards innovation for renewable energy sources. Narula et al. divided the energy system into the three subsystems of supply, conversion distribution, and demand. Then an assessment of India’s renewable energy security was conducted [12,13]. Hippel et al. built a Northeast Asia energy security indicator system based on an energy–economy–environment system [14]. The indicator system covered six dimensions, i.e., energy supply, economy, technology, environment, social culture and the military. Vivoda incorporated the energy security assessment framework into energy security policies and other dimensions, and extended the assessment system to 12 dimensions and 46 indicators [15]. Sovacool supplemented Vivoda’s research and built an energy security assessment system with 20 dimensions and 200 indicators for 20 Asian countries [16]. The International Energy Agency (IEA, 2011) developed an assessment of 29 indicators from the six energy subsystems of coal, crude oil, petroleum products, natural gas, hydropower and nuclear power based on the risks and system resilience [17]. Zeng et al. selected 18 energy security indicators from the three dimensions of economic strength and carbon intensity, trade balance of energy products, and energy supply security based on the European Union’s energy policy [18]. Gupta evaluated the overall oil vulnerability index (OVI) based on the economic status of the importing country and seven indicators that were related to oil supply and consumption [19]. Chen et al. argued that China's energy early warning system should include five parts: resource security, production security, using security, transport security, and consumption safety [20]. From the above literature, the research on energy early warning indicator systems mainly focused on energy supply, energy storage and energy import, while some researches also involved national policies, energy consumption and market fluctuations. However, most research took the whole energy system as the research object, there is barely any research on the oil subsystem. According to Augutis et al. [9], energy security research mainly focused on two methods, i.e., indicator system construction and indicator system evaluation. In indicator system evaluation, the main evaluation methods were the fuzzy analytic hierarchy process [21,22], DEA (data envelopment analysis) data model analysis [23], cluster analysis [24], principal component analysis [25], and so on. Ren and Sovacool [26] used a fuzzy analytic hierarchy process to rank the factors affecting China’s energy security. Wang et al. applied a fuzzy analytic hierarchy process to obtain investment decisions in eco-industrial parks [10]. They also used DEA data model analysis to evaluate the efficiency of an eco-industrial chain [27]. Mayer et al. integrated a series of social and environmental factors reflecting the state of water resource in the Great Lakes basin using cluster analysis [28]. Neri et al. applied cluster analysis to an input–state–output indicator framework to assess the long-term performance of the economy in different countries [29]. Radovanović et al. analyzed a new energy security based on geographic economy by principal component analysis [30]. Erahman et al. used principal component analysis to validate Indonesia’s energy security system [31]. The methods above have their own advantages and disadvantages. Since a large amount of indicators and information are required, it is sensible to use factor analysis to reduce multiple indicators into a few common factors through dimensionality reduction. The uncertainty and arbitrariness of subjectivity can be ruled out. Factor analysis was chosen as the method to perform all analyses. It is a good method for weight determination and comprehensive evaluation.
According to the analysis above, oil security is influenced by many factors such as including supply, resource, production, consumption, economy, etc. There is no standardized indicator system currently. Hence, the oil security early warning indicator system must be constructed from a systemic perspective. It is analyzed from three aspects, i.e., resource, market and consumption. The safety development trend of the oil system is diagnosed and evaluated by factor analysis on the basis of a reasonable evaluation indicator system. By analyzing the drivers and constraints affecting the oil subsystem and overall system, the intrinsic mechanisms of their interaction with each other is revealed, which can give some suggestions and countermeasures for the development of oil system security.
This paper consists of five parts. The second section includes the construction of an oil early warning indicator system and model construction based on factor analysis. The third section is the calculation results, calculated from three dimensions respectively. The fourth section is discussion analyzing the security level of China at present. The fifth section is conclusions and suggestions.
2. Oil Early Warning Model Construction
2.1. Construction of the Oil Early Warning Indicator System
The construction of the oil system early warning indicator system aims to obtain highly reliable trends of oil security through mathematical analysis and comparison with representative index data. Since there is no widely acknowledged standard system currently, in order to ensure that the calculation results are objective and scientific, the index system was constructed as follows: Firstly, we ensured the systematic and complete construction of the indicator system. Based on the literature [6,15,32,33] and the characteristics of the oil system, the indicator system is constructed from three aspects, i.e., resource security, market security and consumption security. Secondly, indicators are selected according to reliability. (1) Ensuring that the indicator is easy to quantify and obtain. (2) Using quantitative indicators as much as possible in order to rectify the uncertainty brought by qualitative indicators. (3) Applying recognized methods to evaluate the indicator system to avoid the uncertainty of outputs. Based on this analysis, factor analysis is adopted for evaluation. A total of 23 indicators were selected to construct the oil early warning system of China from 2001 to 2015. Statistical data and indicator explanations are shown in Table 1 and Table 2.
2.2. Model Construction Based on Factor Analysis
The general idea of factor analysis is to look for a few public or common factors that dominate multiple indicators with little or no loss of original variable information [47,48,49]. The modeling process is as follows:
Suppose there are m common factors and p variables. The factor model is as follows:
Equation (1) can be abbreviated as:
m ≤ p; are uncorrelated and the variances are 1; are uncorrelated and the variances are different. Among them, A is a factor load matrix, F is the common factors or the main factors of x, and ε is the special factors.
- (1)
- Data forward processingTransfer the negative indicators in Table 1 into positive indicators by a certain method to eliminate the weakening of the positive and negative indicators during evaluation so that the evaluation result is closer to the actual status.
- (2)
- Data standardizationIf there is a forward data matrix , where n is the sample size and p is the number of evaluation indicators. is the normalized value of the i-th sample of the j-th indicator. The standard data transformation method is:is the standardized data and is the data after the forward processing.
- (3)
- Determine the main factors① Calculate the factor correlation coefficients and establish the correlation coefficient matrixThe principal component factor is determined after processing and standardizing the sample data. The correlation coefficient matrix of the standardized sample data is:② Correlate eigenvalues and eigenvectors of the correlation coefficient matrix RUse an iterative method to solve p non-negative eigenvalues of eigenvalue . There is an eigenvalue equation that can find the eigenvector corresponding to eigenvalue .③ Calculate the variance contribution rate, select factor mFactor analysis generally use m (m < p) main factors instead of p main factors. The value of m is based on the cumulative variance contribution rate.The variance contribution rate of the k-th indicator is . The cumulative variance contribution to the m-th indicator is .When the cumulative variance contribution rate ≥ 75%, the number of indicators is the value of the main factor m.Take the first m eigenvalues and the corresponding eigenvectors to find the main factor load matrix:④ Implement maximum variance orthogonal rotation on A.The purpose of rotating the factor load matrix is to simplify the factor load matrix. Thus the coefficients diverge between the poles zero and one to explain the main factor. There are many ways to rotate the factor load matrix. In this study, the orthogonal rotation method with the largest variance is chosen.⑤ Calculate the score of each factorAccording to the factor scores coefficient matrix and standardized data determined by step ④, the main factors can be expressed as a linear combination of indicator variables:
3. Calculation and Discussion
3.1. Main Factor Analysis of Resource Security
SPSS 19.0 was used for analysis. The factor calculation results of resource security are shown in Table 3 and Table 4. According to Table 3, the cumulative variance contribution rate of the first two factors reaches 75.651%, indicating that the first two factors basically express the information reflected by the eight indicators.
As shown in Table 3 and Table 4, the first common factor of the resource security element accounts for 57.542% of the total variance. After rotation, it accounts for 52.057%. According to Sun et al. [50], the cut off value was chosen as 0.6, so is mainly related to R1, R2, R3, R5 and R8. Among them, R1, R2 and R8 have a positive correlation with , while R3 and R5 have a negative correlation. It shows that oil reserve capacity is an important factor to ensure oil resource security. Thus, the first common factor was named as oil reserve factor. This is in line with Su et al. [51], who argued that it was urgent to strengthen China’s strategic reserve to improve China’s oil supply security. As China is short of oil, R3 and R5 are lower than the world average level. This is the main objective factor restricting the development of China’s oil economy. Hence both R3 and R5havenegative correlations with , which is also in line with the actual development of China’s oil industry. The second public factor accounts for 18.109% of the total variance and it accounts for 23.594% after rotation. It is mainly related to R6 and R7. The reserve replacement rate and efficiency of oil process and conversion can represent the development capability of China’s oil industry. The second common factor is named the sustainable development factor. Because of the positive correlation between R7 and , improving oil processing conversion efficiency is one of the most important ways to improve oil resource security under the premise of the lack of oil resources in China. The Chinese government has realized the importance of this aspect, so it keeps increasing the investment in oil technology and continuously plays an important role in the sustainable development of China’s oil industry. Feng and Wang [52] found that during the 11th and 12th five-year periods, the technologies emphasized and promoted by the Chinese government had yielded positive results in the energy innovation of sustainable development.
3.2. Main Factor Analysis of Market Security
According to Table 5 and Table 6, the cumulative variance contribution rate of the first two factors reaches 79.244%, indicating that the first two factors can basically express the information reflected by the eight indicators. The first common factor is mainly related to M1, M3, M4, M6, M7 and M8, so it belongs to comprehensive factor. Among them, M3 has a negative correlation with . The balance between oil supply and demand is a basic indicator for evaluating oil security level. A serious imbalance will be harmful to the sustainable development of the oil market. The balance between oil supply and demand is mainly determined by market price. Thus M8 occupies the highest coefficient of 0.973. Thus the oil industry price index has the greatest impact on . This factor determines the level of market-oriented consumption prices and becomes another major factor affecting the market balance between supply and demand. The second common factor is mainly related to M2. It is named the oil price factor. For oil importing countries, the higher the price of oil, the higher the cost of import is, and the lower the safety is.
In conclusion, the analysis of the two main factors above shows that China’s oil system safety is closely linked to the oil price, which is in line with Lin and Chen’s findings [53]. They suggested that it was urgent for China to reform an energy pricing mechanism in order to solve resource shortage and environmental cost problems. The Chinese government has also promulgated relevant policies, i.e., the “Measures by the Central Government on Transfer Payment of Local Refined Oil Prices and Taxes” [54], for further regulation of refined oil prices [55], to ensure market supply and maintain market order. In addition, Geng and Ji [40] thought that since China had become the world’s largest oil importer and had been greatly affected by the international oil market, such dependence would greatly reduce the safety of China’s oil system.
3.3. Main Factor Analysis of Consumption Security
According to Table 7 and Table 8, the cumulative variance contribution rate of the first two factors reaches 82.928%, indicating that the first two factors basically express the information reflected by the seven indicators. The first common factor of the consumption security element is mainly related to C3, C4 and C5. Among them, C3 and C4 have a positive correlation with , while C5 has a negative correlation. C5 is the key indicator affecting . All these three indicators reflect the comparison between the current year’s oil consumption and the previous year’s. Hence the first common factor is named the consumption growth factor. At present, there are two main ways for China to control C5. One is to increase the efficiency of oil usage; another one is to use oil substitutes to reduce consumption. The oil substitutes mainly include the following three aspects, i.e., firstly, automotive gas, methanol gasoline, ethanol gasoline, biodiesel and other alternative vehicle gasoline and diesel fuel; secondly, pure electric vehicles, hybrid vehicles and other energy-saving and new energy vehicles; thirdly, petrochemical products replaced by coal-oil and coal polyethylene. Li et al. [7] found that with the improvement of China’s new energy technology and alternative fuels, the intensity of oil consumption was gradually decreased. The data from the China Statistical Yearbook 2016 [8] also confirm Li’s conclusion. The proportion of oil in primary energy has shown a declined trend since 2000. The second common factor is mainly related to C1, C2 and C7, so is named the consumption weight factor. It is closely related to GDP (Gross Domestic Product) and the growth rate of GDP [7]. In 2016, China’s annual GDP was 74,412.7 billion RMB (Chinese currency) and its GDP growth rate was 6.7%. However, energy consumption structure has been further optimized [56]. The energy consumption per unit of GDP decreased by 5% on a year-on-year basis, and its non-fossil energy consumption reached 13.3%, increased by 1.3%. Wang et al. believed that as a result of urbanization, the transformation of the energy consumption structure was inevitable [57,58]. The energy structure should be continuously optimized by reducing consumption intensity and developing new renewable energy [59]. China is in the rapid urbanization stage. An important way to improve oil system security is by developing new energy and renewable energy to reduce the oil consumption intensity.
3.4. Comprehensive Evaluation of the China Oil Early Warning System
Formulas (11)–(13) can be obtained according to Table 11.
F1 = 0.097r1 + 0.105r2− 0.043r3 +⋯− 0.004c5− 0.028c6 + 0.104c7,
F2 = −0.026r1− 0.065r2− 0.122r3 +⋯+ 0.015c5 + 0.144c6− 0.085c7,
F3 = −0.038r1− 0.038r2 + 0.022r3 +⋯− 0.242c5− 0.073c6 + 0.042c7,
The variance contribution rates of the factor load matrix after rotation are the factor weights. Thus the final factor equation is as followed:
F = 0.455 × F1 + 0.185 × F2 + 0.170 × F3,
The comprehensive factor score is calculated according to Formula (14). The results are shown in Table 12 and Figure 1.
Most of the variables in Table 10 show obvious polarization in the three common factors [60]. The first common factor F1 accounts for 49.641% of the total variance. After rotation, it accounts for 45.485%. F1 is related to most of the indicators, so it is named a comprehensive factor. In order to improve oil system security, it should give priority to improving F1. The second common factor F2 accounts for 17.745% of the total variance and it accounts for 18.521% after rotation. F2 is mainly related to R7 and M2. Among them, M2 has a positive correlation with F2, while R7 has a negative correlation. Wang and Kong [61] believed that the oil processing conversion efficiency in China had a great impact on economic development. There was a strong linear relationship between them. Thus, the second principal component factor F2 can be named the economic price factor. The third common factor accounts for 13.652% of the total variance and after rotation, it accounts for 17.032%. F3 is mainly related to C3, C4 and C5. Among them, C3 and C4 have a positive correlation with F3, while C5 has a negative correlation. So F3 can be named as oil consumption factor. The three main factors above are similar to the factor analysis results in Section 3.1, Section 3.2 and Section 3.3. It shows that except for China’s own conditions for oil storage, all factors are closely related to government policy guidance. The studies of Yao and Chang [62,63] came to the same conclusion that China’s macroeconomic policy would affect China’s energy security evolution. The government should step up the implementation of policies and ensure the safety and stability of the entire oil market through macro control. On 13 May 2017, the “Opinions on Deepening the Reform of the Oil and Gas System” issued by the State Council [64] clearly pointed out that it was necessary to promote the sustainable and healthy development of the oil and gas industry through reform. The government is supposed to increase the proved reserves of resource and continuously improve the resource allocation efficiency to ensure supply safety of oil and gas resources.
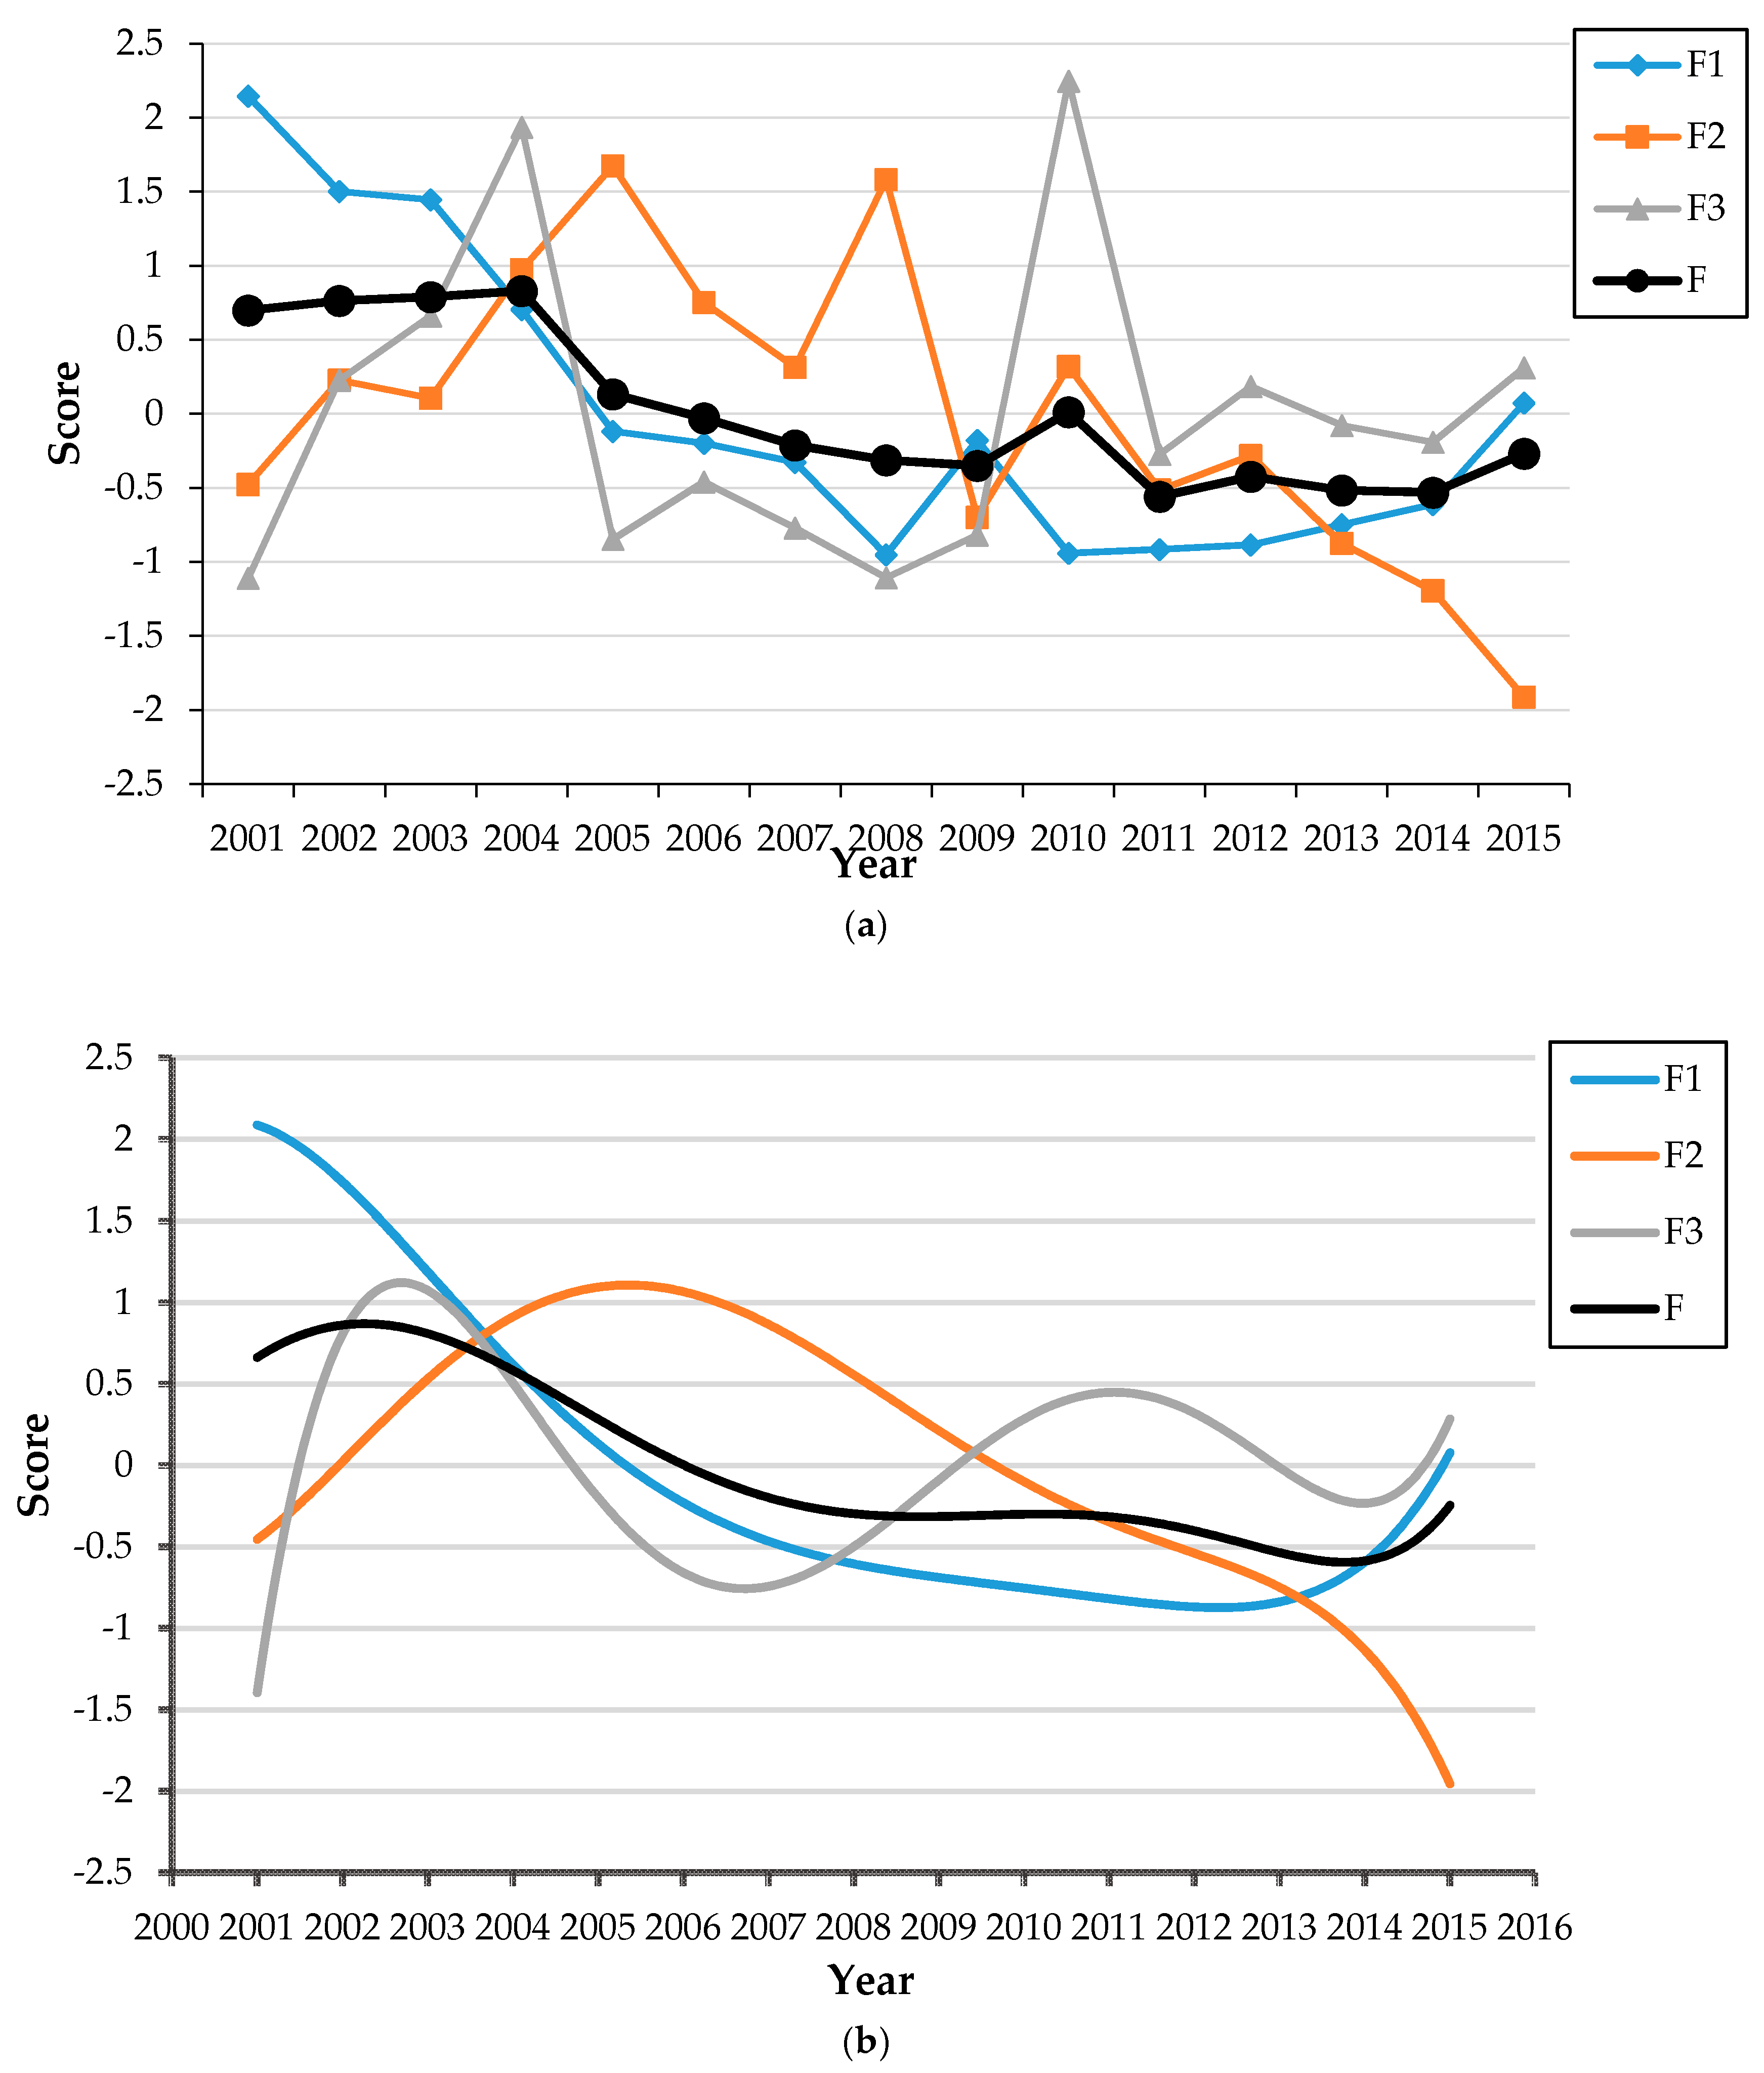
During the period of 2001–2015, China’s oil security system declined in a long-term trend (Table 12 and Figure 1). Despite several minor fluctuations during the period, the overall threat level of system safety is increasing. Among them, the trend of curve F and curve F1 are basically the same. It shows that F1 is the key factor that affects F with the highest weight. Curve F2 shows a continuously declining trend in general. This is an important issue for the Chinese government, namely how to reduce the influence of economic prices on the oil security system effectively. Although the curve F3 is declining overall, it shows a gradual upward trend during 2008–2015. It shows that the impact of this factor on the overall oil system security has been effectively controlled through the efforts of the Chinese government. The “12th Five-Year Period” (2011–2015) is a crucial period for the Chinese government to readjust its economic structure and transform its economic development pattern. During this period, the overall safety level of the oil system has been on an upward trend, because the indicator M6 with load value of −0.875 in the first main factor decreases year by year. This reflects that the pressure on oil imports has been reduced and the domestic oil system has been safeguarded. Also, it is closely linked with the active development of new and renewable energy, the improvement of oil extraction and utilization technologies and encouragement for using oil substitutes. In addition, Zhao et al. [65] believed that the current Chinese traditional energy policies, i.e., improving energy production efficiency and improving production technology, were still important measures to reduce energy consumption. Consumption policies should focus on adjusting the consumption structure according to the proportion of different products in final demand. China should continue to step up the implementation of relevant traditional policies, i.e., the “13th Five-Year Plan for Comprehensive Energy Conservation and Emission Reduction”, [66] based on its own economic development rules. In the meantime, the government should continue to issue a series of policies to encourage the use of oil substitutes in consumption terminals.
4. Conclusions
Based on a multivariate factor analysis, an early warning system for the oil sector covering 23 sub-indicators from the aspects of resource safety, market safety and consumer safety was established to analyze China’s oil system security trend from 2001 to 2015.
It was found that in order to improve oil security, the Chinese government must strengthen its awareness of strategic oil reserves, improve energy utilization efficiency and develop new and renewable energy. Due to the shortage of oil resources in China, it is difficult to ensure the balance of oil supply and demand by domestic oil production. Since China relies heavily on oil imports, the oil price is greatly affected by fluctuations in the international oil price. Maintaining market security cannot be separated from market price control, and the establishment of market price cannot be separated from government promotion. The consumption security element has a close relationship with the first two elements, namely reducing oil consumption intensity and optimizing energy consumption structure. As long as the first two factors are properly controlled, the oil consumption safety issues can be controlled effectively in China.
The overall level of oil system security in China showed a declining trend from 2001 to 2015. The level of threats to the oil system has been constantly increasing. However, during “The 12th Five-Year Plan” period, the overall level of oil system safety rose. In this period, the Chinese government took ecological civilization construction as the main criterion for economic development and promoted sustainable development constantly. The government also tried to stabilize market price and keep increasing the usage of oil substitutes through the implementation of a series of policies. It shows that as long as the government formulates the policies properly and strengthens macro-control, in time China’s oil security will be in a good situation.
Meanwhile, we suggest that the monitoring and early warning of oil system safety is strengthened, and that investment, equipment and manpower for exploring energy resource reserves are increased. It is necessary to increase investment in research and development of energy-saving and emission reduction technologies. More stringent policies should be implemented to ensure market stability, expand the consumption of oil substitutes, and decrease the dependence on international crude oil imports.
Qualitative indicators were not selected when constructing the indicator system. A few quantitative indicators were also not considered due to data acquisition issues. This it will result in a certain deviation of the final result without affecting the overall evaluation results. The optimization of the indicator system could be performed in future research.
Acknowledgments
This research is supported by the National Natural Science Foundation (41471461), National Key R&D Plan (2017YFC0703100), Innovation Fund of Shandong University (IFYT1401, IFYT14010).
Author Contributions
The study was designed by Qingsong Wang, Xueliang Yuan and Hongrui Tang. The data from yearbooks are retrieved by Hongrui Tang, Hongkun Xiao and Zhi Ma. The results were analyzed by Qingsong Wang and Hongrui Tang. The policies related to the research are reviewed by Xueliang Yuan. Model design and English corrections were completed by Hongrui Tang and Mansen Wang.
Conflicts of Interest
The authors declare no conflict of interest. The founding sponsors had no role in the design of the study; in the collection, analyses, or interpretation of data; in the writing of the manuscript, and in the decision to publish the results.
References
- BP Group. Statistical Review of World Energy. 2016. Available online: http://www.bp.com/en/global/corporate/energy-economics/energy-outlook.html (accessed on 6 November 2017).
- Liu, L.; Huang, J.; Yu, S. Prediction of primary energy demand in China based on AGAEDE optimal model. China Popul. Resour. Environ. 2016, 14, 16–29. [Google Scholar] [CrossRef]
- Guo, W.; Zhao, T.; Dai, H. Calculation and decomposition of regional household energy consumption in China: Based on perspectives of urbanization and residents’ consumption. China Popul. Resour. Environ. 2017, 15, 132–141. [Google Scholar] [CrossRef]
- Zhu, H.; Su, X.; Guo, Y.; Ren, Y. The Asymmetric Effects of Oil Price Shocks on the Chinese stock market: Evidence from a quantile impulse response perspective. Sustainability 2016, 8, 766. [Google Scholar] [CrossRef]
- Mu, R.M.; Zuo, J.; Yuan, X.L. China’s approach to nuclear safety—From the perspective of policy and institutional system. Energy Policy 2015, 76, 161–172. [Google Scholar] [CrossRef]
- Xu, J.; Zhang, J.; Yao, Q.; Zhang, W. Is it feasible for China to optimize oil import source diversification? Sustainability 2014, 6, 8329–8341. [Google Scholar] [CrossRef]
- Li, Z.; Lu, H.; Ren, W.; Lu, X. Analysis on the development trend of China’s future oil consumption. Chem. Prog. 2016, 35, 1739–1747. (In Chinese) [Google Scholar]
- NBS. China Statistical Yearbook 2016; China Statistics Press: Beijing, China, 2016; ISBN 9780136019701.
- Augutis, J.; Krikstolaitis, R.; Martisauskas, L.; Peciulyte, S.; Zutautaite, I. Integrated energy security assessment. Energy 2017, 138, 890–901. [Google Scholar] [CrossRef]
- Wang, Q.; Lu, S.; Yuan, X.; Zuo, J.; Zhang, J.; Hong, J. The index system for project selection in ecological industrial park: A China study. Ecol. Indic. 2017, 77, 267–275. [Google Scholar] [CrossRef]
- Chalvatzisa, K.; Ioannidis, A. Energy supply security in southern Europe and Ireland. Energy Procedia 2017, 105, 2916–2922. [Google Scholar] [CrossRef]
- Narula, K.; Sudhakara Reddy, B.; Pachauri, S. Sustainable energy security for India: An assessment of energy demand sub-system. Appl. Energy 2017, 186, 126–139. [Google Scholar] [CrossRef]
- Narula, K.; Sudhakara Reddy, B.; Pachauri, S.; Mahendra Dev, S. Sustainable energy security for India: An assessment of the energy supply sub-system. Energy Policy 2017, 103, 127–144. [Google Scholar] [CrossRef]
- Von Hippel, D.F. Energy Security Analysis: A New Framework. 2004. Available online: https://www.energy-community.org/ (accessed on 6 November 2017).
- Vivoda, V. Evaluating energy security in the Asia-pacific region: A novel methodological approach. Energy Policy 2010, 38, 5258–5263. [Google Scholar] [CrossRef]
- Sovacool, B.K. Evaluating energy security in the Asia pacific: Towards a more comprehensive approach. Energy Policy 2011, 39, 7472–7479. [Google Scholar] [CrossRef]
- International Energy Agency (IEA). Energy Policies of IEA Countries; OECD/IEA: Paris, France, 2011; ISBN 9789264096431. [Google Scholar]
- Zeng, S.; Streimikiene, D.; Baležentis, T. Review of and comparative assessment of energy security in Baltic States. Renew. Sustain. Energy Rev. 2017, 76, 185–192. [Google Scholar] [CrossRef]
- Gupta, E. Oil vulnerability index of oil-importing countries. Energy Policy 2008, 36, 1195–1211. [Google Scholar] [CrossRef]
- Chen, B.; Liu, G. China Energy Security and Forecasting and Early Warning; Science Press: Beijing, China, 2014; ISBN 9787030395238. [Google Scholar]
- Geng, Z.; Qin, L.; Han, Y.; Zhu, Q. Energy saving and prediction modeling of petrochemical industries: A novel ELM based on FAHP. Energy 2017, 122, 350–362. [Google Scholar] [CrossRef]
- Zhang, J.; Zhu, M.; Zhang, L. Risk Evaluation of the logistics ecological environment system based on FAHP. Procedia Eng. 2011, 15, 381–385. [Google Scholar]
- Deilmann, C.; Hennersdorf, J.; Lehmann, I.; Reißmann, D. Data envelopment analysis of urban efficiency-Interpretative methods to make DEA a heuristic tool. Ecol. Indic. 2018, 84, 607–618. [Google Scholar] [CrossRef]
- Wildgaard, L. A critical cluster analysis of 44 indicators of author-level performance. J. Informetr. 2016, 10, 1055–1078. [Google Scholar] [CrossRef]
- Rajesh, S.; Jain, S.; Sharma, P. Inherent vulnerability assessment of rural households based on socio-economic indicators using categorical principal component analysis: A case study of Kimsar region, Uttarakhand. Ecol. Indic. 2018, 85, 93–104. [Google Scholar] [CrossRef]
- Ren, J.; Sovacool, B.K. Enhancing China’s energy security: Determining influential factors and effective strategic measures. Energy Convers. Manag. 2014, 88, 589–597. [Google Scholar] [CrossRef]
- Wang, Q.; Sun, Y.; Yuan, X.; Cao, D.; Zuo, J.; Gao, Z. Addressing the efficiency of the core ecological industrial chain: A DEA approach. J. Clean. Prod. 2017, 156, 235–243. [Google Scholar] [CrossRef]
- Mayer, A.; Winkler, R.; Fryc, L. Classification of watersheds into integrated social and biophysical indicators with clustering analysis. Ecol. Indic. 2014, 45, 340–349. [Google Scholar] [CrossRef]
- Neri, L.; D’Agostino, A.; Regoli, A.; Pulselli, F.M.; Coscieme, L. Evaluating dynamics of national economies through cluster analysis within the input-state-output sustainability framework. Ecol. Indic. 2017, 72, 77–90. [Google Scholar] [CrossRef]
- Radovanovića, M.; Filipović, S.; Golušin, V. Geo-economic approach to energy security measurement-principal component analysis. Renew. Sustain. Energy Rev. 2018, 82, 1691–1700. [Google Scholar] [CrossRef]
- Erahman, Q.F.; Purwanto, W.W.; Sudibandriyo, M.; Hidayatno, A. An assessment of Indonesia’s energy security index and comparison with seventy countries. Energy 2016, 111, 364–376. [Google Scholar] [CrossRef]
- Department of Economic and Social Affairs. Indicators of Sustainable Development: Guidelines and Methodologies, 3rd ed.; United Nations: New York, NY, USA, 2007; ISBN 9789211045772. [Google Scholar]
- Sovacool, B.K. An international assesment of energy security performance. Ecol. Econ. 2013, 88, 148–158. [Google Scholar] [CrossRef]
- Lv, J.; Wang, D.; Wei, S. China petroleum safety evaluation and scenario forecast. J. China Univ. Geosci. Soc. Sci. Ed. 2017, 17, 86–96. (In Chinese) [Google Scholar]
- Zhang, H.; Liu, G. Preliminary study on the index system of petroleum safety in China. Int. Pet. Econ. 2005, 5, 44–48. (In Chinese) [Google Scholar]
- Sharifuddin, S. Methodology for quantitatively assessing the energy security of Malaysia and other Southeast Asian countries. Energy Policy 2014, 65, 574–582. [Google Scholar] [CrossRef]
- CMLR. 2002–2016 China Land and Resources Bulletin. 2016. Available online: http://www.mlr.gov.cn/sjpd/gtzygb/ (accessed on 6 November 2017).
- Brown, M.A.; Sovacool, B.K. Developing an ‘energy sustainability index’ to evaluate energy policy. Interdiscip. Sci. Rev. 2007, 32, 335–349. [Google Scholar] [CrossRef]
- Martchamadol, J.; Kumar, S. An aggregated energy security performance indicator. Appl. Energy 2013, 103, 653–670. [Google Scholar] [CrossRef]
- Geng, J.; Ji, Q. Multi-perspective analysis of China’s energy supply security. Energy 2014, 64, 541–550. [Google Scholar] [CrossRef]
- Wang, L.; Fang, Y. Construction of national oil security assessment indicator system. J. Nat. Resour. 2008, 23, 821–831. (In Chinese) [Google Scholar]
- China Mining Yearbook Editorial Board. China Mining Yearbook 2016; Earthquake Press: Beijing, China, 2016; ISBN 9787502848330.
- WEF. Global Energy Architecture Performance Index Report 2016. 2016. Available online: https://www.weforum.org/reports/global-energy-architecture-performance-index-report-2016 (accessed on 6 November 2017).
- Zhang, W.; Liu, Z.J. Analysis of relationship between oil consumption elasticity coefficient and oil demand forecast. Market Wkly. Theor. Res. 2006, 10, 96–97. (In Chinese) [Google Scholar]
- Zhao, J.A.; Lang, Y.H. Study on energy security risk system—Taking coal and oil as examples. Geo-Inform. Sci. 2008, 4, 419–425. (In Chinese) [Google Scholar]
- Xi, W.J. Literature review of oil security evaluation method. J. Hubei Univ. Econ. 2008, 5, 81–84. (In Chinese) [Google Scholar]
- Kim, J.; Mueller, C. Factor Analysis: Statistical Method and Practical Issues; Sage Publications: Thousand Oaks, CA, USA, 1978; ISBN 9780803911666. [Google Scholar]
- Chen, F.Y.; Shen, S. Data Analysis Methods and SPSS Applications; Science Press: Beijing, China, 2016; ISBN 9787030479969. [Google Scholar]
- Wang, L.B.; Gu, G.T. Multivariate Statistical Analysis: Models, Cases and SPSS Applications; Economic Science Press: Beijing, China, 2010; ISBN 9787505891029. [Google Scholar]
- Sun, M.; Tian, L.X.; Xu, J. Energy safety monitoring and early warning system construction based on factor analysis. Stat. Decis. 2007, 13, 65–66. (In Chinese) [Google Scholar]
- Su, M.; Zhang, M.; Lu, W.; Chang, X.; Chen, B.; Liu, G.; Hao, Y.; Zhang, Y. ENA-based evaluation of energy supply security: Comparison between the Chinese crude oil and natural gas supply systems. Renew. Sustain. Energy Rev. 2017, 72, 888–899. [Google Scholar] [CrossRef]
- Feng, C.; Wang, M. Analysis of energy efficiency and energy savings potential in China’s provincial industrial sectors. J. Clean. Prod. 2017, 164, 1531–1541. [Google Scholar] [CrossRef]
- Lin, B.; Chen, G. Energy efficiency and conservation in China’s Manufacturing Industry. J. Clean. Prod. 2018, 174, 492–501. [Google Scholar] [CrossRef]
- SCNPC. Measures by the Central Government on Transfer Payment of Local Refined Oil Prices and Taxes. 2008. Available online: http://www.gov.cn/zhengce/content/2008–12/19/content_1425.htm (accessed on 6 November 2017).
- NDRC. Notice of the National Development and Reform Commission on Issues Concerning the Further Perfection of the Mechanism for the Formation of the Price of Refined Oil. 2016. Available online: http://www.ndrc.gov.cn/zcfb/zcfbtz/201601/t20160113_771288.html (accessed on 6 November 2017).
- SCNPC. Deepen the Reform of the Supply-Side Structure as the Main Line and Comprehensively Promote China’s Energy Transformation. 2017. Available online: http://www.gov.cn/xinwen/2017–08/21/content_5219254.htm (accessed on 6 November 2017).
- Wang, Q.; Yuan, X.; Zhang, J.; Gao, Y.; Hong, J.; Zuo, J.; Liu, W. Assessment of the Sustainable Development Capacity with the Entropy Weight Coefficient Method. Sustainability 2015, 7, 13542–13563. [Google Scholar] [CrossRef]
- Wang, Q.; Liu, P.; Yuan, X.; Cheng, X.; Ma, R.; Mu, R.; Zuo, J. Structural Evolution of Household Energy Consumption: A China Study. Sustainability 2015, 7, 3919–3932. [Google Scholar] [CrossRef]
- Yuan, P. Changing energy intensity in China: A decomposition analysis. China Popul. Resour. Environ. 2015, 13, 67–77. [Google Scholar] [CrossRef]
- Li, J.Y.; Lin, H.M. Improvement of the case analysis of factor analysis. Stat. Decis. 2010, 2, 157–161. (In Chinese) [Google Scholar]
- Wang, X.Z.; Kong, L.F. Analysis of the relationship between energy conversion efficiency and economic development in China and the construction of forecasting model. China Min. 2009, 18, 27–30. (In Chinese) [Google Scholar]
- Yao, L.; Chang, Y. Energy security in China: A quantitative analysis and policy implications. Energy Policy 2014, 67, 595–604. [Google Scholar] [CrossRef]
- Yao, L.; Chang, Y. Shaping China’s energy security: The impact of domestic reforms. Energy Policy 2015, 77, 131–139. [Google Scholar] [CrossRef]
- SCNPC. Opinions on Deepening the Reform of the Oil and Gas System issued by the State Council. 2017. Available online: http://www.gov.cn/xinwen/2017-05/21/content_5195683.htm (accessed on 6 November 2017).
- Zhao, N.; Xu, L.; Arunima, M.; Song, X.; Wang, Y. Inter-Provincial Trade Driving Energy Consumption in China. Resour. Conserv. Recycl. 2017, in press. [Google Scholar] [CrossRef]
- SCNPC. The 13th Five-Year Plan for Comprehensive Energy Conservation and Emission Reduction. 2016. Available online: http://www.gov.cn/zhengce/content/2017-01/05/content_5156789.htm (accessed on 6 November 2017).
Figure 1.
The trend of China oil system security evaluation from 2001 to 2015. (a) A line chart according to composite factor scores which shows annual changes in security level; (b) Fitting curves according to annual scores which show the trend China oil security level.
Figure 1.
The trend of China oil system security evaluation from 2001 to 2015. (a) A line chart according to composite factor scores which shows annual changes in security level; (b) Fitting curves according to annual scores which show the trend China oil security level.


Table 1.
Oil early warning indicator system and the interpretation of each indicator.
| Element | Indicator | Abbr. | Unit | Meaning | Indicator Source | Data Source |
|---|---|---|---|---|---|---|
| Resource security | Proportion of oil reserves in the world total oil reserves | R1 | % | Domestic oil recoverable reserves/world oil recoverable reserves | [34] | [1] |
| Reserve-production ratio | R2 | % | Domestic oil remaining recoverable reserves/domestic oil production | [14,35,36] | [1] | |
| China’s oil reserves per capita | R3 | t/person | Domestic oil reserves/domestic population | [14] | [8] | |
| Oil production growth rate | R4 | % | (Annual oil production − the production of the previous year increments)/the previous year oil production | [14] | [1] | |
| Proportion of oil production in the world total oil reserves | R5 | % | Domestic oil production/world oil production | [34] | [1] | |
| Reserve replacement rate | R6 | % | Newly verified oil recoverable reserves/current annual consumption of oil reserves | [19,34] | [37] | |
| Efficiency of oil process and conversion | R7 | % | Oil processing conversion output/oil processing conversion input | [36] | [8] | |
| Proportion of oil production | R8 | % | Oil production/China’s total energy production | [19] | [8] | |
| Market security | International oil price | M1 | USD/barrel | Current price of oil | [38,39] | [1] |
| International oil price volatility rate | M2 | % | (Current price of oil − base period oil price)/base period oil price | [40,41] | [1] | |
| Supply and demand balance ratio | M3 | % | China’s total oil supply/China’s total oil consumption | [35,39] | [8] | |
| Import dependence rate | M4 | % | (Domestic oil imports − domestic oil exports)/domestic oil consumption | [14,19,41] | [8] | |
| Import source concentration rate | M5 | % | Sum of top 5 countries or regions oil imports/total imports | [14,34] | [42] | |
| Consumption of oil imports to GDP(gross domestic product) | M6 | % | GDP consumed by domestic oil imports/current GDP | [19,43] | [8] | |
| Oil import share | M7 | % | Oil imports/international market oil trade | [14,41] | [1,8] | |
| Oil industry price index | M8 | Indicators for measuring changes in ex-factory prices and changes in the prices of industrial products | [14] | [8] | ||
| Consumption security | Proportion of consumption | C1 | % | Oil consumption/total energy consumption | [19,35] | [8] |
| Oil consumption intensity | C2 | t/RMB | Domestic oil consumption/domestic GDP | [19,38] | [8] | |
| Oil consumption elasticity coefficient | C3 | % | Oil consumption growth rate/GDP growth rate | [44] | [8] | |
| Oil consumption growth rate | C4 | % | Current year’s oil consumption growth/last year’s oil consumption × 100% − 1 | [35,39] | [8] | |
| Oil saving rate | C5 | % | (1 − current annual oil consumption per unit of GDP/the previous year’s oil consumption per unit of GDP) × 100% | [45] | [8] | |
| Ratio of oil production growth rate to consumption demand growth rate | C6 | % | Oil production growth rate/consumption demand growth rate | [46] | [8] | |
| Oil share of primary energy consumption | C7 | % | Annual oil consumption/total annual primary energy consumption | [19,34] | [8] |
Table 2.
2001–2015 China oil early warning system indicators statistics.
| Indicator | 2001 | 2002 | 2003 | 2004 | 2005 | 2006 | 2007 | 2008 | 2009 | 2010 | 2011 | 2012 | 2013 | 2014 | 2015 |
|---|---|---|---|---|---|---|---|---|---|---|---|---|---|---|---|
| R1 | 0.023 | 0.017 | 0.021 | 0.014 | 0.013 | 0.013 | 0.013 | 0.012 | 0.011 | 0.011 | 0.009 | 0.010 | 0.011 | 0.011 | 0.011 |
| R2 | 19.90 | 14.80 | 19.10 | 13.40 | 12.10 | 12.10 | 11.30 | 11.10 | 10.70 | 9.90 | 9.90 | 11.40 | 11.90 | 11.90 | 11.70 |
| R3 | 1.880 | 1.888 | 1.882 | 1.916 | 1.904 | 2.099 | 2.144 | 2.176 | 2.210 | 2.367 | 2.404 | 2.461 | 2.475 | 2.510 | 2.543 |
| R4 | 0.017 | 0.012 | 0.016 | 0.024 | 0.046 | 0.019 | 0.008 | 0.019 | −0.002 | 0.071 | −0.001 | 0.020 | 0.015 | 0.007 | 0.015 |
| R5 | 0.046 | 0.048 | 0.048 | 0.045 | 0.046 | 0.047 | 0.048 | 0.048 | 0.049 | 0.052 | 0.051 | 0.050 | 0.050 | 0.050 | 0.049 |
| R6 | 3.176 | 4.248 | 2.946 | 3.464 | 3.649 | 2.807 | 3.303 | 3.592 | 2.918 | 2.494 | 3.019 | 3.180 | 2.161 | 2.007 | 2.067 |
| R7 | 0.976 | 0.967 | 0.964 | 0.965 | 0.969 | 0.969 | 0.972 | 0.962 | 0.967 | 0.970 | 0.974 | 0.971 | 0.977 | 0.975 | 0.976 |
| R8 | 15.9 | 15.3 | 13.6 | 12.2 | 11.3 | 10.8 | 10.1 | 9.8 | 9.4 | 9.3 | 8.5 | 8.5 | 8.4 | 8.4 | 8.5 |
| M1 | 25.93 | 26.16 | 31.07 | 41.49 | 56.59 | 66.02 | 72.20 | 100.06 | 61.92 | 79.45 | 95.04 | 94.13 | 97.99 | 93.28 | 48.71 |
| M2 | −0.146 | 0.009 | 0.188 | 0.335 | 0.364 | 0.167 | 0.094 | 0.386 | −0.381 | 0.283 | 0.196 | −0.010 | 0.041 | −0.048 | −0.478 |
| M3 | 1.014 | 1.005 | 1.015 | 1.013 | 1.000 | 1.002 | 1.000 | 1.000 | 1.002 | 1.002 | 1.006 | 1.001 | 1.000 | 1.001 | 1.001 |
| M4 | 0.309 | 0.328 | 0.393 | 0.475 | 0.439 | 0.482 | 0.504 | 0.538 | 0.566 | 0.575 | 0.605 | 0.611 | 0.602 | 0.617 | 0.625 |
| M5 | 0.606 | 0.608 | 0.592 | 0.601 | 0.611 | 0.643 | 0.613 | 0.636 | 0.612 | 0.571 | 0.580 | 0.590 | 0.600 | 0.600 | 0.600 |
| M6 | 0.010 | 0.010 | 0.013 | 0.020 | 0.024 | 0.028 | 0.028 | 0.033 | 0.019 | 0.026 | 0.031 | 0.028 | 0.025 | 0.024 | 0.023 |
| M7 | 0.054 | 0.062 | 0.075 | 0.093 | 0.091 | 0.101 | 0.107 | 0.117 | 0.135 | 0.157 | 0.167 | 0.172 | 0.182 | 0.190 | 0.196 |
| M8 | 100 | 94.6 | 112.7 | 134.8 | 175.0 | 213.6 | 217.8 | 266.0 | 175.5 | 241.9 | 301.1 | 299.3 | 286.8 | 277.0 | 173.7 |
| C1 | 21.2 | 21 | 20.1 | 19.9 | 17.8 | 17.5 | 17 | 16.7 | 16.4 | 17.4 | 16.8 | 17 | 17.1 | 17.4 | 18.1 |
| C2 | 2.06 × 10⁻⁵ | 2.05 × 10⁻⁵ | 2.04 × 10⁻⁵ | 2.16 × 10⁻⁵ | 1.99 × 10⁻⁵ | 1.90 × 10⁻⁵ | 1.75 × 10⁻⁵ | 1.62 × 10⁻⁵ | 1.52 × 10⁻⁵ | 1.58 × 10⁻⁵ | 1.49 × 10⁻⁵ | 1.45 × 10⁻⁵ | 1.41 × 10⁻⁵ | 1.36 × 10⁻⁵ | 1.35 × 10⁻⁵ |
| C3 | 0.210 | 0.913 | 0.943 | 1.670 | 0.234 | 0.563 | 0.360 | 0.181 | 0.308 | 1.405 | 0.305 | 0.675 | 0.583 | 0.505 | 0.936 |
| C4 | 0.017 | 0.083 | 0.094 | 0.169 | 0.027 | 0.072 | 0.051 | 0.018 | 0.029 | 0.149 | 0.029 | 0.053 | 0.045 | 0.037 | 0.065 |
| C5 | 0.061 | 0.007 | 0.005 | −0.061 | 0.078 | 0.049 | 0.080 | 0.072 | 0.059 | −0.039 | 0.060 | 0.024 | 0.030 | 0.034 | 0.004 |
| C6 | 0.952 | 0.146 | 0.174 | 0.139 | 1.732 | 0.265 | 0.163 | 1.095 | −0.081 | 0.480 | −0.025 | 0.373 | 0.323 | 0.193 | 0.230 |
| C7 | 0.231 | 0.229 | 0.217 | 0.215 | 0.192 | 0.189 | 0.184 | 0.182 | 0.179 | 0.192 | 0.183 | 0.188 | 0.190 | 0.196 | 0.208 |
Table 3.
Total variance explanation of resource security in oil early warning system.
| Factor | The Initial Eigenvalues | Extracting Square Loaded | Rotating Square Loaded | ||||||
|---|---|---|---|---|---|---|---|---|---|
| Totals | Variance Contribution Rate (%) | Cumulative Variance Contribution Rate (%) | Totals | Variance Contribution Rate (%) | Cumulative Variance Contribution Rate (%) | Total | Variance Contribution Rate (%) | Cumulative Variance Contribution Rate (%) | |
| 1 | 4.603 | 57.542 | 57.542 | 4.603 | 57.542 | 57.542 | 4.165 | 52.057 | 52.057 |
| 2 | 1.449 | 18.109 | 75.651 | 1.449 | 18.109 | 75.651 | 1.888 | 23.594 | 75.651 |
| 3 | 0.978 | 12.222 | 87.873 | ||||||
| 4 | 0.469 | 5.863 | 93.736 | ||||||
| 5 | 0.391 | 4.892 | 98.628 | ||||||
| 6 | 0.066 | 0.828 | 99.456 | ||||||
| 7 | 0.032 | 0.395 | 99.851 | ||||||
| 8 | 0.012 | 0.149 | 100.000 | ||||||
Table 4.
Rotational component matrix of resource security in oil early warning system.
| Indicators | Factor | |
|---|---|---|
| 1 | 2 | |
| R1 | 0.969 | 0.042 |
| R2 | 0.946 | 0.189 |
| R3 | −0.827 | 0.522 |
| R4 | −0.134 | −0.381 |
| R5 | −0.712 | 0.356 |
| R6 | 0.442 | −0.744 |
| R7 | −0.185 | 0.843 |
| R8 | 0.945 | −0.203 |
Table 5.
Total variance explanation of market security in oil early warning system.
| Factor | The Initial Eigenvalues | Extracting Square Loaded | Rotating Square Loaded | ||||||
|---|---|---|---|---|---|---|---|---|---|
| Totals | Variance Contribution Rate (%) | Cumulative Variance Contribution Rate (%) | Totals | Variance Contribution Rate (%) | Cumulative Variance Contribution Rate (%) | Total | Variance Contribution Rate (%) | Cumulative Variance Contribution Rate (%) | |
| 1 | 4.661 | 58.260 | 58.260 | 4.661 | 58.260 | 58.260 | 4.643 | 58.037 | 58.037 |
| 2 | 1.679 | 20.984 | 79.244 | 1.679 | 20.984 | 79.244 | 1.697 | 21.207 | 79.244 |
| 3 | 1.148 | 14.345 | 93.589 | ||||||
| 4 | 0.290 | 3.624 | 97.213 | ||||||
| 5 | 0.138 | 1.726 | 98.939 | ||||||
| 6 | 0.069 | 0.858 | 99.797 | ||||||
| 7 | 0.015 | 0.192 | 99.989 | ||||||
| 8 | 0.001 | 0.011 | 100.000 | ||||||
Table 6.
Rotational component matrix of market security in oil early warning system.
| Indicators | Component | |
|---|---|---|
| 1 | 2 | |
| M1 | 0.972 | 0.094 |
| M2 | 0.137 | 0.836 |
| M3 | −0.739 | 0.022 |
| M4 | 0.889 | −0.383 |
| M5 | −0.087 | 0.550 |
| M6 | 0.858 | 0.471 |
| M7 | 0.807 | −0.563 |
| M8 | 0.973 | 0.019 |
Table 7.
Total variance explanation of consumption security in oil early warning system.
| Factor | The Initial Eigenvalues | Extracting Square Loaded | Rotating Square Loaded | ||||||
|---|---|---|---|---|---|---|---|---|---|
| Totals | Variance Contribution Rate (%) | Cumulative Variance Contribution Rate (%) | Totals | Variance Contribution Rate (%) | Cumulative Variance Contribution Rate (%) | Total | Variance Contribution Rate (%) | Cumulative Variance Contribution Rate (%) | |
| 1 | 3.783 | 54.047 | 54.047 | 3.783 | 54.047 | 54.047 | 3.057 | 43.669 | 43.669 |
| 2 | 2.023 | 28.901 | 82.948 | 2.023 | 28.901 | 82.048 | 2.750 | 39.279 | 82.948 |
| 3 | 0.760 | 10.860 | 93.808 | ||||||
| 4 | 0.409 | 5.840 | 99.648 | ||||||
| 5 | 0.017 | 0.249 | 99.896 | ||||||
| 6 | 0.006 | 0.087 | 99.984 | ||||||
| 7 | 0.001 | 0.016 | 100.000 | ||||||
Table 8.
Rotational component matrix of consumption security in oil early warning system.
| Indicators | Factor | |
|---|---|---|
| 1 | 2 | |
| C1 | 0.177 | 0.949 |
| C2 | 0.004 | 0.874 |
| C3 | 0.951 | 0.242 |
| C4 | 0.911 | 0.259 |
| C5 | −0.940 | −0.240 |
| C6 | −0.599 | 0.324 |
| C7 | 0.221 | 0.893 |
Table 9.
Total variance explanation of China oil early warning system.
| Factor | The Initial Eigenvalues | Extracting Square Loaded | Rotating Square Loaded | ||||||
|---|---|---|---|---|---|---|---|---|---|
| Totals | Variance Contribution Rate (%) | Cumulative Variance Contribution Rate (%) | Totals | Variance Contribution Rate (%) | Cumulative Variance Contribution Rate (%) | Total | Variance Contribution Rate (%) | Cumulative Variance Contribution Rate (%) | |
| 1 | 11.417 | 49.641 | 49.641 | 11.417 | 49.641 | 49.641 | 10.461 | 45.485 | 45.485 |
| 2 | 4.081 | 17.745 | 67.386 | 4.081 | 17.745 | 67.386 | 4.260 | 18.521 | 64.006 |
| 3 | 3.140 | 13.652 | 81.038 | 3.140 | 13.652 | 81.038 | 3.917 | 17.032 | 81.038 |
| 4 | 1.433 | 6.230 | 87.267 | ||||||
| 5 | 1.008 | 4.381 | 91.649 | ||||||
| 6 | 0.641 | 2.789 | 94.437 | ||||||
| 7 | 0.438 | 1.903 | 96.340 | ||||||
| 8 | 0.337 | 1.466 | 97.806 | ||||||
| 9 | 0.316 | 1.375 | 99.181 | ||||||
| 10 | 0.087 | 0.378 | 99.559 | ||||||
| 11 | 0.053 | 0.232 | 99.792 | ||||||
| 12 | 0.027 | 0.116 | 99.908 | ||||||
| 13 | 0.016 | 0.071 | 99.979 | ||||||
| 14 | 0.005 | 0.021 | 100.000 | ||||||
Table 10.
Rotational component matrix of China oil early warning system.
| Indicators | Factor | Indicators | Factor | Indicators | Factor | ||||||
|---|---|---|---|---|---|---|---|---|---|---|---|
| 1 | 2 | 3 | 1 | 2 | 3 | 1 | 2 | 3 | |||
| R1 | 0.923 | 0.143 | −0.078 | M1 | −0.932 | −0.055 | −0.129 | C1 | 0.941 | 0.057 | 0.211 |
| R2 | 0.909 | −0.003 | −0.063 | M2 | −0.188 | 0.834 | 0.234 | C2 | 0.753 | 0.616 | 0.092 |
| R3 | −0.748 | −0.632 | 0.077 | M3 | 0.769 | 0.046 | 0.280 | C3 | 0.160 | 0.006 | 0.962 |
| R4 | −0.133 | 0.443 | 0.527 | M4 | −0.872 | −0.417 | 0.127 | C4 | 0.150 | 0.185 | 0.938 |
| R5 | −0.623 | −0.498 | 0.221 | M5 | 0.071 | 0.410 | −0.602 | C5 | −0.173 | −0.094 | −0.955 |
| R6 | 0.372 | 0.698 | −0.162 | M6 | −0.875 | 0.355 | −0.102 | C6 | 0.026 | 0.556 | −0.329 |
| R7 | −0.130 | −0.717 | −0.189 | M7 | −0.756 | −0.605 | 0.145 | C7 | −0.906 | −0.103 | 0.250 |
| R8 | 0.928 | 0.311 | −0.029 | M8 | −0.922 | −0.135 | −0.086 | ||||
Table 11.
Component score coefficient matrix of China oil early warning system.
| Indicators | Factor | Indicators | Factor | Indicators | Factor | ||||||
|---|---|---|---|---|---|---|---|---|---|---|---|
| 1 | 2 | 3 | 1 | 2 | 3 | 1 | 2 | 3 | |||
| R1 | 0.097 | −0.026 | −0.038 | M1 | −0.099 | 0.046 | −0.013 | C1 | 0.098 | −0.044 | 0.037 |
| R2 | 0.105 | −0.065 | −0.038 | M2 | −0.084 | 0.249 | 0.085 | C2 | 0.041 | 0.121 | 0.021 |
| R3 | −0.043 | −0.122 | 0.022 | M3 | 0.078 | −0.033 | 0.056 | C3 | −0.004 | 0.014 | 0.247 |
| R4 | −0.058 | 0.145 | 0.151 | M4 | −0.074 | −0.052 | 0.043 | C4 | −0.017 | 0.064 | 0.245 |
| R5 | −0.042 | −0.090 | 0.060 | M5 | −0.006 | 0.094 | −0.148 | C5 | −0.004 | 0.015 | −0.242 |
| R6 | −0.002 | 0.164 | −0.034 | M6 | −0.122 | 0.156 | 0.002 | C6 | −0.028 | 0.144 | −0.073 |
| R7 | 0.039 | −0.194 | −0.063 | M7 | −0.048 | −0.112 | 0.041 | C7 | 0.104 | −0.085 | 0.042 |
| R8 | 0.085 | 0.022 | −0.022 | M8 | −0.094 | 0.024 | −0.004 | ||||
Table 12.
Score of China oil system security evaluation factors from 2001 to 2015.
| Year | Rank | ||||
|---|---|---|---|---|---|
| 2001 | 2.147 | −0.476 | −1.111 | 0.700 | 4 |
| 2002 | 1.502 | 0.228 | 0.227 | 0.764 | 3 |
| 2003 | 1.446 | 0.107 | 0.661 | 0.790 | 2 |
| 2004 | 0.705 | 0.975 | 1.936 | 0.830 | 1 |
| 2005 | −0.117 | 1.675 | −0.848 | 0.133 | 5 |
| 2006 | −0.198 | 0.752 | −0.459 | −0.029 | 7 |
| 2007 | −0.326 | 0.314 | −0.771 | −0.211 | 8 |
| 2008 | −0.952 | 1.582 | −1.108 | −0.313 | 10 |
| 2009 | −0.178 | −0.699 | −0.819 | −0.350 | 11 |
| 2010 | −0.942 | 0.319 | 2.247 | 0.012 | 6 |
| 2011 | −0.916 | −0.514 | −0.273 | −0.558 | 15 |
| 2012 | −0.885 | −0.281 | 0.185 | −0.423 | 12 |
| 2013 | −0.748 | −0.875 | −0.078 | −0.516 | 13 |
| 2014 | −0.611 | −1.195 | −0.191 | −0.532 | 14 |
| 2015 | 0.073 | −1.912 | 0.312 | −0.268 | 9 |
© 2018 by the authors. Licensee MDPI, Basel, Switzerland. This article is an open access article distributed under the terms and conditions of the Creative Commons Attribution (CC BY) license (http://creativecommons.org/licenses/by/4.0/).
Share and Cite
MDPI and ACS Style
Wang, Q.; Tang, H.; Yuan, X.; Wang, M.; Xiao, H.; Ma, Z. An Early Warning System for Oil Security in China. Sustainability 2018, 10, 283. https://doi.org/10.3390/su10010283
AMA Style
Wang Q, Tang H, Yuan X, Wang M, Xiao H, Ma Z. An Early Warning System for Oil Security in China. Sustainability. 2018; 10(1):283. https://doi.org/10.3390/su10010283
Chicago/Turabian StyleWang, Qingsong, Hongrui Tang, Xueliang Yuan, Mansen Wang, Hongkun Xiao, and Zhi Ma. 2018. "An Early Warning System for Oil Security in China" Sustainability 10, no. 1: 283. https://doi.org/10.3390/su10010283
Note that from the first issue of 2016, this journal uses article numbers instead of page numbers. See further details here.