Article

Mixed Intercropping of Wheat and White Clover to Enhance the Sustainability of the Conventional Cropping System: Effects on Biomass Production and Leaching of Mineral Nitrogen

1
Agriculture Research, Ltd., Zahradní 1, 664 41 Troubsko, Czech Republic
2
Department of Agrosystems and Bioclimatology, Faculty of AgriSciences, Mendel University in Brno, Zemědělská 1, 613 00 Brno, Czech Republic
3
Department of Environmentalistics and Natural Resources, Faculty of Regional Development and International Studies, Mendel University in Brno, Zemědělská 1, 613 00 Brno, Czech Republic
4
Department of Applied and Landscape Ecology, Faculty of AgriSciences; Mendel University in Brno, Zemědělská 1, 613 00 Brno, Czech Republic
*
Author to whom correspondence should be addressed.
Sustainability 2018, 10(10), 3367; https://doi.org/10.3390/su10103367
Submission received: 3 August 2018 / Revised: 27 August 2018 / Accepted: 16 September 2018 / Published: 20 September 2018
(This article belongs to the Section Sustainable Agriculture)

Abstract

:
The main goal of our research was to compare the mixed intercropping (MC) of winter wheat (Triticum aestivum) and white clover (Trifolium repens) with the sole cropping of Triticum aestivum, during two growing seasons (2012–2014), in a lysimetric experiment. We aimed to investigate the effect of the above growing system on total biomass production, grain yield and leaching of mineral nitrogen (Nmin). Four variants of intercropping (0 kg N/ha; 112 kg N/ha; 112 kg N/ha + 1.25 L of humic acids/ha; 70 kg N + 0.65 L of humic acids/ha) and two variants of sole cropping (0 kg N/ha; 140 kg N/ha) were used. Research results showed a good potential for growing wheat in the mixed cropping system without any negative effect on grain and total biomass production. No significant differences were found between the variants where winter wheat was grown with white clover (70 and 112 kg N/ha), and variants with sole wheat (140 kg N/ha), in both years of the experiment. The loss of Nmin from the soil was affected by the application of N fertilizer and mixed intercropping system. During the experiment, the loss of Nmin was higher by 20% in the variant using the sole winter wheat (140 kg N/ha), than in the MC variants.

Graphical Abstract

1. Introduction

The global challenge to meet the increased food demand and to protect the quality of the environment will be won or lost by the growing systems producing corn, rice and wheat [1].
Intensive agriculture provides high yields but can also cause serious environmental problems [2]. Over the past century, the development of new agricultural practices to meet the growing global demand for food disrupted the N cycle within agro-ecosystems [3]. Reactive nitrogen (all oxidizable N forms) is not only an important nutrient to ensure human nutrition but also an agent significantly disturbing the agro-ecosystem [4,5,6]. The excessive application of N mineral fertilizers causes serious problems [5]. During the 20th century, farmers around the world replaced leguminous crops as a natural source of N with synthetic fertilizers [7,8]. Today’s food and energy production are not feasible without the use of N synthetic fertilizers [8]. To sustain global food supply, nearly 100 million tons of N are produced annually using the Haber-Bosch process [9].
Current methods for determining the need for N fertilizer in winter wheat are based on agronomic assumptions of yield targets and on the fixed dose of N taken from the grain unit produced [10,11]. The problem with the “optimization of the fertilization plan” is that plants absorb only a small percentage of applied mineral nutrients. A great amount of nutrients (30–50%) can subsequently be irretrievably lost, especially in the case of mineral fertilizers [12].
The applied N, which is not taken up by the plants or immobilized in the soil, is susceptible to volatilization, denitrification, and loss by leaching. Total N-use efficiency in the growing system can be increased by the higher efficiency of N from N inputs, or by reducing the amount of N lost from soil resources [1]. For agricultural systems to remain productive, the supply of nutrients removed or lost from the soil has to be replenished [13]. As to nitrogen, inputs to the agricultural system may be partially replaced by the biological fixation of atmospheric N2 (BFN) provided by leguminous species [13,14,15]. The use of leguminous plants in the rotation or mixed crop is, nowadays, regarded as an alternative to the sustainable way of introducing N into the growing systems [16,17,18].
One way to reintroduce leguminous plants into crop rotation is to use mixed cultures. A mixed culture means growing two different crops on the same plot at the same time, during the growing season. These are mainly mixtures of legumes and non-legumes. The need for incorporating these crops into grain crops, to increase the soil fertility and sustainability of agricultural systems, is often neglected, but the positive influence of leguminous crops in the crop rotation is generally recognized [19,20].
The main objective of the presented research study was to evaluate the possibility of growing wheat in the mixed culture with legumes (white clover), and the influence of this method on grain yield, and leaching of mineral nitrogen Nmin.

2. Materials and Methods

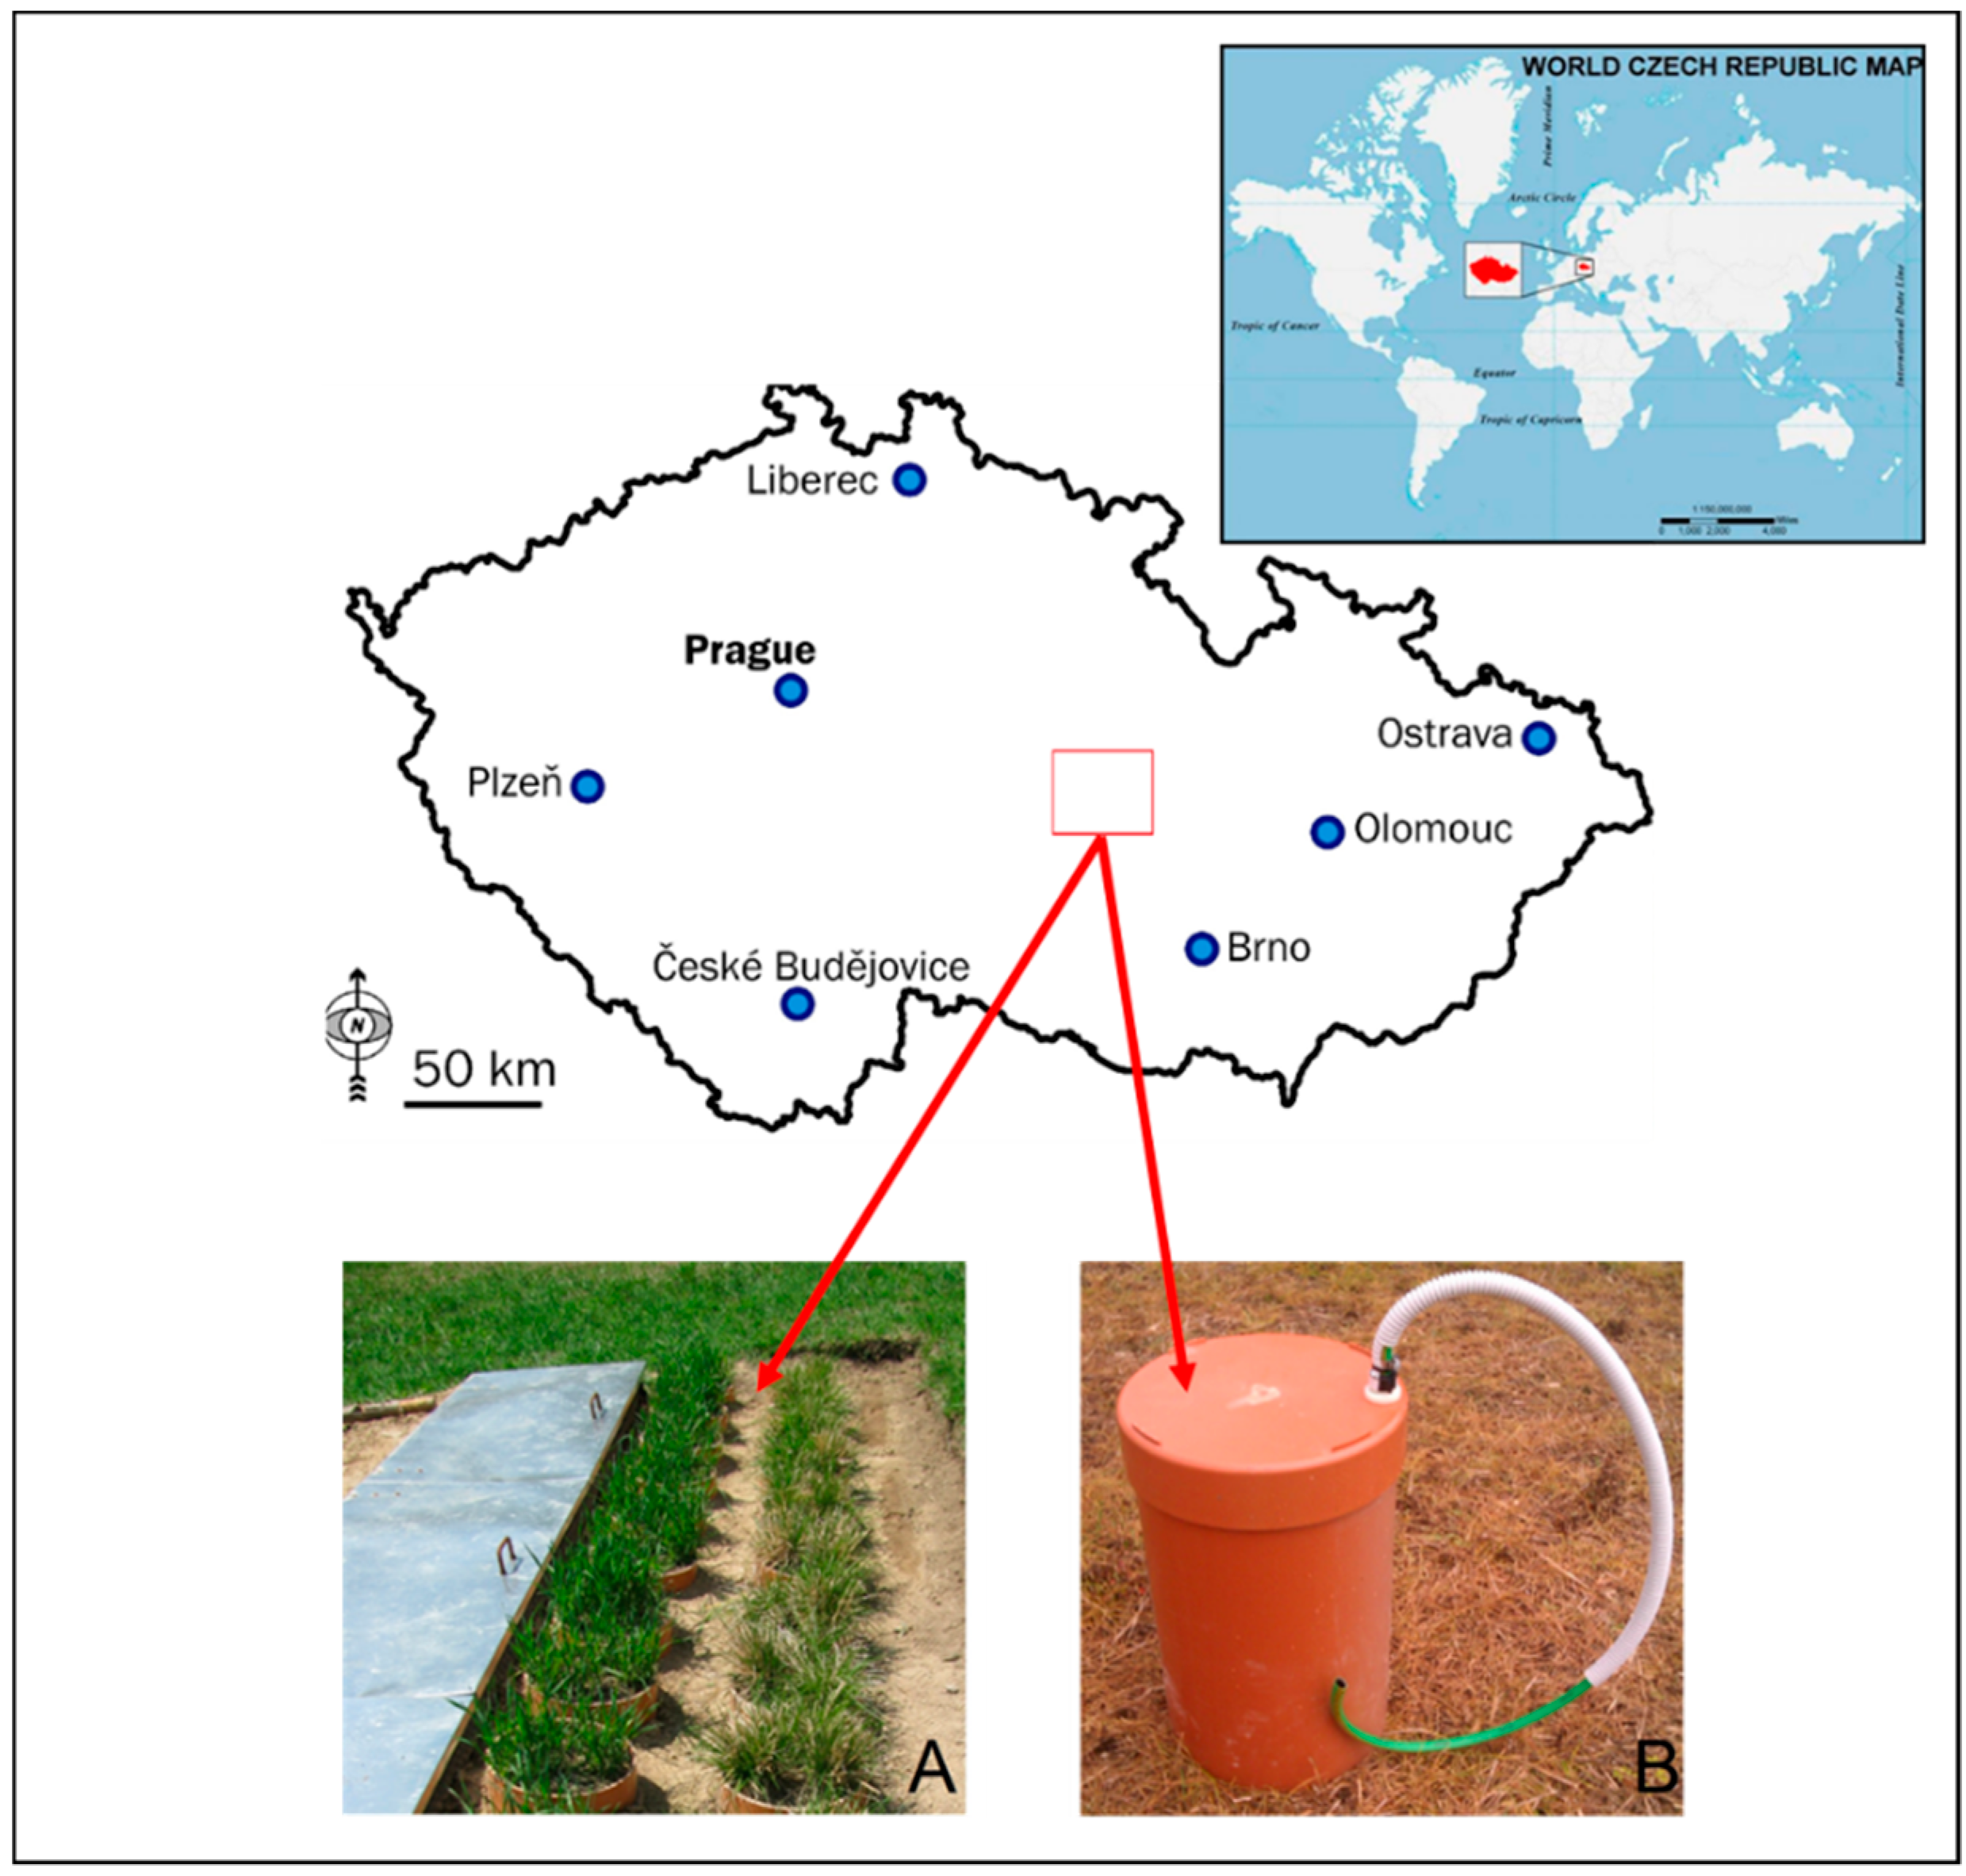
2.1. Design of the Experiment

Winter wheat (Triticum aestivum, cv. Golem) and white clover (Trifolium repens, cv. Dolina 4n) were used as model plants in the presented experiment. Seed crops were purchased each year prior to the planned-sowing of cv. Golem ELITA (a company) semenarian, a.s., and cv. Dolina 4n from the Agriculture Research, Ltd., (Troubsko, Czech Republic). Germination of Triticum aestivum, cv. Golem was 93% and Trifolium repens, cv. Dolina 4n was 82%. The experiment consisted of six variants, each one with three replications. These were divided into two groups: sole crops (SC) and mixed crops (MC), with different doses of fertilizers (Table 1). Fertilizers used during the experiment were as follows: DAM 390 (liquid nitrogen fertilizer) and Lignohumate B (LG B). DAM 390 (nitrogen fertilizer—NF) is a solution of ammonium N and urea, with a weight average N content of 30%. It contains 39 kg of N in 100 L. LG B represents water solution obtained by the hydrolytic-oxidative decomposition of technical lignosulfonates, and can be defined as a mixture of humic and fulvic acids (ratio 1:1), and their salts. NF and LG B were applied as foliar fertilization during the two years of the experiment, DAM as a source of N for plants and LG B to support the soil microbial activity. The fertilizers were applied in three doses each year. The BBCH (Biologische Bundesanstalt, Bundessortenamt und Chemische Industrie) scale was used to identify vegetation stage of winter wheat. The first dose was applied at the end of tillering (BBCH 27–29), the second one during the stage of stem elongation growth (BBCH 30) and the third one after the flag leaf stage (BBCH 39).
Winter wheat and white clover were sown directly (seeds set without pre-germination) into individual pots, seeding rates being 220 kg/ha and 15 kg/ha, respectively. Winter wheat was sown as a sole crop or together with clover as a mixed crop. In both cases, the seed rates were identical.

2.2. Soil Lysimeter

The above-mentioned objective of the presented work was studied in a lysimetric experiment. A lysimetric station was installed in the buffer zone of the underground source of drinking water in Březová nad Svitavou (Bohemian–Moravian Highlands; lat. 49°39′41.82″ N; long. 16°30′1.91″ E; the area of interest is marked with a red square) where forty-year average (1962–2012) of rainfall is 588.47 mm and annual air temperature 7.9 °C. Monthly average temperatures and precipitation amounts during the experiment are shown in Figure 1. Above all, the overview and location of the experiment are shown in Figure 2.
Lysimeters (Appendix A) were filled with 25 kg of topsoil and 25 kg of subsoil; the soil was sampled in the area of our interest. The topsoil and subsoil samples were processed separately by homogenization and sieving (sieve size 10 mm). Selected properties of soils (luvisol modal; sandy loam), used in the experiment, are listed in Table 2.

2.3. Leaching of Mineral Nitrogen

The leaching of Nmin was measured as a concentration of ammonium and nitrate N in the soil leachate, from lysimeters (Appendix A). The soil leachate was monitored three times per week. When a leachate was detected, it was immediately collected, transported and stored at 3.5 °C, before analysis. The analysis of Nmin concentration was made after each sampling of the soil leachates. The distillation–titration method by Muñoz-Huerta et al. [21] was used to determine the Nmin in the soil leachate with the use of the Distillation Unit Behr S3 (Behr Labor Technik, Düsseldorf, Germany). The concentration of Nmin was always determined in the particular volume of the soil leachate; therefore, the loss of Nmin from the individual lysimeters was expressed in mg/L.

2.4. Analysis of Plant Biomass

At the end of each growing season (2013; 2014), grain production and total production of above-ground biomass were measured by taking all the plants, and their parts, (stems, leaves, husks, etc.) from the individual lysimeters, for dry weight determination. After the determination of production parameters, the grain and straw samples were subjected to the determination of total nitrogen content (Ntot) by high-temperature (1000 °C) dry combustion method, according to Reference [22], using the automatic analyzer LECO CNS 2000 (St. Joseph, MI, USA). The values of Ntot were used to calculate the N content in the grain and the straw, which was necessary for determining N use efficiency.

2.5. Soil Properties

The selected physical and chemical properties of topsoil and subsoil were determined in homogenized soil samples, after a twenty-day incubation period, at 19 °C. Nutrients available to plants (P, K, Ca, Mg) were extracted using the Mehlich III reagent, and the concentrations of individual nutrients were determined according to Reference [23]. Ctot and Ntot of the soil samples were determined according to Reference [24,25] using the LECO CNS 2000 automatic analyzer (St. Joseph, MI, USA).

2.6. Data Treatment

Exploratory data analysis was used to assess the measured data of individual parameters to verify the homogeneity and normality of the data collected. Potential differences in Nmin leaching, biomass production and grain yield between the individual experiment variants were analyzed by using a one-way analysis of variance (ANOVA), combined with post-hoc Tukey’s HSD test, at p < 0.05 level of significance. Principal Component Analysis (PCA) and regression analysis were used to identify potential relationships between the respective parameters. All analyses were performed using the Statistica 12 software (StatSoft, Dell Software, Aliso Viejo, CA, USA).

3. Results and Discussion

3.1. Plant Biomass—Biomass Production
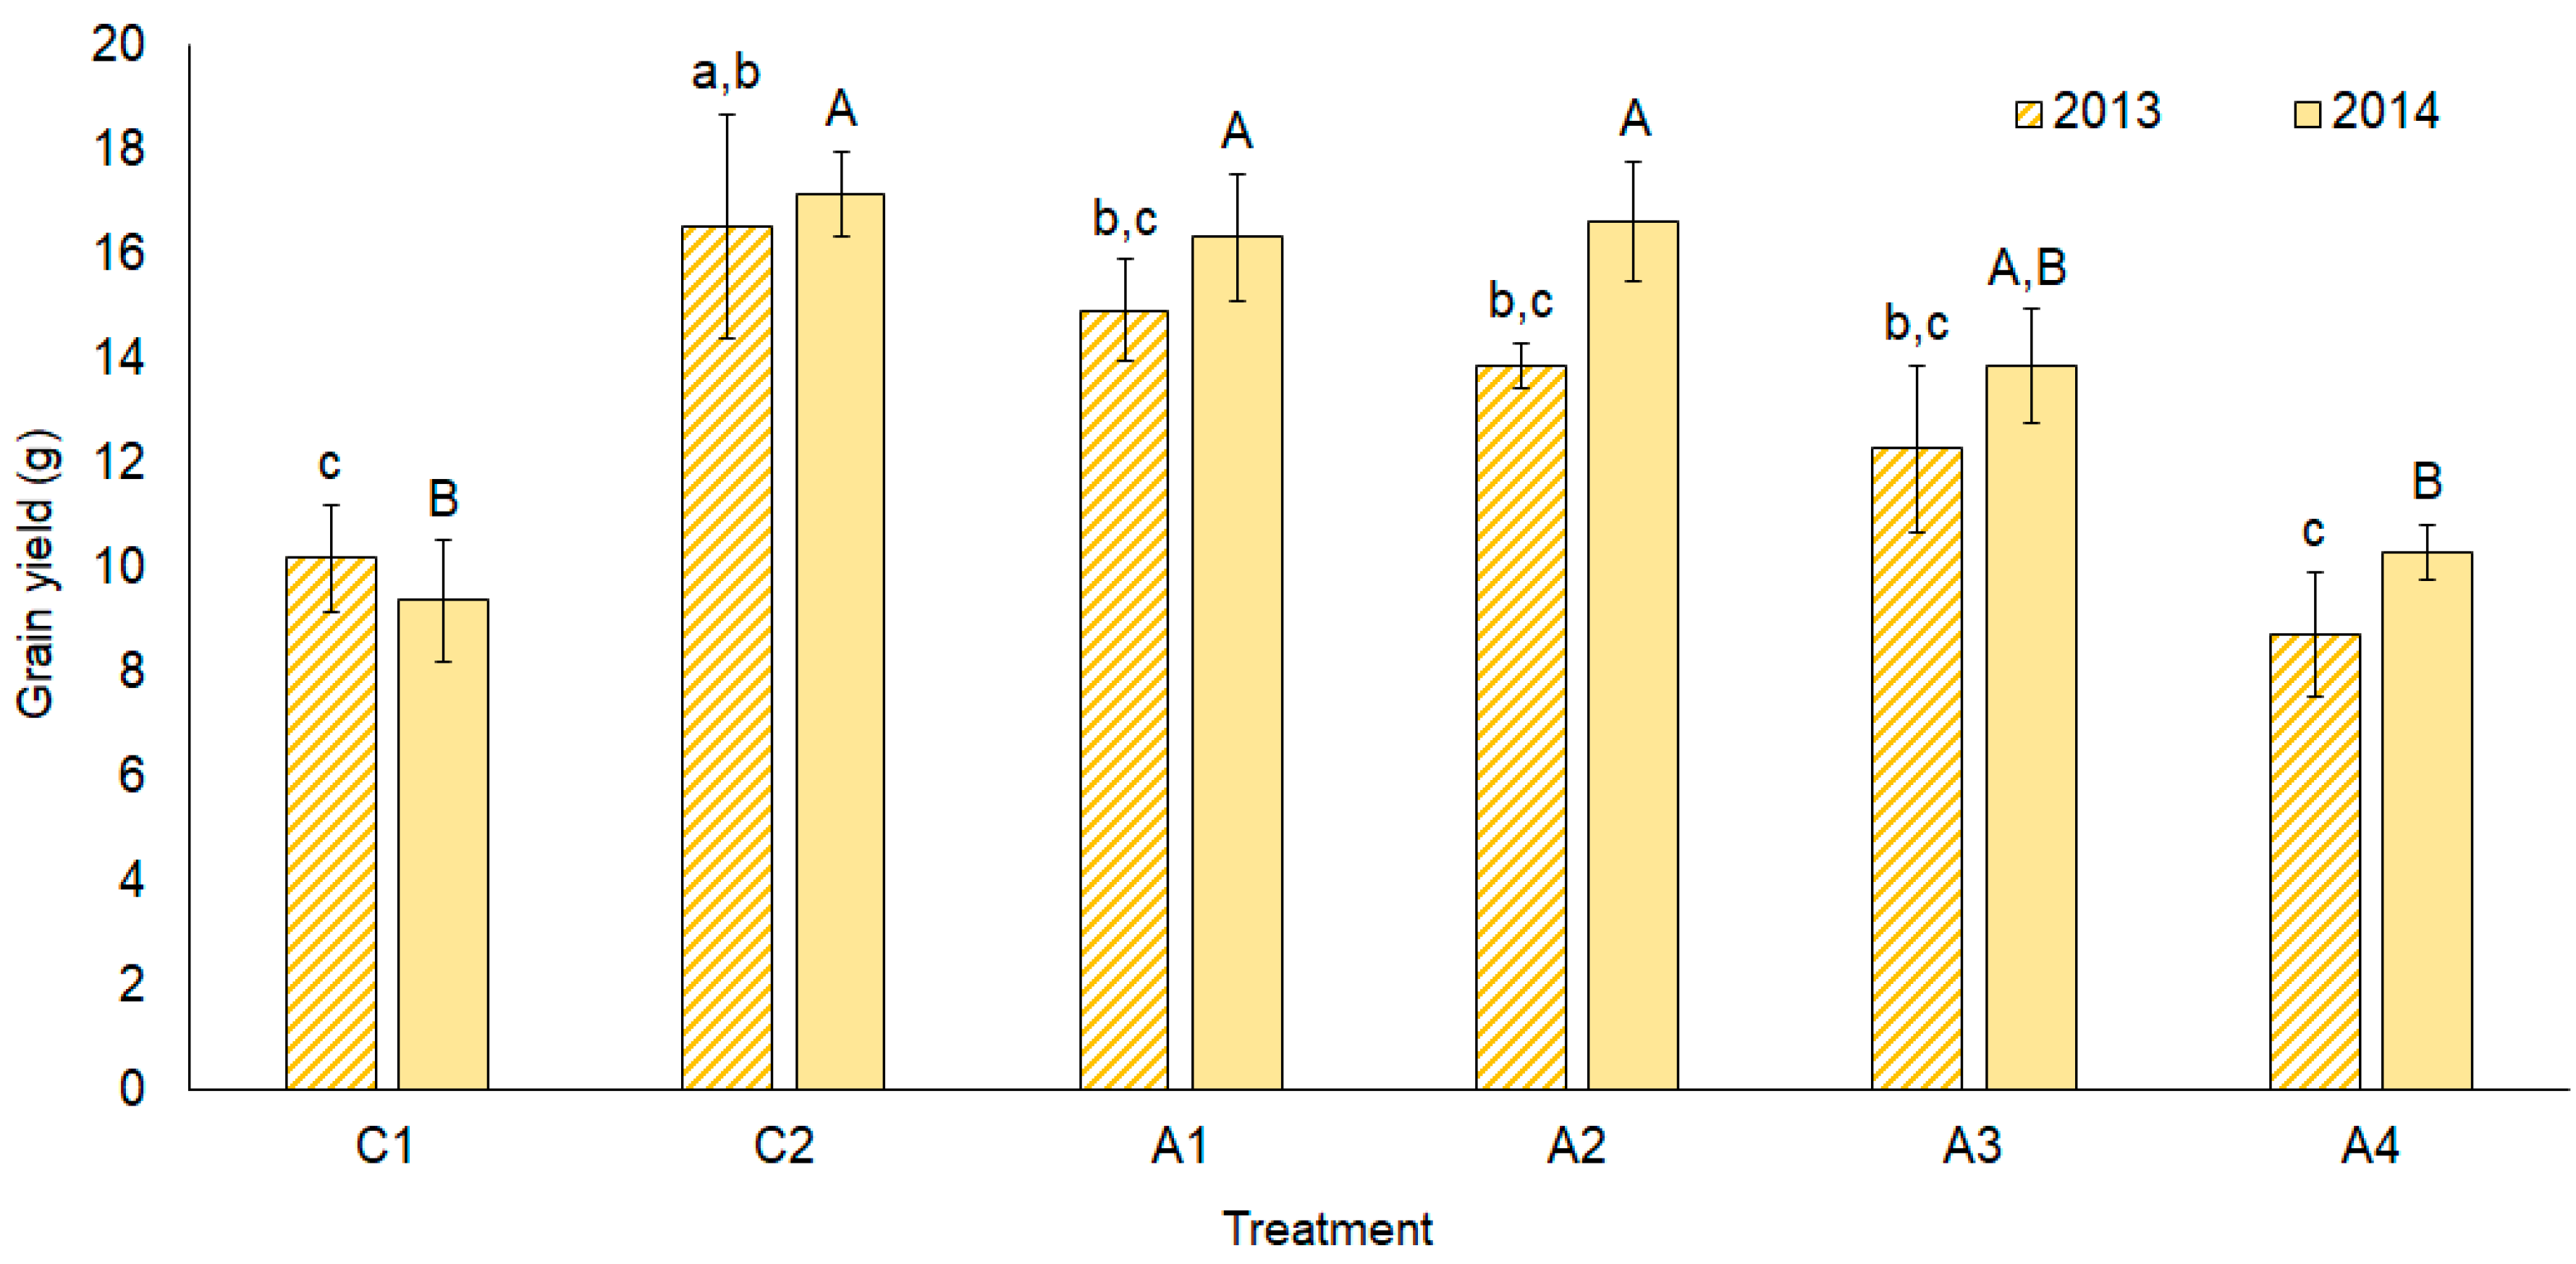
Biomass was harvested from the model plants of Triticum aestivum, in 2013 and 2014, at the stage of their harvest maturity (BBCH 89). Total above-ground plant biomass production of the respective variants, i.e., straw, grain, and husk, is shown in Figure 3. Grain production is shown separately in Figure 4.
In the first year of the experiment (2013), the total production of biomass in variants C2, A1–A3 was at the same level (±50 g) and no significant statistical differences were found between these variants. On the other hand, the demonstrably lowest production of plant biomass was found in the control variant (C1 = 34 g), compared to all other variants. The second lowest value was found in variant A4 (38 g), where MC was used without the addition of fertilizers. Biomass production in this variant was significantly lower, as compared to the fertilized control C2 and MC variants, where NF fertilization (112 and 70 kg N/ha year) and LG B (1.25 and 0.62 L of LG B/ha) were used, i.e., variants A2 and A3. On the other hand, no significant difference was found between the variants A1, A2, and A3. Thus, no significant influence of LG B application on the production of biomass could be considered. However, if we compared the values of variants A1, A2, and A3, we could see that the higher N dose in variant A1 (+20% as compared to A2 and A3) had a rather negative influence on the biomass production in this variant.
The same course of values was found also in the second year of the experiment (2014) but there was no difference between variants C2 (SC—112 kg N ha−1) and MC (A1–A4). The demonstrably lowest value of total plant biomass production was found again in variant C1 (33 g). The results show that the non-fertilized variant A4 produced, approximately, the same amount of biomass (44 g) as the fertilized variants (average C2; A1; A2; A3 = 46 g), in 2014. In addition, the values were analyzed for the detection of potential differences between the years (paired t-test, P < 0.05). The results of total biomass production indicated that the model plants in variant A4 obtained the sufficient amount of N, through BFN from legumes. This is because if they would not have had sufficient N, they would not have been able to produce the amount of biomass nearing the level of the fertilized variant C2, and higher than the unfertilized variant C1, which is consistent with [19,26,27,28,29]. On the other hand, they point to a potential problem of the Nmin addition, in terms of its usability, as variants A1–A3 were applied from 112 to 72 kg N ha−1, presenting quite large amounts of Nmin, without any positive effect.

3.2. Grain Yield

Grain production (Figure 4) was assessed in 2013 and 2014. The highest grain production was found in variants C2, A1, A2, and A3, as compared to the control variant of C1 (SC—0 kg N/ha year) and variant A4 (MC—0 kg N/ha year), in both years of the experiment (2013 and 2014). The yield was about 15 g in 2013, and 16 g in 2014, in the variants C2–A3. The lowest values (±10 g) of grain production were found in variants C1 and A4 in both years, i.e., in the variants where there was no application of fertilizers (NF + LG B).
In 2013, significant differences were found between variants C1 and C2, and between variants A4 and C2. No significant differences were found between variants C2, A1, A2, and A3. In the following year of 2014, the results were more proving, as significant differences were found between variants where there was no application of NF (C1 and A4), and variants where NF (C2) or the combination of fertilization and MC (A1, A2, A3) was applied.
The results confirm the generally known effect of mineral nitrogen fertilization on the promotion of grain production in Triticum aestivum [29], and subsequently also the fact that using MC with the lower dose of N fertilizer (A1—112 kg N/ha year) did not affect negatively the grain production of Triticum aestivum, as compared to the conventional variant (C2—140 kg N/ha year). Furthermore, the results confirm a possibility for growing wheat in the MC system, with a decreased N input, in the form of mineral fertilizers, which is in accordance with findings of other authors [27,28], and also in accordance with the working hypotheses stated in the goals of our paper. It can be suggested that there is a potential for growing wheat in the MC system without any negative effect on the grain production.

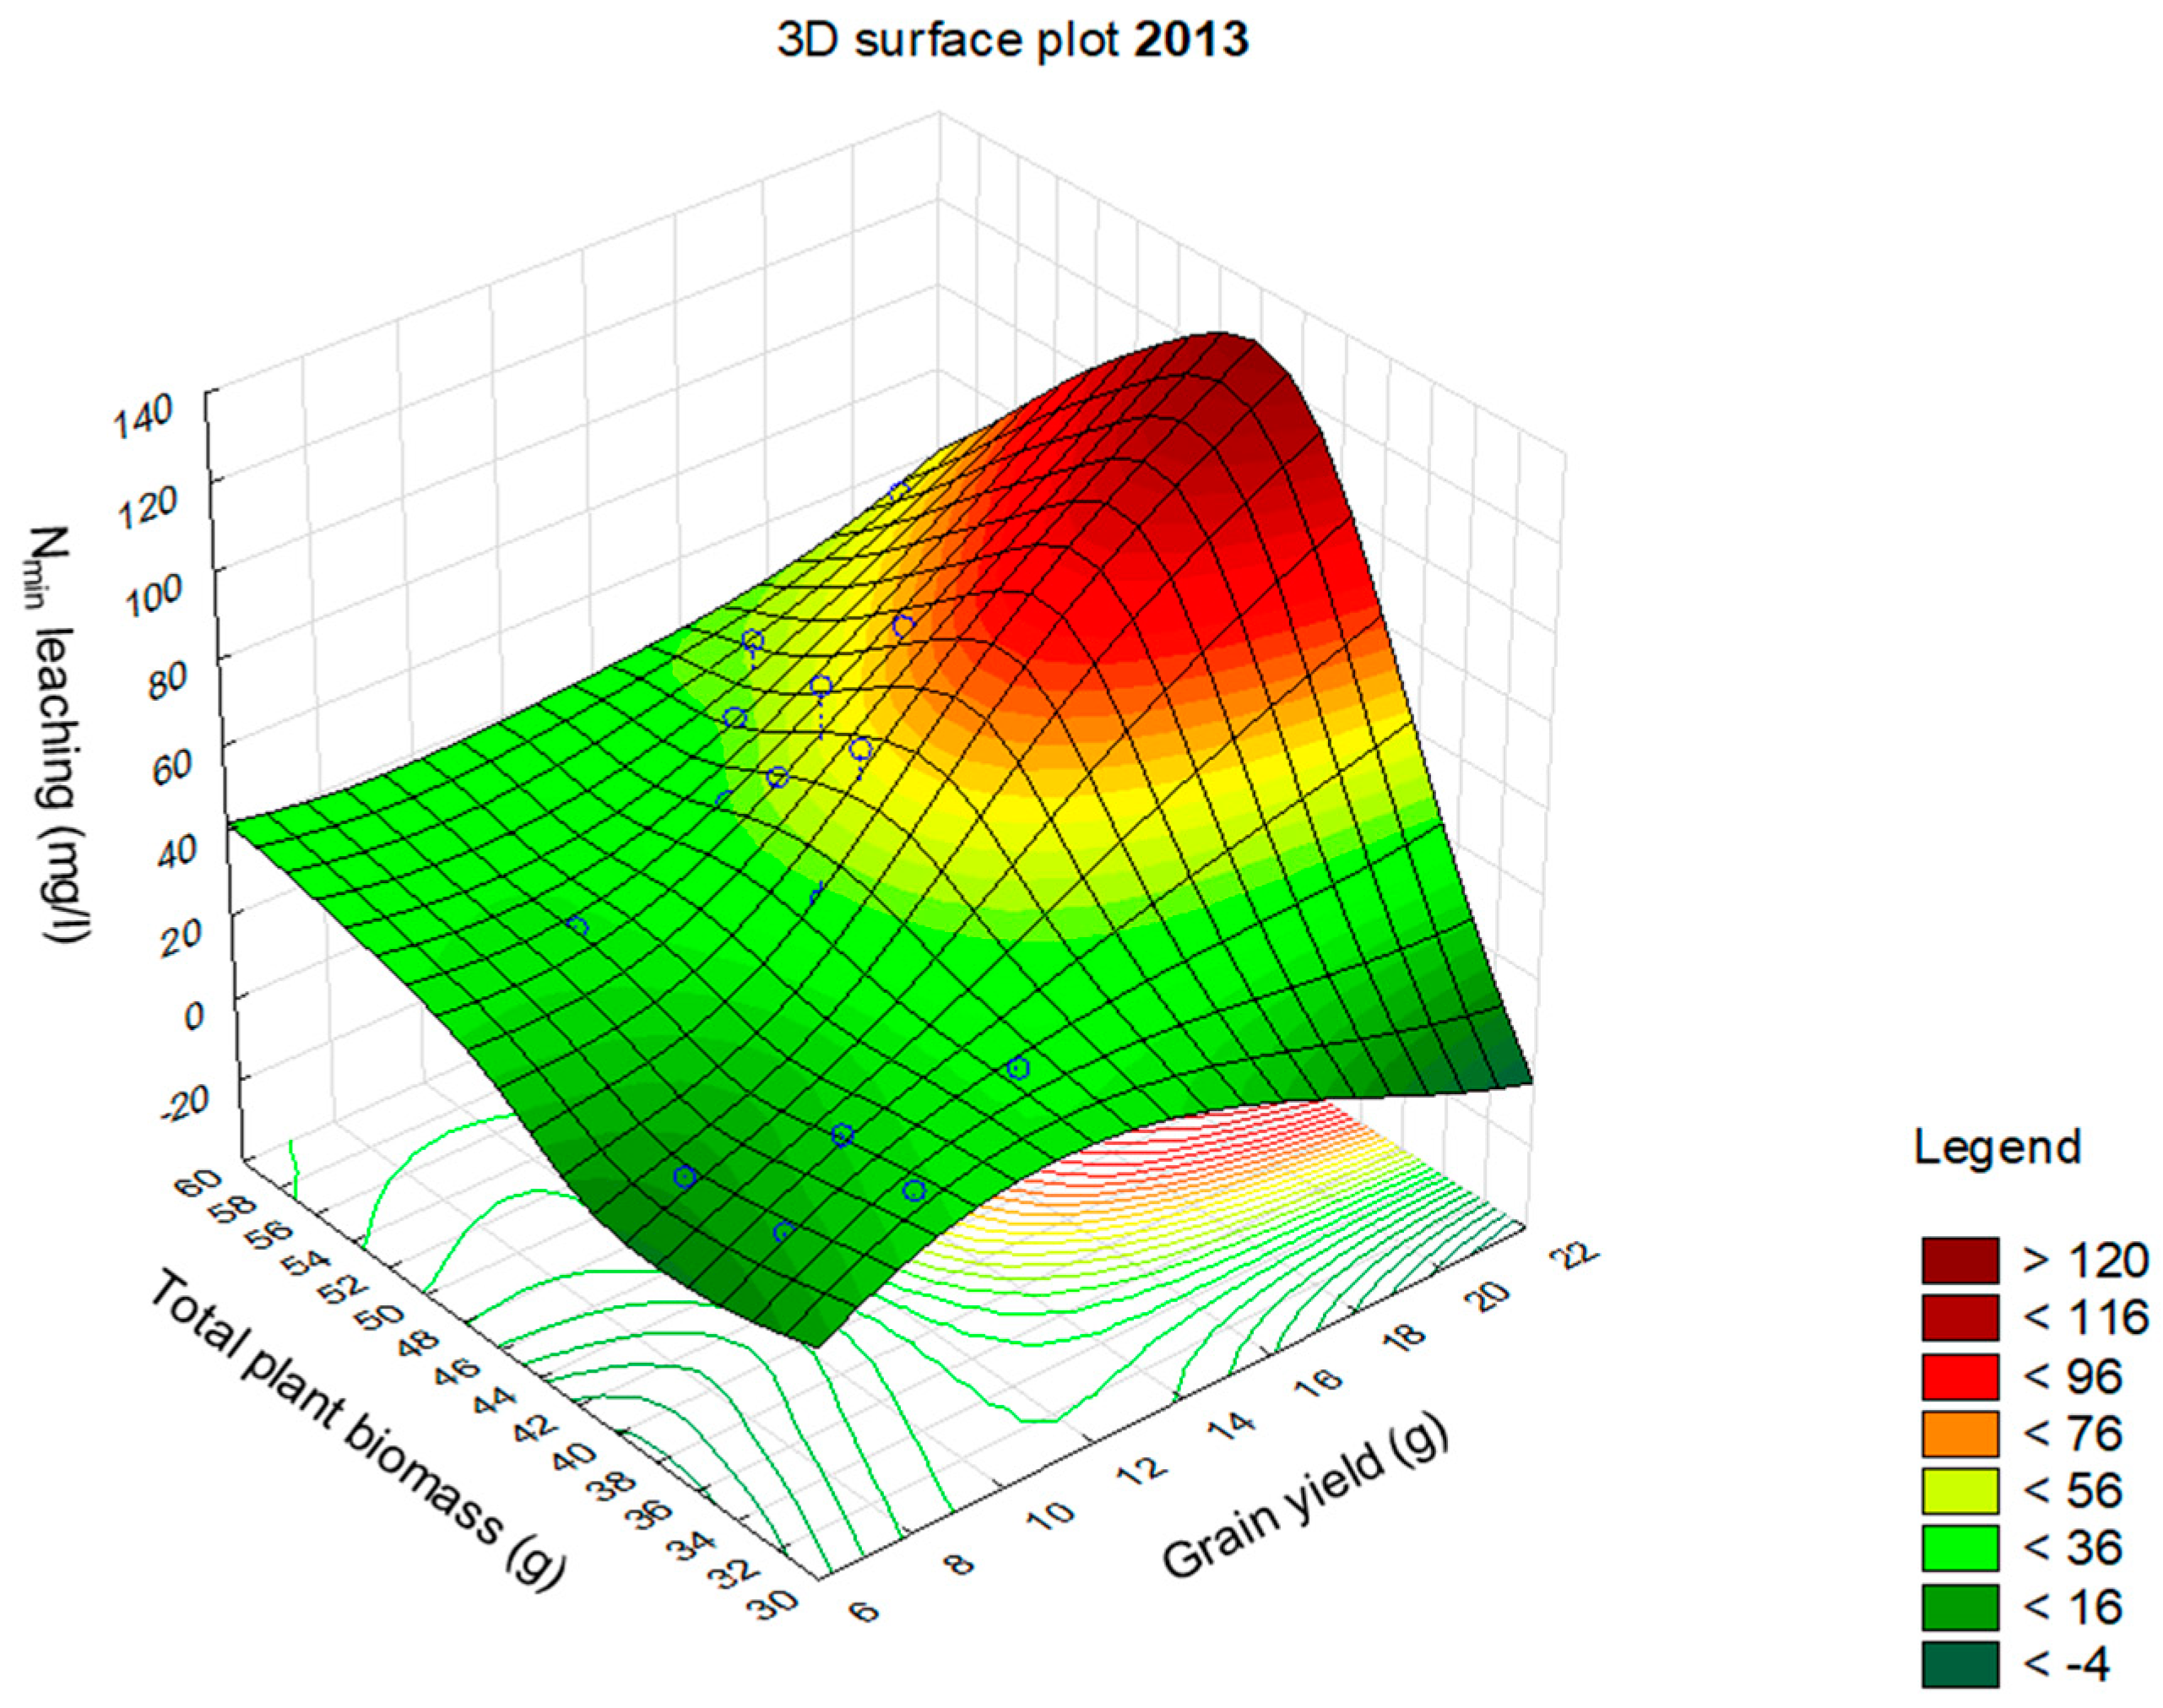
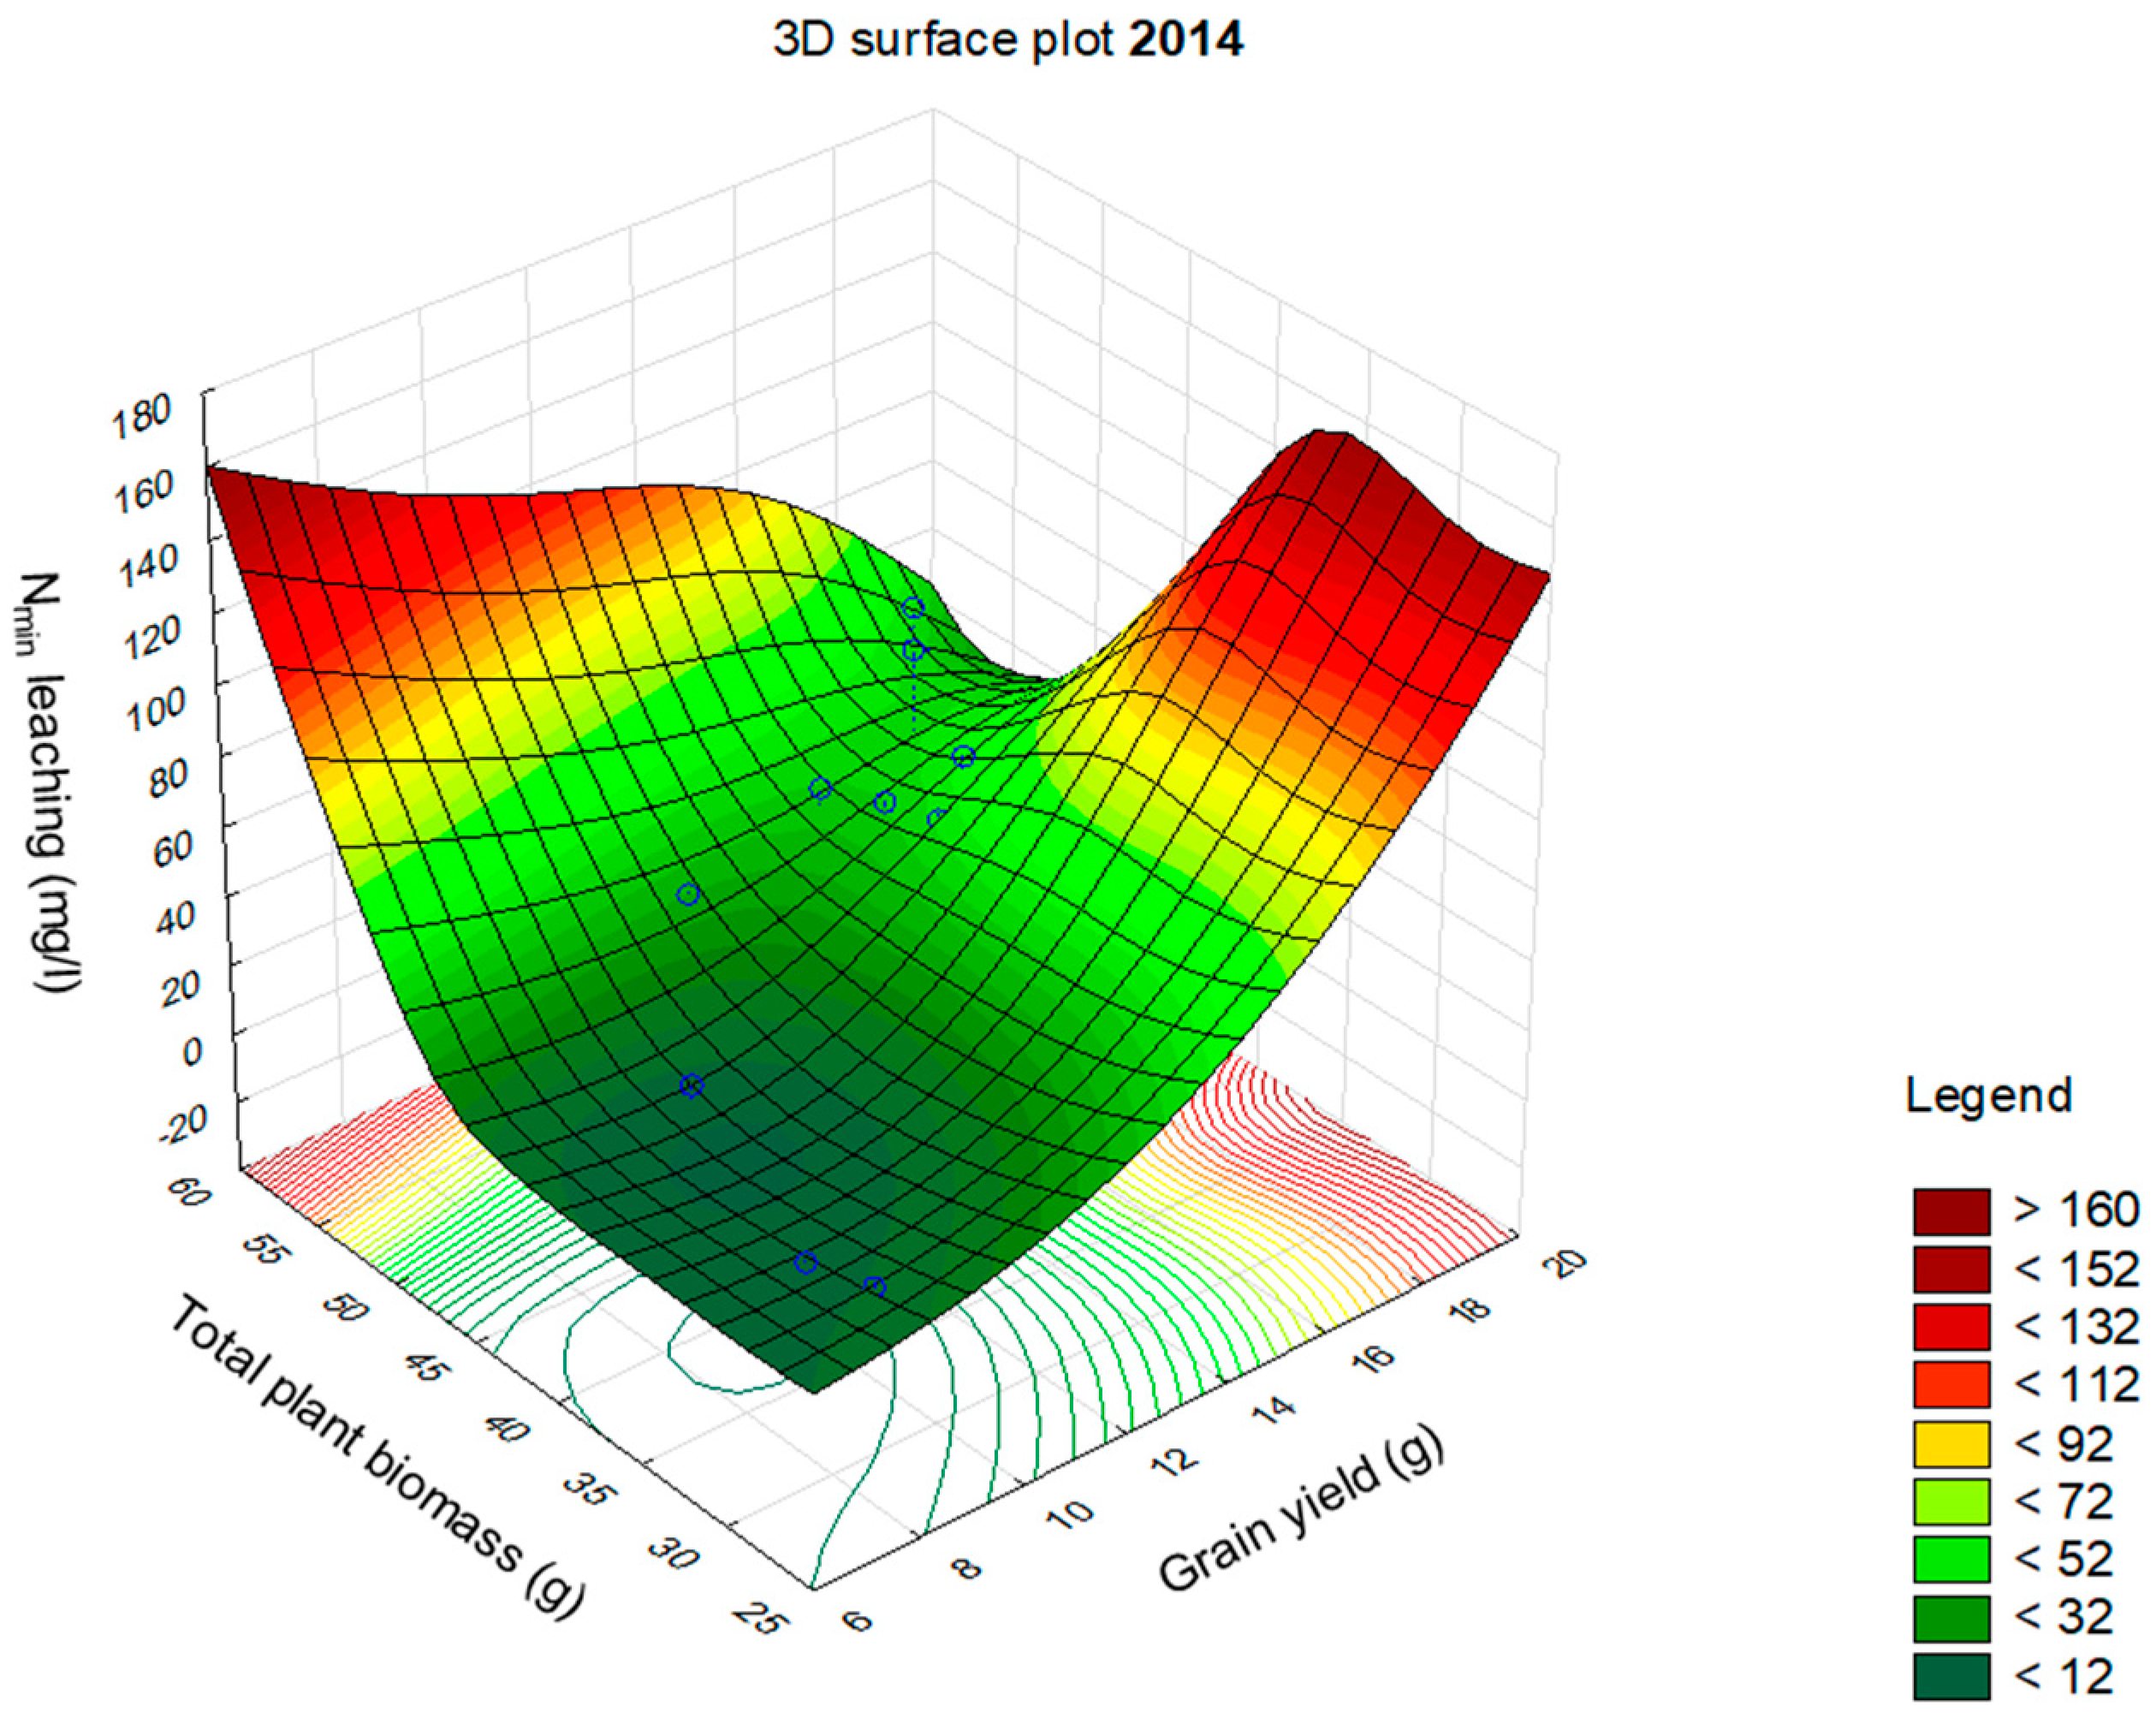
3.3. Leaching of Mineral Nitrogen from Experimental Containers

The loss of Nmin was measured as a concentration of Nmin in the soil leachate, from September 2012 to October 2014, when the lysimetric experiment was terminated. A complete overview of the measured values is presented in Figure 5.
In the first year of the experiment (2013), the highest Nmin leaching was noticed in the MC variant (A1 = 67 mg/L) with the fertilization of 112 kg N/ha. In this variant, a statistically significant difference was found, as compared to all other variants. The second highest leaching (compared to all other variants) was found in variant C2 (55.31 mg/L), fertilized only with NF (140 kg N/ha). Statistically significant differences were found also between the respective MC variants (A1–A4), where the loss of Nmin decreased gradually from A1 to A4. The lowest loss of Nmin, by leaching from the soil was identified in variant A4 (15.38 mg/L), which was significant when compared to all the other variants. The second lowest concentration of Nmin was found in the control variant C1 (28.97 mg/L) and in variant A3 (35.90 mg/L). These values were significant as compared with the other variants.
In the second year of the experiment (2014) statistically significant differences were found again. The lowest leaching of Nmin was recorded in the control variant C1 (15.05 mg/L), and in the non-fertilized variant A1 with MC (15.51 mg/L). Conversely, the absolutely highest loss in 2014 was found in variant C2 (59.67 mg/L). This variant was fertilized only with NF (140 kg N/ha) and wheat was cultivated in the SC system. The value of Nmin loss, measured in this variant, was demonstrably the highest, as compared with the other variants. On the other hand, variants A1–A3 showed the same level of Nmin loss (±40 mg/L), which was approximately 40% lower, as compared to the variant C2 (application of NF, wheat grown as SC).
The values found in the two years (2013 and 2014) of the experiment were influenced by two factors: (1) application of nitrogen fertilizers; (2) use of MC. Relations between the most important parameters are presented in Figure 6; two main factors were determined. The first group of variables (PC 1) described 83.29% and 83.69% of the variance, in 2013 and 2014, respectively. This factor or PC 1 correlated inversely with Nmin leaching (R = −0.89 in 2013, and R = −0.87 in 2014), and biomass parameters correlated inversely to (R = −0.89 in 2013, and R = −0.90 in 2014). Overall, PC1 could characterize the influence of growing technology, on the loss of Nmin from the soil, and the production of grain or total biomass. Measured values of the total biomass showed small differences between variants C2 to A3 but were relatively significant in the loss of Nmin. This assumption could confirm a regression analysis that was performed independent of the PCA, for each year of the experiment. Total biomass production correlated inversely with Nmin leaching (R = −0.71 in 2013 and R = −0.61 in 2014).
The second group (PC 2) described additional 11.90% in 2013, and 12.11% in 2014. The second factor (PC2) had a correlation with the grain yield near zero (R = 0.05 in 2013, and R = 0.07 in 2014). Correlation of PC 2 with other parameters, i.e., biomass production and Nmin leaching, was variable and weak (inconclusive): (a) 2013—PC 2 correlated with Nmin leaching (R = 0.41) and, inversely, with the total plant biomass production (R = −0.42); (b) 2014—there was Nmin leaching that correlated inversely (R = −0.46) with PC 2, and positively with plant biomass production (R = 0.37). PC 2 is unlikely to be related to the growing technology used because no proven correlation with the selected parameters has been identified. Therefore, it can only be assumed that this factor could be affected by seasonal fluctuations, for example, rainfall or temperatures. Their variability in the individual years of the experiment was evident from the measured data from the local meteorological station (Figure 1).
Relations between the respective variables (in 2013 and 2014) are presented as blue lines, precisely as cosines of their angles on Figure 6. The smallest angle was between variables with strong correlations, and vice-versa. When we added a graphical representation using the 3D surface plot (Appendix B, Figure A2 and Figure A3) to the PCA analysis, it was evident that variants with the highest grain production showed the highest loss of Nmin, from the soil. The results indicated that the high production variants featured the excessive amount of Nmin. While Nmin was used primarily for yield production, rather than for the production of plant biomass (straw, husk, etc.), it could not be stored in the plants and was leached instead. In the area, it would be more appropriate to use wheat variants, which were able to produce, not only enough grains but also enough straw, as it could represent an important “pool” to store the surplus N-substances, in order to prevent their loss from the soil.
The lowest values of Nmin leaching, found in variants A4 and C1, were not surprising since these variants were not subsidized with NF, at all. If we compared these variants (C1 vs. A4) among themselves, we would find that in 2013 the variant with MC showed a lower or steep loss of Nmin from the soil, with a higher total of plant-biomass production. Lower values in the variant A4, as compared to the variant C1, indicated that the use of MC had a positive effect on reducing the loss of Nmin from the soil. This fact was confirmed and explained by Reference [28] who report the MC root system to be several times larger than that in SC. It was additionally supplemented with AMF, bacteria, and actinomycetes, creating a space with a strong microbial activity and a large capacity to capture, process, and use the N substances, leading to the elimination of Nmin loss from the soil environment. The positive influence of MC and presence of on reducing the loss of N substances from the soil has also been confirmed by other authors—e.g., Reference [30,31]. On the contrary, the values measured in variants A1–A3 were inconsistent with the above information. Thus, it is necessary to put them in a broader context. The higher loss of Nmin in variants A1–A3 (compared to control C1 and variant A4) could have been caused by the combination of NF addition (A1 and A2—112 kg N/ha, A3—70 kg N ha−1), and the process of biological fixation of N2 (BFN). According to some authors [31,32], legumes can deliver approximately 40 kg N ha−1, through BFN, to the rhizosphere of arable land, during one growing season. The surplus of reactive N (due to the NF application and the BFN) in the soil and the insufficiently closed stand of MC in the first year of the experiment, could have resulted in the increased loss of Nmin from the soil, in variants A1–A3. It is necessary to note that the decreased loss of Nmin in variants A2–A3 was probably due to the application of LG B, with dissolved Corg (A2—1.25 L/ha year; A3—0.65 L/ha year), to support the microbial activity. Differences between the respective variants A1 > A2 > A3 were significant. The decrease was caused probably by the increased microbial activity promoted by the addition of LG B (with the content of Corg), and by the root exudates produced by the legumes, in MC. The growing of MC according [33] supports microbial activity, which increases the processing of N substances in the soil by up to 40%, as compared with the conventional systems. Furthermore reference [34] arrived at the same conclusions.
The measured Nmin losses from the soil pointed again to the combined effect of fertilization and MC cultivation, in 2014. The lowest loss of Nmin was found in variants C1 and A4, again. The values in variant A4 indicated a potential stability in the use of N substances and the ability of MC to utilize the available N substances. The values are consistent with [27,31] where the authors report similar findings from their MC experiments. Furthermore, the Nmin losses, in 2013 and 2014, can be compared: significant differences were found only between the variants C1 and A1. A decrease, by 35%, was found in variant A1, as compared to 2013. This state was confirmed by the assumption that the MC was not yet sufficiently closed, in 2013, and its potential could not have been used. The reason is that Trifolium repens, as a part of the MC, was sown when the experiment was established in 2012 and was only mulched in the other years (no additional sowing). Thus, it could be assumed that the plants were not closed enough in 2013, but in 2014 they could use their potential for increasing the soil capacity to capture and utilize the Nmin, as reported by Reference [28].

4. Conclusions

The aim of the paper was to gain new knowledge about the elimination of negative phenomena during the cultivation of winter wheat. In particular, there is a need to reduce the excessive use of N fertilizers and over-limit loss of mineral nitrogen leached from the soil, into other environments, such as watercourses or water reservoirs. The innovated agricultural technology was used to test winter wheat (Triticum aestivum), growing in the system of mixed culture (MC) with white clover (Trifolium repens). Based on the results, we can conclude that growing winter wheat in the MC system significantly reduced the Nmin concentration in the soil leachate. Moreover, it was found that the cultivation of wheat in MC makes it possible to reduce the applied N dose, by more than 20%, without any impact on grain and biomass production. The use of such N doses makes the usability of N substances in the MC system higher than that in the SC (monoculture) system, which was confirmed by the minimal differences in biomass production between MC and SC. In general, growing winter wheat in the MC system led to the higher sustainability of its cultivation, as compared with the SC system. Less mineral fertilizer was applied, and the natural benefits of the system were used instead, namely the biological fixation of N2. We can conclude with a statement that results of our experiment confirm the potential of sustainable winter wheat production with minimum negative effects on the environment, even with the reduced input of mineral N.

Author Contributions

A.K. and J.E. organized the lysimetric experiment; T.L. and J.N. reviewed the manuscript; J.E. and M.D.V. performed the statistical analysis and approved it for submission, reviewed the manuscript.

Funding

This research was supported by the Ministry of Agriculture of the Czech Republic, institutional support MZE-RO1718.

Conflicts of Interest

The authors declare no conflicts of interest.

Appendix A

Detailed display of experimental lysimeter used in the experiment.
Figure A1. Soil lysimeter. Description: 1—model plant; 2—soil surface (0.07 m2); 3—lysimeter body; 4—topsoil layer (25 kg); 5—subsoil layer (25 kg); 6—drain hole; 7—plastic hose (to intercept and transport soil leachate).
Sustainability 10 03367 g0a1

Appendix B

Graphical representation of relationships between the selected parameters (Nmin leaching; grain and total biomass yield) in all variants, using 3D surface plots, in 2013 and 2014.
Figure A2. A 3D surface plot of relationships between the individual parameters for 2013. The graph is a 3D projection of all measured values, i.e., Nmin leaching, grain yield, and total plant biomass production.
Sustainability 10 03367 g0a2
Figure A3. A 3D surface plot of relationships between the individual parameters for 2014. The graph is a 3D projection of all measured values, i.e., Nmin leaching, grain yield, and the total plant biomass production.
Sustainability 10 03367 g0a3

References

  1. Cassman, K.G.; Dobermann, A.; Walters, D.T. Agroecosystems, nitrogen-use efficiency, and nitrogen management. Ambio 2002, 31, 132–140. [Google Scholar] [CrossRef] [PubMed]
  2. Joshi, A.K.; Mishra, B.; Chatrath, R.; Ortiz Ferrara, G.; Singh, R.P. Wheat improvement in India: Present status, emerging challenges and future prospects. Euphytica 2007, 157, 431–446. [Google Scholar] [CrossRef]
  3. Pelzer, E.; Bazot, M.; Makowski, D.; Corre-Hellou, G.; Naudin, CH.; Rifai, M.A.; Baranger, E.; Bedoussac, L.; Biarnés, V.; Boucheny, P.; et al. Pea–wheat intercrops in low-input conditions combine high economic performances and low environmental impacts. Eur. J. Agron. 2012, 40, 39–53. [Google Scholar] [CrossRef] [Green Version]
  4. Canfield, D.E.; Glazer, A.N.; Falkowski, P.G. The evolution and future of Earth’s nitrogen cycle. Science 2010, 330, 192–196. [Google Scholar] [CrossRef] [PubMed] [Green Version]
  5. Sutton, M.A. The European Nitrogen Assessment: Sources, Effects and Policy Perspectives; Cambridge University Press: Cambridge, UK, 2011; ISBN 9781107006126. [Google Scholar]
  6. Bodirsky, B.L.; Popp, A.; Weindl, I.; Dietrich, J.P.; Rolinski, S.; Scheiffele, L.; Schmitz, C.; Lotze-Campen, H. N2O emissions from the global agricultural nitrogen cycle—Current state and future scenarios. Biogeosciences 2012, 9, 4169–4197. [Google Scholar] [CrossRef]
  7. Jensen, E.S.; Hauggaard-Nielsen, H. How can increased use of biological N2 fixation in agriculture benefit the environment? Plant Soil 2003, 252, 177–186. [Google Scholar] [CrossRef]
  8. Crews, T.E.; Peoples, M.B. Legume versus fertilizer sources of nitrogen: Ecological tradeoffs and human needs. Agric. Ecosyst. Environ. 2004, 102, 279–297. [Google Scholar] [CrossRef]
  9. Biswas, B.; Gresshoff, P.M. The Role of Symbiotic Nitrogen Fixation in Sustainable Production of Biofuels. Int. J. Mol. Sci. 2014, 15, 7380–7397. [Google Scholar] [CrossRef] [PubMed] [Green Version]
  10. Fields, S. Global Nitrogen: Cycling out of Control. Environ. Health Perspect. 2004, 112, A556–A563. [Google Scholar] [CrossRef] [PubMed]
  11. Lukina, E.V.; Freeman, K.W.; Wynn, K.J.; Thomason, W.E.; Mullen, R.W.; Stone, M.L.; Solie, J.B.; Klatt, A.R.; Johnson, G.V.; Elliott, R.L.; et al. Nitrogen fertilization optimization algorithm based on in-season estimates of yield and plant nitrogen uptake. J. Plant Nutr. 2001, 24, 885–898. [Google Scholar] [CrossRef]
  12. Jensen, E.S.; Peoples, M.B.; Robert, M.; Boddey, R.M.; Gresshoff, P.M.; Hauggaard-Nielsen, H.; Alves, B.J.R.; Morrison, M.J. Legumes for mitigation of climate change and the provision of feedstock for biofuels and biorefineries. A review. Agron. Sustain. Dev. 2012, 32, 329–364. [Google Scholar] [CrossRef]
  13. Peoples, M.B.; Herridge, D.F.; Ladha, J.K. Biological nitrogen fixation: An efficient source of nitrogen for sustainable agricultural production? Plant Soil 1995, 174, 3–28. [Google Scholar] [CrossRef]
  14. Olivares, J.; Bedmar, E.J.; Sanjuán, J. Biological Nitrogen Fixation in the Context of Global Change. Mol. Plant Microb. Interact. 2013, 26, 486–494. [Google Scholar] [CrossRef] [PubMed]
  15. Sullivan, B.J.; Smith, W.K.; Townsend, A.R.; Nasto, M.K.; Reed, S.C.; Robin, L.; Chazdon, R.L.; Cleveland, C.C. Spatially robust estimates of biological nitrogen (N) fixation imply substantial human alteration of the tropical N cycle. Proc. Natl. Acad. Sci. USA 2014, 111, 8101–8106. [Google Scholar] [CrossRef] [PubMed] [Green Version]
  16. Ashworth, A.J.; Taylor, A.M.; Reed, D.L.; Allen, F.L.; Keyser, P.D.; Tyler, D.D. Environmental impact assessment of regional switchgrass feedstock production comparing nitrogen input scenarios and legume-intercropping systems. J. Clean. Prod. 2015, 87, 227–234. [Google Scholar] [CrossRef]
  17. Anglade, J.; Billen, G.; Garnier, J. Relationships for estimating N2 fixation in legumes: Incidence for N balance of legume-based cropping systems in Europe. Ecosphere 2015, 6, 1–24. [Google Scholar] [CrossRef]
  18. Teng, Y.; Wang, X.; Li, L. Rhizobia and their bio-partners as novel drivers for functional remediation in contaminated soils. Front. Plant Sci. 2015, 6, 32. [Google Scholar] [CrossRef] [PubMed]
  19. Hauggaard-Nielsen, H.; Jensen, E.S. Facilitative root interactions in intercrops. In Root Physiology: From Gene to Function, 2nd ed.; Lambers, H., Colmer, T.D., Eds.; Plant Ecophysiology; Springer: Dordrech, The Netherlands, 2005; Volume 4, pp. 237–250. ISBN 978-1-4020-4099-3. [Google Scholar]
  20. Wyszkowski, M.; Radziemska, M. The effect of chromium content in soil on the concentration of some mineral elements in plants. Fresenius Environ. Bull. 2009, 18, 1039–1045. [Google Scholar]
  21. Muñoz-Huerta, R.F.; Guevara-Gonzalez, R.G.; Contreras-Medina, L.M.; Torres-Pacheco, I.; Prado-Olivarez, J.; Ocampo-Velazquez, R.V. Review of Methods for Sensing the Nitrogen Status in Plants: Advantages, Disadvantages and Recent Advances. Sensors 2013, 13, 10823–10843. [Google Scholar] [CrossRef] [PubMed]
  22. Uzoma, K.C.; Inoue, M.; Andry, H.; Fujimaki, H. Effect of cow manure biochar on maize productivity under sandy soil condition. Soil Use Manag. 2011, 27, 205–212. [Google Scholar] [CrossRef]
  23. Zbíral, J.; Němec, P. Comparison of Mehlich 2, Mehlich 3, CAL, Egner, Olsen, and 0.01 M CaCl2 extractants for determination of phosphorus in soils. Commun. Soil Sci. Plant Anal. 2002, 33, 3405–3417. [Google Scholar] [CrossRef]
  24. Nelson, D.W.; Sommers, L.E. Total carbon, organic carbon, and organic matter. In Methods of Soil Analysis. Part 3, Chemical Methods, 2nd ed.; Sparks, D.L., Ed.; Soil Science Society of America, American Society of Agronomy: Madison, WI, USA, 1996; Volume 5, pp. 961–1010. ISBN 0891188258. [Google Scholar]
  25. Bremner, J.M. Nitrogen Total. In Methods of Soil Analysis. Part 3, Chemical Methods, 2nd ed.; Sparks, D.L., Ed.; Soil Science Society of America, American Society of Agronomy: Madison, WI, USA, 1996; Volume 5, pp. 1085–1122. ISBN 0891188258. [Google Scholar]
  26. Hauggaard-Nielsen, H.; Ambus, P.; Jensen, E.S. The comparison of nitrogen use and leaching in sole cropped versus intercropped pea and barley. Nutr. Cycl. Agroecosyst. 2003, 65, 289–300. [Google Scholar] [CrossRef]
  27. Fustec, J.; Lesuffleur, F.; Mahieu, S. Nitrogen rhizodeposition of legumes. A review. Agron. Sustain. Dev. 2010, 30, 57–66. [Google Scholar] [CrossRef]
  28. Ehrman, J.; Ritz, K. Plant: Soil interactions in temperate multi-cropping production systems. Plant Soil 2014, 376, 1–29. [Google Scholar] [CrossRef]
  29. Haynes, R. Mineral Nitrogen in the Plant-Soil System; Academic Press: Cambridge, MA, USA, 2012; ISBN 978-0-12-334910-1. [Google Scholar]
  30. Tosti, G.; Farneselli, M.; Benincasa, P.; Guiducci, M. Nitrogen Fertilization Strategies for Organic Wheat Production: Crop Yield and Nitrate Leaching. Agron. J. 2016, 108, 770–781. [Google Scholar] [CrossRef]
  31. Fujita, K.; Godfred, O.K.; Ogata, S. Biological nitrogen fixation in mixed legume- cereal cropping systems. Plant Soil 1992, 141, 155–175. [Google Scholar] [CrossRef]
  32. Pirhofer-Walzl, K.; Rasmussen, J.J.; Høgh-Jensen, H. Nitrogen transfer from forage legumes to nine neighbouring plants in a multi species grassland. Plant Soil 2012, 350, 71–84. [Google Scholar] [CrossRef]
  33. Di, H.J.; Cameron, K.C. Nitrate leaching and pasture production from different nitrogen sources on a shallow stoney soil under flood-irrigated dairy pasture. Aust. J. Soil Res. 2002, 40, 317–334. [Google Scholar] [CrossRef]
  34. Zarea, M.J.; Ghalavand, A.; Goltapeh, E.M. Effects of mixed cropping, earthworms (Pheretima sp.), and arbuscular mycorrhizal fungi (Glomus mosseae) on plant yield, mycorrhizal colonization rate, soil microbial biomass, and nitrogenase activity of free-living rhizosphere bacteria. Pedobiologia 2009, 52, 223–235. [Google Scholar] [CrossRef]
Figure 1. Weather conditions at the lysimetric station: (A) Average monthly temperature during 2012–2014; (B) average monthly precipitation during 2012–2014.
Sustainability 10 03367 g001
Figure 2. Location of the lysimetric experiment (source of map data: mapsopensource.com): (A) the position of the individual lysimeters, in the field, together with the control shaft that has been used to collect the soil eluate; (B) Lysimeter prepared for soil placement.
Sustainability 10 03367 g002
Figure 3. Total plant biomass production of winter wheat from the lysimetric experiment (0.07 m2), in 2013 and 2014. Mean values (n = 3) are shown, different letters (lowercase for 2013 and uppercase for 2014) indicate significant differences in total plant biomass production, at the level of significance p < 0.05.
Sustainability 10 03367 g003
Figure 4. Grain yield of winter wheat from the lysimetric experiment (0.07 m2), in 2013 and 2014. Mean values (n = 3) are shown, different letters (lowercase for 2013 and uppercase for 2014) indicate the significant differences in grain yield, at the level of significance p < 0.05.
Sustainability 10 03367 g004
Figure 5. Concentrations of Nmin (mean values ± SE) in the soil leachate, in 2013 and 2014. Mean values (n = 3) are shown, different letters (lowercase for 2013 and uppercase for 2014) indicate significant differences in Nmin leaching. Significant differences between the respective years are asterisked (*) at the level of significance p < 0.05.
Sustainability 10 03367 g005
Figure 6. Projection of the variables on the plane of factors. The graph shows the results of the PCA: (A) for 2013; (B) for 2014.
Sustainability 10 03367 g006
Table 1. Variants and nutrient amounts applied to the lysimeters.
TreatmentDescriptionTotal N Applied
(kg N/ha)
Humic and Fulvic Acids
(L/ha)
Fertilizers
C1Sole Crop (Control)00-
C2Sole Crop1400DAM 390
A1Mixed Cropping1120DAM 390
A2Mixed Cropping1121.25DAM 390 + LG B
A3Mixed Cropping700.65DAM 390 + LG B
A4Mixed Cropping (Control)00-
Table 2. Selected physical and chemical properties of experimental arable soil (topsoil = 0–0.25 m; subsoil = 0.25–0.40 m).
SampleCtot (g/kg)Ntot (g/kg)C/NPlant Available Nutrient (mg/kg)pH (CaCl2)
PKCaMg
Topsoil13.321.419.442333491801695.7
Subsoil0.5970.05211.48143561451466.1

