Performance-Based or Politic-Related Decomposition of Environmental Targets: A Multilevel Analysis in China

1
School of International and Public Affairs, Shanghai Jiao Tong University, Shanghai 200030, China
2
Center for Chinese Local Governance Innovations, Xi’an Jiaotong University, Xi’an 710049, Shaanxi, China
3
China Institute for Urban Governance, Shanghai Jiao Tong University, Shanghai 200030, China
*
Author to whom correspondence should be addressed.
Sustainability 2018, 10(10), 3410; https://doi.org/10.3390/su10103410
Submission received: 18 August 2018
/
Revised: 18 September 2018
/
Accepted: 21 September 2018
/
Published: 25 September 2018
(This article belongs to the Special Issue Air Quality Assessment Standards and Sustainable Development in Developing Countries)
Abstract
:China relies on the total pollutant emission control and environmental target responsibility system to curb environmental pollution and improve energy conversation. How the central government breaks down environmental targets among provincial governments lies at the core, but little research has been done to explore the determinants of environmental target-setting empirically. This work models the decomposition process of environmental targets by focusing on the roles of historical performance and provinces’ political status. With the method of hierarchical linear model, data on five kinds of environmental obligatory targets (energy consumption per unit GDP and other four kinds of pollutants) during China’s “12th Five-year Plan” period is used to test the hypotheses. The results show that provincial historical structural performance is negatively significantly correlated with their environmental target levels, while the effects of historical scale performance and intensity performance are not significant. Besides, provinces with higher political rankings tend to be allocated higher targets, which is in accordance with the model effect hypothesis rather than the bargaining effect hypothesis.
1. Introduction
Echoing management by objectives, many countries in the world have already adopted various kinds of result-oriented goal management reforms [1,2,3,4]. In these result-oriented reforms, goal-setting lies in the core and plays the “baton” role in directing the behaviors of persons for whom the goals are set. As an important management instrument, the positive effects of goal-setting on performance improvement have been empirically confirmed by dozens of studies in the past few decades [5,6,7]. Goals can usually be elaborated through goal dimensions and goal aspiration levels: goal dimensions are used to illustrate what is considered important (concentrating on the goal priorities or goal preferences), while goal aspiration levels are used to explain which performance levels are expected to be achieved on certain goal dimensions [8,9,10]. Nowadays, to examine determinants of goal aspiration levels and goal priorities has become an important channel to explore the behavioral logic of decision-makers.
Actually, the top-down target responsibility system in China provides an ideal practical situation for conducting research on determinants of government performance goal-setting [10]. In the Chinese target responsibility system, performance goals are divided into two forms, namely, anticipated targets and obligatory targets. Anticipated targets refer to the development goals that the central government and local governments expect to achieve and set by themselves (e.g., GDP), while obligatory targets refer to the task requirements for local governments that are allocated or set by their superior governments in public service and other policy domains involving public interest (e.g., pollutant emission control). Previous research on goal-setting concentrated only on anticipated targets [10,11,12] and failed to explore determinants of the setting of obligatory targets. There is a great difference between the setting of anticipated targets and obligatory targets in China, because anticipated targets are set by local governments independently and obligatory targets are allocated by their superior governments, although local governments can also express their own opinions or adjust the targets in the decomposition of obligatory targets to some extent [13].
Due to the goal-setting theory being developed mainly based on anticipated targets, it is of great importance to explore determinants and features of the setting of obligatory targets in order to understand the target-setting logic in China more thoroughly. Along with more and more severe environmental pollution [14], China relies on the total pollutant emission control and environmental target responsibility system to curb environmental pollution, the core of which is the disaggregation of obligatory environmental targets [13,15,16]. Thus, this work models the decomposition process of environmental targets and focuses on the effects of performance feedback and political features by controlling a set of factors advocated in previous goal-setting research. This work contributes to current literature by first dividing historical performance into three dimensions and then extending previous frameworks by including the politic-related factors based on the feature of the setting of obligatory targets. It also additionally extends previous literature that mainly focused on the context of setting anticipated targets to the context of the setting of obligatory targets. By taking the setting of environmental targets as a case, this work uses the data of Chinese provinces in the “12th Five-year Plan” period to examine this framework empirically.
The remainder of this work is organized as follows. The second section briefly reviews current research related to organizational goal-setting and the third section proposes the theoretical framework and two clusters of hypotheses. The fourth section illustrates the methodology, including samples, measures, and data sources, and the analytical approach used, followed by the fifth section which presents the empirical results in detail. Finally, the theoretical and practical implications of these findings are discussed, followed by limitations and research avenues for future research.
2. Literature Review
Research on organizational target-setting or goal-setting can be tracked back to the behavioral theory of the firm developed by Cyert and March, which holds that the prior performance, the previous goal, and comparable peers’ previous performance of one organization are important predictors of its goal-setting [8]. Following this research stream, some studies have examined how one organization’s previous goal and previous goal attainment discrepancy (the gap between previous performance and the previous goal) influence its decision-making in the private sector [17,18]. Recently, the behavioral theory of the firm has become one of the most influential theories in organizational studies and is advocated by many followers [9,19]. However, current evidence mainly focuses on the goal-setting process in the private sector and whether it can be generalized to the decision-making process in the public sector, which is usually faced with multiple tasks and characterized by a hierarchical structure, is still an outstanding question [10].
Similarly, public administration scholars have also developed the Bayesian theory of public organizations’ decision-making to explain the decision-making process in the public sector [20]. It argues that the historical performance in the last period, performance gaps, peers’ performance, superiors’ preferences can figure as benchmarks that can be referred to in organizations’ decision-making in the public sector [20]. Recently, some public administration scholars have examined impacts of these factors on the setting of goal priorities empirically based on survey data in the public education system [11,12]. Moreover, Ma also empirically explored determinants of the setting of Gross Domestic Product (GDP) goal aspiration levels by Chinese provincial governments and found that it followed prior historical GDP aspiration levels and was related to the average performance aspiration levels of peers and performance gaps when compared with peers horizontally [10]. However, all of these studies focus on the setting of anticipated targets rather than obligatory targets in the public sector.
After reviewing research on setting of environmental obligatory targets in detail, we find that English articles about environmental target-setting published in international journals are really scarce. In this aspect, Zhao and Wu interpreted the evolution of China’s energy-saving target allocation system from the policy learning perspective and described the target allocation process [13]. Some studies also either discussed principles which should be followed in decomposing environmental targets (e.g., effect, efficiency, equity, transparency, feasibility, continuity, consistency, responsibility, and capability) [21,22] or used some economic factors to model the allocation of environmental targets among local governments, including resource distribution, energy consumption, fiscal revenue, GDP per capita, and industry development features [23,24]. Though these studies have provided some clues to understand the behavioral logic of environmental target allocation, no research was found that used archive data to examine determinants of environmental target-setting in China empirically.
Overall, due to the importance of target-setting, it becomes an emerging hot topic to explore determinants of organizational target-setting in recent years. Though current studies have helped us understand organizational decision-making logic and behaviors, there are still several significant research gaps. First, many studies have explored what determines the setting of goal priorities and goal aspiration levels of individuals [6] and organizations in the private sector [8,17,18,19], while research on determinants of organizational goal priorities and goal aspiration levels in the public sector is still much less than what we need [10,11,20]. Second, current studies mainly concentrate on the setting of anticipated targets rather than obligatory targets [10], which makes it difficult to generalize these findings in different situations. Third, current research mainly focuses the roles of historical performance in target-setting from the perspective of rational decision-making, while target-setting in the public sector is also a political process and no research examines the political features of target-setting.
3. Theoretical Framework and Hypotheses
3.1. Theoretical Framework: Performance-Based or Politic-Related
Both the behavioral theory of the firm and the Bayesian theory of public organizations’ decision-making put organizations’ historical performance at the center of organizational target-setting [8,20]. They argue that organizations tend to set their own targets using their own prior performance as a key reference point from the perspective of rational decision-making. Actually, target-setting is an important policy instrument to improve performance [7,25,26]. Organizational prior performance records can influence organizations’ expectations about their performance in the next period. As far as China’s environmental pollution control concerned, previous pollutant emission and energy consumption performance is also related to local governments’ potentials to reduce their pollutant emissions and energy consumption [16]. Thus, it is reasonable that the central government in China should decompose national targets down to provincial governments according to provinces’ historical performance, which implies environmental target-setting in China is expected to be performance-based.
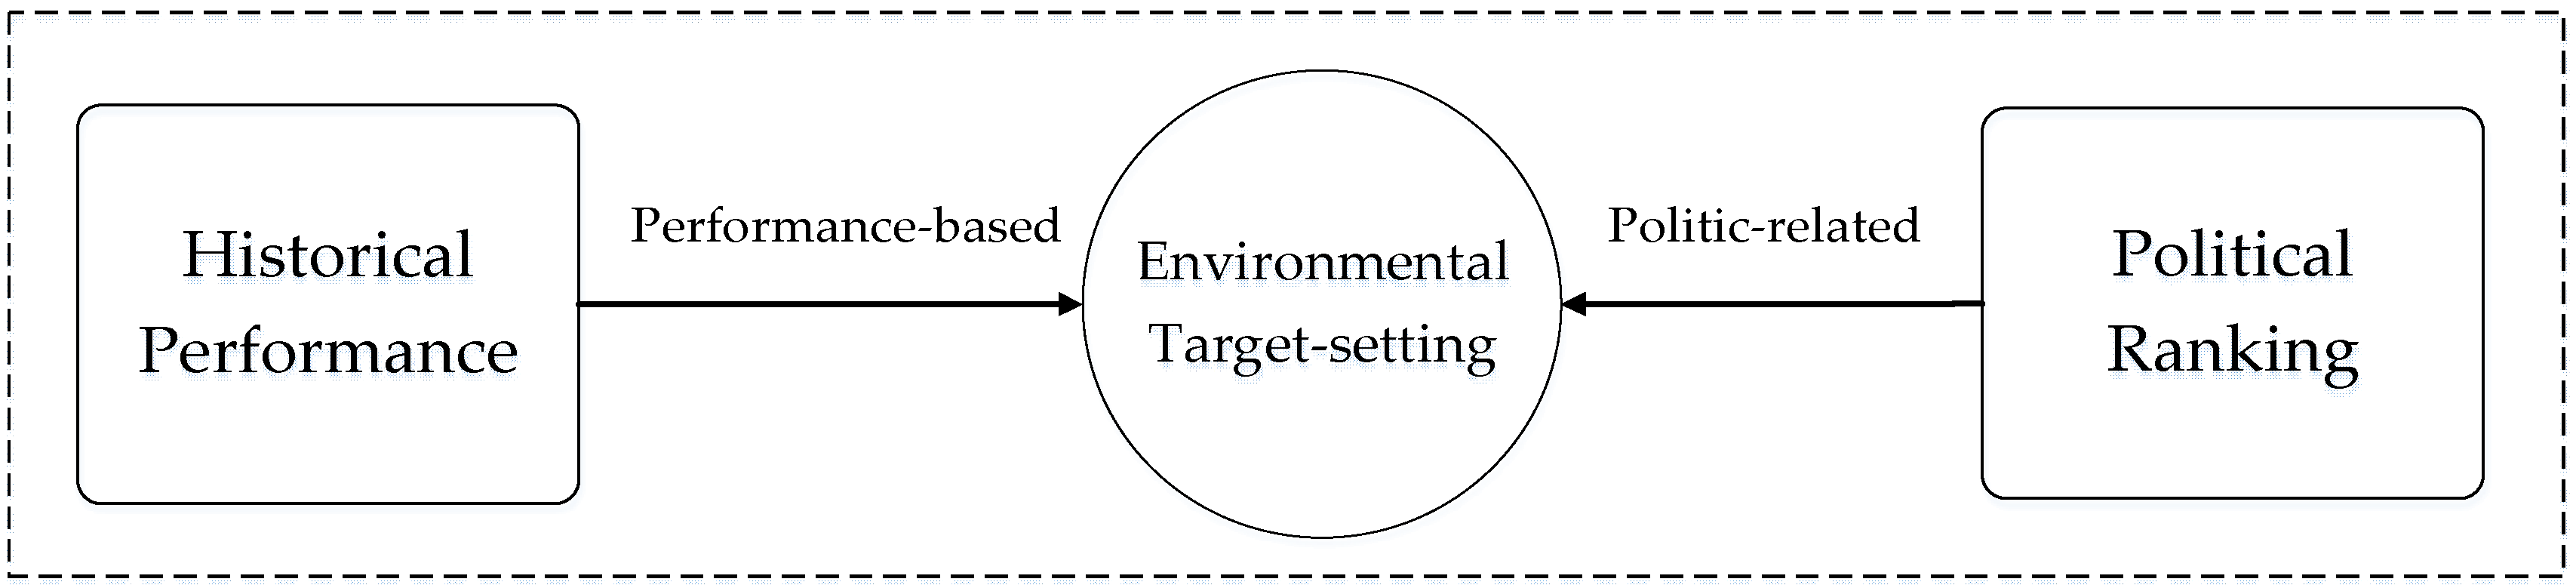
In addition, the decomposition and allocation of environmental targets in China is a top-down process in which the central government first releases the national environmental targets, provinces propose their own possible targets, the central government further compiles and reviews the proposed targets, and then, the central government negotiates with provinces and finalizes target assignments [13,15]. Actually, some studies argue that local governments strive to stand out in policy areas prioritized by their superior governments [27,28], while environmental target-setting research also holds that the decomposition of China’s environmental targets is a political process full of intensive central–local bargaining [13]. This means provincial governments may be stimulated by political factors to submit targets higher or lower than the national environmental targets, and the primary difference between the initial proposed targets and the finalized targets of the provinces in the “11th Five-year Plan” period provides partial evidence about the political features of this process [13]. Hence, in order to simulate the decomposition process of environmental targets in China, this work integrates the performance-based and politic-related decomposition perspectives together to establish a theoretical framework (Figure 1). In the following section, it proposes detailed hypotheses from these two perspectives.
3.2. Hypotheses Denoting Performance-Based Decomposition
Historical performance in the last period can figure as the simplest benchmark that can be referred to in decision-making [8,20]. On one hand, historical performance is related to goal attainment discrepancies or performance gaps and, thus, can influence goal aspiration level adaptation [18,20]. On the other hand, managers tend to lower the weight of this performance dimension when the performance on this dimension has improved in this period; otherwise, the manager tend to increase the weight of the performance dimension [12]. When one organization had a better performance record in the last period, it would be more confident in setting higher-level performance goals; on the contrary, when the performance record in the last period was worse, the organization would tend to lower its goal aspiration level in order to attain its performance goal in this period [10].
The effect of historical performance is expected to be different in the setting of anticipatory targets and in the decomposition of environmental obligatory targets. As far as the setting of anticipatory targets, historical performance tends to be positively related to the goal aspiration level in the current period, because a better historical performance record can act as an anchor and indicate that better performance is possible, thereby strengthening organizational confidence in setting a higher performance goal in the next period [10,18]. However, the setting of environmental obligatory targets is a top-to-bottom decomposition process in China, and historical performance can negatively influence the setting of environmental obligatory targets because it reflects local governments’ potentials to reduce pollutant emissions in the current period [16]. Specifically, when the historical performance of one province is low (that means it emitted more pollutants), it is expected to have a larger potential to improve performance on this dimension in the next period.
Previous research focuses on the effect of one-dimension performance on governmental goal-setting, such as the GDP growth rate [10]. In the research field of carbon emissions, some scholars typically decompose the carbon emissions into production, structural, and efficiency effects [29,30], which implies that we can improve environmental performance through multiple channels, such as reducing the production scale, adjusting the structure, and improving production efficiency. Similarly, environmental performance can also be measured from these three perspectives with scale performance, structural performance, and intensity performance, which reflects the total gross of pollutant emissions or energy consumption, the structure of pollutant emissions or energy consumption, and the pollutant emission efficiency or energy consumption efficiency, respectively. Thus, the environmental targets are hypothesized to be decomposed mainly based on historical environmental performance records and thus we propose:
Hypothesis H1.
With other conditions being equal, the allocated target of one province is negatively related to its historical energy consumption and pollutant emission performance.
Hypothesis H1a.
With other conditions being equal, the allocated target of one province is negatively related to its historical energy consumption and pollutant emission scale performance.
Hypothesis H1b.
With other conditions being equal, the allocated target of one province is negatively related to its historical energy consumption and pollutant emission structural performance.
Hypothesis H1c.
With other conditions being equal, the allocated target of one province is negatively related to its historical energy consumption and pollutant emission intensity performance.
3.3. Hypotheses Denoting Politic-Related Decomposition
Local governments enjoy considerable autonomy in setting anticipatory targets in China (such as GDP) [10], while pollutant emission reduction targets, as a kind of obligatory target, are usually decomposed and allocated by the central government in China [31]. Rational local government leaders would not always completely obey performance management activities initiated by their superior governments and would instead usually take some response strategies [32]. In the policy domain of pollutant emission reduction, in order to minimize the pressure of attaining targets set by their superior governments, it is a rational choice for local governments to strive for lower pollutant emission reduction targets by bargaining with their superior governments [13]. On the one hand, the nomenklatura personnel management system of China divides government officials into multiple hierarchical levels, and the central Politburo is located at the top layer [27,33,34]. The higher historical likelihood that leaders (party secretary and governor) of one province are promoted to the Politburo means the province has a higher political ranking in Chinese political system [28,31], which not only makes it easier for the province to get information about the central policy direction in advance, but also gives the province more political capital to bargain with the central government in the setting of environmental targets. In this case, provinces with higher political rankings are expected to be allocated lower environmental targets through bargaining.
Because environmental protection has been one of the top policy priorities of the central government in China since 2007 [35], provinces with higher political rankings are also likely to be driven by higher political promotion incentives to accept higher environmental targets. Some scholars argue that provinces whose leaders have a higher historical likelihood to be promoted to the Politburo are keener on following the policy priority of the central government to control pollutant emissions [28]. Meanwhile, some research also provides empirical evidence that the historical likelihood of one province’s leaders to be promoted to the Politburo is not significantly but positively related to the attainment of environmental targets [31], which implies that provinces with higher political rankings indeed are perhaps more aggressive in achieving environmental targets set by the central government. Therefore, a model effect may exist for provinces with higher political rankings in setting environmental targets, which means provinces with higher political rankings, driven by political promotion incentives, are more likely to accept higher environmental targets allocated by the central government. Overall, two competing hypotheses are proposed:
Hypothesis H2a.
With all other conditions being equal, provinces with higher political rankings have more power to bargain with the central government and tend to be allocated lower environmental obligatory targets, defined as the bargaining effect hypothesis.
Hypothesis H2b.
With all other conditions being equal, provinces with higher political rankings tend to play a leading role and be allocated higher environmental targets, defined as the model effect hypothesis.
4. Materials and Methods
4.1. Samples
This work uses data from 29 provinces in China (Hong Kong, Taiwan, Tibet, Xinjiang, and Macao are excluded) during the “12th Five-year Plan (2011–2015)” period to test our hypothesis. The samples are province–target combination units. During the “12th Five-year Plan” period, the central government of China decomposed China’s national environmental targets down to its provincial governments, providing an appropriate institutional context to explore determinants of the setting of environmental obligatory targets. The reasons why the allocation of environmental targets from the central government to Chinese provinces is chosen lie in the following two aspects: on the one hand, it is the first and most important step to break national targets down to Chinese provinces in the Chinese top-down target assignment decomposition system, which is completely independent from target decomposition and allocation in the following stages; on the other hand, previous empirical research on determinants of goal aspiration levels was conducted at Chinese provincial level [10], and it is better to compare those findings with the findings of this work.
4.2. Measures and Data Sources
4.2.1. Dependent Variable
The dependent variable is the expected reduction rate for the investigated environmental obligatory indicator of the investigated province during the “12th Five-year Plan” period. For example, the dependent variable for the observed sample of “Henan province-sulfur dioxide” is measured with the mandatory reduction percentage of the total amount of sulfur dioxide emissions in Henan province during the “12th Five-year Plan” period; for another example, the dependent variable of the observed sample for “Shandong province-energy consumption per unit GDP” is the mandatory reduction percentage of the energy consumption per unit GDP in Shandong province during the “12th Five-year Plan” period. The data are from the Comprehensive Work Scheme of Energy Conservation and Emission Reduction during the “12th Five-year Plan” Period. The larger the value of the variable is, the stronger the pressure is to improve environmental performance for the focus province.
4.2.2. Independent Variables
As discussed in the third section, historical performance is used to examine the performance-based decomposition feature in China’s environmental target allocation system, including historical scale performance, historical structural performance, and historical intensity performance. Historical scale performance represents the relative gross of energy consumption or the relative gross of pollutant emission for the corresponding investigated obligatory indicator of the investigated province in the year before the “12th Five-year Plan” period. For example, the variable of the observed sample of “Henan province-sulfur dioxide” is measured with the ratio between the total sulfur dioxide emission of Henan province and the national emission gross of sulfur dioxide in 2010; for another example, the variable of the observed sample of “Shandong province energy consumption per unit GDP” is measured with the ratio between the total energy consumption of Henan province and the national energy consumption gross in 2010. This measurement can make different pollutant emissions and energy consumption comparable. The data are from the Chinese Statistical Yearbook 2011, Chinese Energy Statistical Yearbook 2011, and Chinese Environment Yearbook 2011. The larger the value of this variable is, the lower the scale performance is.
Historical structural performance is measured with the secondary industry proportion of the investigated province in the year before the “12th Five-year Plan” period, as industrial consumption of energy or industrial pollutant emissions have stronger control elasticity compared to daily life energy consumption or daily life pollutant emissions. The data are from the Chinese Statistical Yearbook 2011. The larger the value of this variable is, the lower the structural performance is.
Historical intensity performance is measured with the ratio between the investigated province’s energy consumption per unit GDP and the national energy consumption per unit GDP or the ratio between the investigated province’s pollutant emission per unit GDP and the national total pollutant emission per unit GDP for the investigated environmental indicator in the year before the “12th Five-year Plan” period, which makes it comparable among these five kinds of environmental indicators. The data are from the Chinese Statistical Yearbook 2011, Chinese Energy Statistical Yearbook 2011, and Chinese Environment Yearbook 2011. The larger the value of this variable is, the lower the energy utilization efficiency or pollutant control efficiency of the investigated province is.
Besides, the third section also elaborates that provinces’ political status measured with political rankings can be used to examine the politic-related decomposition feature in China’s environmental target allocation system. Political ranking is measured as the total number of the members of the Politburo who had worked in the investigated province as the party secretary or governor from 1997 to 2011. Members of the Politburo lie at the top in Chinese nomenklatura system; this measurement has been adopted in some other studies [27,28]. These data are coded by the author based on the resumes of the members of the Politburo in the 15th, 16th, and 17th sessions. The larger the value of this variable is, the higher the political ranking is.
4.2.3. Control Variables
A set of variables are controlled in this work. First, previous research holds that organizational goal-setting historically follows its past goal aspiration level, horizontally aligns with the average goal aspiration level of its comparable peers, and vertically complies with the goal aspiration level of its superior [10,20]. Hence, the prior environmental target of the investigated province, the average environmental target of its comparable peers, and the national environmental target are controlled.
Specifically, the variable of the prior target is measured with the target level of the investigated province for the investigated environmental obligatory indicator in the “11th Five-year Plan” period. The data are from the National Control Plan for the Total Emissions of Major Pollutants during the “11th Five-year Plan” Period and the Decomposition Plan for the National Energy Consumption per Unit GDP Reduction Target among Chinese Subnational Regions during the “11th Five-year Plan” Period, which are approved and issued by the State Council in 2006.
The variable of the comparable peers’ average environmental target is measured by the average reduction rate for the investigated environmental obligatory indicator of all the comparable provinces of the investigated province during the “12th Five-year Plan” period. Neighboring provinces are treated as proxies of comparable provinces, which are usually used in research on policy diffusion and goal-setting [10,27,36]. Thus, this variable is calculated by the authors according to the Chinese administrative territory and the data are from the Comprehensive Work Scheme of Energy Conservation and Emission Reduction during the “12th Five-year Plan” period.
The variable of the national environmental target is measured with the national reduction rate set by the central government for the investigated environmental obligatory indicator during the “12th Five-year Plan” period. The data are from the Comprehensive Work Scheme of Energy Consumption and Emission Reduction in the “12th Five-year Plan” period. The higher the value of this variable is, the stronger the ambition is for the central government to control pollutant emissions.
Second, unemployment can reflect economic health, and provinces with more unemployed labors should bear less pollutant emission reduction burden in order to guarantee employment. Hence, we also control the unemployment rate of each province, which is measured with the registered urban unemployment rate of the investigated province in the year before the “12th Five-year Plan” period. The data is from the Chinese Statistical Yearbook 2011. Besides, previous studies confirmed that economic development conditions were related to the setting of PM2.5 concentration control targets and GDP goal aspiration levels [7,10]. Thus, economic development is also controlled. It is measured by the GDP per capita of the investigated province in the year before the “12th Five-year Plan” period, and the data are from the Chinese Statistical Yearbook 2011. Details of the variables, measures, and data sources are presented in Table 1.
4.3. Analytical Approach
Given that the data used are cross-sectional data of five kinds of environmental targets (sulfur dioxide, chemical oxygen demand, energy consumption per unit GDP, nitrogen oxide, ammonia nitrogen) of 29 provinces in mainland China (excluding Hong Kong, Taiwan, Tibet, Xinjiang, and Macao) during the “12th Five-year Plan” period, and some variables (e.g., structural performance, political ranking, unemployment rate, and GDP) are shared by samples within the same province, the data present a nested structure. The assumptions for the ordinary least square regression are violated in data with a nested structure and hence, we follow some scholars’ recommendations to adopt a two-layered hierarchical linear model (HLM) to analyze the data [37]. There are two kinds of HLM, namely, the random intercept and fixed slope model and the random intercept and random slope model [38]. This work uses the random intercept and fixed slope model for estimation because we focus on the universal effects of the independent variables across layer-2 units. Specifically, the two-layered HLM can be presented as follows.
Layer 1: Targeti,p = β0i + β1iE_scalei,p + β2iE_intensityi,p + β3iControl_1i,p + εi,p
Layer 2: β0i = γ00 + γ01E_structurei + γ02P_rankingi +γ03Control_2i + μi
In our data, environmental indicator units (layer 1) are nested in province units (layer 2). As described in Equation (1), the dependent variable of Targeti,p denotes the mandatory reduction rates for major environmental obligatory indicators of 29 provinces in mainland China for the “12th Five-year Plan” period, where i denotes the codes of provinces and p denotes the codes of environmental obligatory indicators. According to Equation (1), the target level in province i for environmental indicator j is the sum of the following three parts: average outcome in the province unit i (β0i), outcome predicted by indicator-specific factors (including E_scalei,p denoting scale performance in province i for environmental indicator j, E_intensityi,p denoting intensity performance in province i for environmental indicator j, Control_1i,p denoting other indicator-level control variables, such as the prior target in province i for environmental indicator j, the average target for environmental indicator j of the neighboring peers of province i, and the national target for environmental indicator j), and indicator-level errors (εi,p).
Besides, according to the intercept Equation (2), the average outcome in province unit i (β0i) is also composed of three parts: the average outcome for all samples (γ00), outcome predicted by province-level factors (including E_structurei denoting structural performance measured with the proportion of the secondary industrial output in province i, P_rankingi denoting the political ranking of province i, Control_2i denoting other province-level control variables, such as the unemployment rate in province i, and the GDP per capita in province i), and province-level random effect (μi). Because ui has different values across provinces, the method can make the intercepts vary among different provinces. Following previous research, we center layer-1 variables around their mean within each layer-2 group and center layer-2 variables around their grand mean of all samples [37]. The software used to run HLM is Stata 14.
5. Results
Descriptive analysis results of the variables are shown in Table 2, which mainly reports the sample size, mean, standard deviation, minimum value, and maximum value. The sample size is 145, comprising 145 combinations of five kinds of environmental indicators (energy consumption per unit GDP, sulfur dioxide, nitrogen oxide, chemical oxygen demand, ammonia nitrogen) and 29 provinces in mainland China. The minimum value of the dependent variable is −34.9, the maximum value is 18, the mean value is 9.75, and the standard deviation is 7.17, indicating great variance of the dependent variable, which provides great space to explore determinants of environmental target-setting. It is noteworthy that observations for some independent variables are 29 (such as E_structure, P_ranking, Unemployment, and GDP) because of the nested data structure. Only three kinds of environmental obligatory targets (energy consumption per unit GDP, sulfur dioxide, and chemical oxygen demand) were set at the national level and decomposed down to the provincial level during the “11th Five-year Plan” period; hence, the number of observations for the variable of the P_target is 87 (87 combinations of 29 provinces and three environmental indicators).
The results of bivariable correlation analysis are shown in Table 3. E_scale, E_structure, and P_ranking are significantly positively related to the dependent variable of Target, which preliminarily supports the corresponding hypotheses. However, the correlation coefficient between E_intensity and Target is negatively significant, which does not provide evidence to support the corresponding hypothesis. Furthermore, the bivariable correlation coefficients between P_target, Neighbor, and Central are approximately 0.7 and are very significant (p < 0.01). Therefore, if we put these three variables into the same regression model, severe multicollinearity problems may exist due to the high correlations among them. The correlation coefficients between the independent variables and other control variables are all smaller than 0.65, indicating low correlations.
The results of three regression models based on HLM are shown in Table 4. Due to the strong correlations between P_target, Neighbor, and Central, we first put these three variables into regression models separately in order to control multicollinearity (see Model 1, Model 2, and Model 3). The variance inflation factors of all variables in the three models are all smaller than the critical value 10, and thus, there is no severe multicollinearity [39]. In Model 1, E_structure and Target are significantly positively related (p < 0.05), and the coefficients remain significantly positive in Models 2 and 3, strongly supporting the Hypothesis H1b. This finding indicates that provinces with higher proportions of the secondary industrial outputs were allocated higher environmental targets by the central government. In Models 1–3, the coefficients of E_scale are negative and the coefficients of E_intensity are positive, but they are all not significant. Therefore, hypotheses H1a and H1c are not supported, indicating that there was no significant trend of being allocated with higher environmental targets for provinces with lower scale performance and lower intensity performance in energy consumption and pollutant emissions. In all the three models, the coefficients of the P_ranking are all significantly positive (p < 0.05), fully supporting Hypothesis H2b. Therefore, provinces with higher probabilities of provincial leaders being promoted to Politburo members were more likely to be allocated higher environmental targets.
Some control variables are also significant in these models. For example, the coefficient of P_target is positive and significant (p < 0.01) in Model 1, which means provinces which were allocated higher environmental targets during the “11th Five-year Plan” period also tended to be allocated higher environmental targets during the “12th Five-year Plan” period. In Model 2, the coefficient of Neighbor is positive and significant (p < 0.01), and hence, it concludes that provinces whose neighboring provinces were allocated higher environmental targets also tended to be allocated higher environmental targets. In Model 3, the coefficient of Central is positive and significant (p < 0.01), indicating that provinces were allocated higher environmental targets for this corresponding indicator when the central government set a higher environmental target for one environmental indicator. Moreover, the variable of Unemployment is significantly negatively related to the dependent variable in Models 2 and 3, which implies provinces with higher unemployment rates were allocated lower environmental targets. The Chi-square values of Models 1–3 are very significant (p < 0.01), indicating that they fit the data well. Moreover, when we re-estimate these models with the ordinary least square regression, the results are similar, indicating that the findings are robust.
Robustness Check
We then re-measure E_scale, E_structure, and E_intensity with the difference between the investigated province’s scale performance and the average scale performance of its neighboring provinces for the investigated environmental indicator, the difference between the investigated province’s structural performance and the average structural performance of its neighboring provinces for the investigated environmental indicator, and the difference between the investigated province’s intensity performance and the average intensity performance of its neighboring provinces for the investigated environmental indicator, which are coded as R_scale, R_structure, and R_intensity, respectively. We then put these three new variables into models to do a robustness check. Results of the three new HLM models are shown in Table 5. The three variables of P_target, Neighbor, and Central are also put into regression models separately in order to control multicollinearity (see Models 4–6). The variance inflation factors of all variables in Models 4–6 are all smaller than the critical value 10, and hence, there is no severe multicollinearity [39].
In Models 4–6, R_structure and Target are all significantly positively related (p < 0.1), and hence, Hypothesis H1b is still supported; in the Model 5, the coefficient of R_scale is significantly negative (p < 0.1), and it remains negative in Models 4 and 6, still failing to support Hypotheses H1a. The coefficients of R_intensity are positive but not significant in Models 4–6, and hence, Hypothesis H1c is still not supported. Besides, the coefficients of P_ranking are all significantly positive (p < 0.05) in Models 4–6, thus supporting hypothesis H2b. Overall, these results of Models 4–6 are consistent with those of Models 1–3, implying our findings are highly robust. The results conclude that the decomposition of environmental targets mainly depends on provinces’ historical structural performance and their political rankings. This means the decomposition of environmental targets in China is both performance-based and politic-related.
6. Discussion and Conclusions
This work explores the roles of historical performance and provinces’ political status in the decomposition of environmental targets by controlling a set of factors advocated in previous goal-setting research. Data from five environmental indicators (sulfur dioxide, chemical oxygen demand, energy consumption for per unit GDP, nitrogen oxide, and ammonia nitrogen) of 29 provinces in mainland China during the “12th Five-year Plan” period are used to test these hypotheses. Considering the nested data structure, HLM is used for estimation. The findings show that the structural performance of energy consumption and pollutant emissions of provinces is significantly negatively related to environmental target levels, while the scale performance and intensity performance of provinces’ energy consumption and pollutant emissions are not significantly related to provinces’ environmental target levels. Provinces with higher probabilities of provincial leaders being promoted to politburo members tend to be allocated higher environmental targets, though the wealth is controlled. This finding means that the decomposition of environmental targets in China is partially performance-based but strongly politic-related.
The historical structural performance of energy consumption and pollutant emissions is significantly correlated with the setting of environmental target aspiration levels, while the effects of historical scale performance and intensity performance are not significant. This finding confirms the limited and partial role of historical performance in China’s environmental target-setting and implies that the central government mainly considered the pollutant emission and energy consumption reduction potentials of Chinese provinces through the adjustment of economic development structures. Similar to the “scale economies effect” in economics, there is still a scale effect in pollutant emission and energy consumption reduction. Thus, it is easier for the province to reduce pollutant emissions and energy consumption when the scale of its previous pollutant emissions and energy consumption is large. However, the nonsignificant effect of the historical scale performance implies that the central government ignored the scale effect when evaluating the pollutant emission reduction potentials. Intensity performance is also not significant, which means the central government also underestimated the reduction potentials by using technological advances to improve pollutant emission efficiency in environmental target-setting. Some scholars hold that carbon intensity convergence can be used to make carbon reduction target allocation reasonable, which means provinces with relatively higher CO2 intensities of GDP should be assigned higher CO2 intensity reduction targets and vice versa [40]. Their ideas are in line with our arguments to a great extent.
This work also reveals some clues about the different effects of historical performance in the setting of obligatory targets and the setting of anticipated targets in China. Generally, historical performance is positively related to the setting of anticipatory targets because better historical performance can enhance the organization’s confidence in setting higher anticipatory target aspiration levels [10,18]. This observation reveals that the setting of anticipated targets follows the law of “addition”, which means organizations set their anticipated targets through increasing certain percentages of performance based on their historical performance. However, historical performance is negatively related to environmental obligatory targets, mainly because environmental obligatory targets are allocated by the superior government, and lower historical pollutant emission performance means greater pollutant emission reduction potentials. This finding reveals that the setting of environmental obligatory targets follows the “law of subtraction”, which means organizations set their obligatory targets through decreasing certain percentages of pollutant emissions or energy consumption based on their historical performance.
Chinese provincial governments set their anticipated target aspiration levels themselves, while Chinese provincial governments’ obligatory targets are allocated by the central government [13,16]. During the allocation process, local governments interact with the central government; this work finds that provinces with different political rankings set different environmental obligatory target aspiration levels. Based on two competing hypotheses of the “bargaining effect” and “model effect”, the empirical results support the “model effect hypothesis”. This indicates that provinces with higher political rankings do not take advantage of their own political capital to bargain with the central government to strive for lower environmental obligatory target levels. Instead, these provinces tend to play the role of “leading models” and accept higher environmental obligatory target aspiration levels allocated by the central government. One possible explanation is that these provinces are motivated by political promotion incentives: leaders (party secretary and governor) in the provinces with higher political rankings have higher likelihoods of being promoted to the Politburo in China; in this case, these provinces are more likely to follow the policy preference of the central government and strive to keep their advantages by performing well in the performance dimension and subsequently being favored by the central government [28].
The findings provide some important practical policy implications. First, the national environmental targets should be decomposed based on provinces’ historical scale performance, structural performance, and intensity performance in pollutant emissions and energy consumption comprehensively. Specifically, the higher the proportion of the secondary industrial output of one province is, the higher target the province should be allocated; the higher the scale of pollutant emissions and energy consumption of one province is, the higher target the province should be allocated; the higher the pollutant emissions and energy consumption per unit GDP of one province is, the higher target the province should be allocated. Second, provinces with higher probabilities of provincial leaders being promoted to politburo members are incentivized by potential political promotions to comply with national environmental targets, and hence, other kinds of incentives (financial incentives, moral incentives, etc.) can also be provided for provincial governments in order to make them comply with environment-related central directives actively [35].
Though this work takes the first step to explore the hidden logic in the decomposition of environmental targets in China empirically, its limitations also provide some future research avenues. On the one hand, this work focuses on the disaggregation of environmental targets from the central government to Chinese provincial governments and more evidence is needed about the antecedents of the decomposition of environmental targets from Chinese provincial governments to city governments. On the other hand, this work explores determinants of the decomposition of environmental targets in China during the “12th Five-Year Plan” period. Future studies can explore features and determinants of environmental target-setting during the “11th Five-Year Plan” period and the “13th Five-Year Plan” period, which can help reveal the evolution features of environmental target-setting across various “Five-year Plan” periods through comparison.
Author Contributions
P.Z. designed the research, compiled the data, performed initial experiments, and produced early drafts; J.W. and P.Z. reviewed the drafts, did revisions, and approved the final version together.
Funding
This research was funded by the National Social Science Fund of China (grant number [17CGL069]) and the Key Philosophy and Social Science Research Project of the Ministry of Education of China (grant number [17JZD025]).
Conflicts of Interest
The authors declare no conflict of interest.
References
- Moynihan, D.P. Managing for results in state government: Evaluating a decade of reform. Public Adm. Rev. 2006, 66, 77–89. [Google Scholar] [CrossRef]
- Latham, G.P.; Borgogni, L.; Petitta, L. Goal setting and performance management in the public sector. Int. Public Manag. J. 2008, 11, 385–403. [Google Scholar] [CrossRef]
- Gao, J. Governing by goals and numbers: A case study in the use of performance measurement to build state capacity in China. Public Adm. Dev. 2009, 29, 21–31. [Google Scholar] [CrossRef] [Green Version]
- Mu, R. Bounded rationality in the developmental trajectory of environmental target policy in China, 1972–2016. Sustainability 2018, 10, 199. [Google Scholar] [CrossRef]
- Locke, E.A.; Shaw, K.N.; Saari, L.M.; Latham, G.P. Goal setting and task performance: 1969–1980. Psychol. Bull. 1981, 90, 125–152. [Google Scholar] [CrossRef]
- Locke, E.A.; Latham, G.P. Building a practically useful theory of goal setting and task motivation: A 35-year odyssey. Am. Psychol. 2002, 57, 705–717. [Google Scholar] [CrossRef] [PubMed]
- Zhang, P.; Wu, J.N. Impact of mandatory targets on PM2.5 concentration control in Chinese cities. J. Clean. Prod. 2018, 197, 323–331. [Google Scholar] [CrossRef]
- Cyert, R.M.; March, J.G. A Behavioral Theory of the Firm, 2nd ed.; Blackwell Business: Malden, MA, USA, 1992. [Google Scholar]
- Greve, H.R. Organization Learning from Performance Feedback: A Behavioral Perspective on Innovation and Change; Cambridge University Press: Cambridge, UK, 2003. [Google Scholar]
- Ma, L. Performance feedback, government goal-setting and aspiration level adaptation: Evidence from Chinese provinces. Public Adm. 2016, 94, 452–471. [Google Scholar] [CrossRef]
- Rutherford, A.; Meier, K.J. Managerial goals in a performance-driven system: Theory and empirical tests in higher education. Public Adm. 2015, 93, 17–33. [Google Scholar] [CrossRef]
- Nielsen, P.A. Learning from performance feedback: Performance information, aspiration levels, and managerial priorities. Public Adm. 2014, 92, 142–160. [Google Scholar] [CrossRef]
- Zhao, X.F.; Wu, L. Interpreting the evolution of the energy-saving target allocation system in China (2006–13): A view of policy learning. World Dev. 2016, 82, 83–94. [Google Scholar] [CrossRef]
- Wu, J.N.; Zhang, P.; Yi, H.T.; Qin, Z. What causes haze pollution? An empirical study of PM2.5 concentrations in Chinese cities. Sustainability 2016, 8, 132. [Google Scholar] [CrossRef]
- Li, H.M.; Zhao, X.F.; Yu, Y.Q.; Wu, T.; Qi, Y. China’s numerical management system for reducing national energy intensity. Energy Policy 2016, 94, 64–76. [Google Scholar] [CrossRef]
- Xu, Y. The use of a goal for SO2 mitigation planning and management in China’s 11th Five-Year Plan. J. Environ. Plan. Manag. 2011, 54, 769–783. [Google Scholar] [CrossRef]
- Lant, T.K. Aspiration level adaptation: An empirical exploration. Manag. Sci. 1992, 38, 623–644. [Google Scholar] [CrossRef]
- Mezias, S.J.; Chen, Y.R.; Murphy, P.R. Aspiration-level adaptation in an American financial services organization: A field study. Manag. Sci. 2002, 48, 1285–1300. [Google Scholar] [CrossRef]
- Argote, L.; Greve, H.R. A behavioral theory of the firm—40 years and counting: Introduction and impact. Organ. Sci. 2007, 18, 337–349. [Google Scholar] [CrossRef]
- Meier, K.J.; Favero, N.; Zhu, L. Performance gaps and managerial decisions: A Bayesian decision theory of managerial action. J. Public Adm. Res. Theory 2015, 25, 1221–1246. [Google Scholar] [CrossRef]
- Zhou, L.; Zhang, X.L.; Qi, T.Y.; He, J.K.; Luo, X.H. Regional disaggregation of China’s national carbon intensity reduction target by reduction pathway analysis. Energy Sustain. Dev. 2014, 23, 25–31. [Google Scholar] [CrossRef]
- Kanie, N.; Nishimoto, H.; Hijioka, Y.; Kameyama, Y. Allocation and architecture in climate governance deyond Kyoto: Lessons from interdisciplinary research on target setting. Int. Environ. Agreem. Polit. Law Econ. 2010, 10, 299–315. [Google Scholar] [CrossRef]
- Liu, Z.; Shi, Y.R.; Yan, J.M.; Qu, X.M.; Lieu, J. Research on the decomposition model for China’s National Renewable Energy total target. Energy Policy 2012, 51, 110–120. [Google Scholar] [CrossRef]
- Zhang, L.X.; Feng, Y.Y.; Zhao, B.H. Disaggregation of energy-saving targets for China’s provinces: Modeling results and real choices. J. Clean. Prod. 2015, 103, 837–846. [Google Scholar] [CrossRef]
- Tang, X.; Liu, Z.W.; Yi, H.T. Mandatory targets and environmental performance: An analysis based on regression discontinuity design. Sustainability 2016, 8, 931. [Google Scholar] [CrossRef]
- Wu, J.N.; Xu, M.M.; Zhang, P. The impacts of governmental performance assessment policy and citizen participation on improving environmental performance across Chinese provinces. J. Clean. Prod. 2018, 184, 227–238. [Google Scholar] [CrossRef]
- Wu, J.N.; Zhang, P. Local government innovation diffusion in China: An event history analysis of a performance-based reform programme. Int. Rev. Adm. Sci. 2018, 84, 63–81. [Google Scholar] [CrossRef]
- Liang, J.Q.; Langbein, L. Performance management, high-powered incentives, and environmental policies in China. Int. Public Manag. J. 2015, 18, 346–385. [Google Scholar] [CrossRef]
- Zhao, X.L.; Ma, C.B.; Hong, D.Y. Why did China’s energy intensity increase during 1998–2006: Decomposition and policy analysis. Energy Policy 2010, 38, 1379–1388. [Google Scholar] [CrossRef] [Green Version]
- Hammond, G.P.; Norman, J.B. Decomposition analysis of energy-related carbon emissions from UK manufacturing. Energy 2012, 41, 220–227. [Google Scholar] [CrossRef] [Green Version]
- Liang, J.Q. Who maximizes (or satisfices) in performance management? An empirical study of the effects of motivation-related institutional contexts on energy efficiency policy in China. Public Perform. Manag. Rev. 2015, 38, 284–315. [Google Scholar] [CrossRef]
- Li, J.Y. The paradox of performance regimes: Strategic responses to target regimes in Chinese local government. Public Adm. 2015, 93, 1152–1167. [Google Scholar] [CrossRef]
- Manion, M. The cadre management system, post-Mao: The appointment, promotion, transfer and removal of party and state leaders. China Q. 1985, 102, 203–233. [Google Scholar] [CrossRef]
- Chan, H.S. Cadre personnel management in China: The nomenklatura system, 1990–1998. China Q. 2004, 179, 703–734. [Google Scholar] [CrossRef]
- Ran, R. Perverse incentive structure and policy implementation gap in China’s local environmental politics. J. Environ. Policy Plan. 2013, 15, 17–39. [Google Scholar] [CrossRef]
- Berry, F.S.; Berry, W.D. State lottery adoptions as policy innovations: An event history analysis. Am. Polit. Sci. Rev. 1990, 84, 395–415. [Google Scholar] [CrossRef]
- Ma, L. Performance management and citizen satisfaction with the government: Evidence from Chinese municipalities. Public Adm. 2017, 95, 39–59. [Google Scholar] [CrossRef]
- Aguinis, H.; Gottfredson, R.K.; Culpepper, S.A. Best-practice recommendations for estimating cross-level interaction effects using multilevel modeling. J. Manag. 2013, 39, 1490–1528. [Google Scholar] [CrossRef]
- Kutner, M.H.; Nachtsheim, C.J.; Neter, J.; Li, W. Applied Linear Statistical Models; McGraw-Hill Irwin: New York, NY, USA, 2005. [Google Scholar]
- Hao, Y.; Liao, H.; Wei, Y.M. Is China’s carbon reduction target allocation reasonable? An Analysis based on carbon intensity convergence. Appl. Energy 2015, 142, 229–239. [Google Scholar] [CrossRef]
Figure 1.
Theoretical Framework.

Table 1.
Variables, measures, and sources.
| Variables | Measures | Sources |
|---|---|---|
| Target | The target level of the investigated province for the investigated environmental obligatory indicator in the “12th Five-year Plan” Period (%) | FYP |
| E_scale | The ratio between the investigated province’s total energy consumption and the national total energy consumption or the ratio of the investigated province’s total pollutant emission and the national total pollutant emission (one-year lagged) | CSY CESY CEY |
| E_structure | The proportion of the secondary industrial output of the investigated province (one-year lagged, %) | CSY |
| E_intensity | The ratio between the investigated province’s energy consumption per unit GDP and the national energy consumption per unit GDP or the ratio between the investigated province’s pollutant emission per unit GDP and the national total pollutant emission per unit GDP (one-year lagged) | CSY CESY CEY |
| P_ranking | Number of secretaries/governors of the investigated province who had served as members of the Politburo from 1997 to 2011 | Author |
| P_target | The target level of the investigated province for the investigated environmental obligatory indicator in the “11th Five-year Plan” period (%) | FYP |
| Neighbor | The average target level of the investigated province’s neighboring provinces for the investigated environmental indicator (%) | Author |
| Central | The target level of the central government for the investigated environmental indicator (%) | FYP |
| Deprivation | Unemployment rate of the investigated province (one-year lagged, %) | CSY |
| GDP | GDP per capita of the investigated province (one-year lagged, log) | CSY |
Notes: FYP indicates Five-year Plans; CSY indicates the China Statistical Yearbook; CNSY indicates the China Energy Statistical Yearbook; CEY indicates the China Environment Yearbook.
Table 2.
Descriptive analysis results.
| Variables | N | Mean | S.D. | Min | Max |
|---|---|---|---|---|---|
| Target | 145 | 9.75 | 7.17 | −34.90 | 18 |
| E_scale | 145 | 3.36 | 2 | 0.13 | 8.94 |
| E_structure | 29 | 49.18 | 7.72 | 24 | 57.3 |
| E_intensity | 145 | 1.25 | 0.76 | 0.16 | 4.99 |
| P_ranking | 29 | 2.41 | 2.69 | 0 | 11 |
| P_target | 87 | 13.29 | 6.76 | 0 | 30 |
| Neighbor | 145 | 10.61 | 3.74 | 1.48 | 18 |
| Central | 145 | 10.40 | 2.95 | 8 | 16 |
| Unemployment | 29 | 3.61 | 0.61 | 1.37 | 4.35 |
| GDP | 29 | 0.49 | 0.2 | 0.12 | 0.87 |
Table 3.
Correlation analysis results.
| Variables | 1 | 2 | 3 | 4 | 5 | 6 | 7 | 8 | 9 |
|---|---|---|---|---|---|---|---|---|---|
| 1. Target | 1 | ||||||||
| 2. E_scale | 0.38 *** | 1 | |||||||
| 3. E_structure | 0.26 *** | 0.41 *** | 1 | ||||||
| 4. E_intensity | −0.17 ** | 0.035 | 0.14 * | 1 | |||||
| 5. P_ranking | 0.28 *** | 0.08 | −0.19 ** | −0.48 *** | 1 | ||||
| 6. P_target | 0.70 *** | 0.22 ** | 0.06 | −0.16 | 0.26 ** | 1 | |||
| 7. Neighbor | 0.59 *** | 0.09 | −0.05 | −0.32 *** | 0.30 *** | 0.76 *** | 1 | ||
| 8. Central | 0.45 *** | 0.004 | 0 | −0.065 | 0 | 0.69 *** | 0.78 *** | 1 | |
| 9. Unemployment | −0.07 | −0.03 | 0.45 *** | 0.34 *** | −0.28 *** | −0.10 | −0.13 | 0 | 1 |
| 10. GDP | 0.29 *** | 0.119 | −0.07 | −0.48 *** | 0.62 *** | 0.31 *** | 0.31 *** | 0 | −0.33 *** |
Notes: *** p < 0.01, ** p < 0.05, * p < 0.1.
Table 4.
Regression results of hierarchical linear models (HLM).
| Model 1 | Model 2 | Model 3 | |
|---|---|---|---|
| Constant | 9.988 *** | 9.748 *** | 9.748 *** |
| (0.622) | (0.644) | (0.644) | |
| Layer-2 variables | |||
| P_ranking | 0.545 ** | 0.640 ** | 0.640 ** |
| (0.250) | (0.297) | (0.297) | |
| E_structure | 0.323 ** | 0.349 ** | 0.349 ** |
| (0.162) | (0.173) | (0.173) | |
| Unemployment | −1.304 | −1.472 * | −1.472 * |
| (0.860) | (0.806) | (0.806) | |
| GDP | 5.094 | 4.792 | 4.792 |
| (3.598) | (3.433) | (3.433) | |
| Layer-1 variables | |||
| E_scale | −1.013 | −1.438 | −1.186 |
| (1.153) | (0.885) | (0.907) | |
| E_intensity | 3.302 | 3.911 | 3.346 |
| (3.438) | (2.616) | (2.613) | |
| P_target | 0.753 *** | ||
| (0.0949) | |||
| Neighbor | 1.188 *** | ||
| (0.153) | |||
| Central | 1.152 *** | ||
| (0.137) | |||
| Model statistics | |||
| N (layer 1) | 87 | 145 | 145 |
| N (layer 2) | 29 | 29 | 29 |
| Variance (layer 1) | 30.43 | 18.51 | 22.15 |
| Variance (layer 2) | 7.04 × 10⁻¹¹ | 7.92 | 7.20 |
| Intra-class Correlation Coefficient | 2.3135 × 10⁻¹² | 0.2997 | 0.2453 |
| Log pseudolikelihood | −272.023 | −433.928 | −444.317 |
| Wald Chi2 | 166.72 *** | 175.78 *** | 210.86 *** |
Notes: *** p < 0.01, ** p < 0.05, * p < 0.1. Robust standard errors are presented in parentheses. Regression results based on the ordinary least square estimation are similar.
Table 5.
Regression results of HLM.
| Model 4 | Model 5 | Model 6 | |
|---|---|---|---|
| Constant | 10.06 *** | 9.748 *** | 9.7483 *** |
| (0.608) | (0.668) | (0.668) | |
| Layer-2 variables | |||
| P_ranking | 0.569 ** | 0.672 ** | 0.672 ** |
| (0.246) | (0.305) | (0.305) | |
| R_structure | 0.270 * | 0.302 * | 0.302 * |
| (0.153) | (0.166) | (0.166) | |
| Unemployment | −0.880 | −1.289 * | −1.289 * |
| (0.898) | (0.747) | (0.747) | |
| GDP | 4.704 | 4.476 | 4.476 |
| (3.362) | (3.420) | (3.420) | |
| Layer-1 variables | |||
| R_scale | −2.006 | −1.686 * | −1.354 |
| (1.289) | (0.894) | (0.956) | |
| R_intensity | 4.885 | 3.967 | 3.789 |
| (3.590) | (2.483) | (2.644) | |
| P_target | 0.720 *** | ||
| (0.075) | |||
| Neighbor | 1.131 *** | ||
| (0.121) | |||
| Central | 1.097 *** | ||
| (0.108) | |||
| Model statistics | |||
| N (layer 1) | 87 | 145 | 145 |
| N (layer 2) | 29 | 29 | 29 |
| Variance (layer 1) | 28.594 | 18.200 | 21.655 |
| Variance (layer 2) | 1.478 | 8.871 | 8.180 |
| Intraclass Correlation Coefficient | 0.0491 | 0.3277 | 0.2742 |
| Log pseudolikelihood | −271.403 | −434.001 | −444.081 |
| Wald Chi2 | 145.21 *** | 191.62 *** | 192.23 *** |
Notes: *** p < 0.01, ** p < 0.05, * p < 0.1; robust standard error in parentheses. Regression results based on the ordinary least square estimation are similar.
© 2018 by the authors. Licensee MDPI, Basel, Switzerland. This article is an open access article distributed under the terms and conditions of the Creative Commons Attribution (CC BY) license (http://creativecommons.org/licenses/by/4.0/).
Share and Cite
MDPI and ACS Style
Zhang, P.; Wu, J. Performance-Based or Politic-Related Decomposition of Environmental Targets: A Multilevel Analysis in China. Sustainability 2018, 10, 3410. https://doi.org/10.3390/su10103410
AMA Style
Zhang P, Wu J. Performance-Based or Politic-Related Decomposition of Environmental Targets: A Multilevel Analysis in China. Sustainability. 2018; 10(10):3410. https://doi.org/10.3390/su10103410
Chicago/Turabian StyleZhang, Pan, and Jiannan Wu. 2018. "Performance-Based or Politic-Related Decomposition of Environmental Targets: A Multilevel Analysis in China" Sustainability 10, no. 10: 3410. https://doi.org/10.3390/su10103410
Note that from the first issue of 2016, this journal uses article numbers instead of page numbers. See further details here.