Assessment of Critical Infrastructure Resilience to Flooding Using a Response Curve Approach


Abstract
:1. Introduction
2. Resilience Literature and Application of the Concept
2.1. Flood Risk and Resilience in Literature
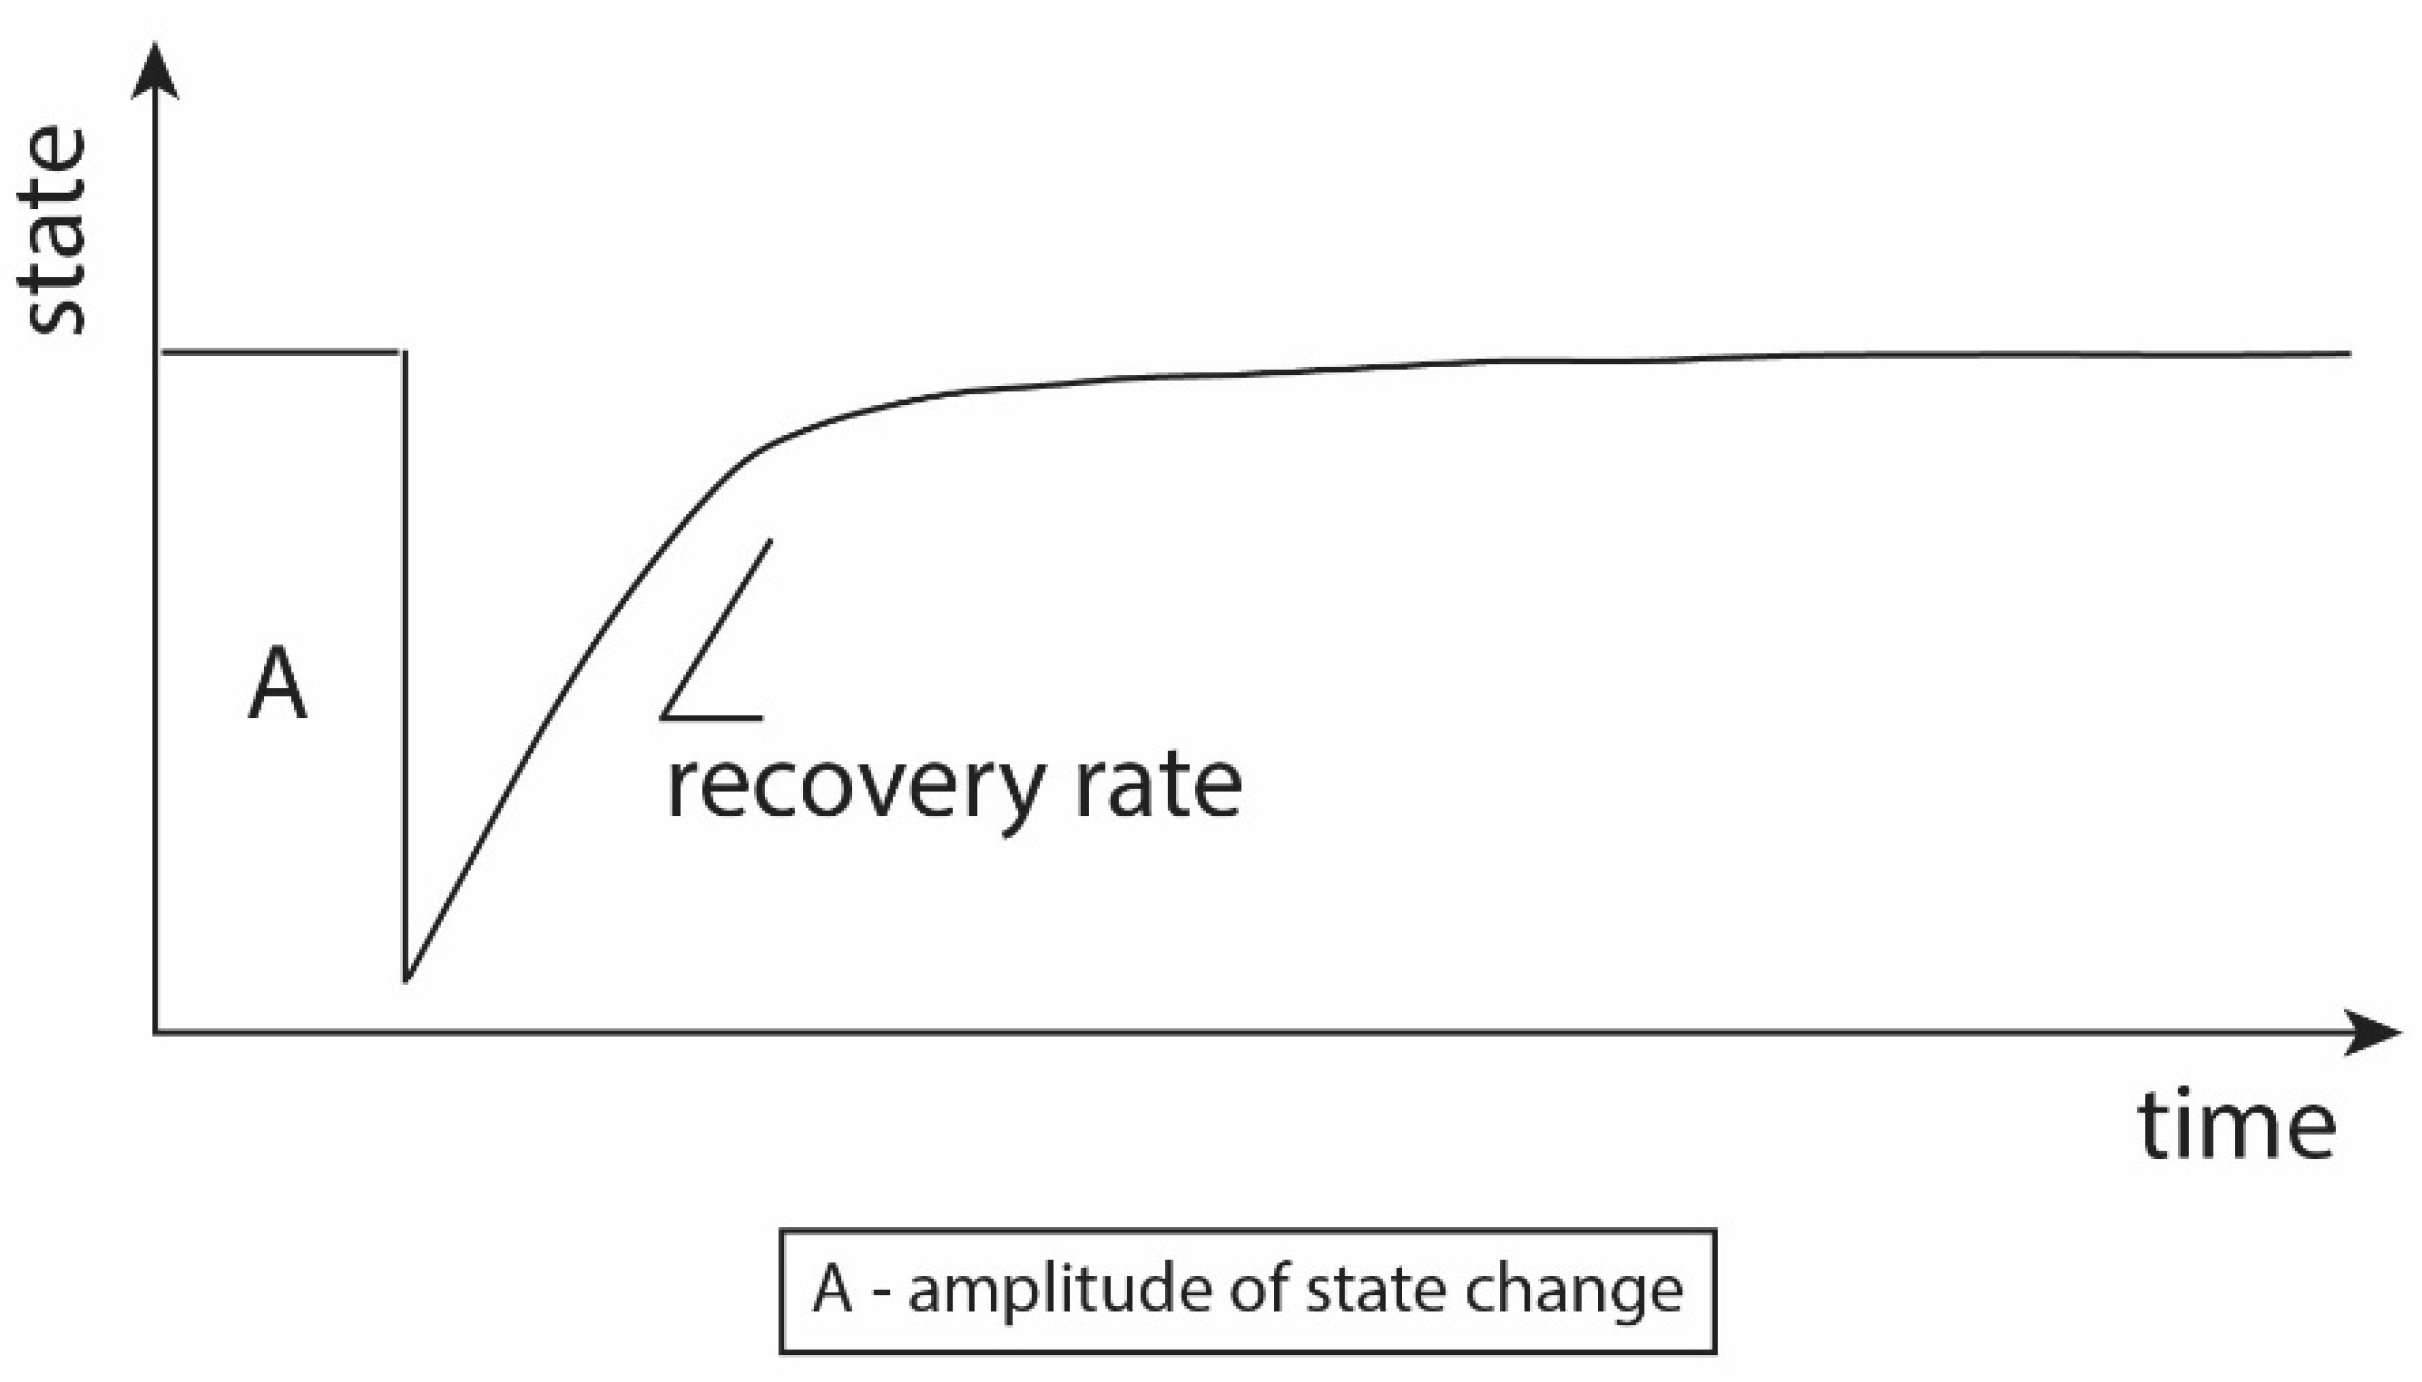
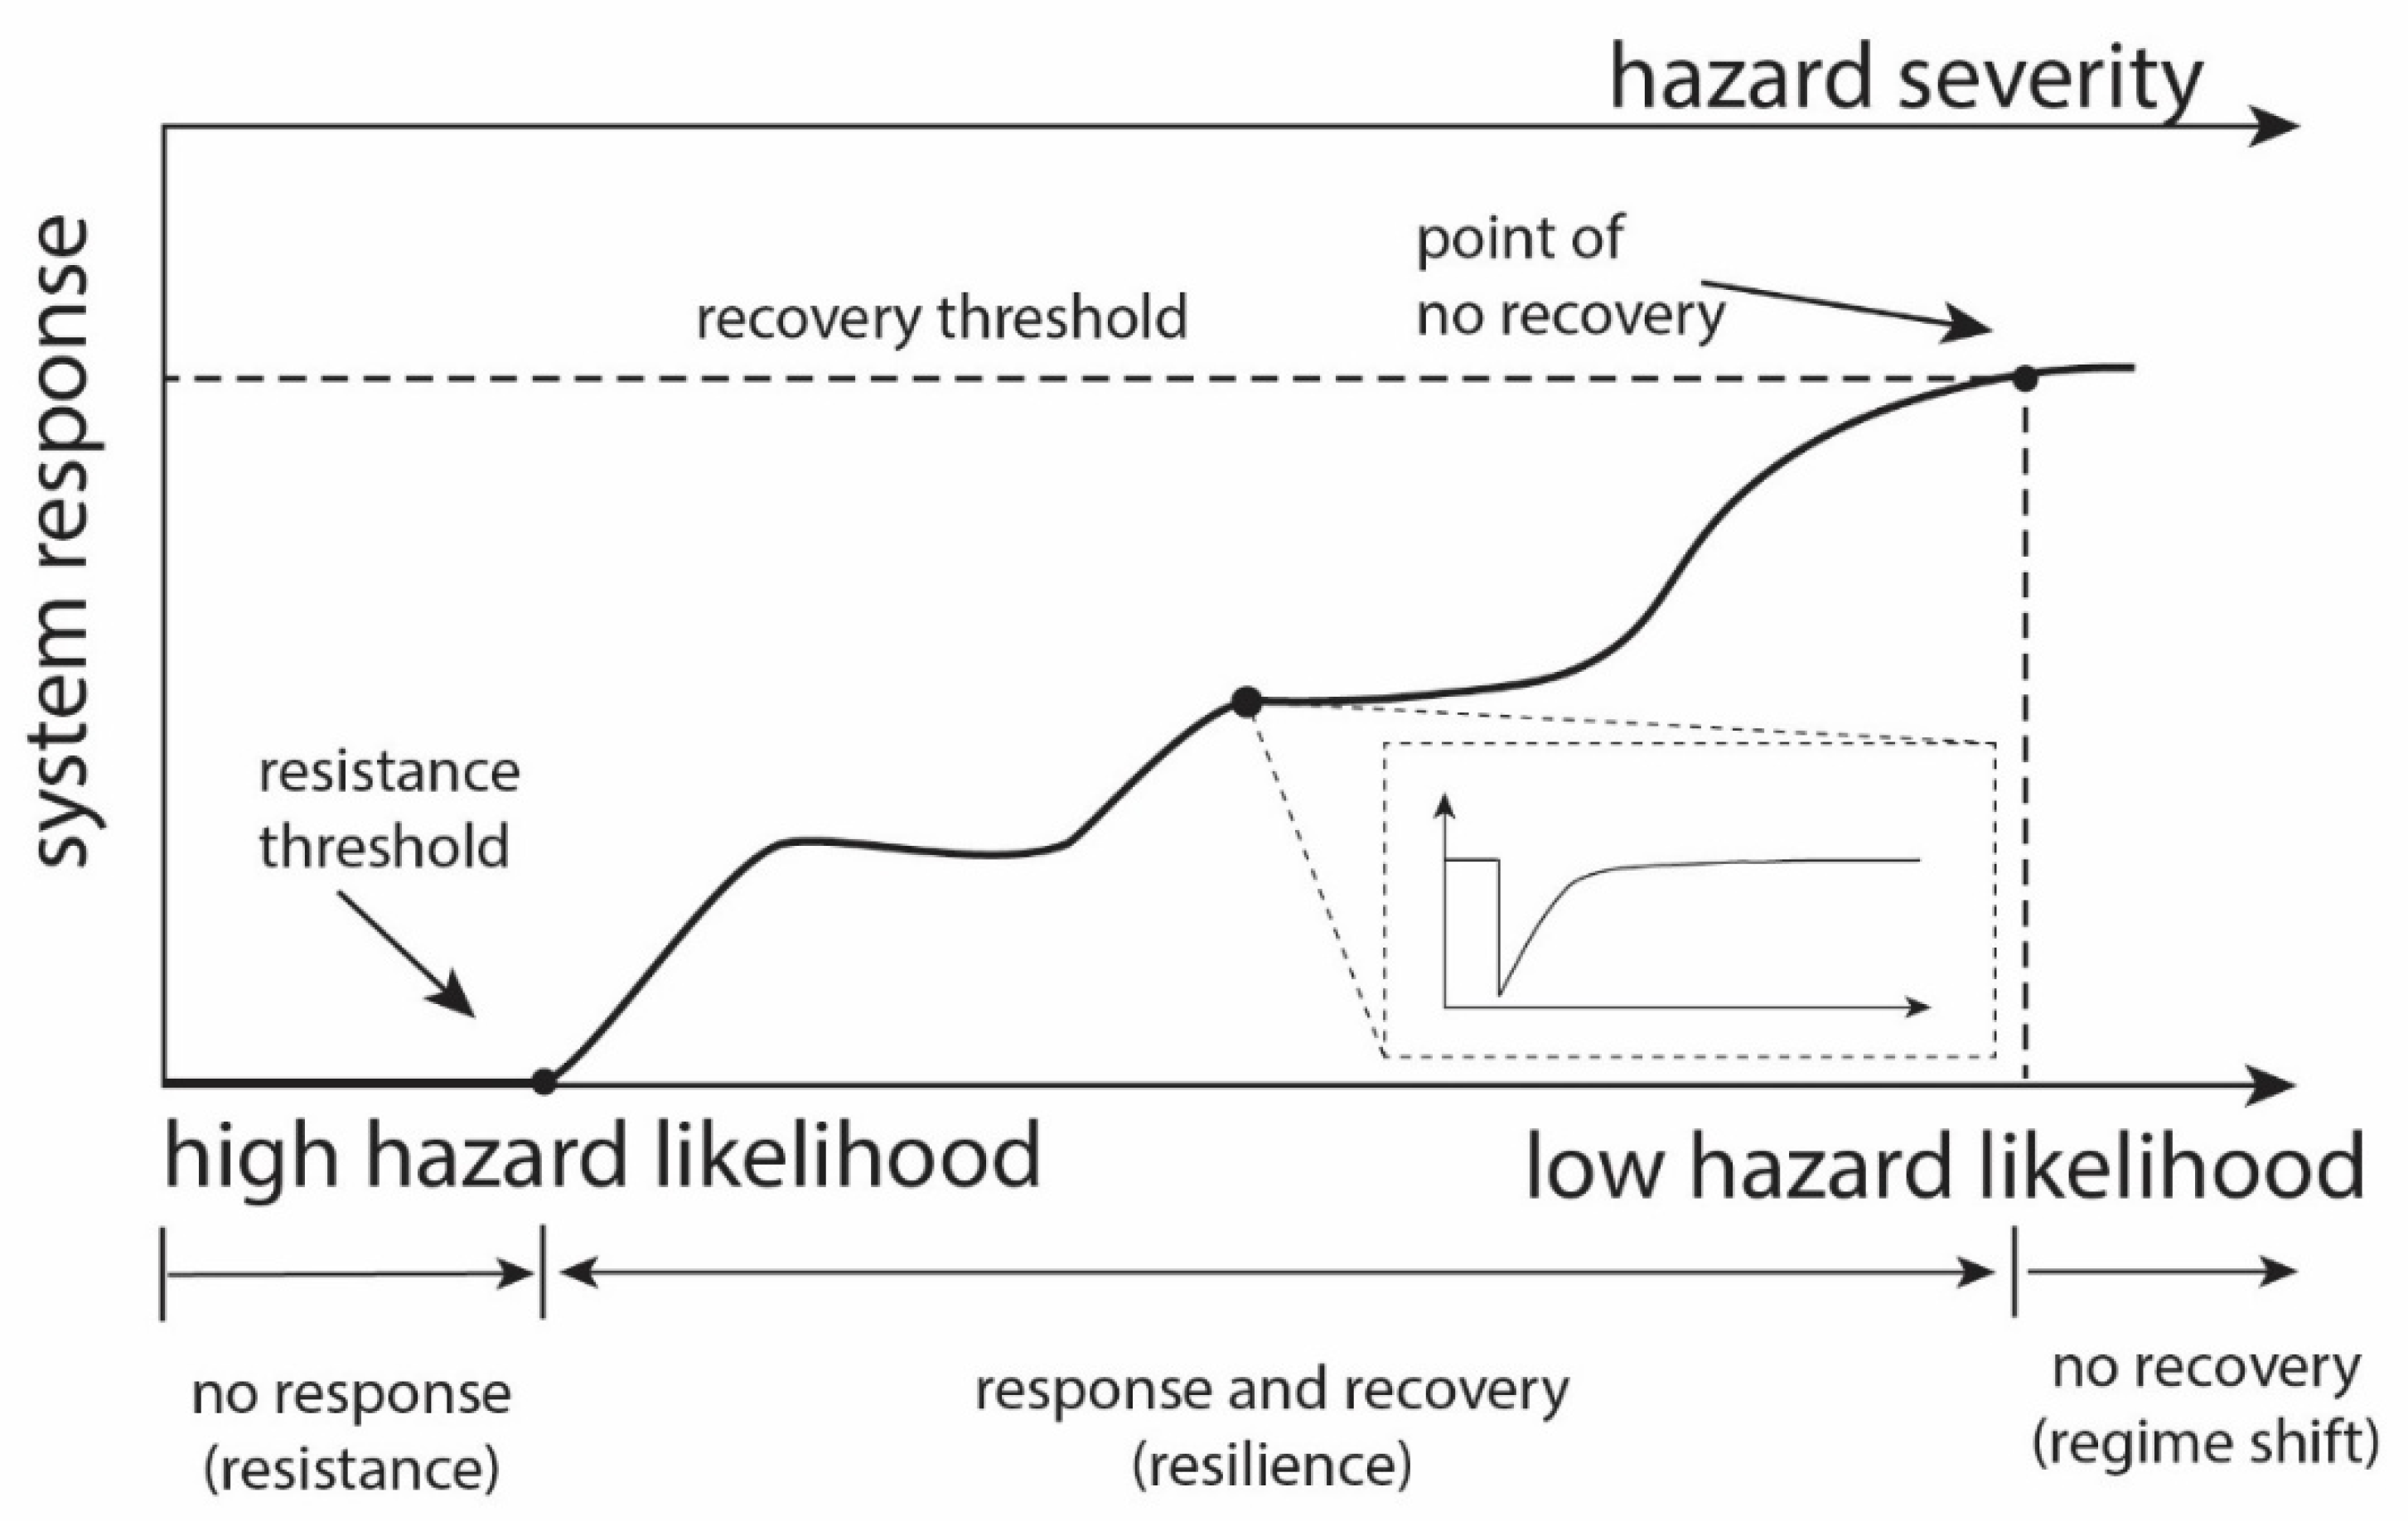
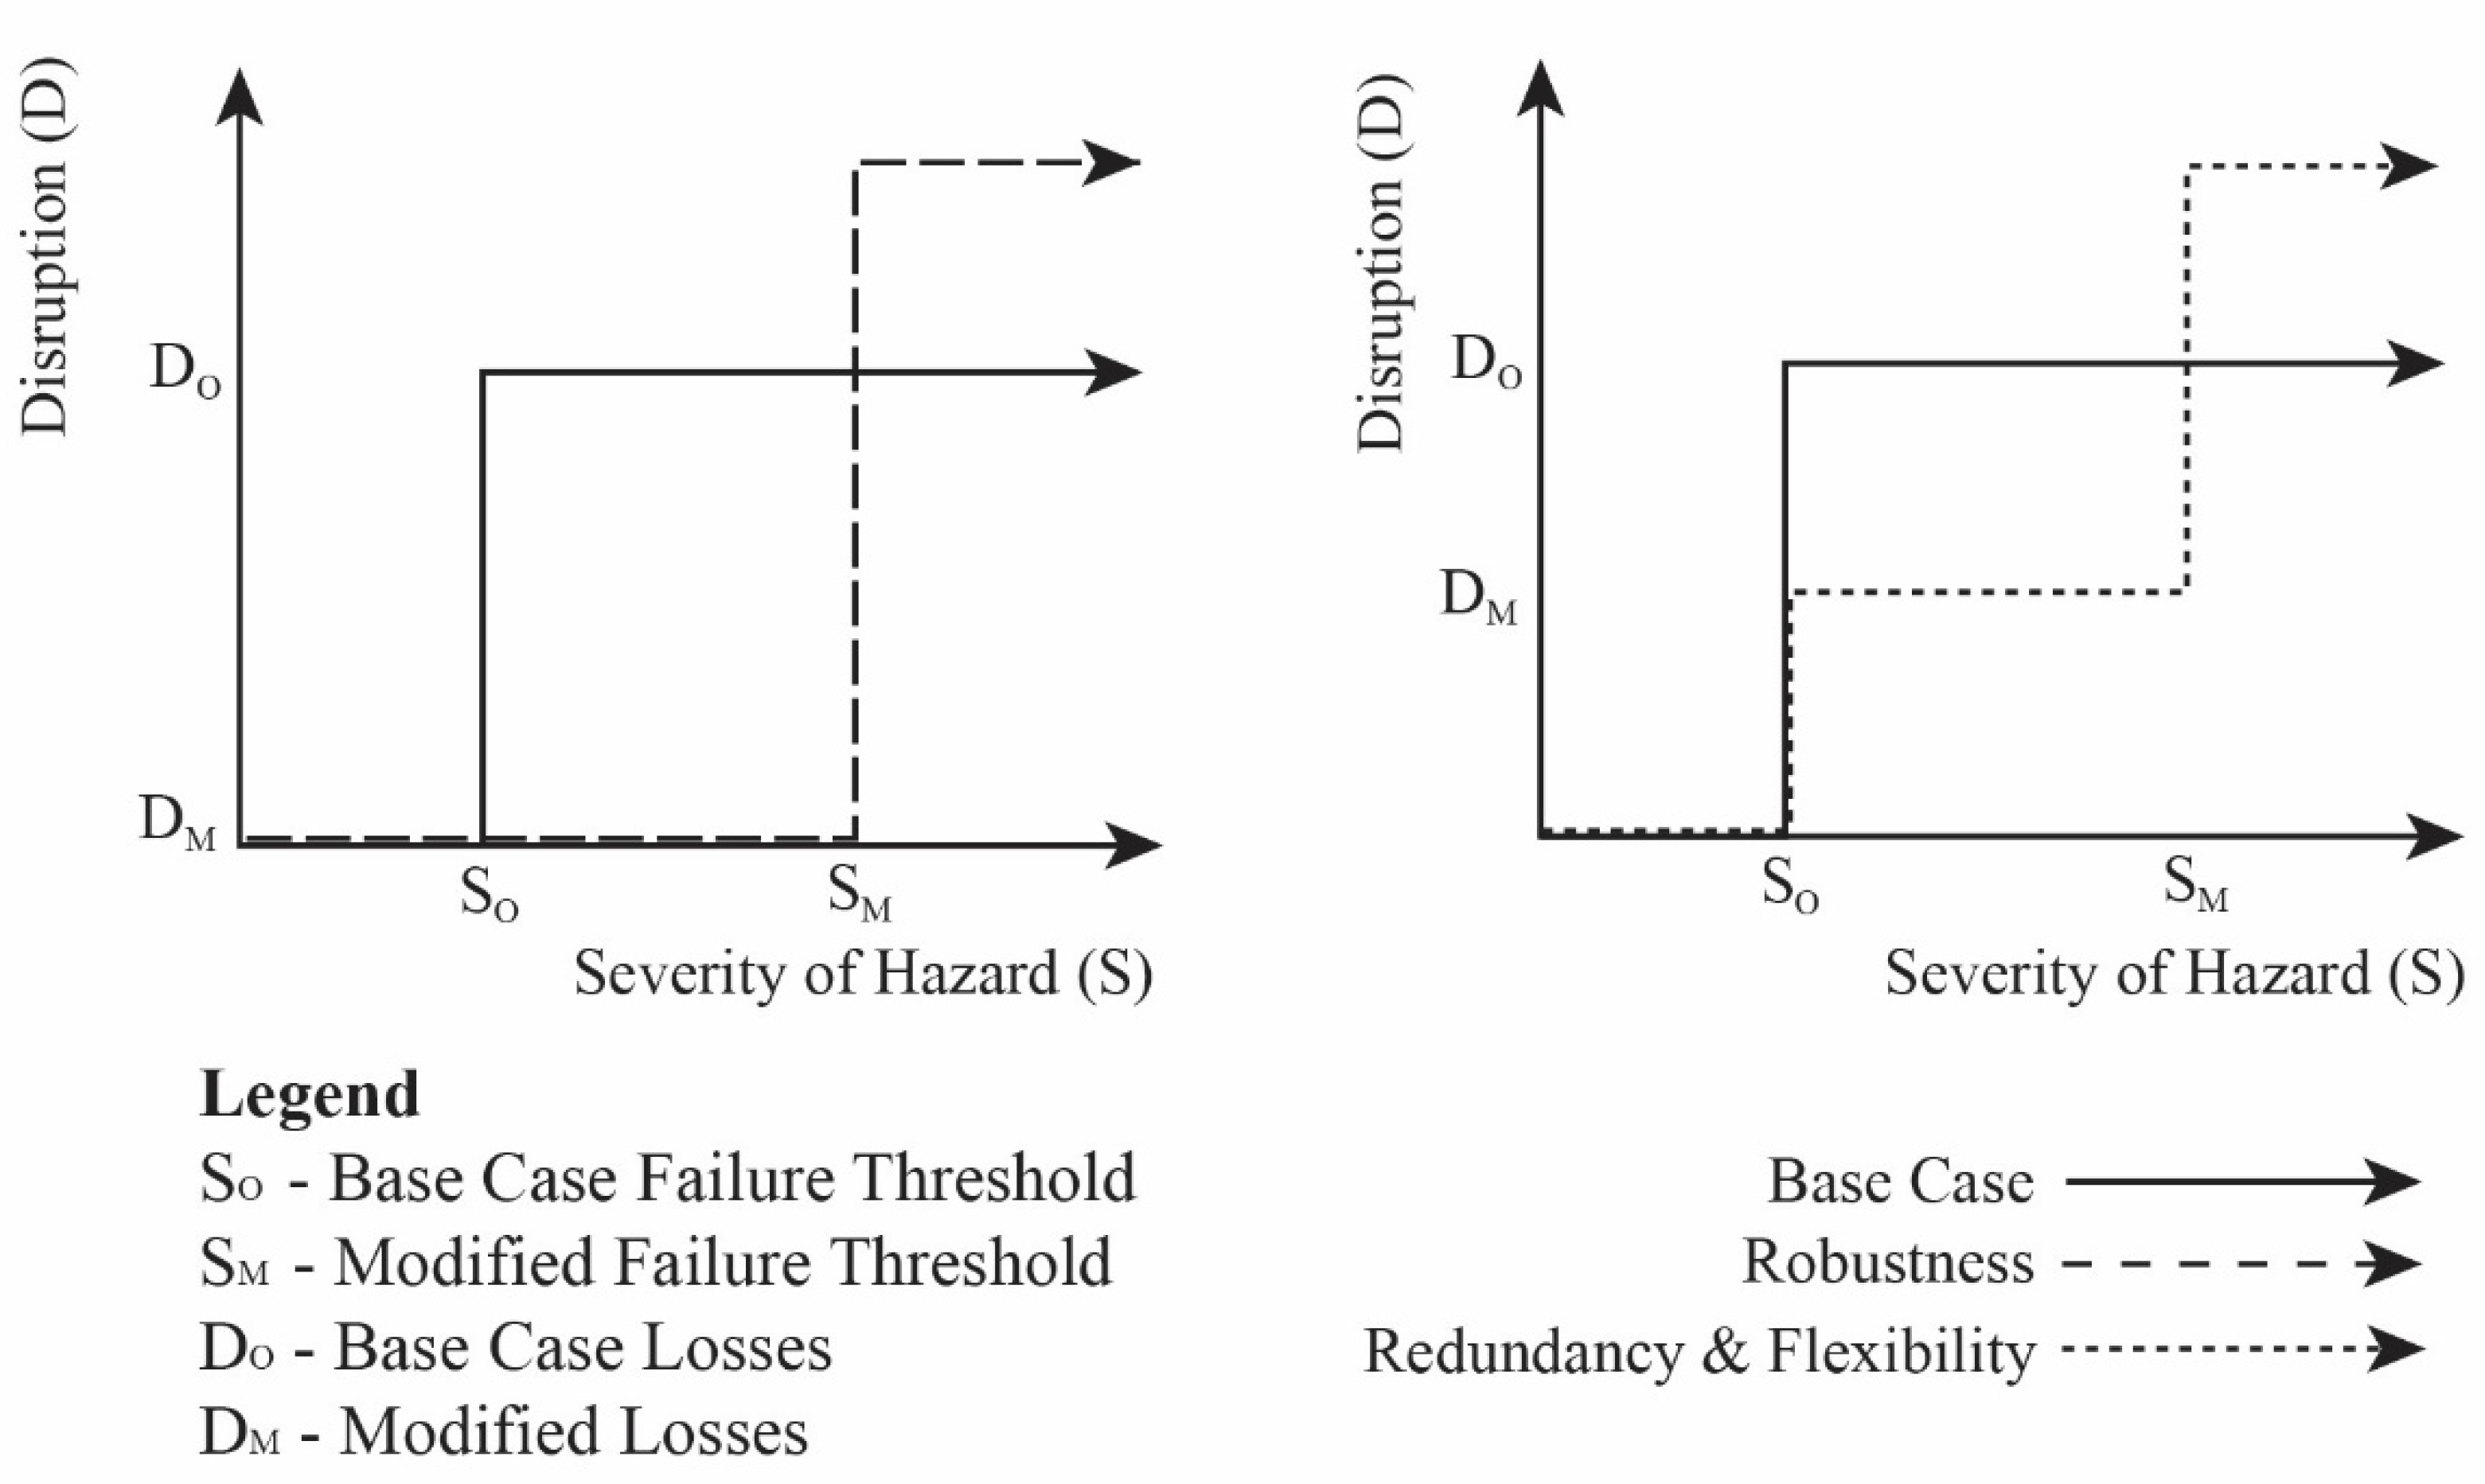
2.2. Resilience Concepts Applied in This Paper
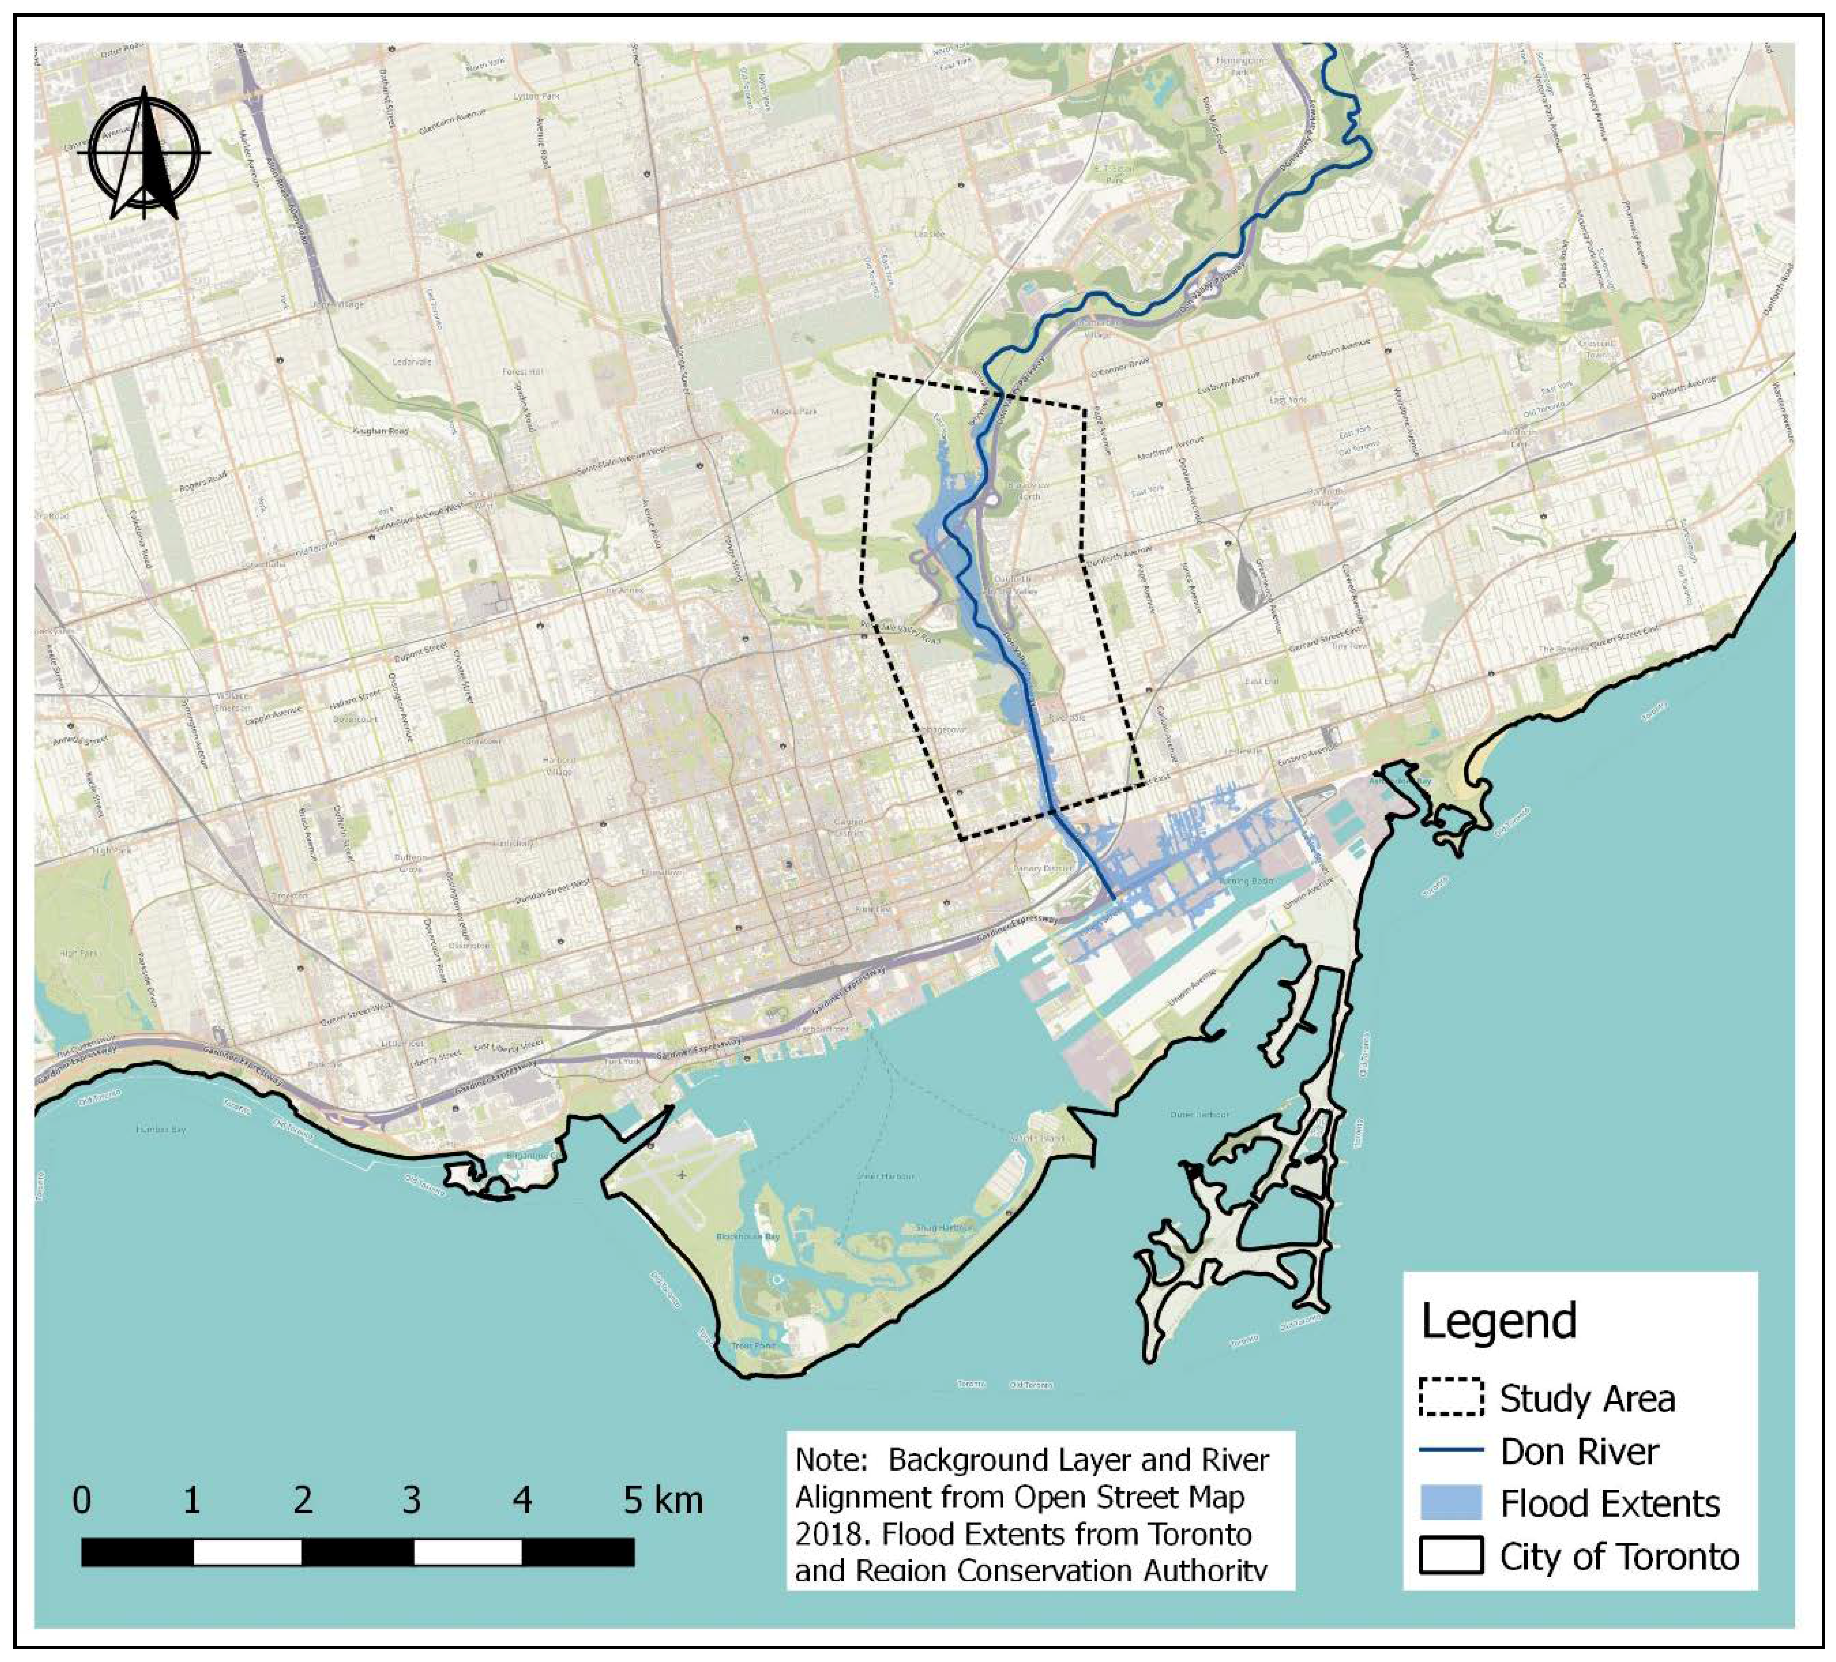
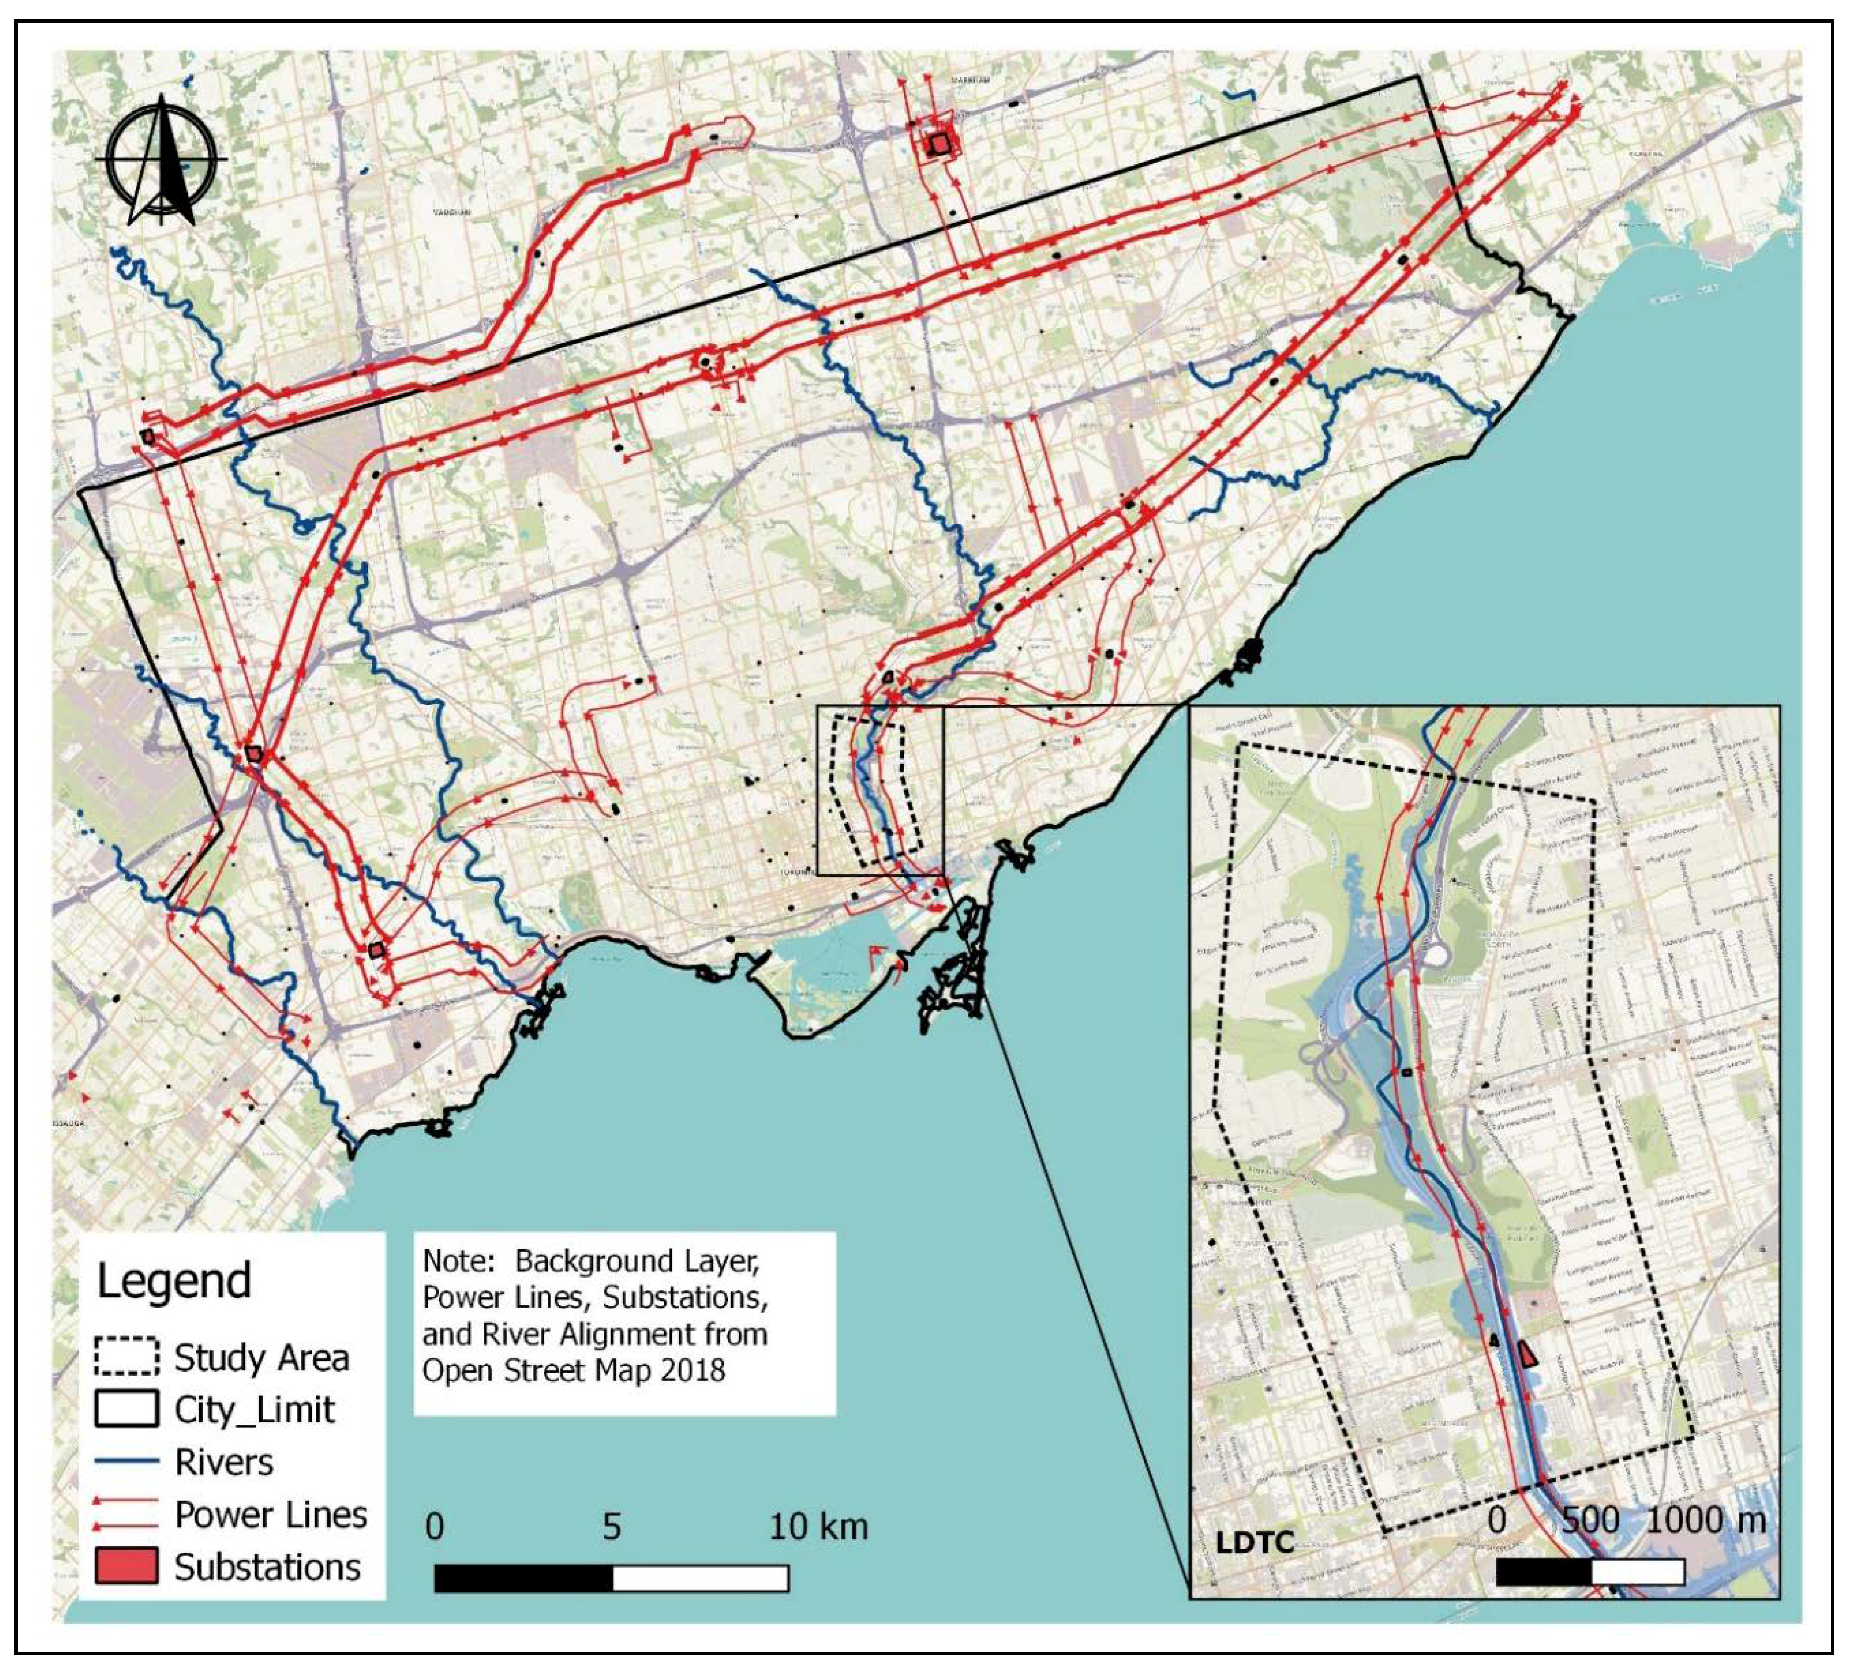
3. Case Study: Toronto, Canada
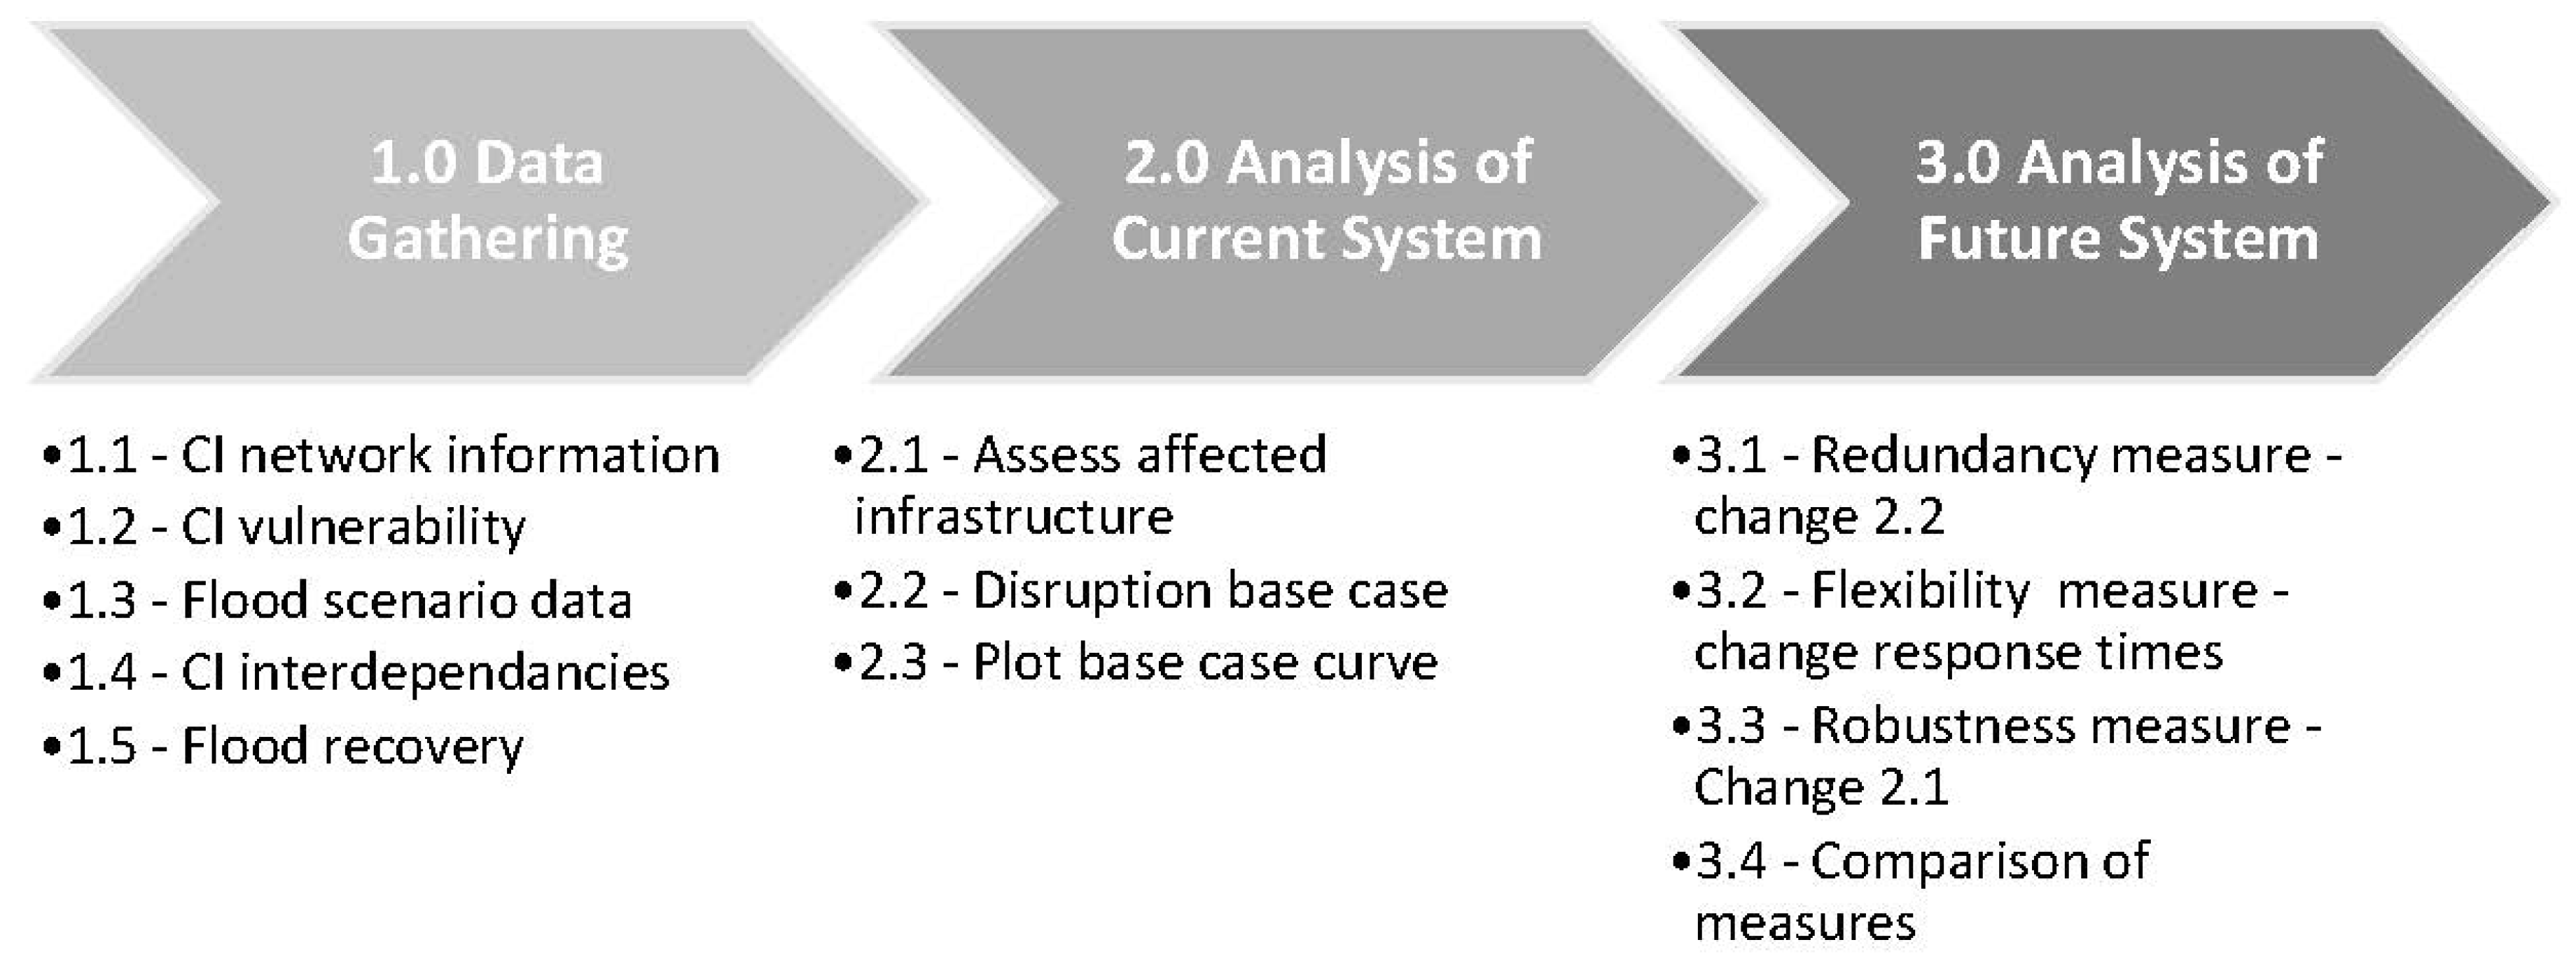
4. Method
4.1. Data Gathering
- Gather data gathering for CI networks (Step 1.1).
- Obtain flood hazard maps (Step 1.2).
- Combine the CI information and flood information to get insight into the exposure and vulnerability of CI to floods (Step 1.3).
- Analyze the cascading or indirect effect caused by disruptions of the flood exposed objects identified in Step 1.3 (Step 1.4).
- Assess recovery time and capacities of the flood-prone CI elements (Step 1.5).
4.2. Analysis of Current System
4.3. Definition of Measures and Analysis of the Future System
5. Results
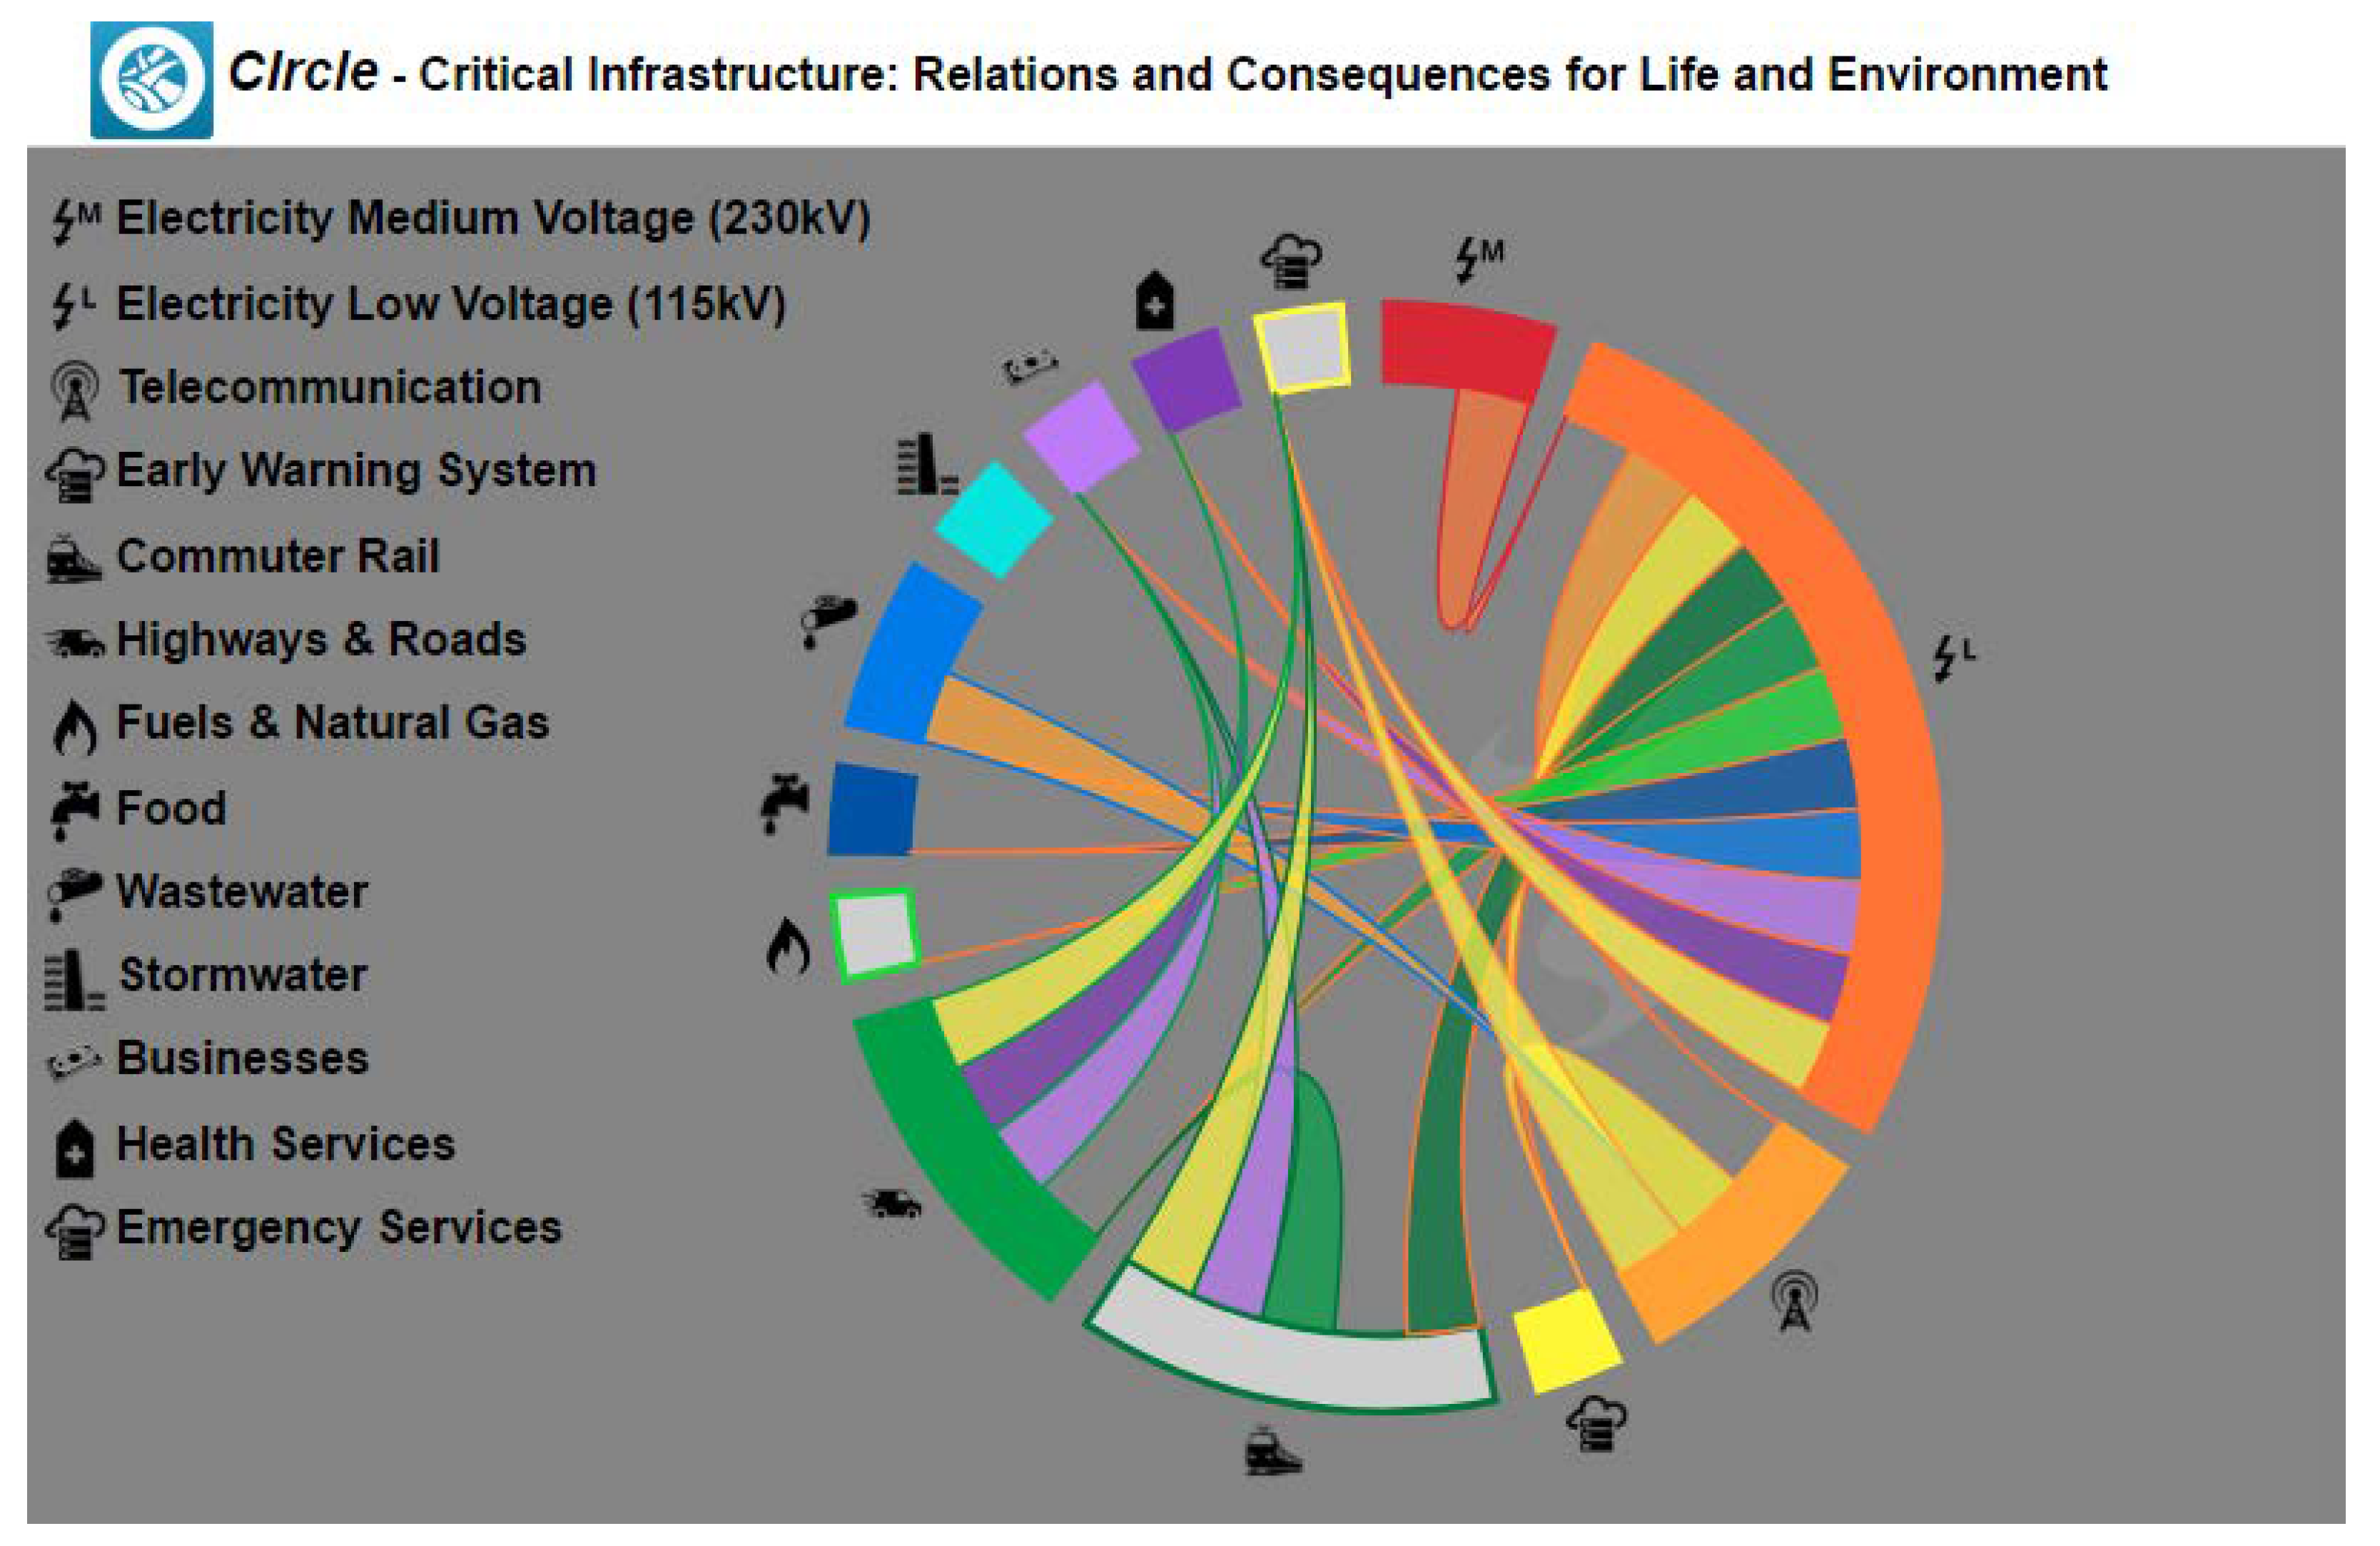
5.1. Data Gathering Results
5.2. Analysis of Current System Results
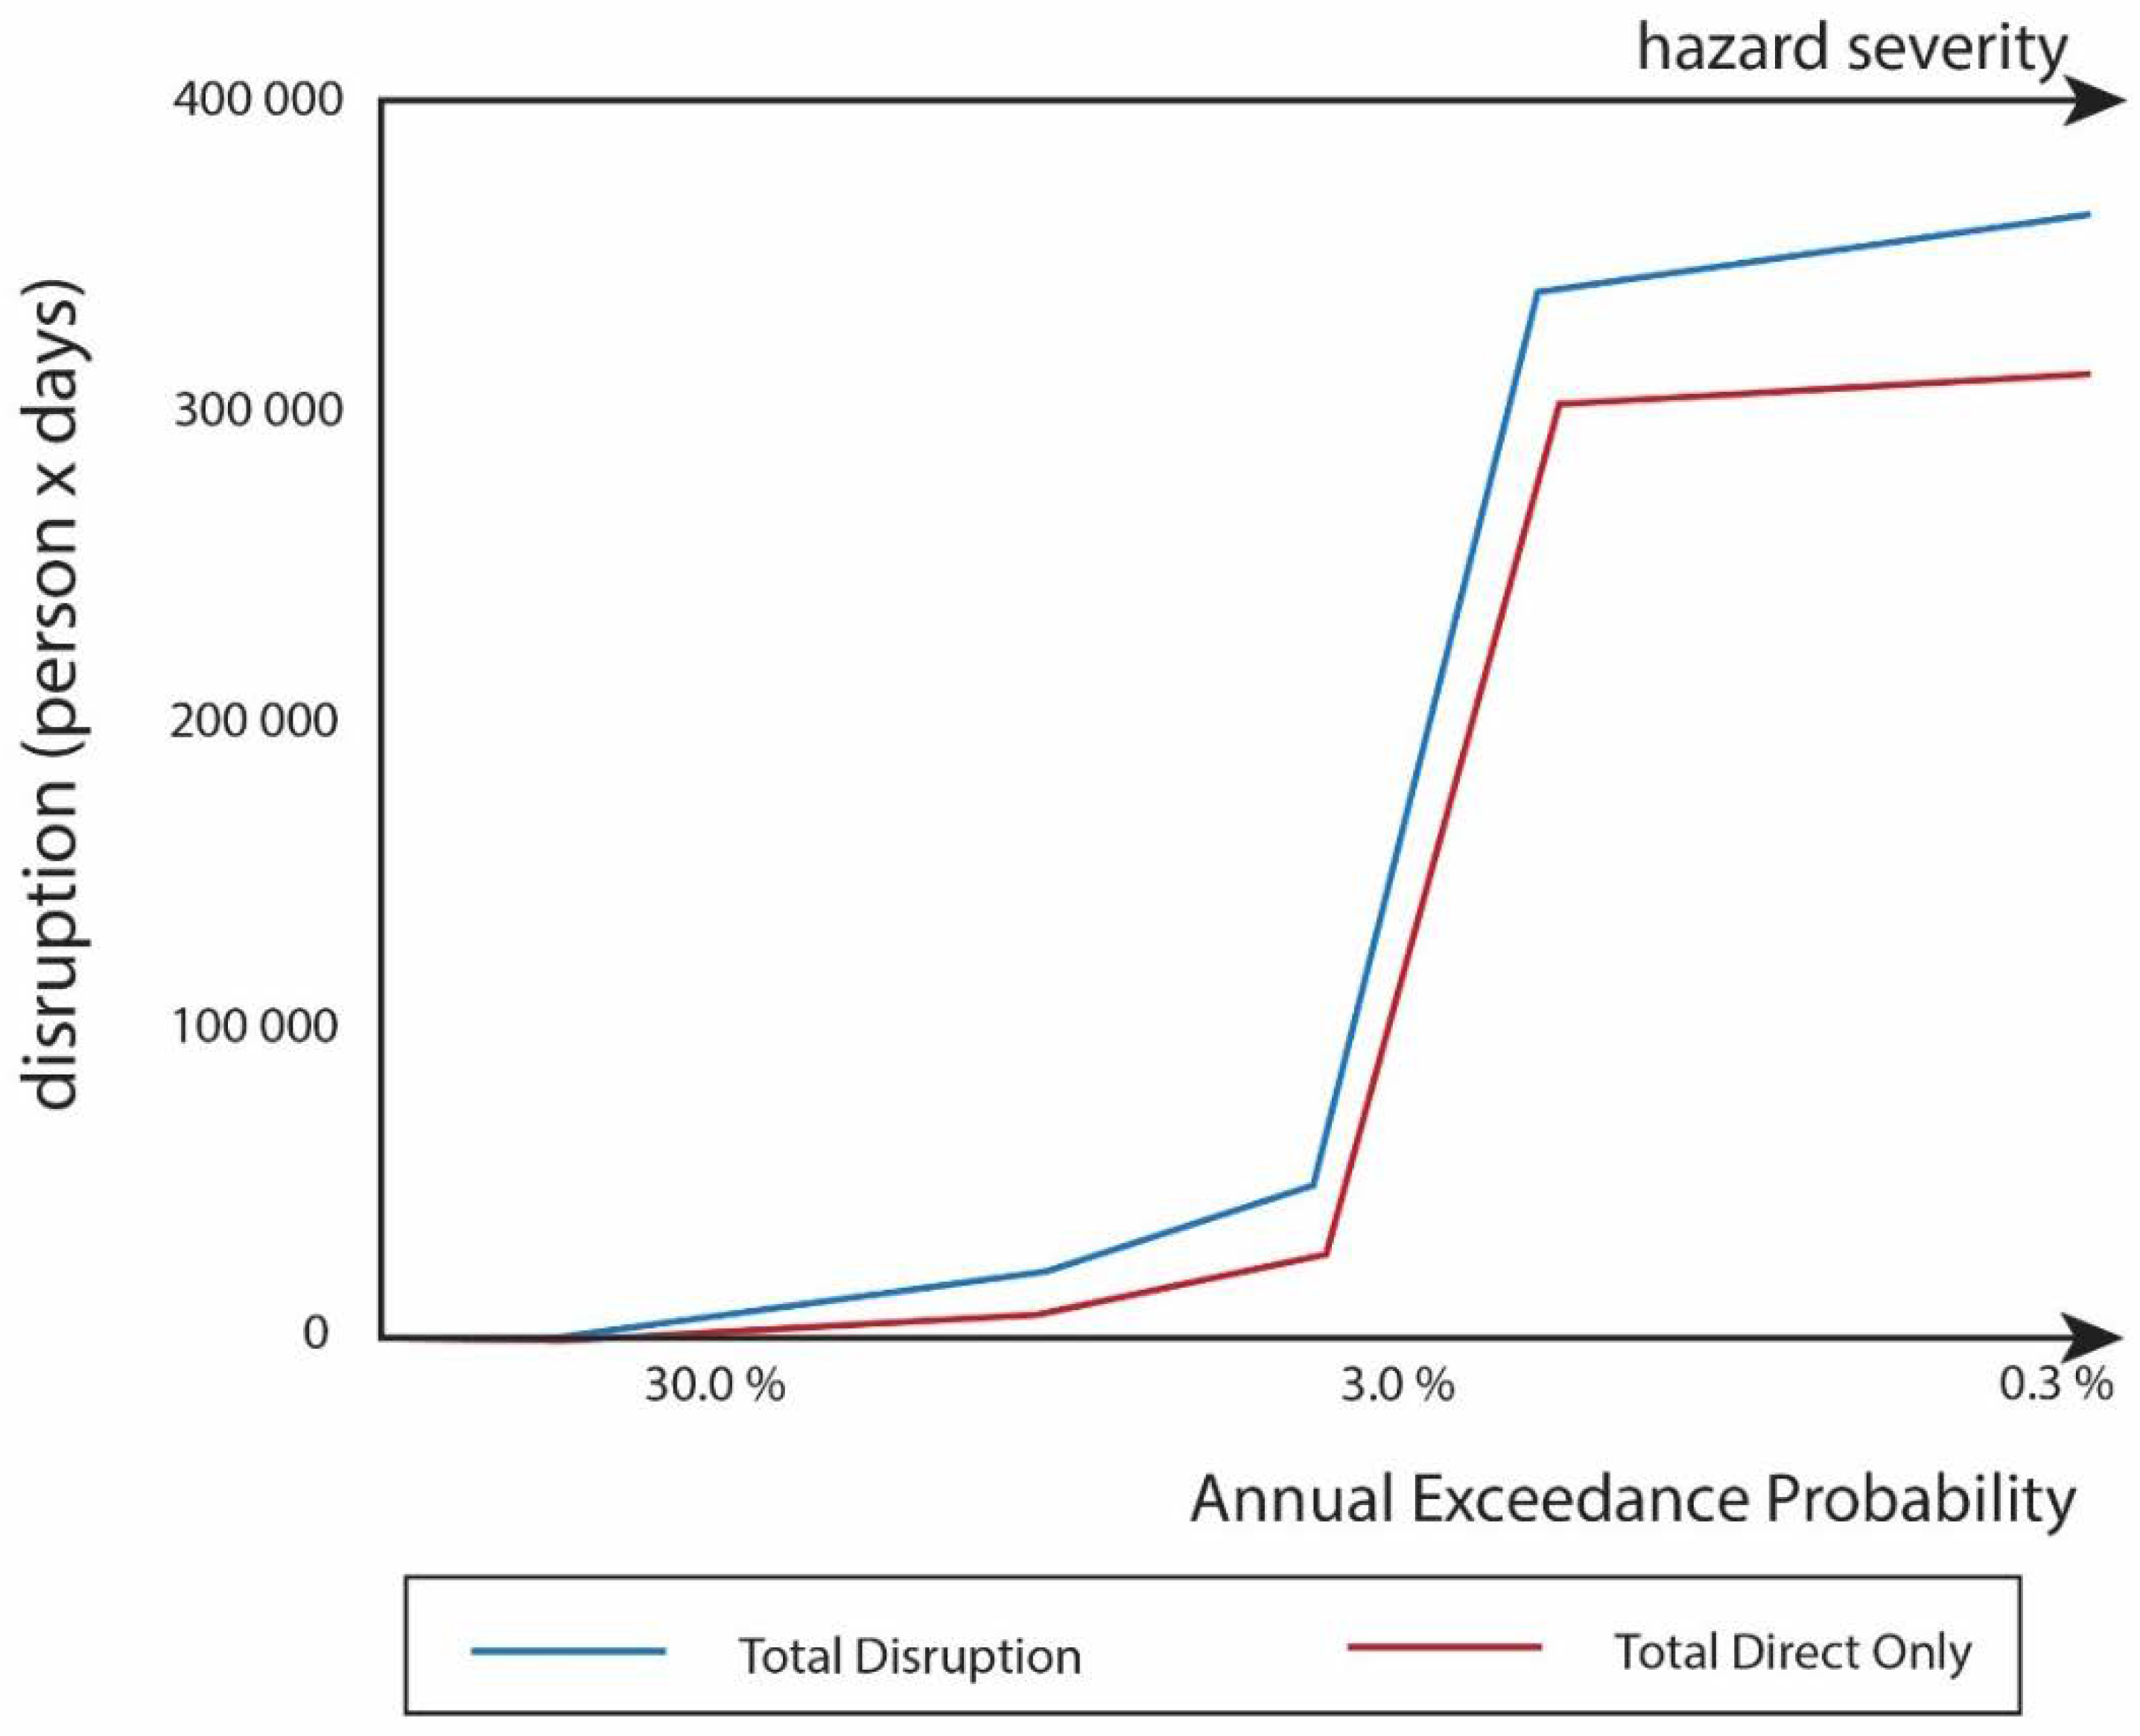
5.3. Analysis of Future System Results
6. Discussion
6.1. Reflection on Innovation, Method, and Applications
6.2. Reflection on Practical Relevance and Limitations
7. Conclusions
Author Contributions
Funding
Acknowledgments
Conflicts of Interest
References
- Guha-Sapir, D.; Vos, F.; Below, R. EM-DAT: International Disaster Database. … Disasters 2014, 52. [Google Scholar]
- Hallegatte, S.; Green, C.; Nicholls, R.J.; Corfee-Morlot, J. Future flood losses in major coastal cities. Nat. Clim. Chang. 2013, 3, 802–806. [Google Scholar] [CrossRef]
- ARUP. City Resilience Framework; ARUP: London, UK, 2015. [Google Scholar]
- Ouyang, M.; Dueñas-Osorio, L.; Min, X. A three-stage resilience analysis framework for urban infrastructure systems. Struct. Saf. 2012, 36, 23–31. [Google Scholar] [CrossRef]
- Pant, R.; Thacker, S.; Hall, J.W.; Alderson, D.; Barr, S. Critical infrastructure impact assessment due to flood exposure. J. Flood Risk Manag. 2018, 11, 22–33. [Google Scholar] [CrossRef]
- De Bruijn, K.; Buurman, J.; Mens, M.; Dahm, R.; Klijn, F. Resilience in practice: Five principles to enable societies to cope with extreme weather events. Environ. Sci. Policy 2017, 70, 21–30. [Google Scholar] [CrossRef]
- Holling, C.S. Resilience and stability of ecological systems. Annu. Rev. Ecol. Syst. 1973, 4, 1–23. [Google Scholar] [CrossRef]
- Holling, C.S. Engineering resilience versus ecological resilience. Eng. Ecol. Constraints 1996, 31, 32. [Google Scholar]
- National Research Council. Disaster Resilience: A National Imperative; The National Academies Press: Washington, DC, USA, 2012. [Google Scholar]
- United Nations General Assembly. Report of the Open-Ended Intergovernmental Expert Working Group on Indicators and Terminology Relating to Disaster Risk Reduction; United Nations General Assembly: New York, NY, USA, 2016; Volume 21184, pp. 1–41. [Google Scholar]
- Bristow, D.N.; Hay, A.H. Graph model for probabilistic resilience and recovery planning of multi-infrastructure systems. J. Infrastruct. Syst. 2016, 23, 04016039. [Google Scholar] [CrossRef]
- Cutter, S.L.; Ash, K.D.; Emrich, C.T. The geographies of community disaster resilience. Glob. Environ. Chang. 2014, 29, 65–77. [Google Scholar] [CrossRef]
- Fekete, A. Common criteria for the assessment of critical infrastructures. Int. J. Disaster Risk Sci. 2011, 2, 15–24. [Google Scholar] [CrossRef]
- Räikkönen, M.; Mäki, K.; Murtonen, M.; Forssén, K.; Tagg, A.; Petiet, P.J.; Nieuwenhuijs, A.H.; McCord, M. A holistic approach for assessing impact of extreme weather on critical infrastructure. Int. J. Saf. Secur. Eng. 2016, 6, 171–180. [Google Scholar] [CrossRef]
- Serre, D. DS3 Model Testing: Assessing Critical Infrastructure Network Flood Resilience at the Neighbourhood Scale. In Urban Disaster Resilience and Security; Springer: Berlin, Germany, 2018; pp. 207–220. [Google Scholar]
- Cutter, S.L.; Barnes, L.; Berry, M.; Burton, C.; Evans, E.; Tate, E.; Webb, J. A place-based model for understanding community resilience to natural disasters. Glob. Environ. Chang. 2008, 18, 598–606. [Google Scholar] [CrossRef]
- Ouyang, M. Review on modeling and simulation of interdependent critical infrastructure systems. Reliab. Eng. Syst. Saf. 2014, 121, 43–60. [Google Scholar] [CrossRef]
- De Bruijn, K.M. Resilience indicators for flood risk management systems of lowland rivers. Int. J. River Basin Manag. 2004, 2, 199–210. [Google Scholar] [CrossRef]
- Mens, M.J.P.; Klijn, F.; de Bruijn, K.M.; van Beek, E. The meaning of system robustness for flood risk management. Environ. Sci. Policy 2011, 14, 1121–1131. [Google Scholar] [CrossRef]
- Hall, J.W.; Dawson, R.J.; Sayers, P.B.; Rosu, C.; Chatterton, J.B.; Deakin, R. A methodology for national-scale flood risk assessment. In Proceedings of the Institution of Civil Engineers-Water Maritime and Engineering; Published for the Institution of Civil Engineers by Thomas Telford Ltd.: London, UK, 2003; Volume 156, pp. 235–248. [Google Scholar]
- United States Army Corps of Engineers (USACE). Expected Annual Flood Damage Computation; USACE: Washington, DC, USA, 1989. [Google Scholar]
- Chang, S.E.; McDaniels, T.; Fox, J.; Dhariwal, R.; Longstaff, H. Toward disaster-resilient cities: Characterizing resilience of infrastructure systems with expert judgments. Risk Anal. 2014, 34, 416–434. [Google Scholar] [CrossRef] [PubMed]
- de Bruijn, K.M.; van der Most, H.; Cumiskey, L.; Hounjet, M.; Mens, M. Methods and Tools Supporting Urban Resilience Planning: Experiences from Cork, Ireland. J. Geosci. Environ. Prot. 2018, 6, 290–309. [Google Scholar] [CrossRef]
- De Bruijn, K.M.; Cumiskey, L.; Dhubhda, R.N.; Hounjet, M.; Hynes, W. Flood vulnerability of critical infrastructure in Cork, Ireland. In E3S Web of Conferences; EDP Sciences: Les Ulis, France, 2016; Volume 7, p. 7005. [Google Scholar]
- Toronto and Region Conservation Authority Watershed Management. Available online: https://trca.ca/conservation/watershed-management/ (accessed on 3 April 2017).
- Klijn, F.; De Bruijn, K.M.; Knoop, J.; Kwadijk, J. Assessment of the Netherlands’ flood risk management policy under global change. Ambio 2012. [Google Scholar] [CrossRef] [PubMed]
- Wagenaar, D.J.; de Bruijn, K.M.; Bouwer, L.M.; De Moel, H. Uncertainty in flood damage estimates and its potential effect on investment decisions. Nat. Hazards Earth Syst. Sci. Discuss. 2015, 3, 607–640. [Google Scholar] [CrossRef]
- De Bruijn, K.M.; Lips, N.; Gersonius, B.; Middelkoop, H. The storyline approach: A new way to analyse and improve flood event management. Nat. Hazards 2016, 81, 99–121. [Google Scholar] [CrossRef]
- Toronto, C. of City of Toronto Open Data. Available online: https://www.toronto.ca/city-government/data-research-maps/open-data/ (accessed on 3 April 2017).
- Lhomme, S.; Serre, D.; Diab, Y.; Laganier, R. A methodology to produce interdependent networks disturbance scenarios. In Vulnerability, Uncertainty, and Risk: Analysis, Modeling, and Management; American Society of Civil Engineers (ASCE): Reston, VA, USA, 2011; pp. 724–731. [Google Scholar]
- AECOM. Toronto Hydro-Electric System Limited Climate Change Vulnerability Assessment; Public Infrastructure Engineering Vulnerability: Ottawa, ON, Canada, 2015. [Google Scholar]
- United Nations International Strategy for Disaster Reduction (UNISDR). Sendai Framework for Disaster Risk Reduction; UNISDR: Geneva, Switzerland, 2015; pp. 1–25. [Google Scholar]
- Nirupama, N.; Armenakis, C.; Montpetit, M. Is flooding in Toronto a concern? Nat. Hazards 2014, 72, 1259–1264. [Google Scholar] [CrossRef]


| Resilient Network Properties | Example | Examples for CI |
|---|---|---|
| Redundancy | Loop configuration Alternate routes | Loop in power system network Alternate equipment for telecom Alternate roads available Alternate rail tracks can be used Back up equipment available |
| Flexibility | Alternate modes Reconfiguration possible | Power load can be re-distributed Back-up equipment can be used/installed Vehicles can move to new route |
| Robustness | Critical components protected | Transmission equipment protected Vulnerable sections of road protected Vulnerable sections of rail protected |
| CI Element | Information Source | Water Depth Closure Threshold (m) | Cause of Closure/Failure |
|---|---|---|---|
| Highway | Historic events/local stakeholders | 0.15 | Cars cannot pass safely |
| Secondary Road | Historic events/local stakeholders | 0.15 | Cars cannot pass safely |
| Commuter Rail | Historic events/local stakeholders | 0.1 | Trains cannot pass safely |
| Power Transmission (1) (non-redundant) | Case studies/site observations | 0.5 | Water damage to equipment |
| Power Transmission (2) (redundant) | Case studies/site observations | 0.5 | Water damage to equipment |
| Power Transmission (3) (redundant) | Case studies/site observations | 3 | Water damage to equipment |
| Network | Configuration | Source of Information on People Disrupted | Source of Information on Disruption Duration |
|---|---|---|---|
| Power | Branch or loop? | Population data by city ward and power network map | Public incident reports and CIrcle workshop input |
| Telecommunications | Branch or loop? | Estimated from public reports | Public reports and workshop input |
| Rail | Alternate routes? Capacity alternate routes? | Weekday train capacity levels | Public reports and interview input |
| Roads | Alternative routes? Capacity alternate routes? | Traffic study reports | Public reports and CIrcle workshop input |
| AEP (1/Years) | CI Directly Affected | Additional CI Affected Due to Indirect Effects |
|---|---|---|
| 0.3% | Rail, secondary road, highway, two power sub-stations | Telecom, traffic signaling, emergency services |
| 1% | ||
| 2% | ||
| 4% | Rail, secondary road, highway | |
| 10% | ||
| 20% | ||
| 50% | Rail, secondary road | None |
| AEP (1/Years) | Total Direct Impacts Only | Total Disruption w/Indirect Impacts | Annual Disruption |
|---|---|---|---|
| Impact (Person × Days) | Impact (Person × Days) | Impact (Person × Days/Year) | |
| 0.3% | 307,409 | 350,874 | 1053 |
| 1% | 305,353 | 341,741 | 2424 |
| 2% | 303,298 | 332,628 | 3372 |
| 4% | 34,792 | 57,081 | 3897 |
| 10% | 4992 | 20,255 | 2320 |
| 20% | 2937 | 11,187 | 1572 |
| 50% | 480 | 480 | 1750 |
| EADIS | 16,388 | ||
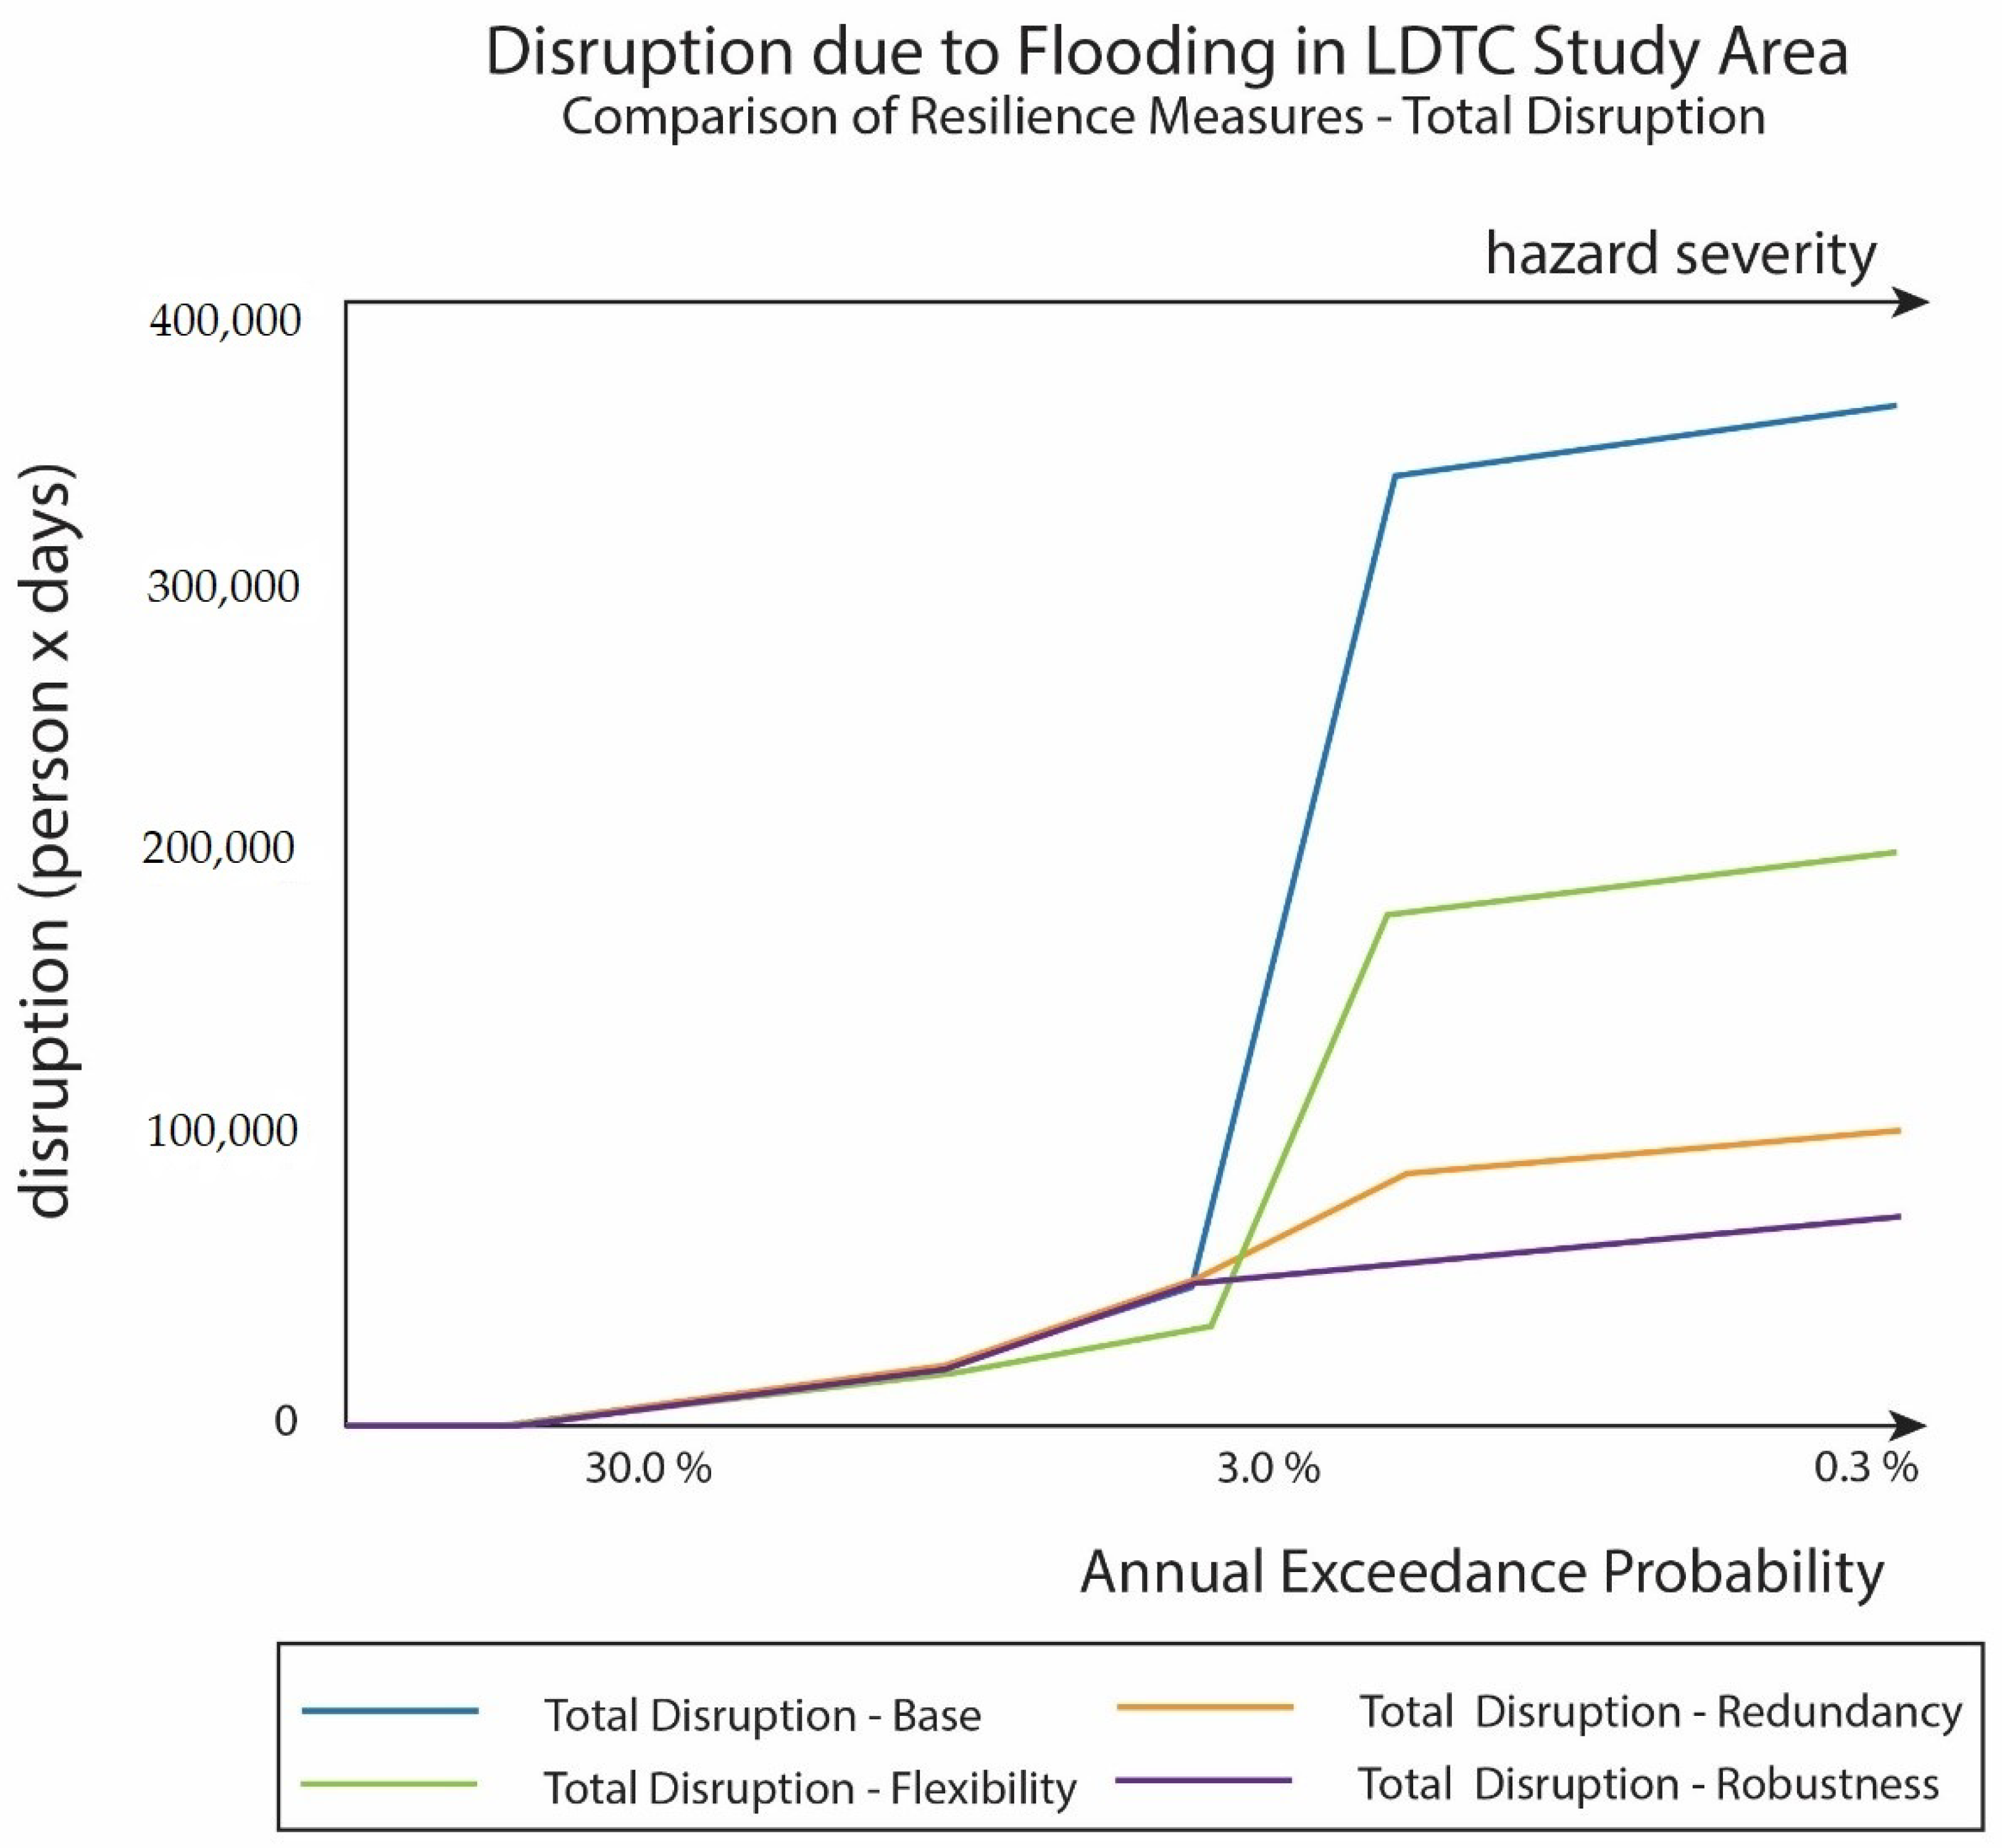
| AEP (1/Years) | Disruption Base Case (Person × Days) | Disruption w/Added Redundancy (Person × Days) | Disruption w/Added Flexibility (Person × Days) | Disruption w/Added Robustness (Person × Days) |
|---|---|---|---|---|
| 0.3% | 350,874 | 106,628 | 203,777 | 84,424 |
| 1.0% | 341,741 | 97,496 | 194,645 | 75,291 |
| 2.0% | 332,628 | 88,382 | 185,531 | 66,178 |
| 4.0% | 57,081 | 57,081 | 43,209 | 57,081 |
| 10.0% | 20,255 | 20,255 | 20,255 | 20,255 |
| 20.0% | 11,187 | 11,187 | 11,187 | 11,187 |
| 50.0% | 480 | 480 | 480 | 480 |
| EADIS | 16,037 | 8953 | 11,216 | 8309 |
| Improvement | 44% | 30% | 48% | |
| AEP (1/Years) | Non-Functioning CI Base Case | Non-Functioning CI Redundancy | Non-Functioning CI Flexibility | Non-Functioning CI Robustness |
|---|---|---|---|---|
| 0.3% | Rail, secondary road, highway, telecom, traffic signaling, emergency services, two power sub stations | Rail, secondary road, highway, telecom, traffic signaling, emergency services, one power sub station | ||
| 1.0% | ||||
| 2.0% | ||||
| 4.0% | Rail, secondary road, highway, telecom, traffic signaling, emergency services, one power sub station | |||
| 10.0% | Rail, secondary road, highway, telecom, traffic signaling, emergency services | |||
| 20.0% | ||||
| 50.0% | Rail, secondary road | |||
© 2018 by the authors. Licensee MDPI, Basel, Switzerland. This article is an open access article distributed under the terms and conditions of the Creative Commons Attribution (CC BY) license (http://creativecommons.org/licenses/by/4.0/).
Share and Cite
Murdock, H.J.; De Bruijn, K.M.; Gersonius, B. Assessment of Critical Infrastructure Resilience to Flooding Using a Response Curve Approach. Sustainability 2018, 10, 3470. https://doi.org/10.3390/su10103470
Murdock HJ, De Bruijn KM, Gersonius B. Assessment of Critical Infrastructure Resilience to Flooding Using a Response Curve Approach. Sustainability. 2018; 10(10):3470. https://doi.org/10.3390/su10103470
Chicago/Turabian StyleMurdock, Heather J., Karin M. De Bruijn, and Berry Gersonius. 2018. "Assessment of Critical Infrastructure Resilience to Flooding Using a Response Curve Approach" Sustainability 10, no. 10: 3470. https://doi.org/10.3390/su10103470
APA StyleMurdock, H. J., De Bruijn, K. M., & Gersonius, B. (2018). Assessment of Critical Infrastructure Resilience to Flooding Using a Response Curve Approach. Sustainability, 10(10), 3470. https://doi.org/10.3390/su10103470