A Conflict Identification Method of Urban, Agricultural and Ecological Spaces Based on the Space Conversion Matrix

School of Engineering Management and Real Estate, Henan University of Economics and Law, Zhengzhou 450046, China
*
Author to whom correspondence should be addressed.
Sustainability 2018, 10(10), 3502; https://doi.org/10.3390/su10103502
Submission received: 25 August 2018
/
Revised: 19 September 2018
/
Accepted: 27 September 2018
/
Published: 29 September 2018
(This article belongs to the Section Sustainable Urban and Rural Development)
Abstract
:In China, disordered development and utilization of land space usually lead to serious conflicts between urban, agricultural, and ecological spaces. The identification of these conflicts is an important basis for scientific zoning of the three types of spaces and has important theoretical and practical significance for the sustainable use of land space. In this study, a conflict identification method based on the space conversion matrix is proposed to provide a reference for scientific zoning of urban, agricultural, and ecological spaces. The method constructs several land space change indices, including overall conflict degree, type stability degree, and type conflict degree, to evaluate and identify the overall conflict degree, main functions, and main conflict types of evaluation units, respectively. This study used Hubei Province in China as an example to verify the method. Results showed that the main types of land space conflicts in Hubei Province in 2010–2016 were the occupations of agricultural space by urban space and ecological space by agricultural space. Moreover, high conflict areas were mainly concentrated in the central and eastern plains, especially the urban areas of prefectural-level cities. By comparing data between 2010–2013 and 2013–2016, the two major conflict types showed weakening and fragmenting trends. The land space conflict identification method proposed in this study demonstrates several advantages over previous methods. These advantages include the ability to evaluate conflict degree and identify conflict types simultaneously, the low requirement of data condition, and simple and intuitive representation of identification results.
1. Introduction
Industrialization and urbanization have brought about remarkable achievements of socio-economic development in China since the economic reform and implementation of the Opening Door Policy [1,2]. However, this process has also induced certain sustainable development issues [3,4], especially serious land space conflicts caused by disordered development and misuse of land space [5,6,7]. Rapid urbanization leads to a continuous expansion of urban space at the expense of agricultural and ecological spaces [8,9,10,11,12,13]. The increasing population and their growing food demands lead to the occupation of ecological space by agricultural space [6]. In addition, the unsound institutions and systems for land space management are important reasons for this phenomenon [5]. According to the national land survey data from 2010 to 2015, construction land in China has increased by 24,600 km2. This expansion is at the expense of cultivated land, woodland, and grassland; these land use types account for 67.5%, 14.0%, and 15.6% of new construction land, correspondingly. Moreover, the increase in cultivated land is mainly due to the occupation by grassland and unused land, with 64.0% and 21.9% of the newly-cultivated area coming from grassland and unused land, respectively [14]. In this context, the Chinese government established the Ministry of Natural Resources in March 2018 and placed the unified management of land space as one of the priorities. One of the ministry’s main functions is to conduct the land space planning of the entire region under the principle of reasonable arrangement of urban, agricultural, and ecological spaces. Accordingly, scientific zoning of urban, agricultural, and ecological spaces is an important means of land space management and planning. Moreover, the conflict identification of urban, agricultural, and ecological spaces is an important basis for scientific zoning of the three types of spaces; this process has important theoretical and practical significance for compiling and implementing land space planning and sustainable use of land space.
The most direct presentation of land space conflict is land use conflict, which is also the most concentrated area of land space conflict research. At present, research on land use conflict involves two aspects. On the one hand, some studies involve social, economic, organizational, and interest conflicts of land use from the perspective of sociology, economics, and management [15,16,17,18,19]. On the other hand, some studies focus on land use cover or land use space conflict from the geographical perspective [20,21,22]. This study mainly involves the latter and focuses on conflicts between the three types of spaces, namely, urban, agricultural, and ecological spaces. For land use space conflict, the conflict identification methods used in previous studies include the pressure–state–response (PSR) model [23], landscape index [24], participatory survey [25], multi-criteria evaluation [26,27,28], suitability evaluation [29,30,31], and comparative analysis between land capacity and actual utilization [32,33,34]. However, these methods have their own focus and cannot fully solve the problem of space conflict identification. Specifically, the PSR model and landscape index methods focus on evaluating conflict degree and cannot identify conflict types. The participatory survey method focuses on conflict type identification and cannot effectively evaluate conflict degree. The multi-criteria evaluation method, suitability evaluation method and the comparative analysis method of land capacity and actual utilization can simultaneously evaluate the conflict degree and identify conflict types, but these methods involve various suitability or land capacity indicators and require high data conditions.
Based on the insufficiencies of previous research, this study aims to propose a method for comprehensively, simply, and intuitively identifying land space conflict at the meso- and macro-scales. Land use change is the most intuitive presentation of land space conflict, and the land use conversion matrix is the most intuitive method for reflecting regional land use change. Therefore, in reference to the land use conversion matrix, this study proposes the land space conversion matrix and constructs several land space change indices, including overall conflict degree, type stability degree and type conflict degree derived from the matrix. Then, these indices can be used to evaluate the land space conflict degree and identify land space conflict types simply and intuitively to compensate for the insufficiencies of previous methods.
The remainder of this paper is structured as follows. Section 2 introduces the proposed conflict identification method in detail, including the establishment of the space conversion matrix and the conflict identification of the three types of spaces. The former establishes the space conversion matrix on the basis of reclassifying the three types of spaces, whereas the latter constructs land space change indices to evaluate the overall conflict degree and identify the main functions and the conflict types of evaluation units. In addition, comprehensive conflict identification is introduced. Section 3 presents Hubei Province as an example to realize the proposed method and verify the scientificity and feasibility of the method. Section 4 discusses the construction of the type conflict degree index and the correlation between the land space change indices and natural, social, and economic factors. Section 5 provides the conclusions drawn from this study.
2. Materials and Methods
2.1. Method Framework
The framework of the proposed conflict identification method mainly consists of two parts, namely, establishing a space conversion matrix of urban, agricultural, and ecological spaces and identifying conflicts between the three types of spaces (Figure 1). In the first part, the space conversion matrix is established on the basis of reclassifying the three types of spaces. In the second part, multiple land space change indices are proposed for conflict degree evaluation, main function identification, and conflict type identification of the three types of spaces. Furthermore, a comprehensive conflict identification is introduced on the basis of the abovementioned analysis.
2.2. Establishing a Space Conversion Matrix of Urban, Agricultural, and Ecological Spaces
The establishment of a space conversion matrix of urban, agricultural, and ecological spaces is the basis for the conflict identification method in this study. This matrix reflects the conversion process of the three types of spaces in one specific period. From the matrix, a land space structure at the beginning and end of the period and a conversion direction of the three types of spaces can be derived [35,36].
The reclassification of urban, agricultural, and ecological spaces is a prerequisite for establishing the space conversion matrix. At present, the most relevant data related to land space in China is the land use status data, which is derived from the second national land survey and followed land use change surveys. This study uses these data due to its authority, consistency, accuracy, and reliability [37]. Moreover, the land use classification system used by the second national land survey is the Current Land Use Classification of China. The reclassification of urban, agricultural, and ecological spaces in this study is based on this classification system and the production, living, and ecological functions of land use types. Urban space refers to a geographical space where production and living of urban residents are the main functions, including urban land, mine land, traffic land, etc. Agricultural space is an area that mainly undertakes the functions of agricultural production and rural life, including cultivated land, orchard, rural settlement, land for agricultural facilities, etc. Ecological space refers to a geographical space that provides ecological services and ecosystem maintenance as its dominant functions, including woodland, grassland, waters area, unused land, etc.
To obtain the space conversion matrix, reclassified land space data of two stages are overlaid using the spatial overlay analysis function of GIS. Then, the pivot table analysis is adopted to obtain the space conversion matrix. The mathematical form is:
where n is the number of space types; i and j (i, j = 1, 2,…, n) are the space types at the beginning and end of a certain period, respectively; (i ≠ j) represents the area of space type i converted to space type j in the certain period; and (i = j) represents the area of space type i that is not converted in the certain period.
2.3. Identifying the Conflict between Urban, Agricultural, and Ecological Spaces
2.3.1. Conflict Degree Evaluation
Conflict degree evaluation is conducted to measure the overall conflict degree of the three types of spaces in an evaluation unit at a certain period and then to reflect the spatial differentiation of conflict degree intuitively. The overall conflict degree index is used in this study, that is, the ratio of the area of all types of converted spaces in a certain period to the total area of the evaluation unit. The mathematical form is:
where is the overall conflict degree of the three types of spaces in a certain period, is the area of all types of converted space in the certain period, and is the total area of the evaluation unit.
2.3.2. Main Function Identification
Main function identification is performed to measure the stability degree of the three types of spaces in an evaluation unit and identify the main function of the evaluation unit by comparing the stability degree with a given threshold value. In this study, the type stability degree index is used to measure the stability of the three types of spaces. The type stability degree of a certain space type is the ratio of the area of this space type that is unconverted to the total area of the three types of unconverted spaces in a certain period. The mathematical form is:
where is the type stability degree index of space type i in an evaluation unit, and is the total area of the three types of unconverted spaces in a certain period.
Considering that the three types of spaces refer to three functions, namely, urban, agricultural, and ecological, this study uses 0.33 as the threshold to identify the main functions of each evaluation unit. Therefore, an evaluation unit may have one or two main functions.
2.3.3. Conflict Type Identification
Conflict type identification is applied to identify the main conflict types in an evaluation unit by measuring the conflict degree of various possible conflict types in the evaluation unit and comparing with a given threshold value. In this study, the type conflict degree index is used. The type conflict degree of a certain conflict type is the ratio of the area of a certain space converted to another space in the evaluation unit to the total area of all types of converted spaces in a certain period. The mathematical form is:
where is the type conflict degree index of a conflict type, that is, the conversion from space type i to space type j, and is the total area of all types of converted spaces.
Six types of possible conflicts are available. The three frequent types are the occupations of agricultural space by urban space, ecological space by agricultural space, and ecological space by urban space; the three infrequent types are the conversions from agricultural space to ecological space, from urban space to agricultural space, and from urban space to ecological space. Therefore, 0.33 is adopted as the threshold of type conflict degree to identify the main conflict types of evaluation units in Hubei Province. Accordingly, one or two conflict types may occur in an evaluation unit.
2.3.4. Comprehensive Conflict Identification
The previous three parts evaluate and identify the overall conflict degree, main functions, and main conflict types of the three types of spaces. The combination of the three contents’ results for comprehensive conflict identification is necessary to obtain a general understanding of land space conflict identification. The comprehensive conflict identification consists of two steps. First, the evaluation units are divided into stable and conflict units by setting a threshold value of the overall conflict degree. The threshold is set in accordance with the frequency distribution of the overall conflict degree. Second, the main functions of stable units and the main conflict types of conflict units are identified in accordance with the results of the main function and conflict type identifications, respectively. To optimize the representation, this study only selects the function with the maximum type stability degree as the main function and the conflict type with the maximum type conflict degree as the main conflict type.
2.4. Study Area and Data Source
Hubei Province is located in Central China and has an area of approximately 185,900 km2 (Figure 2). This province has 12 prefectural-level cities, one autonomous prefecture, one forest zone and three administrative units under its jurisdiction. Hubei Province is rich in water resources and is known as the “thousand lakes province”. Moreover, Hubei is a forestry and a grain province. In recent years, the social and economic development of Hubei Province has progressed significantly. However, the progress also brings numerous problems, especially the disorderly expansion of urban land, which occupies a large amount of agricultural and ecological lands. The agricultural and ecological spaces are severely squeezed by urban space, thereby leading to a serious land space conflict. From 2010 to 2016, the newly-developed urban land in Hubei Province increased by 1054.17 km2, which was derived from the occupations of cultivated land, forest land and water area. These land use types accounted for 61.57%, 12.91%, and 12.23% of the newly-developed urban land, respectively. In addition, the area of newly-added cultivated land in Hubei Province was 601.10 km2, of which 49.20%, 16.85%, and 11.00% came from woodland, grassland, and water areas and unused land, respectively. Therefore, identifying the conflicts between urban, agricultural, and ecological spaces in Hubei Province has important practical significance. This is also the main reason for selecting Hubei Province as a research area in this study.
This study uses 103 county-level administrative regions under the jurisdiction of Hubei Province as evaluation units. Given that this study mainly analyzed the conflicts among the three types of spaces in 2010–2013 and 2013–2016, data from 2010, 2013, and 2016 are used. The data include land use, socioeconomic, and natural condition data. Land use data are obtained from the second national land survey and followed land use change surveys data. Socioeconomic data, such as population, urbanization rate, and the output value of non-agricultural industries, are mainly derived from the Statistic Yearbooks of Hubei Province, prefectural-level cities, and county-level regions. The natural condition data, including slope and elevation, are obtained from 30 m ASTER GDEM.
3. Results
3.1. General Land Space Conflict Analysis
From 2010 to 2016, the area of agricultural and ecological spaces in Hubei Province accounted for over 96% of its total area. However, urban space increased by 795.91 and 634.65 km2 in 2010–2013 (Table 1) and 2013–2016 (Table 2), respectively. Its type stability degree increased from 0.027 to 0.037 (Figure 3). The urban function of land space in Hubei Province was enhanced, while agricultural and ecological functions were relatively weakened. Furthermore, the occupations of agricultural space by urban space, ecological space by agricultural space, and ecological space by urban space were the main conflict types of land space in Hubei Province. The total area of the three conflict types accounted for more than 90% of the total conflict area. Among these conflict types, the occupation of agricultural space by urban space was the most prominent conflict type. Its type conflict degrees in 2010–2013 and 2013–2016 were 0.46 and 0.47, respectively. Accordingly, the type conflict degree of the two other main conflict types relatively declined to a certain extent. The space conflict degree in Hubei Province showed a weakening trend, with the overall conflict degree index that decreased from 0.0065 in 2010–2013 to 0.0051 in 2013–2016. In summary, the occupations of the main land space types, namely, agricultural, and ecological spaces, by urban space were the main conflict types. The other main conflict type was the occupation of ecological space by agricultural space. However, the space conflict degree has shown a generally favorable gradually decreasing trend in recent years.
3.2. Conflict Degree Evaluation
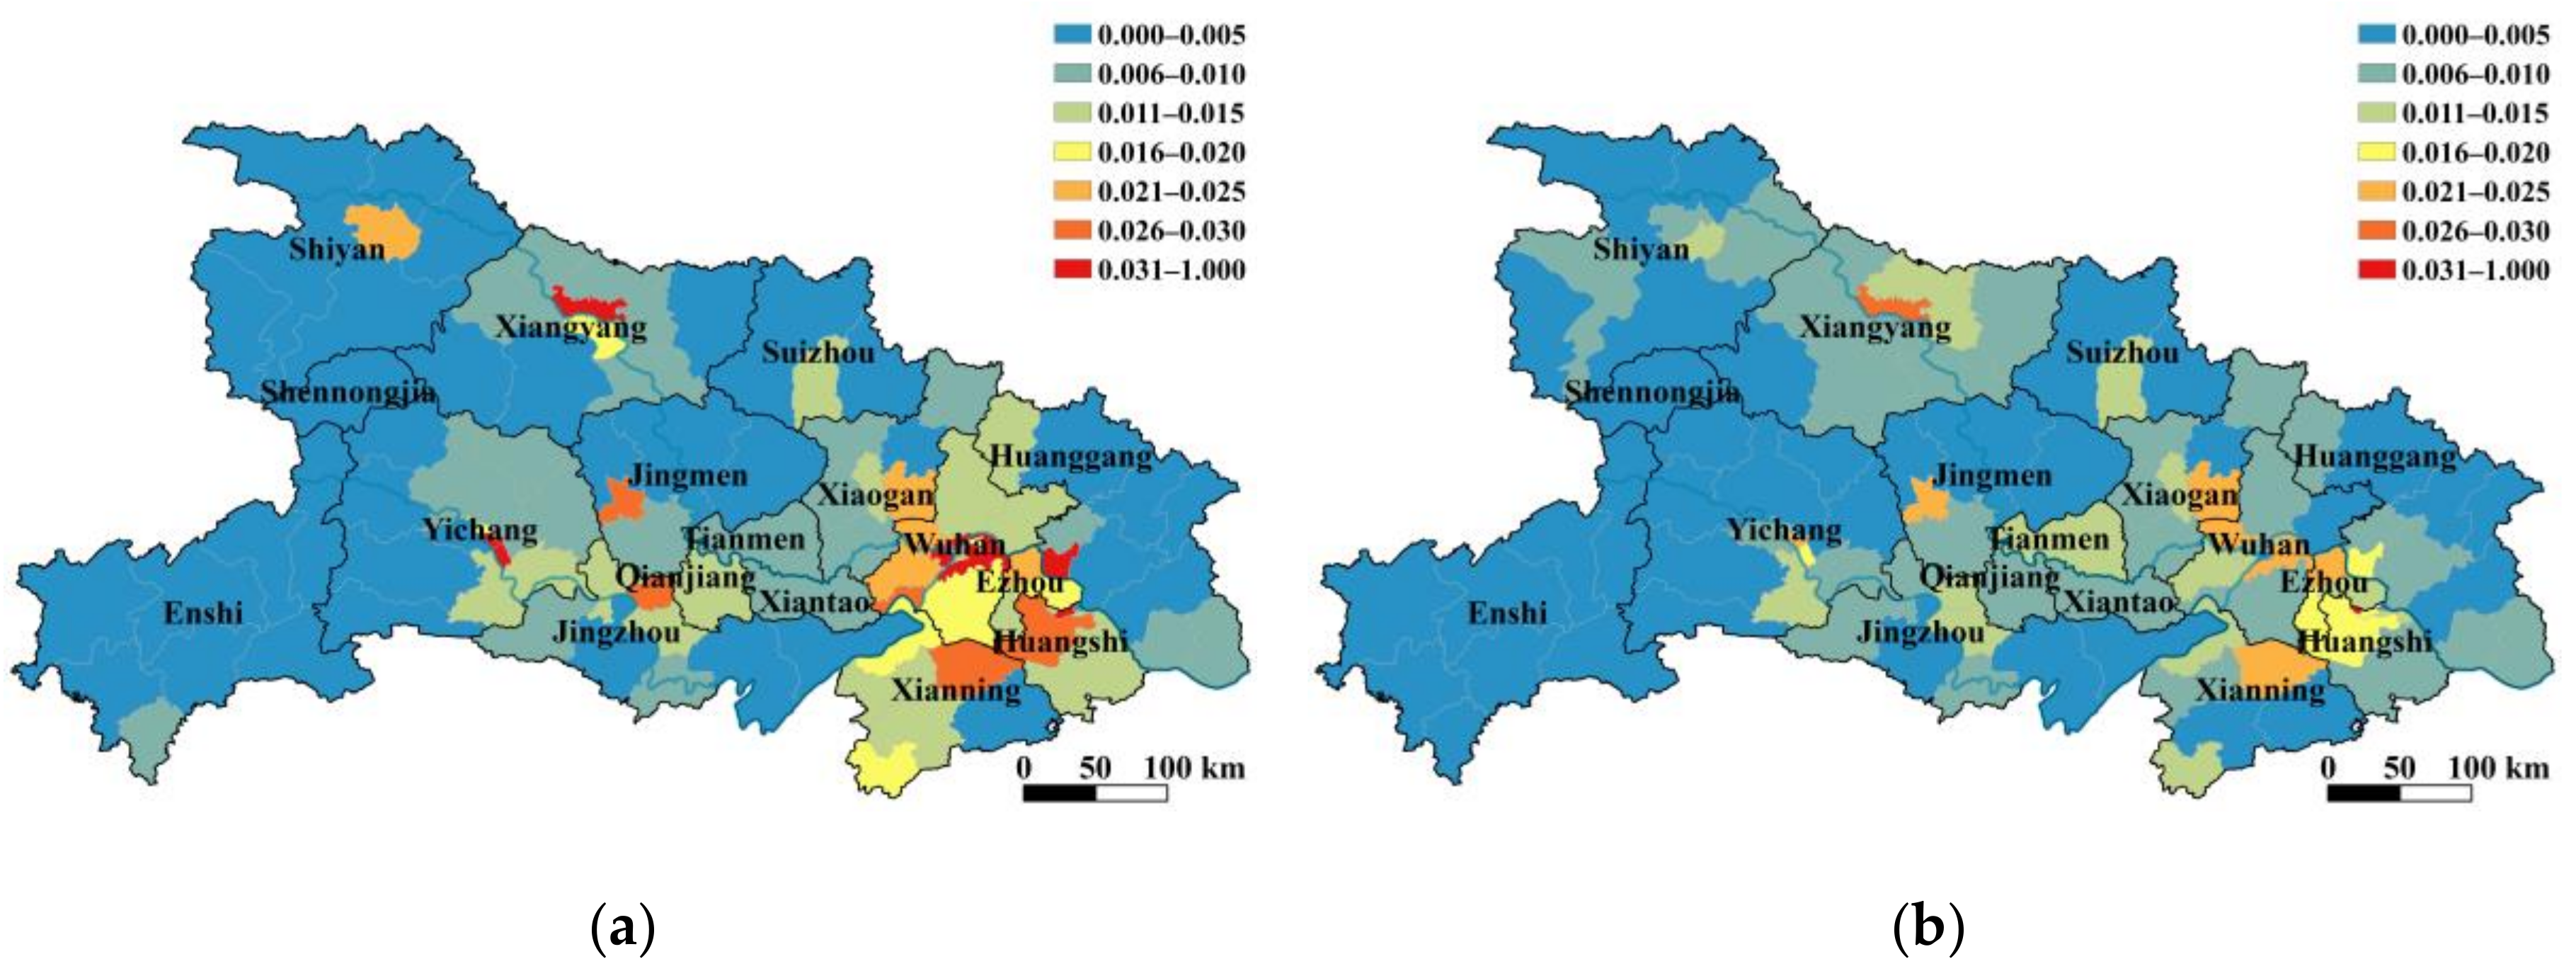
In general, the overall conflict degree of urban, agricultural, and ecological spaces in Hubei Province in 2010–2013 and 2013–2016 showed a similar spatial distribution (Figure 4). Low conflict degree areas were distributed in the mountainous areas of the West, North, and Northeast Hubei Province. High conflict degree areas were distributed in the plain areas of the central and eastern regions, especially the urban areas of prefectural-level cities. This condition shows that a prominent conflict mainly occurs in areas, such as plains and rapidly urbanized areas, where human activities are concentrated. Wuhan City Circle, with Wuhan as the center, formed a continuous space conflict area in 2010–2013. However, the space conflict in 2013–2016 weakened significantly in comparison to 2010–2013. The number of counties with an overall conflict degree of over 0.021 was reduced from 19 to eight, whereas the number of units of over 0.031 was reduced from nine to one. Furthermore, the distribution of the overall conflict degree in Wuhan City Circle has also become fragmentized.
3.3. Main Function Identification
The adoption of 0.33 as the threshold value of the type stability degree helped identify three single-function-dominated areas and two couple-function-dominated areas of land space in Hubei Province. These areas were the ecology-, agriculture-, urban-, agriculture–ecology-, and urban–ecology-dominated areas. In general, the spatial distribution of the main functions of land space in Hubei Province in 2010–2013 was similar to that of 2013–2016 (Figure 5). Mainly, three continuous function areas were observed, that is, the ecology-dominated areas in the west, the agriculture-dominated areas in the central area, and the agriculture-ecology-dominated areas in the east. The three contiguous areas accounted for more than 99% of the total area of Hubei Province, and the agriculture-ecology-dominated areas in the east were the most prominent. The urban-dominated areas were mainly distributed in the urban areas of Wuhan, Huangshi, and Yichang, most of which were urban-ecology-dominated areas. Among the areas, the Hongshan District of Wuhan changed from an ecology-dominated area in 2010–2013 to an urban-ecology-dominated area in 2013–2016, whereas the Xialu District of Huangshi changed from an urban-ecology-dominated area to an urban-dominated area. These irreversible changes require further attention.
3.4. Conflict Type Identification
As previously mentioned, the conflicts between the three types of spaces in Hubei Province were the occupations of agricultural and ecological spaces, which accounted for more than 90% of the total conflict area. For intuitional representation, a spatio-temporal comparative analysis of conflict type identification was implemented from the perspective of the occupations of the two space types (Figure 6). From the perspective of the occupation of agricultural space, two conflict types, namely, occupations by urban and ecological spaces, were identified on the basis of 0.33 of the type conflict degree threshold. Among the two conflict types, the occupation of agricultural space by urban space was the prominent conflict, which was continuously distributed in Central and Eastern Hubei Province in 2010–2013, with 70 counties involved. In 2013–2016, the spatial distribution of this conflict showed a trend of expanding to surrounding areas, especially to the west. The counties involved increased to 75, thereby nearly covering the entire province. In China, where the population is large and cultivated land is small, relevant departments should focus on the unfavorable trend to further protect the cultivated land and ensure food security. In addition, the occupation of agricultural space by ecological space involved only a few counties, but its distribution changed significantly from one county in the southeast in 2010–2013 to four counties in the northwest in 2013–2016. This result was probably due to the Grain for Green Policy starting from 1999 in China. This policy is an artificial ecological protection and improvement measure that return the sloping cultivated land to forests to prevent soil erosion.
From the perspective of the occupation of ecological space, three conflict types were identified on the basis of 0.33 of the type conflict degree threshold, including the occupations by urban space, agricultural space, and urban-agricultural space. Among these conflict types, the occupation of ecological space by agricultural space was the prominent conflict, which was mainly distributed in mountainous areas in the west, northeast and southeast, and several plains in the central area in 2010–2013, with 39 counties involved. However, in 2013–2016, this conflict type was mainly concentrated in the central and western regions and scattered in the eastern regions, thus reducing to 25 counties. This result was probably caused by the policy of cultivated land requisition-compensation balance. This policy is a cultivated land protection measure that the user of newly-developed construction land must develop and compensate cultivated land with the same quantity and quality of cultivated land occupied by construction land to ensure that the quantity and quality of cultivated land do not decrease. However, the balance of cultivated land is mainly achieved by occupying the ecological land. In recent years, the implementation of policies, such as intensive use of urban construction land and ecological civilization construction, slightly restrained the occupation of ecological land by cultivated land. However, the strict cultivated land protection policy indirectly led to an increase in the occupation of ecological space by urban space. In 2010–2013, this conflict type was scattered in the west of Hubei Province. Afterward, this conflict type had evolved into a scattered distribution around the entire region in 2013–2016, even showing an unfavorable trend of continuous expansion.
In summary, counties with the occupations of agricultural and ecological spaces by urban space as the main land space conflict showed a relatively expanding trend, whereas counties with the occupation of ecological space by agriculture space as the main land space conflict showed a relatively decreasing trend. On the one hand, this phenomenon is related to the socioeconomic development and urbanization; on the other hand, this phenomenon is also influenced by the implementation of national policies on cultivated land protection and ecological civilization construction.
3.5. Comprehensive Conflict Identification
Comprehensive conflict identification is an intuitive and comprehensive method that presents the three aforementioned contents collectively, that is, conflict degree evaluation, main function identification and conflict type identification. In accordance with the frequency distribution of the overall conflict degree of 103 counties in Hubei Province, 0.01 was selected as the threshold value to divide the counties into stable and conflict ones. The number of conflict counties in Hubei Province showed a decreasing trend, that is, from 42 in 2010–2013 to 29 in 2013–2016, and the spatial distribution presented a desirable transition from a continuous distribution in the east and middle of Hubei Province to a fragmentized distribution (Figure 7).
Specifically, the prominent conflict was the occupation of agricultural space by urban space, mainly in the central and eastern plains. In 2010–2013, two contiguous areas of this conflict have been observed. One area was located in the east with Wuhan city as the center, and the other area was the Qianjiang-Jingzhou-Yichang junction area in the south–central area. However, their spatial distribution showed a fragmenting trend in 2013–2016. The eastern continuous area was fragmentized into Ezhou-Huangshi and Wuhan-Xiaogan areas, and the south-central continuous area was fragmentized into Qianjiang-Jingzhou and Yichang areas. Moreover, the Xiangyang area in the north showed an expanding trend. Another major conflict type was the occupation of ecological space by agricultural space; this conflict type was mainly distributed in the eastern mountainous areas. This conflict involved relatively few counties and presented a decreasing and fragmentizing trend. In addition, several areas exhibited the occupation of ecological space by urban space as the major conflict. This conflict was distributed in urban areas of Wuhan, Xianning, and Shiyan in 2010–2013, and showed a decreasing trend in 2013–2016, only distributed in Wuhan and Shiyan.
In terms of stable counties, ecological and agricultural functions were the main uses of land space in Hubei Province. The spatial distribution of the stable area of ecological function has remained nearly unchanged in 2010–2013 and 2013–2016; this area was mainly located in the mountainous areas of the west, northeast, and southeast. In 2013–2016, an increase was observed in the mountainous area of the southeast, thereby forming a continuous area. The stable area of the agricultural function was mainly distributed in the central and eastern plains and showed an increasing trend. Most of the increased counties of this stable area were derived from the decreased conflict counties with the occupation of agricultural space by urban space as their main conflict. In addition, the stable area of urban function showed an increasing trend, thus evolving from only two counties in the urban areas of Wuhan and Huangshi in 2010–2013 to five counties in the urban areas of Wuhan, Huangshi, and Yichang in 2013–2016 and forming a continuous area in the provincial capital of Wuhan.
In conclusion, the comprehensive conflict identification can provide an overall understanding of the composition and spatial distribution of conflict and stable units of urban, agricultural, and ecological spaces. The occupations of agricultural space by urban space and ecological space by agricultural space were the main land space conflicts in Hubei Province, but both conflicts showed weakening and fragmentizing trends. Moreover, the ecological and agricultural functions of land space have been enhanced and have shown a trend of continuous distribution. Therefore, urban, agricultural, and ecological spaces in Hubei Province generally showed a favorable development trend.
4. Discussion
In this part, two problems will be further discussed. The first problem is the construction of the type conflict degree index. In this study, the denominator of the type conflict degree is the total area of land space conflict, whereas the other possible option is the total area of land space. Here, the advantages and disadvantages of the two methods and their applicable scope are discussed, and the construction rationality of the proposed index in this study is given. Another problem is the related factors of land space conflict. Given that the occupation by urban space accounts for more than 60% of the total conflict area in Hubei Province, the related factors of the occupation by urban space will be discussed collectively. In this study, the two problems are discussed on the basis of the correlation analysis between the land space change indices and its related factors in Hubei Province in 2010–2016 by the scatter matrix. The land space change indices used for analysis include the overall conflict degree (Pcd), the proposed type conflict degree of the occupation by urban space (P12 + P32), and the corresponding index with the total area of land space as the denominator (P’12 + P’32). Through filtration and comparison, four process quantity factors including variations of population density, GDP density, urbanization rate, and non-agricultural proportion of GDP, and two state quantity factors including elevation and slope are selected.
The scatter matrix between the land space change indices and its related factors is illustrated in Figure 8. The type conflict degree of the occupation by urban space with the total area of land space as the denominator shows a more obvious nonlinear correlation with the related factors than the corresponding index proposed in this study. However, this result does not mean that the type conflict degree proposed in this study is unreasonable. In fact, the proposed index is mainly used for conflict type identification, which requires a threshold criterion to compare with the conflict degree of different conflict types. In this study, the total area of land space conflict is used as the denominator of the type conflict degree, and then the sum of the type conflict degree of all conflict types is standardized to one, which is convenient for selecting a relatively comparable threshold. For example, this study applied 0.33 as the threshold of the type conflict degree and achieved the desired effect, which was difficult for the type conflict degree with the total area of land space as the denominator. Therefore, the application ranges of the two types of indices are different. In this study, the type conflict degree index with the total area of land space conflict as the denominator is convenient for identifying the main conflict types of evaluation units, whereas the one with the total area of land space as the denominator can be used to situations, such as correlation factor analysis.
Relevant factors of land space change indices are further discussed. In general, the correlation is higher between the type conflict degree of the occupation by urban space and related factors than between the overall conflict degree and related factors. This finding suggests that the six representative relevant factors can explain the land space conflict of the occupation by urban space well but cannot explain several conflicts covered in the overall conflict degree. Specifically, the conflict degree index increases with the population and GDP density and decreases with the increase in the two natural factors, namely, elevation and slope. Moreover, these changes are nonlinear, and the type conflict degree with the total area of the land space as the denominator is obvious. However, the two structural factors, that is, the urbanization rate and non-agricultural proportion of GDP, not only weakly correlate with the conflict degree but also present a negative correlation trend, which is intuitively unreasonable. This finding is probably because the urbanization rate and non-agricultural proportion of GDP in developed regions (red and yellow points) are too high to be improved, and then urban space expansion becomes an important means for their development. However, the underdeveloped areas (light and dark green points) are the opposite. Therefore, the plain area with rapid growth of population and GDP density in Hubei Province is a high-risk area for land space conflict. It is also a key area for future land space planning control, in which scientific zoning of urban, agricultural, and ecological spaces is required.
Besides the above-mentioned natural and socio-economic factors, the policy factor that is difficult to quantify also has a considerable impact on land space utilization and conflicts, especially for China whose government has strong administrative control capabilities. Because there are large population and relatively scarce land space in China, various policies have been adopted to control urban space expansion and protect agriculture and ecological space. These policies have indeed played a positive role in curbing the bad trend in the above-mentioned case of Hubei Province. However, there are interactions and influences between these policies. For example, the policy of cultivated land requisition-compensation balance can ensure that the quantity and quality of cultivated land do not decrease. However, the policy is usually at the cost of the occupation of ecological space. The Grain for Green Policy returns the sloping cultivated land to forests to improve the ecological environment. Nevertheless, the decreased cultivated land caused by the policy may influence the food security. Furthermore, the strict cultivated land protection policy indirectly may lead to an increase in the occupation of ecological space by urban space. Therefore, the land space planning, which makes a scientific and overall arrangement for the three types of spaces in the future, is significantly necessary. The planning can coordinate various policies to achieve uniform goals and promote the sustainable utilization of land space.
5. Conclusions
The disordered development and utilization of land space in China usually lead to serious conflicts between urban, agricultural, and ecological spaces. To explore the conflicts, this study proposes a conflict identification method for the three types of spaces on the basis of the space conversion matrix to provide an important reference for scientific zoning of the three types of spaces. On the basis of the space conversion matrix, land space change indices, namely, overall conflict degree, type stability degree, and type conflict degree, are constructed for conflict degree evaluation, main function identification, conflict type identification and comprehensive conflict identification. Moreover, Hubei Province is used as an example to verify the method. The results indicate that the main land space conflict types in Hubei Province in 2010–2016 were the occupations of agricultural space by urban space and ecological space by agricultural space. Moreover, the high conflict areas were mainly concentrated in the central and eastern plains, especially the urban areas of the prefectural-level cities. Through data comparison between the two periods, the two major conflict types showed weakening and fragmenting trends, and the two major land space functions, namely, ecological and agricultural functions, demonstrated a stable and continuous trend. Therefore, the land space in Hubei Province generally shows a favorable development trend. Furthermore, the developed plain areas with the rapid growth of the population and GDP density are probably the high conflict areas of land space and are the key areas for future land space planning control.
The main contribution of this study is a new land space conflict identification method based on the space conversion matrix. The proposed method can evaluate the conflict degree and identify conflict types simultaneously; this advantage over the previous methods compensates for the insufficiencies of the previous methods that focused on a single aspect. Additionally, the land space change indices based on the space conversion matrix can simply and intuitively reflect the conflict identification results, whereas previous methods require high data conditions. By using Hubei Province as an example, the proposed method has been implemented at the meso- and macro-scales, that is, using counties as evaluation units. The conflict identification results can guide the land space planning and management at the meso- and macro-scales and provide a reference for implementing differentiated land space control. Furthermore, the application scope of the proposed method can be expanded in the future. For example, detailed evaluation units, such as grids, can be used for identifying land space conflicts at the micro-scale. The identification results are expected to directly assist the scientific zoning of the three types of spaces at the micro-scale. The difficulty of this method in terms of the land space conflict identification at the micro-scale is the scientific process for selecting the spatial and temporal granularity of identification; therefore, this process is the direction that the future relevant research can investigate.
Author Contributions
Conceptualization, Q.Y. Data curation, R.W. Methodology, Q.Y. Visualization, P.Z. Writing, original draft, Q.Y. Writing, review and Editing, R.W. All authors read and approved the final manuscript.
Funding
This research was funded by the National Natural Science Foundation of China (41701203).
Acknowledgments
The authors are deeply grateful to the reviewers for their constructive and valuable comments. The authors also gratefully acknowledge the financial support of the National Natural Science Foundation of China.
Conflicts of Interest
The authors declare no conflict of interest.
References
- Shen, L.; Ren, Y.; Xiong, N.; Li, H.; Chen, Y. Why small towns can not share the benefits of urbanization in China? J. Clean. Prod. 2018, 174, 728–738. [Google Scholar] [CrossRef]
- Zhou, D.; Xu, J.; Lin, Z. Conflict or coordination? Assessing land use multi-functionalization using production-living-ecology analysis. Sci. Total Environ. 2017, 577, 136–147. [Google Scholar] [CrossRef] [PubMed]
- Long, H.; Zou, J.; Liu, Y. Differentiation of rural development driven by industrialization and urbanization in eastern coastal China. Habitat. Int. 2009, 33, 454–462. [Google Scholar] [CrossRef] [Green Version]
- Seto, K.C.; Kaufmann, R.K. Modeling the drivers of urban land use change in the Pearl River Delta, China: Integrating remote sensing with socioeconomic data. Land Econ. 2003, 79, 106–121. [Google Scholar] [CrossRef]
- Hui, E.C.M.; Bao, H. The logic behind conflicts in land acquisitions in contemporary China: A framework based upon game theory. Land Use Policy 2013, 30, 373–380. [Google Scholar] [CrossRef]
- Cai, E.; Jing, Y.; Liu, Y.; Yin, C.; Gao, Y.; Wei, J. Spatial-temporal patterns and driving forces of ecological-living-production land in Hubei Province, Central China. Sustainability 2018, 10, 66. [Google Scholar] [CrossRef]
- Dang, L.; Xu, Y.; Tang, Q. The pattern of available construction land along the Xijiang River in Guangxi, China. Land Use Policy 2015, 42, 102–112. [Google Scholar] [CrossRef] [Green Version]
- Verburga, P.H.; Veldkampb, A.; Frescoa, L.O. Simulation of changes in the spatial pattern of land use in China. Appl. Geogr. 1999, 19, 211–233. [Google Scholar] [CrossRef]
- Lichtenberg, E.; Ding, C. Assessing farmland protection policy in China. Land Use Policy 2008, 25, 59–68. [Google Scholar] [CrossRef]
- Streets, D.; Chung, C.; Krummel, J.; Su, H. Remote sensing of global change: Growth in China’s Jiangsu Province. Int. J. Sustain. Dev. World 1995, 2, 257–266. [Google Scholar] [CrossRef]
- Elhadary, Y.A.E.; Samat, N.; Obeng-Odoom, F. Development at the peri-urban area and its impact on agricultural activities: An example from the Seberang Perai Region, Penang State, Malaysia. Agroecol. Sustain. Food 2013, 37, 834–856. [Google Scholar] [CrossRef]
- Du, J.; Thill, J.; Peiser, R.B.; Feng, C. Urban land market and land-use changes in post-reform China: A case study of Beijing. Landsc. Urban Plan 2014, 124, 118–128. [Google Scholar] [CrossRef]
- Du, J.; Thill, J.; Peiser, R.B. Land pricing and its impact on land use efficiency in post-land-reform China: A case study of Beijing. Cities 2016, 50, 68–74. [Google Scholar] [CrossRef]
- Ning, J.; Liu, J.; Kuang, W.; Xu, X.; Zhang, S.; Yan, C.; Li, R.; Wu, S.; Hu, Y.; Du, G.; et al. Spatiotemporal patterns and characteristics of land-use change in China during 2010–2015. J. Geogr. Sci. 2018, 28, 547–562. [Google Scholar] [CrossRef]
- Adam, Y.O.; Pretzsch, J.; Darr, D. Land use conflicts in central Sudan: Perception and local coping mechanisms. Land Use Policy 2015, 42, 1–6. [Google Scholar] [CrossRef]
- Steinhäußer, R.; Siebert, R.; Steinführer, A.; Hellmich, M. National and regional land-use conflicts in Germany from the perspective of stakeholders. Land Use Policy 2015, 49, 183–194. [Google Scholar] [CrossRef]
- Deininger, K.; Castagnini, R. Incidence and impact of land conflict in Uganda. J. Econ. Behav. Organ. 2006, 60, 321–345. [Google Scholar] [CrossRef]
- Young, J.; Watt, A.; Nowicki, P.; Alard, D.; Clitherow, J.; Henle, K.; Johnson, R.; Laczko, E.; McCracken, D.; Matouch, S.; et al. Towards sustainable land use: Identifying and managing the conflicts between human activities and biodiversity conservation in Europe. Biodivers. Conserv. 2005, 14, 1641–1661. [Google Scholar] [CrossRef]
- Godschalk, D.R. Land use planning challenges: Coping with conflicts in visions of sustainable development and livable communities. J. Am. Plan. Assoc. 2004, 70, 5–13. [Google Scholar] [CrossRef]
- Valle Junior, R.F.; Varandas, S.G.P.; Sanches Fernandes, L.F.; Pacheco, F.A.L. Groundwater quality in rural watersheds with environmental land use conflicts. Sci. Total Environ. 2014, 493, 812–827. [Google Scholar] [CrossRef] [PubMed]
- Zhang, Y.J.; Li, A.J.; Fung, T. Using GIS and multi-criteria decision analysis for conflict resolution in land use planning. Procedia Environ. Sci. 2012, 13, 2264–2273. [Google Scholar] [CrossRef]
- Mwasi, B. Land use conflicts resolution in a fragile ecosystem using multi-criteria evaluation (MCE) and a GIS-based decision support system (DSS). In Proceedings of the International Conference on Spatial Information for Sustainable Development, Nairobi, Kenya, 2–5 October 2001. [Google Scholar]
- Yu, B.; Lv, C. The progress and prospect of land use conflicts. Prog. Geogr. 2006, 25, 106–115. [Google Scholar]
- Zhou, D.; Xu, J.; Wang, L. Land use spatial conflicts and complexity: A case study of the urban agglomeration around Hangzhou Bay, China. Geogr. Res. 2015, 34, 1630–1642. [Google Scholar] [CrossRef]
- Yang, Y.; Zhu, L. The theory and diagnostic methods of land use conflicts. Resour. Sci. 2012, 34, 1134–1141. [Google Scholar]
- Karimi, A.; Hockings, M. A social-ecological approach to land-use conflict to inform regional and conservation planning and management. Landsc. Ecol. 2018, 33, 691–710. [Google Scholar] [CrossRef]
- Brown, G.; Raymond, C.M. Methods for identifying land use conflict potential using participatory mapping. Landsc. Urban Plan 2014, 122, 196–208. [Google Scholar] [CrossRef]
- Brody, S.D.; Highfield, W.; Arlikatti, S.; Bierling, D.H.; Ismailova, R.M.; Lee, L.; Butzler, R. Conflict on the coast: Using geographic information systems to map potential environmental disputes in Matagorda Bay, Texas. Environ. Manag. 2004, 34, 11–25. [Google Scholar] [CrossRef] [PubMed]
- Buzai, G.D.; Principi, N. Identification of areas of potential land-use conflict in the Luján River basin, Argentina. Rev. Geogr. Am. Cent. 2017, 3, 125–159. [Google Scholar] [CrossRef]
- Hart, D. Smart land-use analysis: The LUCIS model: Land-use conflict identification strategy. J. Am. Plan. Assoc. 2009, 75, 89. [Google Scholar] [CrossRef]
- Carr, M.H.; Zwick, P. Using GIS suitability analysis to identify potential future land use conflicts in North Central Florida. J. Conserv. Plan. 2005, 1, 58–73. [Google Scholar]
- Valle Junior, R.F.; Varandas, S.G.P.; Pacheco, F.A.L.; Pereira, V.R.; Santos, C.F.; Cortes, R.M.V.; Sanches Fernandes, L.F. Impacts of land use conflicts on riverine ecosystems. Land Use Policy 2015, 43, 48–62. [Google Scholar] [CrossRef] [Green Version]
- Valle Junior, R.F.; Varandas, S.G.P.; Sanches Fernandes, L.F.; Pacheco, F.A.L. Environmental land use conflicts: A threat to soil conservation. Land Use Policy 2014, 41, 172–185. [Google Scholar] [CrossRef]
- Pacheco, F.A.L.; Varandas, S.G.P.; Sanches Fernandes, L.F.; Valle Junior, R.F. Soil losses in rural watersheds with environmental land use conflicts. Sci. Total Environ. 2014, 485–486, 110–120. [Google Scholar] [CrossRef] [PubMed]
- Sajikumar, N.; Remya, R.S. Impact of land cover and land use change on runoff characteristics. J. Environ. Manag. 2015, 161, 460–468. [Google Scholar] [CrossRef] [PubMed]
- Mottet, A.; Ladet, S.; Coqué, N.; Gibon, A. Agricultural land-use change and its drivers in mountain landscapes: A case study in the Pyrenees. Agric. Ecosyst. Environ. 2006, 114, 296–310. [Google Scholar] [CrossRef]
- Wang, J.; He, T.; Lin, Y. Changes in ecological, agricultural, and urban land space in 1984–2012 in China: Land policies and regional social-economical drivers. Habitat. Int. 2018, 71, 1–13. [Google Scholar] [CrossRef]
Figure 1.
Framework of the conflict identification method of urban, agricultural, and ecological spaces.
Figure 1.
Framework of the conflict identification method of urban, agricultural, and ecological spaces.

Figure 2.
Location and land use of the study area.

Figure 3.
Land space change indices in Hubei Province in 2010–2013 and 2013–2016: (a) type stability degree; and (b) type conflict degree.
Figure 3.
Land space change indices in Hubei Province in 2010–2013 and 2013–2016: (a) type stability degree; and (b) type conflict degree.

Figure 4.
Overall conflict degree of land space in Hubei Province: (a) 2010–2013; and (b) 2013–2016.
Figure 4.
Overall conflict degree of land space in Hubei Province: (a) 2010–2013; and (b) 2013–2016.

Figure 5.
Main function identification of land space in Hubei Province: (a) 2010–2013; and (b) 2013–2016.
Figure 5.
Main function identification of land space in Hubei Province: (a) 2010–2013; and (b) 2013–2016.

Figure 6.
Conflict type identification of land space in Hubei Province: (a) occupation of agricultural space in 2010–2013; (b) occupation of ecological space in 2010–2013; (c) occupation of agricultural space in 2013–2016; and (d) occupation of ecological space in 2013–2016.
Figure 6.
Conflict type identification of land space in Hubei Province: (a) occupation of agricultural space in 2010–2013; (b) occupation of ecological space in 2010–2013; (c) occupation of agricultural space in 2013–2016; and (d) occupation of ecological space in 2013–2016.

Figure 7.
Comprehensive conflict identification of land space in Hubei Province: (a) 2010–2013; and (b) 2013–2016.
Figure 7.
Comprehensive conflict identification of land space in Hubei Province: (a) 2010–2013; and (b) 2013–2016.

Figure 8.
Relationship between land space change indices and related factors of Hubei province.


Table 1.
Space conversion matrix of urban, agricultural, and ecological spaces in Hubei Province (2010–2013) (Unit: km2).
Table 1.
Space conversion matrix of urban, agricultural, and ecological spaces in Hubei Province (2010–2013) (Unit: km2).
| Space Type | Urban Space | Agricultural Space | Ecological Space | Total |
|---|---|---|---|---|
| Urban space | 4908.09 | 10.51 | 0.71 | 4919.31 |
| Agricultural space | 560.07 | 71,885.96 | 41.69 | 72,487.72 |
| Ecological space | 235.84 | 359.10 | 107,968.78 | 108,563.72 |
| Total | 5704.00 | 72,255.57 | 108,011.18 | 185,970.75 |
Table 2.
Space conversion matrix of urban, agricultural, and ecological spaces in Hubei Province (2013–2016) (Unit: km2).
Table 2.
Space conversion matrix of urban, agricultural, and ecological spaces in Hubei Province (2013–2016) (Unit: km2).
| Space Type | Urban Space | Agricultural Space | Ecological Space | Total |
|---|---|---|---|---|
| Urban space | 5684.49 | 12.19 | 7.31 | 5704.00 |
| Agricultural space | 453.42 | 71,735.59 | 66.56 | 72,255.57 |
| Ecological space | 181.23 | 234.83 | 107,595.12 | 108,011.18 |
| Total | 6319.14 | 71,982.61 | 107,669.00 | 185,970.75 |
© 2018 by the authors. Licensee MDPI, Basel, Switzerland. This article is an open access article distributed under the terms and conditions of the Creative Commons Attribution (CC BY) license (http://creativecommons.org/licenses/by/4.0/).
Share and Cite
MDPI and ACS Style
Ye, Q.; Wei, R.; Zhang, P. A Conflict Identification Method of Urban, Agricultural and Ecological Spaces Based on the Space Conversion Matrix. Sustainability 2018, 10, 3502. https://doi.org/10.3390/su10103502
AMA Style
Ye Q, Wei R, Zhang P. A Conflict Identification Method of Urban, Agricultural and Ecological Spaces Based on the Space Conversion Matrix. Sustainability. 2018; 10(10):3502. https://doi.org/10.3390/su10103502
Chicago/Turabian StyleYe, Qingqing, Rong Wei, and Peipei Zhang. 2018. "A Conflict Identification Method of Urban, Agricultural and Ecological Spaces Based on the Space Conversion Matrix" Sustainability 10, no. 10: 3502. https://doi.org/10.3390/su10103502
Note that from the first issue of 2016, this journal uses article numbers instead of page numbers. See further details here.