Introduction of Smart Grid Station Configuration and Application in Guri Branch Office of KEPCO


1
KU-KIST GreenSchool, Graduate School of Energy and Environment, Korea University, Seoul 02841, Korea
2
KEPCO Academy, Seoul 01793, Korea
3
School of Electrical Engineering, Korea University, Seoul 02841, Korea
*
Author to whom correspondence should be addressed.
Sustainability 2018, 10(10), 3512; https://doi.org/10.3390/su10103512
Submission received: 29 July 2018
/
Revised: 30 August 2018
/
Accepted: 28 September 2018
/
Published: 30 September 2018
(This article belongs to the Special Issue Smart Energy Management for Smart Grids)
Abstract
:Climate change and global warming are becoming important problems around the globe. To prevent these environmental problems, many countries try to reduce their emissions of greenhouse gases (GHGs) and manage the consumption of energy. The Korea Electric Power Corporation (KEPCO) introduced smart grid (SG) technologies to its branch office in 2014. This was the first demonstration of a smart grid on a building, called the Smart Grid Station (SGS). However, the smart grid industry is stagnant despite of the efforts of KEPCO. The authors analyzed the achievements to date, and proved the effects of the SGS by comparing its early targets to its performance. To evaluate the performance, we analyzed the data of 2015 with the data of 2014 in three aspects: peak reduction, power consumption reduction, and electricity fee savings. Furthermore, we studied the economic analysis including photovoltaic (PV) and energy storage system (ESS) electricity fee savings, as well as running cost savings by electric vehicles. Through the evaluation, the authors proved that the performance surpassed the early targets and that the system is economical. With the advantages of the SGS, we suggested directions to expand the system.
1. Introduction
For many years, concerns about global warming and climate change have been growing. In response to these environmental problems, most developed and developing countries have held meetings and sought countermeasures. However, due to the expiration of the Kyoto Protocol in 2020 (Post2020), the Paris Agreement—a statement of intent to address climate change problems—was signed by 195 countries at the twenty-first Conference of the Parties of the United Nations Framework Convention on Climate Change (UNFCCC), held in Paris, France in 2015. The objective of the Paris Agreement was prevent the increase in the global average temperature from rising more than 2 °C above pre-industrial levels [1]. Each country set its own target with regard to greenhouse gas (GHG) emissions. Table 1 shows the goals for the GHG reduction of some selected countries.
Through Intended Nationally Determined Contributions, the Korean government set a goal to reduce GHG emissions by 37% compared to business as usual (BAU) by 2030 [5]. In their effort, the Korean government has tried to expand renewable energy (RE) generation and developed new technologies. One of these technologies is the smart grid (SG), which is a new concept of an electrical grid integrated with information and communication technologies (ICT).
Since 2009, the Korea Electric Power Corporation (KEPCO, a public organization) has installed and demonstrated SG technologies. The Jeju Smart Grid Demonstration Project was the first test-bed built on Jeju Island in 2009. This project had five themes: smart place, smart transportation, smart renewable, smart power grid, and smart service. It included renewable energy sources, electric meters, electric vehicles, a battery system, demand responses, transmissions, communications, etc. Using the experience gained in that project, the Smart Grid Station (SGS) was built in the Guri branch office building of KEPCO in 2014 as the first demonstration. The “station” in SGS refers to a place or building that can provide various services. Therefore, the SGS is a place that provides intelligent electricity services to customers. This new business model is different from building energy management systems (BEMSs). The BEMS is used for minimizing energy costs by primarily managing HVAC (heating, ventilation, and air conditioning), lighting, and other systems [6], and Ock et al. have proposed a control system using building energy control patterns to adjust the energy use. The HVAC is regarded as an important portion in load demand in [7]. Ferro et al. [7] have suggested an architecture based on model predictive control to improve the operation efficiency of building energy consumption. A SG is generally composed of distributed energy resources (DERs), such as photovoltaics (PVs) and wind turbines (WTs), an operation system (OS) as an energy management system (EMS), an energy storage system (ESS), advanced metering infrastructure (AMI), and other smart devices [8]. References [9,10,11] are about smart zero-energy buildings that utilize internet of things technologies. Especially, Kolokotsa [9] have emphasized the importance of zero-energy buildings for the smart community, but the support basis is weak in that there is no case study. Wurtz et al. [10] have described a global research strategy to improve a smart software. The authors have also considered the strategy in a living lab. In [11], the authors have described smart buildings with a new technology. However, the proposed system is limited in that the system is focused on the internet of things. In [12], Kim et al. have suggested an EMS algorithm based on reinforcement learning to reduce energy cost. However, this research ignored charging and discharging loss of ESS, and the system is composed of simple devices. Barbato et al. [13] have focused on an energy management framework integrating renewable energy, storage bank, and demand response in a smart campus. The authors have discussed scenarios to minimize the energy cost. In [14], the authors have dealt with the lighting energy consumption in educational institutes, and have applied a data mining tool to reduce the energy waste of lighting. The recent research has described smart buildings, and has mostly focused on algorithms with improvements. On the other hand, we describe the first SGS demonstration, which is a more comprehensive solution than the smart buildings mentioned above, in that the SGS integrates software with hardware including electric vehicles (EVs), a building automation system (BAS), and a distribution automation system. We also conducted a performance evaluation and analyzed its economic feasibility. The goal of the SGS is to optimize energy consumption by utilizing various technologies, even though the SGS is connected to the power grid. Especially, the OS can balance supply and demand in real-time by monitoring and controlling the whole system. KEPCO has determined that the office could shave power peak and reduce power consumption by use of the SGS. As a result, the SGS has expanded to 121 of the branch offices. However, the expansion is limited to KEPCO’s internal branch offices in Korea. Although it has been a few years since the first SGS was built, the smart grid industry is stagnant. The authors recognized that an analysis was needed to prove the performance of SGS to promote the SG industry. For this purpose, this paper presents the concepts and features in Section 2, the description of components in Section 3, and the analysis of the performance of SGS in Section 4. We calculated the performances about peak shaving, reducing power consumption, and saving electricity fees to prove the advantages of the technology. The authors also evaluate the economic feasibility by PV, ESS, and EV in Section 5. Based on the results, a discussion is given in Section 6, and Section 7 concludes the paper.
2. SGS Concept and Features
The objectives of SGS are to optimize the usage of electricity and to reduce the electricity fee and consumption in a building, with the integration of various technologies.
When renewable energy sources are connected to both the grid and ESS-generated power, the power from renewable energy can be supplied to the load directly or can charge a battery of the ESS. Also, the battery is charged from the grid when the price of electricity on the grid is low and is discharged when the price is high. This allows a building to save money and reduce power consumption. In other words, less energy production is required from fossil fuel generators during peak load time. Consequently, the SGS benefits the environment by reducing CO2 emissions. As a public organization, KEPCO has developed the SGS with small- and mid-sized businesses to grow together. Through the accompanied growth, the KEPCO has contributed to popularize components of the system. These effects are shown in Table 2.
The Guri SGS project consisted of two steps. The period of the first step was from October 2013 to February 2014. This step comprised the installation of PV, ESS, a slow-charging type of EV charger, AMI, a smart distribution board, and BAS components. A main goal of the first step was to optimize the building’s energy consumption based on the SG. The second step comprised the addition of WT, an HVAC control system, and improving the operation system. The period of the second step was from December 2014 to June 2015.
Figure 1 is a diagram of SGS components. It shows power connections and communication connections. PV was connected to a power conversion system (PCS), which makes the power from the renewable energy stable. Because WT was installed at the second step, it was connected to the transformer (TR) room directly. This solution has the characteristics of a test-bed to optimize the operation of energy consumption.
The power from RE can charge batteries or supply loads including lights, outlets, HVAC, variable frequency drives (VFDs), and EVs. The equipment of the SGS is interconnected in the transformer (TR) room. Also, the KEPCO grid is directly connected to the TR room, and the power quality is checked by AMI. The operation system is a software program that plays a key role in integrating other technologies. This system gathers the various data, including voltage, current, frequency, communication status, and amount of generated power. This means that the OS can not only control each element remotely, but also maintain the power balance between various components. Each component will be described in Section 3.
3. Components Description
3.1. DERs and Operation System
3.1.1. Photovoltaic
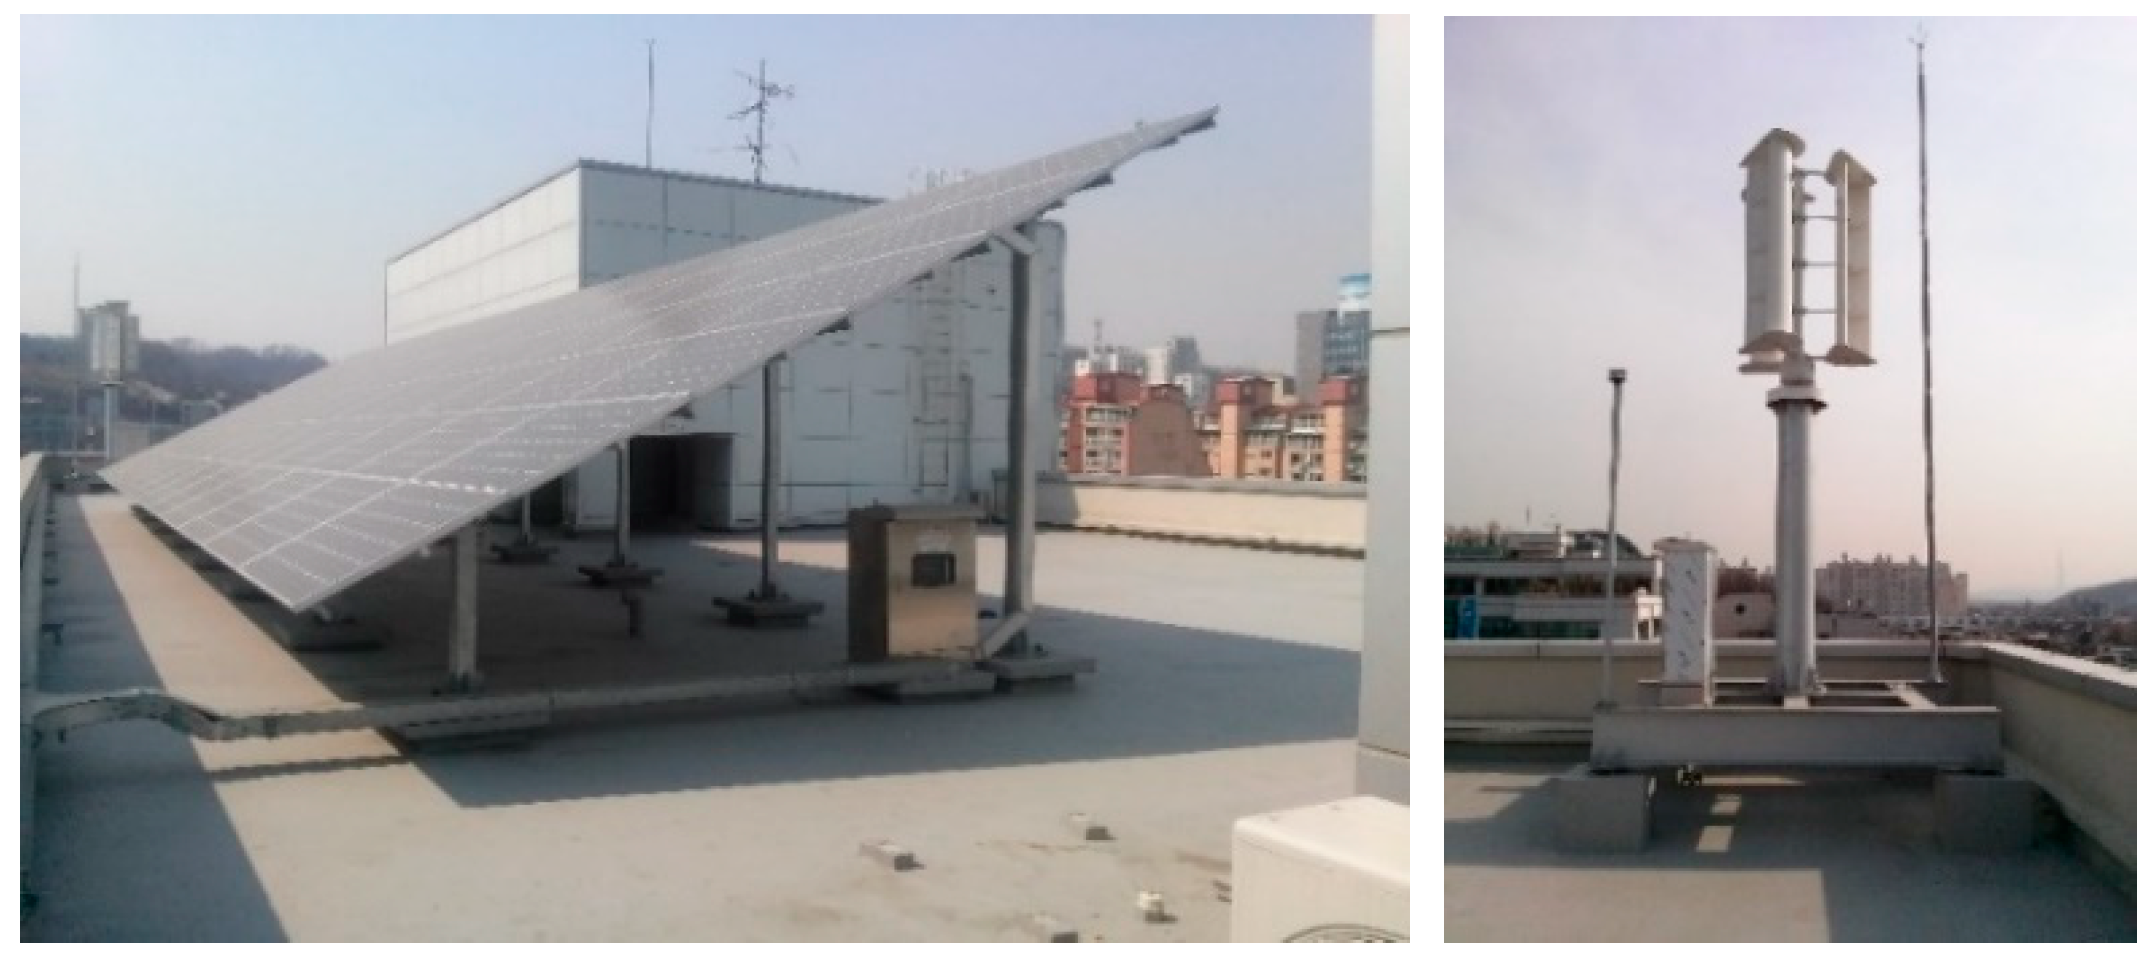
The PV system was mounted at 30° on the rooftop. The maximum power of each module is 250 W, and the total capacity of the system is 20 kWp. The system is composed of 84 modules consisting of monocrystalline silicon cells, but four of them are dummies which are not generated and connected to the system. The dummies are decorations to make the shape rectangular in 4 by 21. The connection is 16 series by 5 parallel because of space restriction. The capacity was adopted at 5% of the contracted power (400 kW) of the Guri office to reduce 5% of the power peak. The PV system supplies the power to the building at peak load time and mid load time, and charges a battery at off-peak load time. By utilizing the PV system, KEPCO expected that 9.6% of power consumption would be possible. Table 3 provides the specifications of the PV system.
The power from PV in summer season, from June to August, does not charge the battery but supplies to building loads directly to reduce the peak and the power consumption.
3.1.2. Wind Turbine
A WT system was mounted on the rooftop in March 2015. The PV and the WT installed were as in Figure 2. A vertical axis-type WT was selected for the SGS because this WT is suitable in urban areas since it is not influenced by the direction of the wind [15] and does not make noise when the turbine rotates. Also, its cut-in wind speed is a light wind of 3 m/s. These features make the WT system easy to install on buildings, but the rated power is 1.2 kW at 15 m/s. This WT was not custom-made, and there was a space restriction. To install the WT on the rooftop while making the best use of the space, the system designer could only choose the small size of WT rated at 1.2 kW. Although this WT can generate 53 kWh per year according to Weibull performance calculations, the system is not optimal for contributing to energy use reduction, because the wind does not blow fast enough in the urban area. Nevertheless, its presence is meaningful in that it is an attempt at WT installation on a building.
3.1.3. Energy Storage System
The ESS is composed of a battery and a PCS. Figure 3 shows the battery and the PCS installed on the rooftop. The ESS can be used for either on-grid status or off-grid status. The ESS has various effects: peak shaving, load leveling, providing constant voltage and constant frequency (CVCF), cost reduction, load compensation, and so on [17]. In this paper, the authors focused on peak shaving and load shifting. Regarding the first function, the ESS charges power from renewable energy sources at the off-peak load time and discharges the power at the peak time. Concerning the second function, the ESS charges a battery with the power from the grid in the evening and discharges the battery in the afternoon. By peak shaving and load shifting, the electricity fee can be saved.
The PCS converts DC-to-AC and AC-to-DC. This means that it can function both as a converter and an inverter. PV systems generally have their own inverters, whereas the PCS used in the SGS is connected with the battery as well as the PV. Because the PCS is a hybrid type, it is possible to charge and discharge the battery simultaneously, making it possible to optimize the power from the PV and the battery. Figure 4 is the inner connection diagram of the PCS. The capacity of the PCS was determined as 30 kW by adding 20 kWp of the PV system and 10 kW of the expected peak reduction, which is 5% of the power peak (180 kW) at the Guri office.
A lithium iron phosphate (LiFePO4) battery was selected because this battery has better thermal and chemical safety than other types of batteries [18]. The life cycle is 4000 cycles at 80% of depth of discharge (DOD). Its size is 50 kWh, and the capacity was designed to discharge for five hours at 8 kW while considering 80% of DOD. The 4000 life cycles means that the battery can be used 4000 times if it charges-and-discharges power in the range of 20% to a full charge state. This range is established to prevent the battery from reaching a full discharge state. The specification of the ESS is in Table 6.
There are three discharge schedules that the operator adjusts, as follows:
- Uniform discharge: discharges a uniform amount of power from the battery during peak and mid-load times continuously;
- Continuous differential discharge: continuously discharges during peak and mid-load times, but the amount is different during peak load time;
- Non-continuous differential discharge: discharges non-continuously during peak and mid-load times, and the amount is different during peak-load time.
In summary, the ESS charges the batteries at the off-peak load time and discharges them during the peak and mid-load times on weekdays. It is expected that a customer can reduce power peak by 5% with these schedules.
3.1.4. SGS Operation System
In the SGS, the operation system plays the role of the energy management system (EMS) developed by KEPCO. It is a software program that can integrate the other components. The integration allows the OS to monitor the power consumption of all components in real-time. Moreover, it has a human–machine interface (HMI) that shows the details of the components. By monitoring, optimized management is possible. Specifically, the operator can set schedules for these devices. Regarding the PCS, the OS controls the charge–discharge operation mode as shown in Table 7. However, the WT is not considered in the modes, because the output of the WT is too small to contribute to the modes. The OS has three categories: system configuration, management, and statistics.
The first category, system configuration, shows the real-time flow of power. In this section, users can check the status of components and monitor the general data, including electricity fee information, supplied power from each source, and the power consumption of the building. This helps users to understand the power flow. In this section, the operator monitors the overall status of the system, electricity fee information, real-time demand power, and supply power including the generation of RE and battery discharge. This section also includes information on the communication status of each device. The serial communications protocols used in the SGS are Modbus and Zigbee [19]. The components are connected in communication lines, and the data of the devices are gathered into the operation system. Especially, the PV, PCS, and battery data are sent by International Electrotechnical Commission (IEC) 61850. The IEC 61850 protocol standard is for substation to exchange data and enables the integration of control, measurement, and monitoring [20]. The used IEC 61850 models are the following: IEC 61850-7-420 is used to exchange of data with DERs, and IEC 61850-90-9 has functions for power converters focused on DC-to-AC and AC-to-DC conversions [19,21,22]. The PV data are voltage and current of generated power, and solar radiation. The PCS measures active power, reactive power, phase current, and phase voltage. Also, the battery sends the data of voltage, current, status of charge, temperature, and each cell’s voltage, current, and temperature.
The management is for treating smart lights, smart outlets, VFDs, HVAC, and ESS. As an example of this section, the operator is not only able to monitor each smart outlet but also turn them on and off.
The statistics section is comprised of an overall analysis, DER analysis, and load forecasting. Overall analysis is for supplied power and peak per day, month, and year. This section shows the monthly analysis of supply/demand. The DER analysis shows the PV generation and the amount of battery discharge. One of the main functions of the OS is to forecast the demand of electricity by its own algorithm. Through this analysis, the OS controls the devices and power flow, and decides to charge or discharge the battery.
3.2. Other Ancillary Equipment
3.2.1. Advanced Metering Infrastructure
AMI installed in the transformer room of the SGS measures the amount of power supplied from the grid and checks the qualities of voltage, current, and frequency. Through the measures, the SGS can optimize the power supply. A general electricity meter monitors power quality every 15 min, whereas the AMI exports the data in real-time. The exported data are used to calculate the real-time electricity fee and analyze the operation status through the OS. By utilizing the data, the OS can operate the whole system flexibly. This AMI is connected in a series connection to current and in a parallel connection to voltage. Figure 5 shows a picture and the connection of the AMI, and Table 8 provides the detailed specifications of the AMI.
3.2.2. Electric Vehicle Chargers
Outside of the office building, there were a few gasoline vehicles for outside work. Some of them were changed to electric vehicles, and six EV chargers were installed. Four of the chargers are a slow-charging type, and the others are a fast-charging type. The slow-charging type has an AC-type connector and charges the EV at 7–8 kW through a single phase of 220 VAC, and it takes about 5 to 6 h to reach a full charge. The fast-charging type has three kinds of socket: CHAdeMO, Combo, and 3-phase AC type. CHAdeMO and Combo supply power in DC. The fast-charging type chargers supply power at 50 kW by 380–450 VDC or 380 VAC. In fact, the EV chargers are considered as loads, while the EVs contribute to reduce the running cost of vehicles compared to gasoline vehicles, as described in Section 5. Through this section, it is proved that the EVs are more economical than gasoline vehicles. The EVs also have potential, in that they can be bridges to implement vehicle-to-grid (V2G) technology [23].
3.2.3. Building Automation System
For building automation systems, current transformers (CTs) were installed in each distribution board to measure the power quality and the consumed energy by time and by device. These CTs are solid-ring and split-core types, and they communicate with a multi-channel power meter by Modbus. Also, smart outlets and light switches were newly installed to reduce power peak and consumption by turning the devices on and off remotely or automatically. This reduction is directly reflected in a reduction in the amount of power that needs to be generated by the fossil fuel generators.
The outlets can cut off standby power. Their rated allowable current is 16 A, and their overload current is 20 A. For the smart lighting, gateways were installed to transmit control signals to the lighting from the OS.
The other controllable system of the BAS is the HVAC. The OS adjusts the air quality by controlling the frequency of the VFDs to reduce power consumption.
4. Performance Evaluation
To evaluate the performance of the Smart Grid Station, the authors analyzed the reduction of peak and consumption, as well as economic feasibility by comparison with the early targets. We acquired the real data of building demand, peak, and DERs measured in 2014 and 2015 from KEPCO.
The output data and the performance analysis were based on the real operation of the Smart Grid Station, following the algorithm shown in Figure 6. The algorithm was developed by KEPCO. Following the algorithm, grid power always supplies power to loads, and also optionally charges the battery at off-peak load times such as night time or on weekends. PV can generate when the sun shines, and WT can generate when the wind speed is over 3 m/s. If the generation of the PV and the WT exceeds the power demand, the extra power goes to charge the battery at off-peak load time. When the sources charge the battery, the power goes through PCS. At the peak load time or mid-load time, the grid power, renewable energy sources, and the battery (Pdischarge) supply to loads to reduce the peak of the building. The blue line in Figure 6 shows the communication connection—all data gather into the OS. After gathering the generation, supply, and demand data from each device, the OS gives orders to the PCS.
In the SGS, peak power and consumption are reduced due to the DER. This makes it difficult to directly compare the decreased value with the unreduced value that could have been measured if not for the reduction. For this reason, the authors tried to compare the reduced peak and consumption with the values from 2014. However, new equipment and appliances were installed for the supervisory control and data acquisition (SCADA) room and the temporary office of Namyangju city in the Guri branch office, and we considered these changes in increment. Table 9 shows the details of increment in the building, and the authors assumed the usage time of the devices as in Table 10.
As the equipment for the SCADA room is ICT equipment, it is always used, even on weekends. Because the air conditioning system is an ice storage system, it does not contribute to a rise in the peak. Printers and cooling fans were considered to be unused during peak time to save energy.
4.1. Peak Shaving
For a commercial building, once a peak power is measured, the peak is adopted for the electricity fee for the year. The maximum peak occurred in the summer. Thus, the authors compared the peak that occurred in August and September of 2014 with the peak in same months of 2015 as Table 11.
The peak shaving ratio (PSR) is the ratio between the maximum peak in 2015 and the maximum peak in 2014.
In (1), 42.01 kW is the sum of rated power of all equipment except cooling fans, printers, and the ice storage AC system in Table 9. The value of added equipment capacity defined in (1) should be subtracted from max peak in 2015. Because the real contribution of the equipment to peak was unknown, the authors assumed the contribution by multiplying the rated capacity of devices by the power factor 0.9. Thus, the result of (1) is an estimate of the rated capacity multiplied by the power factor (0.9). A positive PSR value represents an increase of peak, whereas a negative value is a reduction. In (1) and (2), the result of the PSR was −5.40%, meaning that the peak was reduced by 5.40%.
4.2. Consumption Reduction
The second effect of the SGS is the reduction of power consumption. The data used to calculate peak reduction in Section 4.1 was also used in this section.
The consumption was separated into three time periods: off-peak load, mid-load, and peak load, as shown in Table 12. The added power consumption should be subtracted from the total consumption in 2015. However, because the contribution of the added devices to power consumption was unidentified, the power factor 0.9 was multiplied to assume the contribution in the same way as in (1). The consumption reduction ratio (CRR) is calculated in (5). A positive value of CRR represents an increase of power consumption, whereas a negative value means a reduction. In (4) and (5), the result of CRR was approximately −11.26%, which means that power consumption was reduced.
4.3. Saved Electricity Fee
There are two kinds of electric rates: demand charge and energy charge. Demand charge is for the measured peak, and energy charge is different in each season. Time periods are divided into summer, spring/fall, and winter. Exact time periods are shown in Table 13.
Electric rate refers to each type of customer. The General Service rate is classified in General Service (A) I, General Service (A) II, and General Service (B) is for commercial building customers. These rates are subdivided into High-Voltage A for 3.3–66 kV and High-Voltage B ranged over 154 kV. Besides, customers can choose option I, option II, or option III depending on the customers’ electricity use time for a month. The High-Voltage A option II of General Service (B) is for the customers who use electricity for 200–500 h per month, and whose contract demand of 300 kW or more. The details are shown in Table 14. In the table, the authors considered ₩1000 KRW as $1 USD for a convenience.
The total power consumption and electricity fees in 2014 and 2015 are shown in Table 15. To calculate the saved fee ratio (SFR), the added fees were also considered. These fees are in Table 16 and Table 17. By (7), the sum of added fees was $4127.892, and the SFR was calculated as −10.15%. This negative value means that the electricity fee was reduced by 10.15%, while a positive value indicates an increase.
Although there was no early target for fee reduction, the analysis of electricity fees is enough to prove the effects of the Smart Grid Station.
5. Economic Analysis of Smart Grid Station
In Section 5, we studied the contribution with regard to the economic aspects of the contributions of by PV generation and EV, and the energy time shifting by the ESS. The monthly measurement period was from the first day of each month to the last day. The used data was measured by the OS.
5.1. Saved Electricity Fees by PV Generation
During August and September of 2015, PV generation was 2961.5 kWh in August and 2326.1 kWh in September. The total saved fee is the sum of saved demand charge (SDC) and saved energy charge (SEC) contributed by the PV system.
It is difficult to know when the PV system generated power and how much the system generated. For this reason, the authors assumed the PV supplied power to loads at peak-load time and mid-load time in ratio of 8 to 2. Using this, the SDC and the SEC in August were found as follows:
The SDC values from September were the same as those from August. Likewise, the SEC values from September are in (14). In conclusion, the total saved fees were $1256.534.
5.2. Running Cost Reduction by EV
There was one electric vehicle in 2015, and the running data is in Table 18. In August and September, the EV ran for 470 km and 345 km, respectively. We assumed the fuel efficiency of a gasoline-powered car is 10 km/L. Referring to the data, we compared the running cost (RC) of the EV with that of a gasoline-powered vehicle.
By substituting figures, the results were as follows:
According to (17) and (18), $61.787 were saved, which means about 84.3% of the running cost was saved by the EV in August. Equations (19) and (20) also show that $49.478—about 90.2% of the cost—was saved in September. Although the actual amount saved was small, this shows that the EV was much more effective than a gasoline-powered vehicle.
5.3. Saved Fee by ESS Scheduling
A customer charges the battery of the ESS at night, when the price of electricity is low, and discharges the power at the peak load time or mid-load time when the price is high. However, the power from the PV system does not charge the battery but supplies power to the building load directly in the summer to maximize the efficiency. In August, 758.9 kWh was charged to the battery, and the same amount was discharged. In September, 541.1 kWh was charged and discharged. We also adapted the same assumption that the ratio of 8 to 2 stated in Section 5.1. Equation (21) is a formula to calculate the fee reduction (FR). Time of use (TOU) applied in this equation is an electricity fee policy that varies with seasons and times, as shown in Table 14.
By substituting figures, the results were as follows:
As the calculations show, $116.456 was saved for two months. By load shifting, the cost of electricity was greatly reduced.
5.4. Economic Feasibility on Investment Cost
The economic benefits in 2015 are estimated in Table 19. The total construction cost was $174,542 which consisted of the purchasing, installation, and operation costs of all systems: PV, ESS, OS, BAS, AMI, smart outlets, smart lights, and smart distribution boards.
The economic feasibility can be evaluated by calculating the return on investment (ROI). The net benefit in 2015 was $6376, and we assumed total net return based on the net benefit in 2015 as life expectancy of the installed devices was expected as 20 years. By (24), the ROI was calculated as approximately 73%. This value may seem that its benefit is low, but additional profits were not considered such as a CO2 reduction, effect by BAS, a tax incentive, the renewable energy certificate, the avoided costs of the generation facilities and the transmission and distribution facilities, because there were constraints on the request for the indices to KEPCO. Thus, we simply appraised the benefits of the system. When the SGS in Guri branch office which was the first demonstration was constructed, the unit cost of the PV system was $2550/kW, that of the PCS was $350/kW, and that of the battery was $600/kWh. However, according to the National Renewable Energy Laboratory (NREL) [25], the unit cost of a commercial PV system was $1620/kW ($1.62 per watt) in 2017. Also, Bloomberg New Energy Finance in [26] described the unit cost of a Li-ion battery as $273/kWh in 2016. As a result, we expect that the SGS solution is much more economical than when the first demonstration was implemented. Based on the effects, the KEPCO had established 121 Smart Grid Stations as of 2016.
6. Discussion
In this paper, the authors studied the first demonstration of a Smart Grid Station in the Guri branch office of KEPCO to prove its effectiveness. The authors verified the performance and economic feasibility of the SGS to propose a future strategy. The performance was evaluated with regard to three aspects: peak shaving, reduction of power consumption, and electricity fee savings. The economic efficiency was feasible in terms of electricity fee and running cost of an EV. Measured values in 2015 were revised for objective comparisons with values in 2014 before the SGS was built.
The early main targets were 5% reduction of peak, 9.6% reduction of consumption, and savings in electricity fees. To evaluate the performance objectively, we compared the factors in 2015 with the values in 2014, while considering the increased loads in 2015. As described in Section 4, the performance for peak shaving was calculated as 5.40%. This means that the 5% of peak shaving as one of early targets was accomplished. Next, the power consumption was reduced by 11.26%. The savings in electricity fees did not have a specific target, but they were reduced by 10.15%. These benefits to early targets are arranged in Table 20.
An economic analysis was conducted in Section 5. We considered the saved electricity fees by the PV generation, the reduced running cost by the EV, and the saved fees by ESS scheduling. The saved electricity fees by PV were $1256.534, which is the sum of saved energy charge and demand charge for two months. The reduced running cost by the use of an EV was calculated by comparing an EV to a gasoline vehicle. The running cost for the EV was cheaper than the cost of the gasoline vehicle by about 90.2%. Additionally, the ESS contributed to savings in the electricity fees of $116.456 for two months by load shifting. This means that the greater the capacity of ESS, the greater the savings. Based on the savings by PV and ESS, we calculated the ROI as approximately 73% which may seem low. However, we considered only few benefits because of the constraints. Moreover, due to the gradually decreasing unit price of each system annually, the ROI may be higher at present.
7. Conclusions
According to our analysis, the early targets were accomplished, and the effectiveness of the SGS was proven. Considering the proved effectiveness, the KEPCO has already installed SGSs in 121 of its branch offices, and the possibility of applying the technology to other buildings was also proved. We also suggest the commercialization of the SGS. By expanding, the SGS will contribute to encouraging the industry and to build a smart city, which is a city-sized energy solution. This could come from supporting price policies for devices, and private businesses will participate in the industries actively. To support the expansion of the SG, the convenience, safety, and efficiency of the SGS should be also improved for customers. Also, improvement of the OS would allow the system to integrate and control more and various devices and technologies. As a next step, the authors will study the Smart Town, which is a town-sized energy solution composed of various kinds of buildings founded in the KEPCO Academy in 2016.
Author Contributions
J.W. designed and wrote the paper. W.H. supported and helped to collect the data. Y.Y. and G.J. conducted the review. G.J. contributed to the modification. All the authors have read and approved the final manuscript.
Funding
This research received no external funding.
Acknowledgments
This work was supported by Korea Electric Power Corporation (R17XA05-4) and under the framework of international cooperation program managed by National Research Foundation of Korea (No. 2017K1A4A3013579).
Conflicts of Interest
The authors declare no conflict of interest.
Nomenclature
| GHG | Greenhouse Gas |
| SG | Smart Grid |
| PV | Photovoltaic |
| WT | Wind Turbine |
| AMI | Advanced Metering Infrastructure |
| BAS | Building Automation System |
| SGS | Smart Grid Station |
| RE | Renewable Energy |
| HVAC | Heating, Ventilation and Air Conditioning |
| VFD | Variable Frequency Drive |
| TOU | Time of Use |
| PSR | Peak Shaving Ratio |
| CRR | Consumption Reduction Ratio |
| SFR | Saved Fee Ratio |
| SDC | Saved Demand Charge |
| SEC | Saved Energy Charge |
| RC | Running Cost |
| FR | Fee Reduction |
References
- UNFCCC. Adoption of the Paris Agreement; UNFCCC: Paris, France, 2015. [Google Scholar]
- Enhanced Actions on Climate Change. Available online: http://www4.unfccc.int/Submissions/INDC/Submission%20Pages/submissions.aspx (accessed on 20 March 2018).
- Submission by Latvia and the European Commission on Behalf of the European Union and Its Member States. Available online: http://www4.unfccc.int/Submissions/INDC/Submission%20Pages/submissions.aspx (accessed on 20 March 2018).
- Submission of Japan’s Intended Nationally Determined Contribution. Available online: http://www4.unfccc.int/Submissions/INDC/Submission%20Pages/submissions.aspx (accessed on 20 March 2018).
- Submission by the Republic of Korea Intended Nationally Determined Contribution. Available online: http://www4.unfccc.int/Submissions/INDC/Submission%20Pages/submissions.aspx (accessed on 20 March 2018).
- Ock, J.; Issa, R.R.A.; Flood, I. Smart building energy management systems (BEMS) simulation conceptual framework. In Proceedings of the 2016 Winter Simulation Conference, Arlington, VA, USA, 11–14 December 2016; pp. 3237–3245. [Google Scholar]
- Ferro, G.; Laureri, F.; Minciardi, R.; Robba, M. Optimal Integration of Interconnected Buildings in a Smart Grid: A Bi-Level Approach. In Proceedings of the 2017 UKSim-AMSS 19th International Conference on Computer Modelling & Simulation (UKSim), Cambridge, UK, 5–7 April 2017; pp. 155–160. [Google Scholar]
- Borlase, S. Smart Grid Technologies. In Smart Grids Infrastructure, Technology, and Solutions; CRC Press: Boca Raton, FL, USA, 2015; pp. 79–125. [Google Scholar]
- Kolokosta, D. The role of smart grids in the building sector. Energy Build. 2016, 116, 703–708. [Google Scholar]
- Wurtz, F.; Delinchant, B. Smart buildings integrated in “smart grids”: A key challenge for the energy transition by using physical models and optimization with a “human-in-the-loop” approach. C. R. Phys. 2017, 18, 428–444. [Google Scholar] [CrossRef]
- Sidid, S.; Gaur, S. Smart Grid Building Automation Based on Internet of Things. In Proceedings of the International Conference on Innovations in Power and Advanced Computing Technologies, Vellore, India, 21–22 April 2017; pp. 1–4. [Google Scholar]
- Kim, S.; Lim, H. Reinforcement Learning Based Energy Management Algorithm for Smart Energy Buildings. Energies 2018, 11, 2010. [Google Scholar] [CrossRef]
- Barbato, A.; Bolchini, C.; Geronazzo, A.; Quintarelli, E.; Palamarciuc, A.; Pitì, A.; Rottondi, C.; Verticale, G. Energy Optimization and Management of Demand Response Interactions in a Smart Campus. Energies 2016, 9, 398. [Google Scholar] [CrossRef] [Green Version]
- Cabrera, D.F.M.; Zareipour, H. Data association mining for identifying lighting energy waste patterns in educational institutes. Energy Build. 2013, 62, 210–216. [Google Scholar] [CrossRef]
- Ragheb, M. Vertical Axis Wind Turbines; University of Illinois at Urbana-Champaign: Champaign, IL, USA, 2011. [Google Scholar]
- Soedibyo, J.F.; Ashari, M. Performance Comparison of Vertical Axis and Horizontal Axis Wind Turbines to Get Optimum Power Output. In Proceedings of the 2017 15th International Conference on Quality in Research: International Symposium on Electrical and Computer Engineering, Bali, Indonesia, 24–27 July 2017; pp. 429–433. [Google Scholar]
- Mohd, A.; Ortjohann, E.; Schmelter, A.; Hamsic, N.; Morton, D. Challenges in Integrating Distributed Energy Storage Systems into Future Smart Grid. In Proceedings of the IEEE ISIE, Cambridge, UK, 30 June–2 July 2008; pp. 1627–1632. [Google Scholar]
- Alegria, E.; Brown, T.; Minear, E.; Laseter, R.H. CERTS Migcrogrid Demonstration with Large-Scale Energy Storage and Renewable Generation. IEEE Trans. Smart Grid 2014, 5, 937–943. [Google Scholar] [CrossRef]
- Lee, K.; Lee, Y.; Seo, J.; Lee, S.; Seo, D. Case study on Smart Grid Station using IEC 61850. In Proceedings of the KIEE Summer Conference, Pyeongchang, Korea, 13–15 July 2016; pp. 24–25. [Google Scholar]
- ABB. 650 Series IEC 61850 Communication Protocol Manual; ABB: Vasteras, Sweden, 2011. [Google Scholar]
- Communication Networks and Systems for Power Utility Automation—Part 7-420. Available online: https://infostore.saiglobal.com/preview/is/en/2009/i.s.en61850-7-420-2009.pdf?sku=1138048 (accessed on 9 May 2018).
- Communication Networks and Systems for Power Utility Automation—90-7. Available online: https://webstore.iec.ch/preview/info_iec61850-90-7%7Bed1.0%7Den.pdf (accessed on 9 May 2018).
- Tan, K.M.; Ramachandaramurthy, V.K.; Yong, J.Y. Integration of electric vehicles in smart grid: A review on vehicle to grid technologies and optimization techniques. Renew. Sustain. Energy Rev. 2016, 53, 720–732. [Google Scholar] [CrossRef]
- KEPCO General Service Electricity Rate Table. Available online: http://cyber.kepco.co.kr/ckepco/front/jsp/CY/E/E/CYEEHP00202.jsp (accessed on 9 May 2018).
- Fu, R.; Feldman, D.; Margolis, R.; Woodhouse, M.; Ardani, K. U.S. Solar Photovoltaic System Cost Benchmark: Q1 2017; NREL: Golden, CO, USA, 2017. [Google Scholar]
- Curry, C. Lithium-ion Battery Costs and Market; Bloomberg New Energy Finance Report; BNEF: New York, NY, USA, 2017. [Google Scholar]
Figure 1.
The main components of the SGS. AMI: advanced metering infrastructure; BAS: building automation system; BAT: battery; ESS: energy storage system; EV/C: electric vehicle chargers; HVAC: heating, ventilation, and air conditioning; KEPCO: Korea Electric Power Corporation; PCS: power conversion system; PV: photovoltaic; TR: transformer; WT: wind turbine.

Figure 2.
PV and WT system at the Guri office.

Figure 3.
Battery (left) and PCS (right) on rooftop.

Figure 4.
Inner connection diagram of PCS.
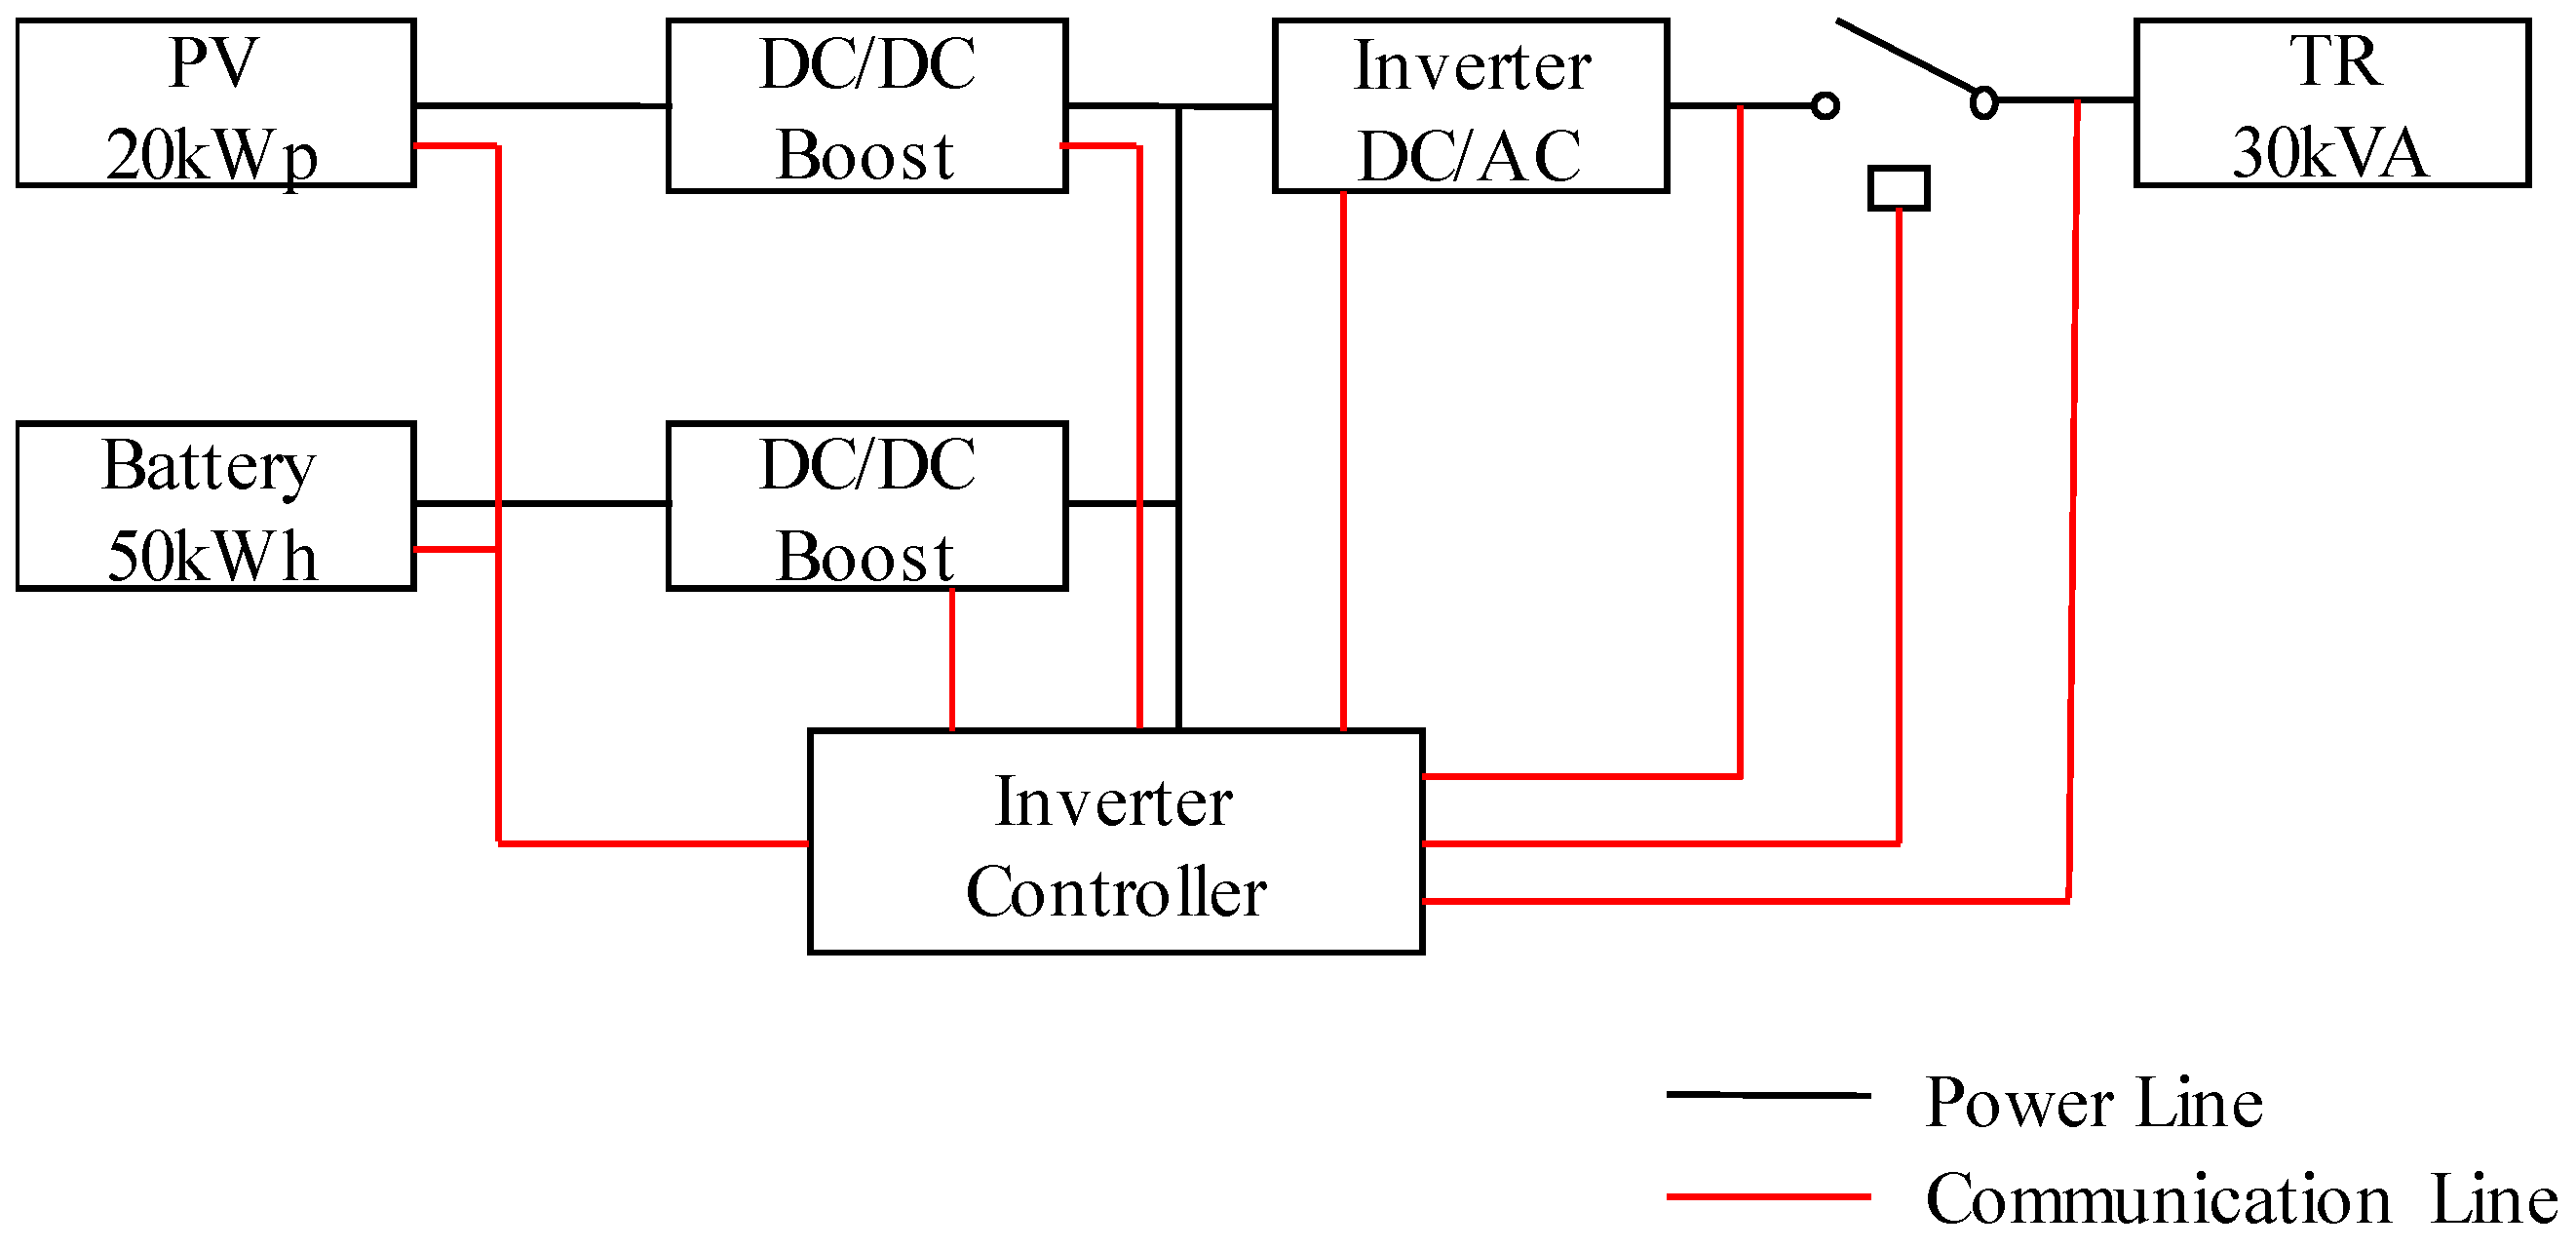
Figure 5.
Pictures of AMI and connection line.
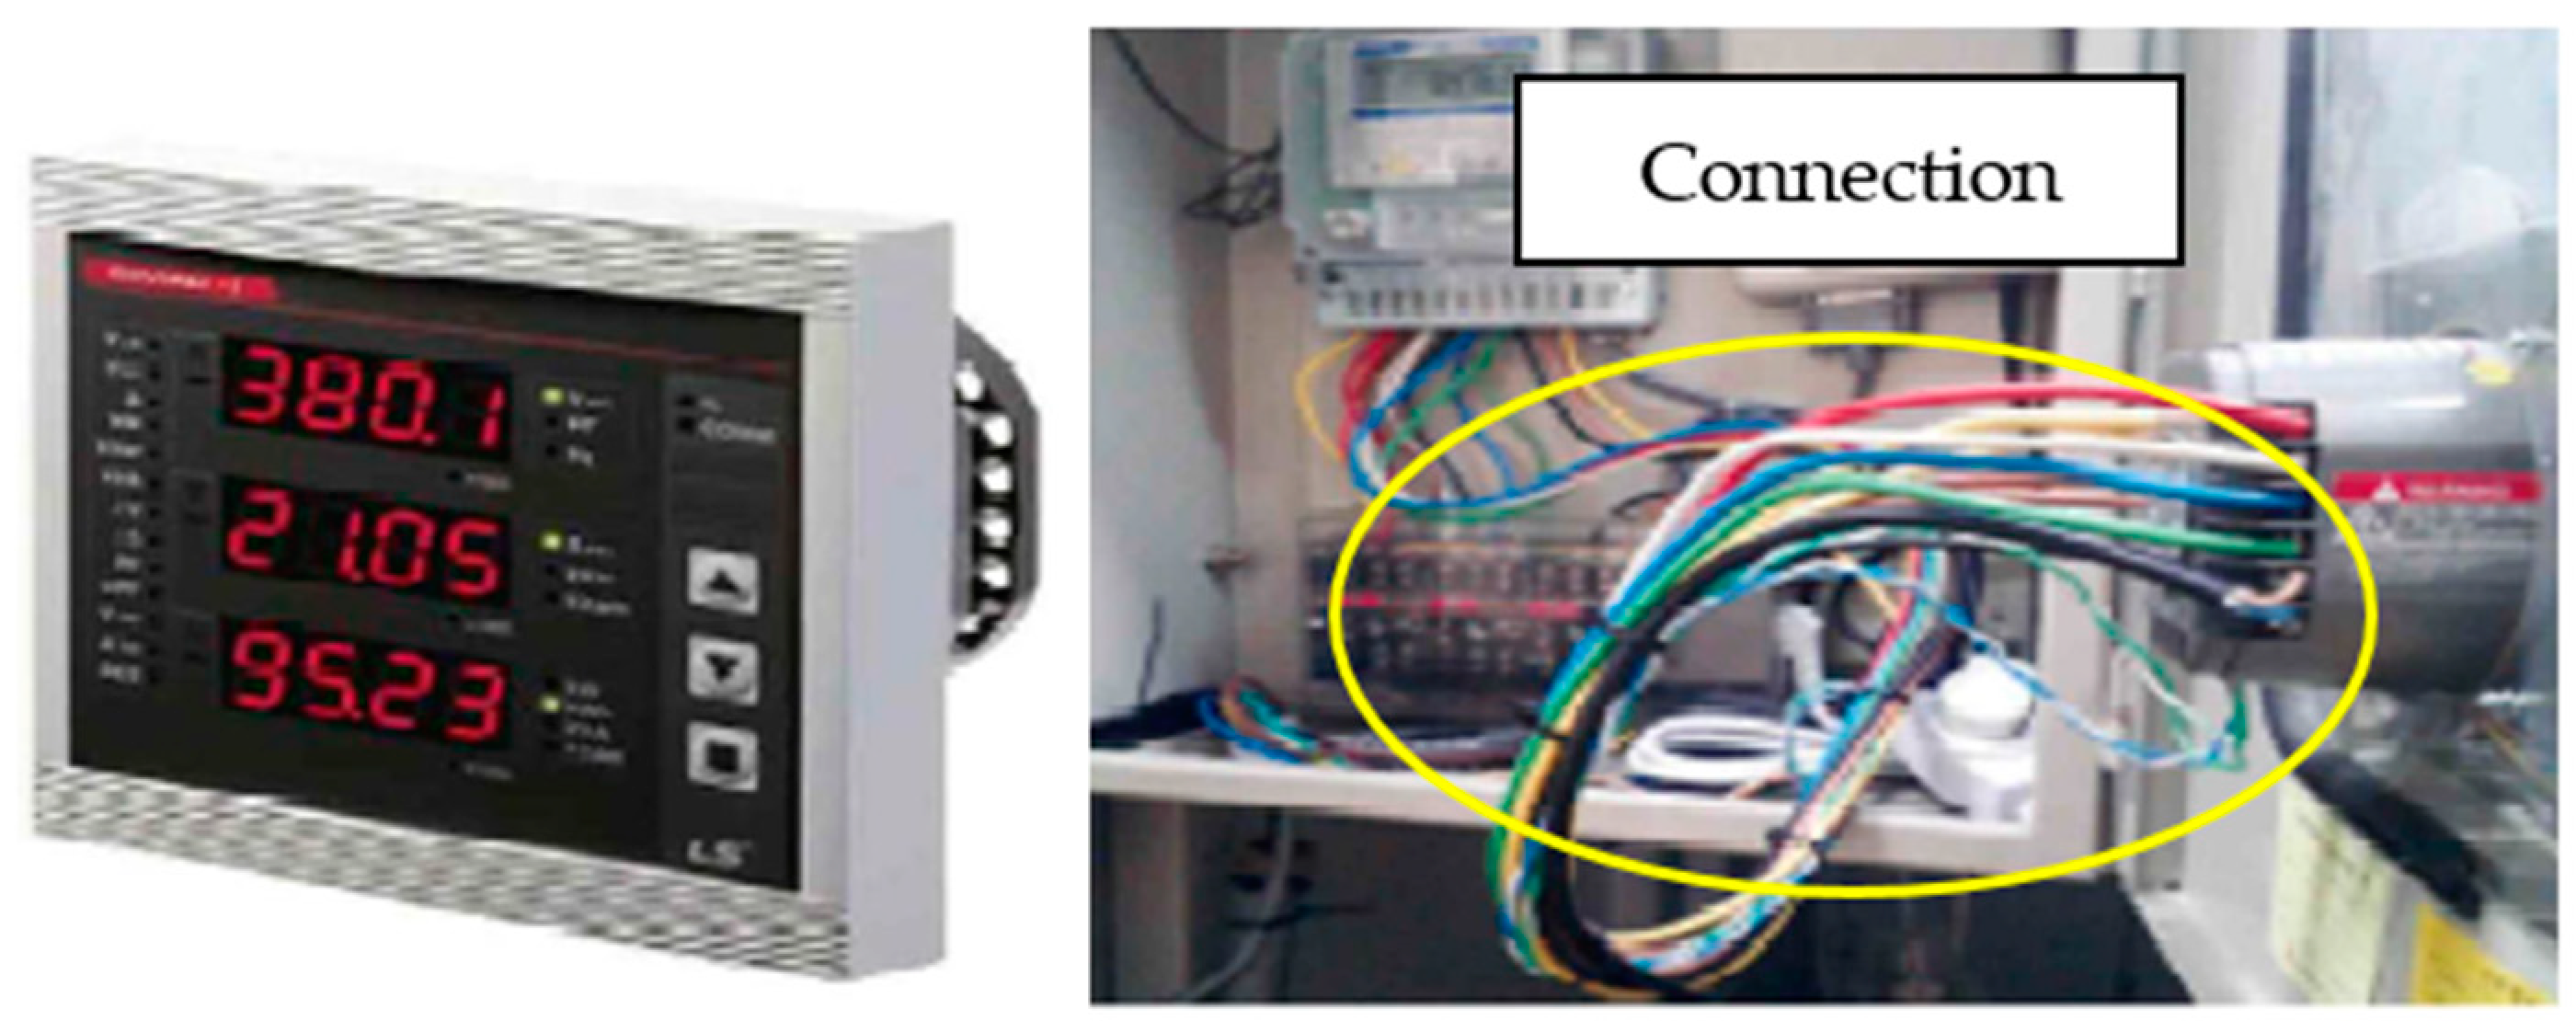
Figure 6.
Operation algorithm of the Smart Grid Station.


| Countries | Goals |
|---|---|
| China | To lower carbon dioxide emissions per unit of GDP by 60–65% from the 2005 level |
| EU | At least 40% domestic reduction in GHG emissions by 2030 compared to 1990 |
| Japan | At the level of GHG emission reductions of 26% by 2030 compared to 2013 |
| South Korea | GHG emission reduction by 37% from the business as usual (BAU) level by 2030 |
Table 2.
Details of the Smart Grid Station (SGS).
| Objective | Reducing Consumption and Saving on Electricity Fees by Optimizing Usage in a Building |
|---|---|
| Expected Effects |
|
| Features |
|
Table 3.
Specifications of the PV system.
| Device | Monocrystalline silicon |
| Max Power | 250 Wp (60 cells) |
| Max Voltage | 497.6 V (31.1 V × 16) |
| Efficiency | 15.7% |
| Capacity | 20 kWp (6 by 14, 84 modules, 4 dummies) |
| Connection | 16 series by 5 parallel |
Table 4.
Performance characteristics of the WT.
| Type | Vertical axis |
| Size | 1400 mm × 1800 mm |
| Rated power | 1.2 kW at 15 m/s |
| Cut-in wind speed | 3 m/s |
| Extreme wind speed | 52.5 m/s |
Table 5.
Specifications of the WT inverter.
| Input | Rated voltage | 430 VDC |
| Voltage range | 60–600 VDC | |
| Output | Max capacity | 3kW (single phase) |
| Rated voltage | 220 VAC (±10%) | |
| Rated frequency | 60 Hz (±0.5 Hz) | |
| Efficiency | 98% | |
| Power factor | 99% |
Table 6.
Specifications of the ESS.
| PCS | Capacity | 30 kW/30 kVA, 60 Hz |
| Control system | PWM converter (Pulse Width Modulation) | |
| Max efficiency | 90% | |
| Power factor | Over 95% | |
| Max input voltage | 800 VDC from Battery | |
| 450–850 VDC from PV | ||
| Output | 45 A | |
| BAT | Capacity | 50 kWh (25 kWh × 2) |
| Charge–discharge efficiency | 95% | |
| Cell voltage | 3.2 V, 20 Ah | |
| Rack voltage | 422.4 V (11 modules, 396 cells) | |
| Nominal voltage | 422.4 V (369.6–468.6 V) |
Table 7.
Operation modes of PCS.
| Status | Mode | Description |
|---|---|---|
| Charge | Full charge | Full Charge by PV + grid |
| Only PV Charge | Charge only by PV | |
| Discharge | Full discharge | Supply power to loads by PV + BAT |
| Fixed PCS output |
| |
| Fixed BAT output |
| |
| Only PV discharge | Supply power to loads only by PV | |
| Concurrent | Fixed BAT charge |
|
| Fixed PCS output |
|
Table 8.
Specifications of the AMI.
| Potential transformer | AC 10–452 V/110 V |
| Current transformer | 0.05–6 A (rated 5 A) |
| Measurement | Voltage, current, freq., etc. |
Table 9.
Newly installed equipment and appliances. SCADA: supervisory control and data acquisition.
| Installation Date | Items | Capacity (kW) | Hours Used | Consumption | ||||
|---|---|---|---|---|---|---|---|---|
| Per a Day of Weekday | Per a Day of Weekend | Aug (kWh) | Sept (kWh) | Total (kWh) | ||||
| SCADA | 2014 10.30 | Media rack | 0.72 | 24 | 24 | 10,460.6 | 10,123.2 | 20,583.8 |
| Audio rack | 0.5 | |||||||
| 6 DLP 1 Cube | 1.32 | |||||||
| 4 LED TVs | 0.52 | |||||||
| Humidifier | 11 | |||||||
| Temp. office | 2015 03.24 | Lights | 1.8 | 10 | - | 378 | 360 | 738 |
| 13 Computers (400 W) | 5.2 | 10 | - | 1092 | 1040 | 2132 | ||
| 13 Computers (300 W) | 3.9 | 10 | - | 819 | 780 | 1599 | ||
| 21 Monitors (170 W) | 3.7 | 10 | - | 777 | 740 | 1517 | ||
| Hot & cold dispenser | 0.85 | 24 | 24 | 632.4 | 612 | 1244.4 | ||
| Air handling unit | 12.5 | 10 | - | 2625 | 2500 | 5125 | ||
| 10 Cooling fans | 0.3 | 6 | - | 37.8 | 36 | 73.8 | ||
| 4 Printers (700 W) | 2.8 | 1 | - | 58.8 | 56 | 114.8 | ||
| Ice storage AC sys. | 15 | 10 | - | 3150 | 3000 | 6150 | ||
| Total consumption (kWh) | 20,030.6 | 19,247.2 | 39,277.8 | |||||
| The number of weekdays in each month | 21 days | 20 days | ||||||
| The number of weekends in each month | 10 days | 10 days | ||||||
1 Display Lighting Projector Cube.
Table 10.
Details of usage time.
| Usage Hours | Note | |||
|---|---|---|---|---|
| Off-Peak Load | Mid-Load | Peak Load | ||
| SCADA | 6 | 8 | 10 | All days |
| Office facilities 1 | 6 | 3.5 | 0.5 | 08:30–18:30 on Weekdays |
| Hot & cold dispenser | 6 | 8 | 10 | All days |
| Ice storage AC system | - | - | 10 | Weekdays |
| Printers | 1 | - | - | Weekdays |
| Cooling fans | 5 | 1 | - | Weekdays |
1 Lights, computers, monitors, and air handling unit.
Table 11.
Comparison of peaks.
| Day Peak (kW) | Evening Peak (kW) | Max Peak (kW) | |
|---|---|---|---|
| 2015.08 | 285.12 | 294.24 | 294.24 |
| 2015.09 | 255.84 | 213.12 | |
| 2014.08 | 271.08 | 259.56 | 271.08 |
| 2014.09 | 255.96 | 237.24 |
Table 12.
Monthly consumption.
| Consumption (kWh) | ||||
|---|---|---|---|---|
| Off-Peak Load | Mid-Load | Peak Load | Total | |
| 2015.08 | 24,299 | 20,703 | 19,128 | 123,807 |
| 2015.09 | 27,478 | 17,619 | 14,580 | |
| 2014.08 | 7844 | 21,322 | 18,891 | 99,686 |
| 2014.09 | 17,695 | 19,343 | 14,591 | |
Table 13.
Segmentation by season and time [21].
Table 13.
Segmentation by season and time [21].
| Load Time | Summer | Spring/Fall | Winter |
|---|---|---|---|
| Off-peak load time | 23:00–09:00 | 23:00–09:00 | |
| Mid-load Time | 09:00–10:00 12:00–13:00 17:00–23:00 | 09:00–10:00 12:00–17:00 20:00–22:00 | |
| Peak load Time | 10:00–12:00 13:00–17:00 | 10:00–12:00 17:00–20:00 22:00–23:00 | |
Table 14.
Electric rates table for High-Voltage A Option II of General Service (B) [24].
Table 14.
Electric rates table for High-Voltage A Option II of General Service (B) [24].
| Demand Charge | $8.32/kW | |||
|---|---|---|---|---|
| Energy charge ($/kWh) | Time Period | Off-Peak Load | Mid-Load | Peak Load |
| Summer (1 Jun–31 Aug) | $0.0561 | $0.109 | $0.1911 | |
| Spring/Fall (1 Mar–31 May/1 Sep–31 Oct) | $0.0561 | $0.0786 | $0.1093 | |
| Winter (1 Nov–28 Feb) | $0.0631 | $0.1092 | $0.1667 | |
Table 15.
Total electricity fees in 2014 and 2015.
| Date | Consumption (kWh) | Fee (USD) | Total (USD) |
|---|---|---|---|
| 2015.08 | 64,130 | $8659 | $15,924 |
| 2015.09 | 59,677 | $7265 | |
| 2014.08 | 48,057 | $6424 | $13,128 |
| 2014.09 | 51,629 | $6704 |
Table 16.
Demand charge for added loads in 2015.
| Month | Max Peak | Demand Charge | Charged Fee |
|---|---|---|---|
| Aug. | 37.8 kW | $8.32/kW | $314.496 |
| Sept. | 37.8 kW | $8.32/kW | $314.496 |
Table 17.
Energy charge for added loads in 2015.
| 2015 | Consumption (kWh) | Fee 1 (USD) | |
|---|---|---|---|
| Aug. | Off-peak Load | 7744 | $304.041 |
| Mid-load | 5481.4 | $387.755 | |
| Peak load | 6021.0 | $761.778 | |
| Total | 19,247.2 | $1453.574 | |
| Sept. | Off-peak Load | 8056.7 | $406.783 |
| Mid-load | 5695.8 | $558.758 | |
| Peak load | 6278.2 | $1079.785 | |
| Total | 20,030.7 | $2045.326 | |
1 Power factor of 0.9 was applied in the fee, and decimal point was rounded up.
Table 18.
Running data of EV in 2015.
| Month | Mileage | EV Charge Amount (kWh) | Price of 1 kWh ($/kWh) | Price of Gasoline 1 ($/L) |
|---|---|---|---|---|
| Aug | 470 km | 105.8 | $0.109 | $1.56 |
| Sept | 345 km | 68.4 | $0.0786 | $1.59 |
1 The price of gasoline is the average value of the month.
Table 19.
Savings report in 2015.
| Investment | Expectation | Measured Amount | Saved Fee (USD) | |
|---|---|---|---|---|
| PV generation | $51,000 USD | 25,200 kWh | 27,296 kWh | $6376 |
| ESS discharge | $10,500 USD (PCS) | 12,540 kWh | 8430 kWh | |
| $30,000 USD (BAT) |
Table 20.
Comparisons of early targets with performance.
| Peak | Consumption | Electricity Fee | |
|---|---|---|---|
| Early target | 5.0% | 9.6% | - |
| Performance | 5.40% | 11.26% | 10.15% |
© 2018 by the authors. Licensee MDPI, Basel, Switzerland. This article is an open access article distributed under the terms and conditions of the Creative Commons Attribution (CC BY) license (http://creativecommons.org/licenses/by/4.0/).
Share and Cite
MDPI and ACS Style
Whang, J.; Hwang, W.; Yoo, Y.; Jang, G. Introduction of Smart Grid Station Configuration and Application in Guri Branch Office of KEPCO. Sustainability 2018, 10, 3512. https://doi.org/10.3390/su10103512
AMA Style
Whang J, Hwang W, Yoo Y, Jang G. Introduction of Smart Grid Station Configuration and Application in Guri Branch Office of KEPCO. Sustainability. 2018; 10(10):3512. https://doi.org/10.3390/su10103512
Chicago/Turabian StyleWhang, Jaehong, Woohyun Hwang, Yeuntae Yoo, and Gilsoo Jang. 2018. "Introduction of Smart Grid Station Configuration and Application in Guri Branch Office of KEPCO" Sustainability 10, no. 10: 3512. https://doi.org/10.3390/su10103512
Note that from the first issue of 2016, this journal uses article numbers instead of page numbers. See further details here.