Macroprudential Policy, Credit Cycle, and Bank Risk-Taking

1
School of Finance, Renmin University of China, Beijing 100872, China
2
Donlinks School of Economics and Management, University of Science and Technology Beijing, Beijing 100083, China
*
Author to whom correspondence should be addressed.
Sustainability 2018, 10(10), 3620; https://doi.org/10.3390/su10103620
Submission received: 31 August 2018
/
Revised: 2 October 2018
/
Accepted: 4 October 2018
/
Published: 10 October 2018
(This article belongs to the Special Issue Application of Time Series Analyses in Business)
Abstract
:This paper constructs a theoretical model to analyze the effect of macroprudential policies (MPPs) on bank risk-taking. We collect a data set of 231 commercial banks in China to empirically test whether macroprudential tools, including countercyclical capital buffers, reserve requirements, and caps on loan-to-value, can affect bank risk-taking behaviors by using the dynamic unbalanced panel system generalized method of moment (SYS-GMM). The results provide further evidence on the important role of MPPs in maintaining financial stability, which helps mitigate financial system vulnerabilities. Bank risk-taking will be decreased with the strengthening of macroprudential supervision, which greatly benefits the resilience and the sustainability of bank sector. Moreover, the credit cycle has a magnifying role on MPPs’ effect on bank risk-taking. Reducing risks in bank loans requires a further slowing of credit growth, which is necessary to ensure sustainable growth in a bank system, or more ambitiously, to smooth financial booms and busts. The results survive robustness checks under alternative estimation methods and alternative proxies of bank risk-taking and MPPs.
1. Introduction
Macroprudential policies (MPPs) have been placed in an extremely important position by many countries after the global financial crisis of 2008, which was also the starting point for macroprudential supervision in China. An increasing number of macroprudential tools have been introduced to improve countercyclical adjustment and sustainable development in the financial system. The Twelfth Five-Year Plan for the Development and Reform of the Financial Industry puts the establishment and improvement of a MPP framework to the forefront. The report at 19th CPC National Congress proposes to improve the dual-pillar regulation framework of monetary policy and MPP formally. The importance of macroprudential supervision in China is increasingly prominent.
The macroprudential tools are originally aimed to address risks in the bank sector [1], and the IMF [2] suggests that a MPP should be extended to the nonbanking financial sector. We focus on the effect of MPPs on bank risk-taking, which is related to the sustainable development of the bank sector and financial system. MPPs can avoid negative externalities that may flow from the financial system to the real economy, including the risk of excessive loans entering a bank’s balance sheets during an economic boom and the risk of providing loans to enterprises with good investment opportunities during a depression. The Countercyclical Capital Buffer (CCB) helps smooth credit supply cycles and is recognized as the most efficient macroprudential tool in Spain [3]. The dynamic reserve requirement (RR) helps detect credit losses in bank loan portfolios in advance [4]. The caps on loan-to-value (LTV) can restrain house price growth and bank leverage [5,6]. China has implemented MPPs for years and the effectiveness of them is an important research topic for the academic community and policymakers. We attempt to construct a theoretical framework to explain the transmission mechanism of MPPs and provide related empirical evidence. Borio and Zhu [7] state that the transmission mechanism of monetary policy includes risk-taking channels. Most of the following related studies support that conclusion [8,9]. It is believed that changes in policy interest rates affect risk perception and risk tolerance, which are reflected in a risk portfolio. Based on the model proposed by Dell’Ariccia et al. [10], we focus on an extant work and the interaction between a MPP coordinated with monetary policy and bank risk-taking, and analyze the transmission mechanism of MPPs on bank risk-taking behaviors by adding CCB. CCB and RR affect the willingness of a bank’s lending behavior and LTV restricts borrowers’ access to new property loans [11], which are related to the balance sheets of commercial banks and thus affect bank risk-taking behaviors. We empirically analyze the effectiveness of three macroprudential tools, i.e., CCB, RR and LTV, including the individual and overall effects of these three tools in reducing bank risk-taking behaviors using the bank-specific data of 231 commercial banks in China. The IMF [2] proposes that policymakers should use macroprudential tools more actively to understand the signs of late-stage credit cycle dynamics. We therefore are interested in how the credit cycle affect the link between MPPs and bank risk-taking.
The contributions of this paper to the literature on the bank risk-taking channel of MPPs are threefold. First, we provide a further explanation on the bank risk-taking channel of MPPs by establishing a theoretical model, which bridges the gap between conceptual frameworks and empirical evidence on MPPs. Second, we offer some broader reflections on the characteristics of the transmission mechanism of MPPs on bank risk-taking behaviors. We conduct an empirical analysis with a larger commercial bank sample on the effectiveness of MPPs implemented in the past two decades in China. We conclude that MPPs are important elements and policy tools aimed at systemic risk mitigation. We also find that RR is the most efficient macroprudential tool, followed by LTV and CCB. We overcome the challenge of evaluating the effects of MPPs when more than one tool is activated, as the combined effects of three tools are tackled in our estimation. These results help policymakers design coordinated MPPs to stabilize the bank sector and promote the sustainable development of commercial banks. Third, we highlight the role of a credit boom in MPP implementation. Considering the credit cycle in the effect of MPPs on bank risk-taking, we find CCBs are more effective in credit booms than in credit crunch episodes. Thus, commercial banks should accrue more CCBs in credit boom periods than in other periods. Our findings therefore provide certain theoretical and empirical contributions to sustainable development and the stability of the banking sector, thus benefiting the effectiveness and sustainability of MPPs.
2. Literature Review
Our research relates to two strands of literature. One for the economics of banking, particularly bank risk-taking, and the other for MPPs, especially the transmission mechanism and the effectiveness of MPPs.
There was a burst of literature on bank risk-taking during the post-crisis period as the riskiness of banks from all country groups increased after the global financial crisis of 2008. Regulators attempted to control bank risk-taking behaviors [12]. Many studies focus on ways to reduce bank risk-taking and guarantee financial stability. Strong supervisory power and discipline can constrain excessive bank risk-taking [13]. Trade openness and common equity capital help commercial banks smooth out income volatility and decrease overall bank risk [14,15]. Bank market power and competitions are associated with the excessive risk appetite of commercial banks, which accounts for fragility [15,16]. When market power is transformed to better business models, it will contribute to less overall banking risk and better bank performance [17]. There are certain papers that investigate the differences in risk-taking behaviors between publicly traded and privately owned banks, and some suggest public banks are likely to exhibit less risk-taking [18].
To discover a solution to the problem of bank-originated financial instability, many studies research MPPs. The MPP is proposed to mitigate systemic risk, which helps strengthen the resilience of the financial system during economic downturns, reduce build-up of vulnerabilities, and promote the sustainable growth of financial intermediation and financial inclusion [19]. The central bank is usually in charge with macroprudential supervision [20]. By adapting the MPP to monetary policy objectives, one can achieve the goal of effectively slowing down procyclicality, lowering both the likelihood and the severity of a crisis originated by the accumulation of bank risk [21,22]. The central bank thus can rely on macroprudential supervision and regulation to monitor bank risks [23]. The MPP is now seen as a possible way to rebalance the misalignment of targets and instruments [24]. Macroprudential policy action, including CCB, real estate instruments, systemic risk buffer, and other instruments, addressed cyclical risks in the EU in 2017 [20]. Besides, the MPP can also be used as a policy option to deal with the global financial cycle and the “three dilemmas” of international macroeconomics [25]. Several papers examine the effectiveness of MMPs. Lim et al. [26] validate the effectiveness of macroprudential tools in reducing systemic risk using survey data from 49 countries. Olszak et al. [27] identify the effectiveness of MPP instruments in reducing the procyclicality of loan-loss provision (LLP) using the information of banks from over 65 countries by adopting the two-step GMM method. Macroprudential tools in 19 OECD countries are also assessed to be effective [28]. Funke et al. [29] demonstrate that the MPP is a useful addition to the monetary policy using a DSGE model tailored to New Zealand because LTV reduces house prices without derailing monetary policy. Jung et al. [30] and Alpanda et al. [31] provide similar conclusions for MPPs in Korea and Canada. However, supervisory monitoring is important for MPP goals, and the effectiveness of macroprudential regulations is challengeable for the revolving door of risk [32].
Several recent papers on MPPs and bank risk-taking mainly focus on the bank risk-taking channel of the MPP. This paper summarizes a synoptical table containing the main MPPs, previous literature, countries analyzed, and key evidence, which is included in Table A1 (see Appendix A). There are certain studies that provide empirical evidence using cross-country data. Claessens et al. [5] researched MPPs’ effects on 2800 banks in 48 countries from 2000 to 2010. They find that caps on debt-to-income (DTI) and LTV, RR, and dynamic LLP are effective in reducing the bank leverage. Active MPPs help Central and Eastern European countries to preserve the stability of their banking sectors. However, bank profitability and nonperforming loans increase with tighter macroprudential rules [33,34]. There is also recent evidence from individual countries. Guidara et al. [35] find weak evidence that CCBs affect Canadian bank risk-taking, but the appropriateness of both a micro- and macro-prudential “through-the-cycle” approach to capital adequacy explains why Canada performed better during the global financial crisis of 2008. CCB and RR are capable of procyclical mitigation in Indonesia, LTV can reduce credit growth although it cannot mitigate procyclicality [11,36]. However, LTV has significant and persistent effects on household debt and real house prices in Korea [30]. Ma and Yao [37] investigate the effectiveness of MPPs using the data of 52 Chinese commercial banks and the results show that CCBs help reduce bank risk. Nevertheless, their conclusion is not convincing enough because they ignore the effect of other macroprudential tools such as RR and LTV. In this paper, we attempt to find out whether MPPs reduce bank risk-taking behaviors using a Chinese data set.
Different macroprudential tools have different effects on bank risk-taking [38], which can be classified into two groups [1]. The first group includes LTV and DTI, which reduce risk-taking by affecting borrowers. The second group covers the tools of RR, CCB, leverage restrictions (LEV) and LLP, which reduces risk-taking by affecting banks. The CCB can provide banks with greater flexibility to cope with an economic recession [33], thus helping banks to resist shocks and protect against system vulnerabilities [39,40]. Better-capitalized and more liquid banks are less risky [41]. The LLP helps smooth the credit cycle [3]. The RR can earlier detect and cover credit losses in bank loan portfolios, creating a buffer in expansion that will alleviate procyclicality and promote the sustainability of the banking system during a recession [4]. Balla and Mckenna [42] simulate the dynamic reserve system in the U.S. and the results show that the financial system vulnerability evinced by the global financial crisis of 2008 can be greatly mitigated. The LTV and DTI help to control house price growth, credit growth, and bank leverage [5,6]. The LTV is the most effective and least costly tool in Canadian, followed by bank capital regulations [31]. In our study, we concentrate on whether the effect of macroprudential tools varies from each other.
The effects of MPPs on bank risk-taking are sensitive to the credit cycle. Bank risk-taking behaviors tend to increase in economic downturns and decrease in economic upturns. Most macroprudential actions are stronger in credit booms [43]. Credit is a leading indicator of the financial crisis and is the best variable to signal the implementation of MPPs [37]. Monetary expansion will increase the leverage and risk of banks [44]. As the economy grows, cash flows, incomes and asset prices rise, risk appetite increases, and external funding constraints weaken, which facilitates bank risk-taking behavior [39]. Dell’ Arriccia et al. [10] argue that the combination of market competition and credit boom might lead banks to increase profits by easing lending criteria. Dell’ Ariccia et al. [9] use U.S. data to verify the existence of a risk-taking channel for monetary policy and find that a low interest rate environment significantly increases bank risk-taking behavior. Cerutti et al. [1] expanded the IMF’s survey to study MPPs in 119 countries during the period of 2000–2013 and found that MPPs did not perform well during the recession. Vandenbussche et al. [44] investigated the effectiveness of MPPs in Southeastern Europe, and concluded that MPPs help contain credit growth during the boom years, but had no discernible effect during the bust. In our study, we consider whether the negative relationship between MPPs and bank risk-taking is affected by the credit cycle.
According to the above findings, the issue remains open to further theoretical and empirical investigation. Previous studies stress the empirical significance of MPPs’ effect on bank risk-taking, which is seldom explained by theoretical models. The empirical evidence on Chinese commercial banks is limited and the majority of them are drawn from a listed banks sample, which cannot reflect the whole banking sector. Many papers study the role of individual macroprudential tools in bank risk-taking behaviors by setting one macroprudential tool as the explanatory variable in the regression model, which ignores the combined effects of multiple MPPs implemented simultaneously in most cases. We consider the combined effects in this paper and also estimate the cross-effect of the credit cycle and CCB to evaluate whether the central bank implements MPPs properly.
3. Theoretical Analysis
3.1. Assumption and Model
Dell’Ariccia et al. [10] establish a theoretical model to analyze the impact of monetary policy on bank risk-taking. Jiang and Chen [45] modify the second hypothesis and propose that monetary policy affects the bank’s liability cost through interest and deposit rates. Based on Jiang and Chen [45], we add the CCB in the model to research the effect of MPPs on bank risk-taking.
Suppose that the bank faces a loan demand function with a negative slope, where is the loan interest rate. The bank supervises the loan portfolio with the degree of effort q to increase the probability of repayment. A greater q indicates that a higher probability that the bank will recover the loan, and a smaller bank risk-taking. The bank needs to pay for the supervision behavior, where the supervision cost is assumed as per unit lent. Bank assets are financed with bank capital (or equity) and deposit. Thus, we assume that the portion of capital is and the deposit is . Considering China has an invisible deposit insurance system before implementing the deposit insurance, the deposit rate equals the policy rate, = , which means the depositor does not require risk compensation. Assuming the portion of capital is , the loan driven by the unit capital is, the deposit is , where is the reserve requirement, and the loan is , the deposit reserve is . Therefore, the cost of unit capital is , the yield requirement , is an equity premium as a spread over the risk-free rate.
When we do not consider MPPs, the bank’s expected profit is as follows:
When we consider MPPs, the bank’s expected profit is as follows:
where is the CCB.
3.2. Solution and Analysis
The decision of the bank is divided into two stages. In stage 1, the bank chooses the interest rate charge on loans, . In stage 2, the bank chooses how to monitor their portfolio, .
We firstly solute (see Appendix B), and obtain:
Then we solute (see Appendix B), and obtain:
According to the above results, we consider the effect of the policy rate on the bank risk-taking.
The first term, , reflects the pass-through of the policy rate on the loan rate and increases monitoring incentives, which implies that the policy rate influences bank risk-taking by influencing the loan rate. Moreover, as and , we have . So, has a positive effect on , which means an increase of will increase the monitoring incentives and decrease bank risk-taking. The second term, , is the risk-shifting effect, decreasing monitoring incentives. , so an increase of will decrease monitoring incentives and increase bank risk-taking.
Similarly, we consider the effect of RR, represented by , on bank risk-taking.
The first term, , implies that the RR influence bank risk-taking by influencing the loan rate. The second term, , implies that has a negative effect on , which means an increase of RR will decrease monitoring incentives and increase bank risk-taking.
Specially, we consider the effect of CCB, represented by , on bank risk-taking.
The first term, , implies that the CCB influence bank risk-taking by influencing the loan rate. The second term, , implies that has a positive effect on , which means an increase of the CCB will increase monitoring incentives and decrease bank risk-taking.
From above theoretical analysis, the policy rate, RR and CCB have effects on bank risk-taking, but the mechanism still needs to be verified by empirical evidence. Besides, there are some other macroprudential tools, such as dynamic LLP and LTV, that should be considered.
4. Empirical Analysis
4.1. Measurements of Bank Risk-Taking, Macroprudential Policy, and Credit Cycle
4.1.1. Bank Risk-Taking
We use non-performing loan ratio (NPL) as a proxy for the bank risk-taking. At present, the main business of Chinese commercial banks is credit. The NPL is an important indicator for evaluating the risk of bank credit assets, reflecting the potential risk exposure of a bank asset and its income due to the deterioration of loan quality. The NPL is directly related to bank credit risk. A higher NPL means that the bank risk-taking is greater. During the robustness checks, we use the logarithm of Z-score as the proxy for bank risk-taking [46], which is calculated by , where the ROA and EA are the 3-year moving average of a bank’s return on assets and equity to assets, respectively, and the SDROA is the standard variation of ROA. Z-score is inversely related with bank risk. A higher value of Z-score denotes smaller bank risk-taking.
4.1.2. Macroprudential Policy
RR, LLP, CCB, LEV, and LTV are used as explanatory variables to analyze the effectiveness of macroprudential supervision tools and policy coordination in China [47]. We select RR, LTV, and CCB, as the proxy of the MPP according to Altunbas et al. [38], who suggest that these three macroprudential tools are the most used. The RR is resourced from the website of the People’s Bank of China. The LTV is calculated by (1-mortgage down payment ratio) according to Fang [48], where mortgage down payment ratio is the second Beijing ordinary self-housing down payment ratio. The CCB is measured by constructing the indicator of regulatory capital pressure (RCP). Mora and Logan [49] demonstrate that the effect of RCP (the difference between actual capital and implied trigger capital) on bank risk-taking is transmitted through the loan channel. When capital is short, the bank will increase capital by investing loans with lower risk. The RCP is calculated as the capital adequacy ratio of the commercial bank minus the minimum regulatory capital and the standard deviation of the capital adequacy ratio. According to Guidelines for Capital Management of Commercial Banks (Trial) issued by the China Banking and Insurance Regulatory Commission in 2012, the capital adequacy ratio (CAR) for commercial banks is 10.5% and 11.5% for systemically important banks. Thus, the RCP for bank i in period t can be calculated as follows:
where is the CAR of bank i in period t, and is the standard variation of CAR for bank i. We set a dummy variable, CP, and we have , if .
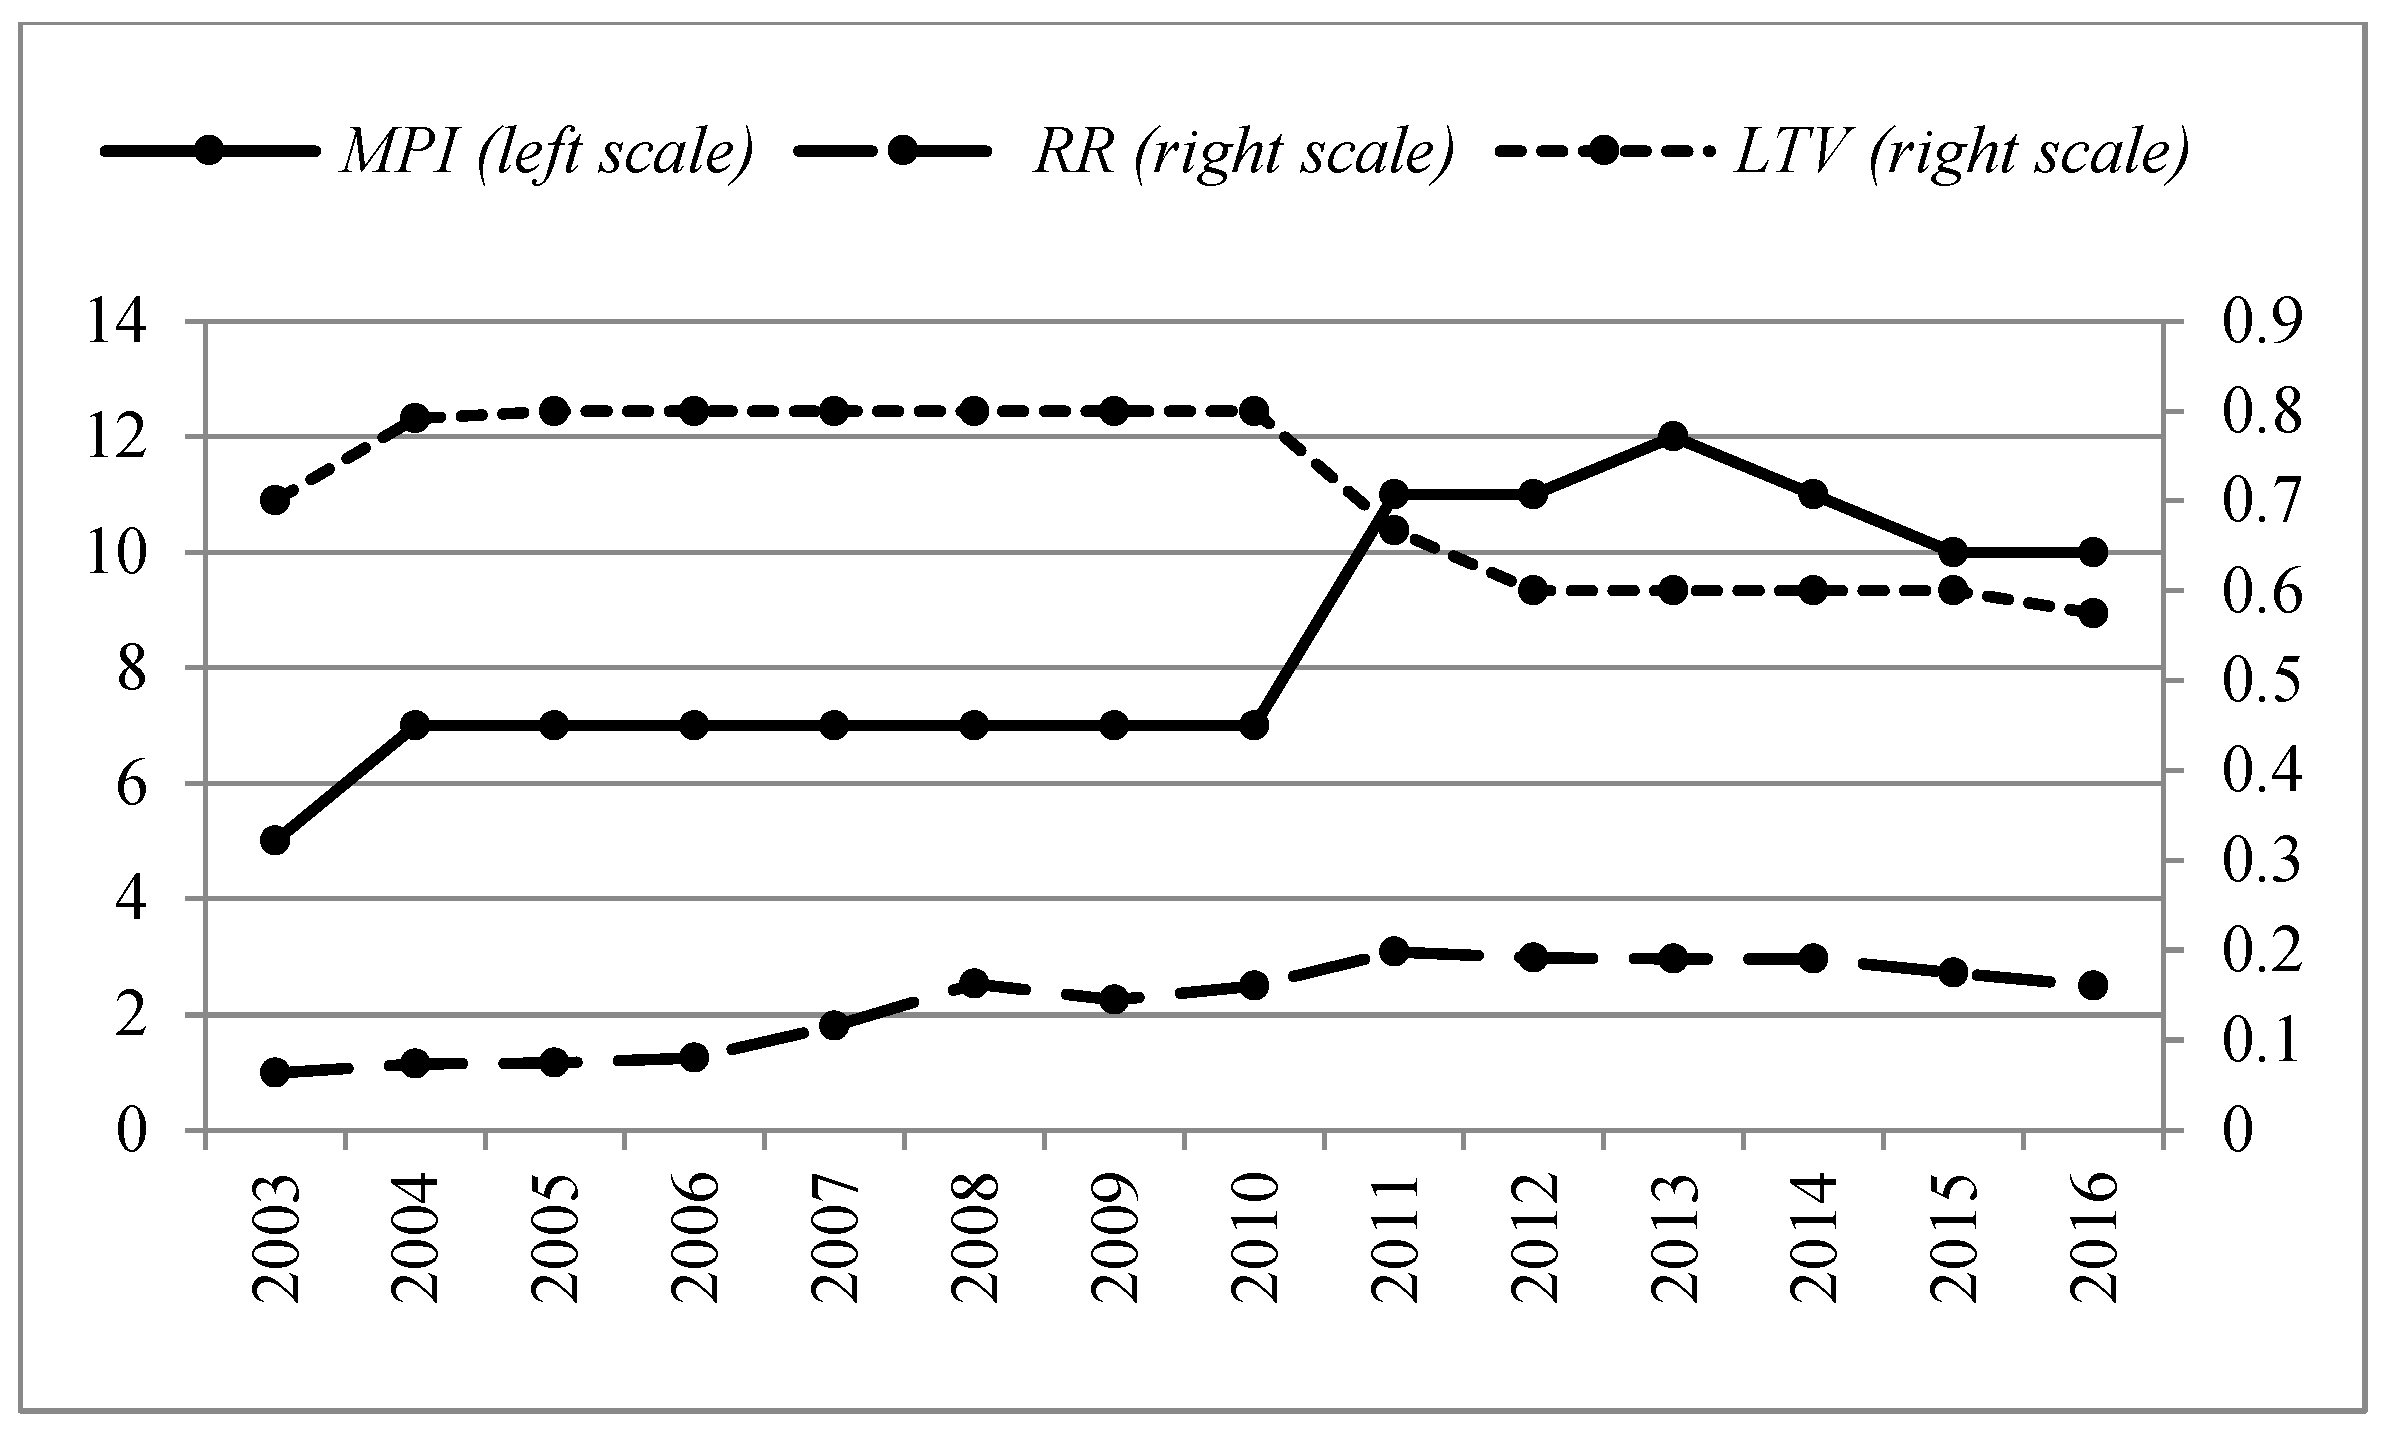
In the robustness checks, we choose a macroprudential policy indicator (MPI) as the proxy of the MPP according to Altunbas et al. [38]. The MPI is the annual times of macroprudential tools implemented by the central bank. Macroprudential tool statistics are based on the 2010 IMF’s survey on Financial Stability and Macroprudential Policy and Lim et al. [26]. The data for the remaining years is updated by searching in the website of the People’s Bank of China. Figure 1 shows that the MPI has sharply increased since 2010, which can be attributed to the fact that MPPs are greatly recognized by most countries after the global financial crisis of 2008. An increasing number of macroprudential tools are implemented to associate with monetary policy to match the new normal of China’s economy. The MPI has a similar trend with RR and LTV.
4.1.3. Credit Cycle
The study by Bruno et al. [50] shows that the MPP is more effective when the central bank adopts a loose monetary policy. Cerutti et al. [1] also found that MPPs have asymmetric effects and MPPs are more effective during periods of high credit growth than in a depression. Therefore, we extend our research to introduce a cross-product of the credit cycle and a MPP to capture their interaction. The calculation of the credit cycle is based on the Basel Committee’s method of accruing countercyclical capital [51]. Firstly, we calculate the RATIO, , where is the amount of GDP in period t and is the total amount of credit for the private and non-financial sectors in the period t. Both GDP and CREDIT are quarterly nominal values. Secondly, we calculate the GAP, , where is the long term trend of RATIO in period t using the method of HP filter and lambda I set as 400,000. Thirdly, we specify credit boom periods with an annual average GAP greater than 2%. We use quarterly GDP and CREDIT with a seasonal adjustment resourced from the CEInt Statistics Database in 2003–2016. The calculation results of the credit cycle are shown in Table A2 (see Appendix A). We set a dummy variable for a credit boom (CB) where CB = 1 in the credit boom periods of the years 2003, 2009, and 2010.
4.2. Data and Methodology
To empirically analyze the impact of MPPs on Chinese commercial banks risk-taking behaviors, we construct the baseline model as follows:
where represents the risk-taking of a commercial bank i in period t, and we use the NPL as the proxy. Meanwhile, the represents MPPs and RR, LTV and CP are corresponding proxies. represents control variables, including total assets (TA), loan-to-deposit ratio (DTL), return on equity (ROE), non-interest income/total assets (NIA) at the bank level, which separately controls the effect of the bank’s size, deposit and loan structure, capital cost, and asset-liability structure on risk-taking; and also includes the 90-day interbank offered rate (IBOR90) at the monetary policy level, which controls the impact of monetary policy on bank risk-taking [34]. and indicate the time effect and type effect of the bank, respectively, and is the error term.
Considering the effect of the credit cycle on MPPs, the cross-product of and CB is introduced in Equation (9) as follows:
The GMM method is used to estimate Equations (9) and (10) because it accounts for both the endogeneity of certain bank-level variables and the dynamic nature of bank risk. The GMM method includes differential GMM and system GMM. System GMM has better estimation efficiency as it overcomes the problem that differential GMM cannot estimate the coefficients of the explanatory variables and the weak instrument variables that do not change with time. According to Claessens et al. [5] and Altunbas et al. [38], the dynamic unbalanced panel system generalized method of moment (SYS-GMM) is used to solve the endogenous problems that may exist in Equation (9) and Equation (10). The SYS-GMM can control the endogenous correlation between the lagged dependent variable and the residual, and also control the possible endogenous correlation between the explanatory variables or control variables and the residual [52]. We construct the model to be estimated by the SYS-GMM.
where is the lagged . Considering the effect of CB on MPPs, the model turns to:
Instrument variables are important for the estimation of the SYS-GMM. Horizontal value and first-order difference of explanatory variables are generally selected as instrument variables [35] as well as the lagged value and the first-order difference of the dependent variable [52]. We select the lagged value and the first-order difference of NPL, the first-order difference of three MPP variables and a dummy variable of year. Moreover, we specially select the Chinese political cycle (dummy variable, PC, PC = 1, in the year when the National Congress of the Communist Party of China held) as an exogenous instrument variable.
We collect the non-balanced panel data of 231 commercial banks in China from 2003 to 2016, resourced from the Wind database, Bankscope, and ORBIS Bank Focus. Excluding policy banks and banks with less than five consecutive years of data, we obtain 231 sample banks including 5 state-owned large commercial banks, 12 joint-stock commercial banks, 112 city commercial banks, 74 rural commercial banks, and 28 foreign-funded commercial banks according to the classification of the China Banking and Insurance Regulatory Commission. The assets of the sample banks are 174 trillion RMB and take up 75% of the total assets of the banking system (232 trillion RMB). Therefore, our sample covers China’s major commercial banks and is representative enough. Descriptive statistics are shown in Table 1.
The size of different types of commercial banks varies significantly from each other. State-owned large commercial banks have larger amounts of assets than other types of banks. Risks in the Chinese commercial banking system are relatively low as the mean of NPL is 0.0187 with a standard variation of 0.0208. The low NPL can be attributed to the rapid growth of the economy, strict supervision of regulatory agencies, systemic risk management of banks, and the good credit of enterprises in China. The mean and median of RCP are positive, which means that CARs in most Chinese commercial banks are above the regulatory level. However, the value of CAR varies among different banks with a high standard variation of 0.1358. Meanwhile, the distances between different quantiles of RCP are comparatively large. Negative values of RCP do not necessarily mean that those banks fail to satisfy the regulatory requirement because RCP can be negative if the standard variation of a bank’s capital ratio is too large no matter if the capital ratio is higher than the CAR requirement. Excessive variation of the capital ratio is also a risk for commercial banks. The RR has been adjusted several times by the People’s Bank of China during the sample years, upward and downward before and during the global financial crisis of 2008, respectively. Later, the RR was adjusted upward again after the crisis from 2010 to 2014 and downward in 2015 and 2016, associating with the business cycle. The IBOR90 has a similar trend with RR in the sample period, which usually reaches a high level when encountering a “cash crunch” during which the liquidity is squeezed; e.g., June 2013 in China. The LTV is an important indicator regulated along with property market policy by the regulators. The maximum in the sample period is 80%, indicating that the mortgage down payment ratio is 20%, which is in the “golden decade” for the Chinese property market before 2010. The property market policy is tighter; e.g., increasing the limit of mortgage down payment ratio to decrease the LTV after 2010. The LTV is at a relatively safe level compared with 95% in America during the global financial crisis of 2008. The LTD was viewed as a liquidity indicator which should not exceed 75% as regulated by China Banking and Insurance Regulatory Commission, but was canceled in 2015. It is now a monitoring indicator. The LTD shows that the majority of Chinese commercial banks take a low preference for liquidity risk as the mean and 75% quantile of LTD are both smaller than 75%. Although the minimum is −0.183, few banks have a negative profit, as the 25% quantile of ROE is 0.1028. The mean of ROE is 0.1499, reflecting the high level of profitability and great developmental sustainability in Chinese commercial banks. However, operation diversification should be expanded extensively as the values of NIA are small in most Chinese commercial banks. The guidance on regulating the asset management business of financial institutions was released by the People’s Bank of China in 27th April 2018, which is a large shock to commercial banks in diversifying their business and will unavoidably influence the NIA deeply. Therefore, Chinese commercial banks should develop diversified business steadily according to the new guidance.
Table 2 presents the correlations between each two variables. The CP and RR are negatively correlated to the NPL, and the absolute value of correlation coefficients is 0.165 and 0.483, respectively, implying a stronger effect of RR on bank risk-taking. Moreover, the LTV is positively correlated to the NPL (0.233). The above relationships between CR, RR, LTV, and NPL indicate that enhancing macroprudential supervision helps reduce commercial bank risks. Finally, as shown in Table 2, there are no strong correlations between the variables used in our system of equations and the risk of multicolinearity is low.
5. Empirical Results and Robustness Checks
5.1. Empirical Results
The empirical results are summarized in Table 3. The coefficients of L.NPL, the lagged term of NPL, are positive and statistically significant, thus indicating the persistence in the adjustment process of bank risk-taking. Large coefficients of L.NPL imply the necessity of using the SYS-GMM method. Columns (1–3) show the effect of individual macroprudential tools on bank risk-taking. CCBs reduce bank risk-taking as the CP has a significantly negative coefficient of −0.0027 on NPL. Similarly, the RR has a greater effect on reducing bank risk-taking as the coefficient is −0.0959, which means that the RR works better than the CCB. This may to a certain extent explains why the tool of RR is hardly used by the Chinese central bank. A greater value of RCP is accompanied by a higher RR and a lower NPL. Thus, bank risk-taking behaviors decrease with the strengthening of the macroprudential supervision. As for the tool of LTV, a higher LTV is accompanied by a lower mortgage down payment ratio and higher NPL and bank risk-taking. The LTV also helps reduce bank risk-taking since the LTV has a significantly positive coefficient of 0.0285 on NPL, thus indicating that weakening macroprudential supervision increases bank risk-taking behaviors. The effect of individual macroprudential tools on bank risk-taking shows that MPPs weaken bank risk-taking efficiently. Moreover, the RR has the strongest effect, which agrees with the monetary theory and also is in line with previous empirical evidence. Consequently, the central bank adjusts RR prudently because of its powerful effects on the market. The effect of LTV is weaker than the RR, but stronger than the CCB. The property market is a major engine of Chinese economic growth in the past decades. China has strengthened the regulation of its property market in recent years to prevent potential risks. Each adjustment of the mortgage down payment ratio will cause a huge turbulence. As the main provider of a mortgage, the mortgage businesses of banks can be affected by the mortgage down payment ratio significantly, and their risk appetites and risk-taking behaviors will accordingly be impacted. Chinese commercial banks have preferences of satisfying the requirements of regulatory agencies and hold higher capital than required under the supervision of CAR. The additional capital requirement of CCB influences their risk-taking behaviors to a limited degree. These help to explain why the tool of LTV has a greater effect on bank risk-taking than CCB in China, which is similar to the Canadian case [31]. Column (4) shows the combined effect of group macroprudential tools on bank risk-taking. The coefficients of RR, CP, and LTV have the same sign with previous estimation of individual macroprudential tools. The RR has the largest coefficient, followed by LTV and CCB. The significance and sign of the coefficients of the three macroprudential tools in specifications (1) to (4) are consistent with the theoretical expectations. Policymakers can design MPPs to achieve specific goals according to the different effects of the macroprudential tools.
The Basel committee proposes to accrue CCB during a credit boom [50]. We proceed to verify such a mechanism in China and the role of the credit cycle in MPPs’ effects on bank risk-taking behavior. We extend the model by inserting the term, RCP_B, cross-product of RCP and CB. Column (5) shows that the coefficient of RCP_B is significantly negative (−0.0645), consistent with the coefficient of CP, thus indicating that the CB magnifies MPPs’ effect on bank risk-taking behaviors. The result verifies that credit cycle is an important indicator for implementing macroprudential supervision in China. We consider the cross-product of RCP and CB but do not include RR and LTV in the model because RR and LTV are adjusted by the central bank, who has considered the influence of credit boom. By contrast, the RCP is decided by commercial banks, which implies their active behaviors in guaranteeing capital adequacy. Thereby, considering the cross-product of RCP and CB can test whether commercial banks hold more capital in credit boom periods. Meanwhile, we consider the cross-product of RCP and CB rather than CP and CB because both CP and CB are dummy variables making the cross-product of them being 0 in most cases, which may decrease the reliability of conclusions. The result shows that the credit cycle affects the commercial banks’ risk-taking behaviors, thus magnifying the effect of CCB on bank risk-taking. The RCP is higher during a credit boom and largely reduces the procyclicality of bank risks, thus effectively preventing systemic bank risk and promoting the sustainable development of the banking sector. The results show that the greater effects of MPPs are felt when the credit cycle interactions are in line with Fendoğlu [43]. It can be concluded that the MPP affects bank risk-taking behavior and further influences the bank’s developmental sustainability in China.
Finally, to ensure the efficiency and consistency of the SYS-GMM estimates, we use AR (2) test to identify the sequence autocorrelation problem of the residuals and the Hansen test to identify the over-identification problem of the instrumental variables. The results of the AR (2) tests for each estimation reject the null hypothesis, thus indicating no serial correlation. The results of Hansen tests suggest that the null hypothesis should not be rejected and thus imply that no over-identification exists. Therefore, the instruments appear to meet the requirements of the SYS-GMM method in estimating the model. As a consequence, the results estimated by SYS-GMM in this paper are reliable and efficient enough.
5.2. Robustness Checks
5.2.1. Alternative Estimation Methods
In order to avoid the non-randomness of empirical results and enhance the reliability and stability of conclusions, we conduct robustness checks based on alternative estimation methods of the model and different proxies of bank risk-taking and MPP.
We use the OLS method to estimate Equations (9) and (10) for robustness checks. The estimation results are shown in Table 4. Columns (1–3) show the effect of three individual macroprudential tools on bank risk-taking. The coefficients of CP and RR are significantly negative and the coefficient of LTV is significantly positive, in line with the estimation results by SYS-GMM in Table 3. Meanwhile, the RR has the largest coefficient while LTV is second and CCB last. The values of coefficients of RR, LTV and CP are somewhat larger in the OLS estimation than in SYS-GMM estimation because of no lagged terms of NPL and L.NPL. Column (4) shows that the coefficients of CP, RR, and LTV have the same positive or negative symbols as in Table 3. The coefficient of RCP_B, i.e., the product of RCP and CB, in column (5) is significantly negative, consistent with the coefficient of CP, and is in line with that in Table 3. The coefficients of CP, RR, LTV, and RCP_B estimated by OLS are statistically significant and have the same symbols with the results of the SYS-GMM. Strengthening of MPP helps reduce bank risk-taking, and this effect is more powerful in credit booms. The relationship among MPP, credit cycle, and bank risk-taking concluded in SYS-GMM holds in OLS results.
5.2.2. Alternative Proxies of Bank Risk-Taking
Another robustness check is carried out using Z-score as a proxy for bank risk-taking. A larger Z-score denotes a smaller value of bank risk-taking. We estimate Equations (11) and (12) by the SYS-GMM and summarize the results in columns (1–5) of Table 5. Columns (1–3) show the effect of three individual macroprudential tools on bank risk-taking. The CP has a significant positive coefficient of 0.148 on Z-score. Similarly, the coefficient of RR is 1.545. The LTV has a significant negative coefficient of −0.112. The effect of individual macroprudential tools on bank risk-taking shows that the MPP can efficiently control bank risk-taking, which is similar to the estimation results of SYS-GMM. The RR has the greatest effect, followed by CCB and LTV. When it comes to the combined effect of three grouping macroprudential tools on bank risk-taking, the results maintain the same with SYS-GMM. The coefficient of RCP_B, i.e., the cross-product of RCP and CB, is significant positive of 1.551 as shown in column (5), suggesting that the credit cycle magnifies the effect of MPP on bank risk-taking. The results are all basically consistent with previous conclusions.
5.2.3. Alternative Proxies of Macroprudential Policy
According to Altunbas et al. [38], we use the logarithm value of MPI as the proxy of MPP for robustness checks. The results based on the SYS-GMM estimation are shown in columns (6–7) of Table 5. The coefficient of MPI is statistically significant and the value of it is −0.0124 which is negative. The MPI_B, i.e., the cross-product of MPI and CB, is −0.00242, thus indicating that with the strengthening of MPP, bank risk-taking behaviors are reduced, consistent with previous conclusions.
6. Conclusions
This paper provides a theoretical analysis and empirical evidence on the effect of MPPs on bank risk-taking behaviors. The results show that bank risk-taking behaviors will be reduced with the strengthening of macroprudential supervision according to the estimation of the individual macroprudential tools and group macroprudential tools of CCB, RR and LTV. Moreover, the effect of RR is the most significant, followed by LTV and CCB. Specially, we consider the role of the credit cycle in the transmission mechanism of MPPs because MPPs are usually implemented according to the credit cycle [50]. The effects of MPPs on bank risk-taking are enhanced during a credit boom, which verifies the timeliness of MPPs implementation in China. Therefore, the central bank should further strengthen the assessment and surveillance of macroprudential tools and implement proper tools for distinct goals and in different periods, particularly in credit boom periods, to promote the sustainability of the banking sector. Furthermore, this paper finds that the Chinese commercial banking system is operated with small NPL, which shows a low risk appetite in the majority of Chinese commercial banks. Few diversified businesses in commercial banks shows that the diversification operation will cause potential risks in new products or businesses, although it may help banks to diversify risks. We confirm the developmental sustainability of the Chinese banking system for the sustainable growth of commercial banks and the effectiveness of MPPs on bank risk-taking. MPPs can be used by regulators to manage bank risk-taking behaviors and mitigate vulnerability in the bank sector, which greatly benefits the sustainable development of the banking system and overall financial stability.
Author Contributions
X.Z., Z.L., F.L. and Y.X. conceived and designed methodology; X.Z. and Z.L. collected and analyzed data; X.Z. and F.L. contributed the analysis tools; X.Z. and Y.X. wrote the paper.
Funding
This research was supported by the Fundamental Research Funds for the Central Universities, and the Research Funds of Renmin University of China, grant number 18XNH006.
Acknowledgments
The authors would like to thank Joan Wang (the Editor) and two anonymous referees for comments that substantially helped improve the paper. The authors also thank Yu Wang for her detailed suggestions.
Conflicts of Interest
The authors declare no conflict of interest. The funders had no role in the design of the study; in the collection, analyses, or interpretation of data; in the writing of the manuscript, or in the decision to publish the results.
Appendix A

Table A1.
Introduction on literatures about main macroprudential policies (MPPs)
| Main MPPs | Literature | Countries | Key Evidence |
|---|---|---|---|
| Countercyclical buffer | [19] | European countries | Structural risks are addressed by Countercyclical buffer |
| [26] | 49 countries | Reduce credit and leverage growth effectively | |
| [35] | Canada | Exhibit a positive co-movement with business cycles | |
| [36] | Indonesia | Negatively affect the financing growth of Islamic banks | |
| Reserve requirement | [26] | 49 countries | Sufficient to create liquidity buffers |
| [33] | 11 Central and Eastern European countries | Slow the growth of credit to households | |
| [43] | Emerging market economies | Reduce the impact of portfolio inflows on the credit cycles | |
| [45] | Bulgaria, Croatia, Romania and Serbia | Strong MPPs help contain domestic Credit growth during the boom years | |
| Loan-to-value (LTV) | [19] | European countries | Help address cyclical risks in residential real estate (RRE) markets |
| [27] | 65 countries | Reduce the procyclicality of loan-loss provisions of large banks | |
| [28] | 19 OECD countries | Curb house price and house-hold credit growth | |
| [29] | New Zealand | Suggest macroprudential policy is a useful addition to monetary policy | |
| [30] | Korea | Have significant and persistent effect on real household credit and real house price. | |
| Debt-to-income (DTI) | [27] | 65 countries | Reduce the procyclicality of loan-loss provisions of large banks |
| [30] | Korea | Effectively stabilize household debt | |
| [28] | 19 OECD countries | Curb house price and house-hold credit growth | |
| Dynamic provisions | [27] | 65 countries | Reduce the procyclicality of LLP independently of bank size |
| Overall macroprudential policies | [38] | 61 advanced and emerging market economies | macroprudential tools are effective in modifying bank risk-taking |
Sources: sort out by authors.
Table A2.
Credit boom periods.
| Period | Ratio | Trend | Season Gap | Year Gap | Credit Boom |
|---|---|---|---|---|---|
| 2003Q1 | 0.1461 | 0.1481 | −0.20% | 6.76% | YES |
| 2003Q2 | 0.3566 | 0.1486 | 20.81% | ||
| 2003Q3 | 0.2348 | 0.149 | 8.58% | ||
| 2003Q4 | 0.1277 | 0.1494 | −2.17% | ||
| 2004Q1 | 0.1327 | 0.1499 | −1.72% | −3.63% | NO |
| 2004Q2 | 0.0734 | 0.1503 | −7.69% | ||
| 2004Q3 | 0.1032 | 0.1507 | −4.75% | ||
| 2004Q4 | 0.1475 | 0.1512 | −0.37% | ||
| 2005Q1 | 0.1093 | 0.1516 | −4.22% | −5.84% | NO |
| 2005Q2 | 0.0176 | 0.1520 | −13.44% | ||
| 2005Q3 | 0.1221 | 0.1525 | −3.04% | ||
| 2005Q4 | 0.1262 | 0.1529 | −2.67% | ||
| 2006Q1 | 0.1377 | 0.1534 | −1.57% | −1.24% | NO |
| 2006Q2 | 0.1748 | 0.1538 | 2.10% | ||
| 2006Q3 | 0.1286 | 0.1543 | −2.57% | ||
| 2006Q4 | 0.1256 | 0.1548 | −2.91% | ||
| 2007Q1 | 0.1402 | 0.1552 | −1.51% | −2.45% | NO |
| 2007Q2 | 0.1681 | 0.1557 | 1.24% | ||
| 2007Q3 | 0.1529 | 0.1562 | −0.33% | ||
| 2007Q4 | 0.0649 | 0.1566 | −9.18% | ||
| 2008Q1 | 0.1099 | 0.1571 | −4.72% | −2.06% | NO |
| 2008Q2 | 0.1316 | 0.1576 | −2.59% | ||
| 2008Q3 | 0.1657 | 0.158 | 0.77% | ||
| 2008Q4 | 0.1414 | 0.1585 | −1.71% | ||
| 2009Q1 | 0.3662 | 0.1590 | 20.72% | 9.43% | YES |
| 2009Q2 | 0.3011 | 0.1594 | 14.16% | ||
| 2009Q3 | 0.1931 | 0.1599 | 3.32% | ||
| 2009Q4 | 0.1557 | 0.1603 | −0.47% | ||
| 2010Q1 | 0.1811 | 0.1608 | 2.03% | 3.60% | YES |
| 2010Q2 | 0.1850 | 0.1612 | 2.38% | ||
| 2010Q3 | 0.2059 | 0.1617 | 4.42% | ||
| 2010Q4 | 0.2176 | 0.1621 | 5.55% | ||
| 2011Q1 | 0.0945 | 0.1626 | −6.81% | −1.39% | NO |
| 2011Q2 | 0.1468 | 0.163 | −1.62% | ||
| 2011Q3 | 0.1503 | 0.1634 | −1.32% | ||
| 2011Q4 | 0.2059 | 0.1639 | 4.21% | ||
| 2012Q1 | 0.1378 | 0.1643 | −2.65% | −1.18% | NO |
| 2012Q2 | 0.1657 | 0.1647 | 0.10% | ||
| 2012Q3 | 0.1641 | 0.1652 | −0.11% | ||
| 2012Q4 | 0.1452 | 0.1656 | −2.04% | ||
| 2013Q1 | 0.1432 | 0.1660 | −2.28% | −1.49% | NO |
| 2013Q2 | 0.1481 | 0.1665 | −1.84% | ||
| 2013Q3 | 0.1715 | 0.1669 | 0.46% | ||
| 2013Q4 | 0.1444 | 0.1673 | −2.30% | ||
| 2014Q1 | 0.1422 | 0.1677 | −2.55% | −1.30% | NO |
| 2014Q2 | 0.1628 | 0.1682 | −0.54% | ||
| 2014Q3 | 0.1378 | 0.1686 | −3.08% | ||
| 2014Q4 | 0.1789 | 0.1690 | 0.99% | ||
| 2015Q1 | 0.182 | 0.1695 | 1.26% | 0.84% | NO |
| 2015Q2 | 0.1627 | 0.1699 | −0.72% | ||
| 2015Q3 | 0.222 | 0.1703 | 5.17% | ||
| 2015Q4 | 0.1473 | 0.1708 | −2.35% | ||
| 2016Q1 | 0.1831 | 0.1712 | 1.20% | −0.06% | NO |
| 2016Q2 | 0.1548 | 0.1716 | −1.68% | ||
| 2016Q3 | 0.1628 | 0.172 | −0.92% | ||
| 2016Q4 | 0.184 | 0.1725 | 1.16% |
Sources: authors calculation.
Appendix B
Assuming is given, the first order condition for can be written as:
Which implies:
As , we only consider the condition .
Then we solute and substitute into Equation (2) and obtain:
The first order condition for can be written as:
Let , then we obtain:
The first order condition for can be written as:
So,
And,
Then we obtain:
References
- Cerutti, E.; Claessens, S.; Laeven, L. The use and effectiveness of macroprudential policies: New evidence. J. Financ. Stab. 2017, 28, 203–224. [Google Scholar] [CrossRef]
- IMF. Global Financial Stability Report. 2018. Available online: http://www.imf.org/en/Publications/GFSR/Issues/2018/04/02/Global-Financial-Stability-Report-April-2018 (accessed on 10 April 2018).
- Jiménez, G.; Ongena, S.; Peydro, J.L.; Saurina, J. Macroprudential policy, countercyclical bank capital buffers and credit supply: Evidence from the Spanish dynamic provisioning experiments. Soc. Sci. Electron. Publ. 2012, 36, 2126–2177. [Google Scholar] [CrossRef]
- Salas, J.S. Loan loss provision in Spain: A working macroprudential tool. Estab. Financ. 2009, 17, 9–26. [Google Scholar]
- Claessens, S.; Ghosh, S.R.; Mihet, R. Macro-prudential policies to mitigate financial system vulnerabilities. J. Int. Money Financ. 2013, 39, 153–185. [Google Scholar] [CrossRef]
- Zhang, L.; Zoli, E. Leaning against the wind: Macroprudential policy in Asia. J. Asian Econ. 2016, 42, 33–52. [Google Scholar] [CrossRef]
- Borio, C.; Zhu, H. Capital regulation, risk-taking and monetary policy: A missing link in the transmission mechanism. J. Financ. Stab. 2012, 8, 236–251. [Google Scholar] [CrossRef]
- Angeloni, I.; Faia, E.; Lo Duca, M. Monetary policy and risk taking. J. Econ. Dyn. Control 2015, 52, 285–307. [Google Scholar] [CrossRef] [Green Version]
- Dell’Ariccia, G.; Laeven, L.; Suarez, G.A. Bank leverage and monetary policy’s risk-taking channel: Evidence from the United States. J. Financ. 2017, 72, 613–654. [Google Scholar] [CrossRef]
- Dell’Ariccia, G.; Laeven, L.; Marquez, R. Monetary policy, leverage, and bank risk-taking. IMF Work. Pap. 2010, 276, 1–36. [Google Scholar] [CrossRef]
- Dana, B.S. Evaluation of macroprudential policy on credit growth in Indonesia: Credit registry data approach. Etikonomi 2018, 17, 199–212. [Google Scholar] [CrossRef]
- Danışoğlu, S.; Güner, Z.N.; Ayaydın, H. International evidence on risk taking by banks around the global financial crisis. Emerg. Mark. Financ. Trade 2018, 54, 1946–1962. [Google Scholar] [CrossRef]
- Mohsni, S.; Otchere, I. Does regulatory regime matter for bank risk taking? A comparative analysis of US and Canada. J. Int. Financ. Mark. Inst. Money 2018, 53, 1–16. [Google Scholar] [CrossRef]
- Ashraf, B.N.; Arshad, S.; Yan, L. Trade openness and bank risk-taking behavior: Evidence from emerging economies. J. Risk Financ. Manag. 2017, 10, 15. [Google Scholar] [CrossRef]
- Adesina, K.S.; Mwamba, J.M. Do Basel III higher common equity capital requirements matter for bank risk-taking behaviour? lessons from South Africa. Afr. Dev. Rev. 2016, 28, 319–331. [Google Scholar] [CrossRef]
- Akande, J.O.; Kwenda, F.; Ehalaiye, D. Competition and commercial banks risk-taking: Evidence from Sub-Saharan Africa region. Appl. Econ. 2018, 50, 4774–4787. [Google Scholar] [CrossRef]
- Sudrajad, O.Y.; Hübner, G. Empirical evidence on bank market power, business models, stability and performance in the emerging economies. Eurasian Bus. Rev. 2018, 1–33. [Google Scholar] [CrossRef]
- Samet, A.; Boubakri, N.; Boubaker, S. Does public–private status affect bank risk taking? Worldwide evidence. J. Int. Financ. Mark. Inst. Money 2018, 53, 287–306. [Google Scholar] [CrossRef]
- Cosmin, C.M.; Mădălin, M.B.; Cosmin, Ț.A. Considerations regarding the financial stability and the macro-prudential policy. Ann. “Constantin Brancusi” Univ. Targu-Jiu Econ. Ser. 2018, 1, 130–138. [Google Scholar]
- European Systemic Risk Board. A Review of Macroprudential Policy in the EU in 2017. April 2018. Available online: https://www.esrb.europa.eu/pub/pdf/reports/esrb.report180425_review_of_macroprudential_policy.en.pdf?4b6e5f604e78b7d772b788f2f81fc0c8 (accessed on 25 April 2018).
- Agénor, P.R.; Pereira da Silva, L.A. Macroeconomic stability, financial stability, and monetary policy rules. Int. Financ. 2012, 15, 205–224. [Google Scholar] [CrossRef]
- Bauer, G.; Pasricha, G.; Sekkel, R.; Terajima, Y. The global financial cycle, monetary policies, and macroprudential regulations in small, open economies. Can. Public Policy 2018, 44, 81–99. [Google Scholar] [CrossRef]
- Apergis, N. Monetary policy and macroprudential policy: New evidence from a world panel of countries. Oxf. Bull. Econ. Stat. 2017, 79, 395–410. [Google Scholar] [CrossRef]
- McKibbin, W.J. Macroprudential policy in an Australian context. Aust. Econ. Rev. 2016, 49, 86–88. [Google Scholar] [CrossRef]
- Rey, H. Dilemma not trilemma: The global financial cycle and monetary policy independence. Natl. Bur. Econ. Res. 2015. [Google Scholar] [CrossRef]
- Lim, C.H.; Costa, A.; Columba, F.; Kongsamut, P.; Otani, A.; Saiyid, M.; Wezel, T.; Wu, X. Macroprudential policy: What instruments and how to use them? lessons from country experiences. IMF Work. Pap. 2011, 238, 1–85. [Google Scholar]
- Olszak, M.; Roszkowska, S.; Kowalska, I. Macroprudential policy instruments and procyclicality of loan-loss provisions—cross-country evidence. J. Int. Financ. Mark. Inst. Money 2018, 54, 228–257. [Google Scholar] [CrossRef]
- Carreras, O.; Davis, E.P.; Piggott, R. Assessing macroprudential tools in OECD countries within a cointegration framework. J. Financ. Stab. 2018, 37, 112–130. [Google Scholar] [CrossRef]
- Funke, M.; Kirkby, R.; Mihaylovski, P. House prices and macroprudential policy in an estimated DSGE model of New Zealand. J. Macroecon. 2018, 56, 152–171. [Google Scholar] [CrossRef] [Green Version]
- Jung, Y.; Kim, S.; Yang, D.Y. Optimal macroprudential policies and house prices in Korea. Emerg. Mark. Financ. Trade 2017, 53, 2419–2439. [Google Scholar] [CrossRef]
- Alpanda, S.; Cateau, G.; Meh, C. A policy model to analyze macroprudential regulations and monetary policy. Can. J. Econ. 2018, 51, 828–863. [Google Scholar] [CrossRef]
- Kim, S.; Plosser, M.C.; Santos, J.A.C. Macroprudential policy and the revolving door of risk: Lessons from leveraged lending guidance. J. Financ. Intermed. 2018, 34, 17–31. [Google Scholar] [CrossRef]
- Dumičić, M. Effectiveness of macroprudential policies in Central and Eastern European countries. Public Sect. Econ. 2018, 42, 1–19. [Google Scholar] [CrossRef]
- Andries, A.M.; Plescau, I.; Stoica, O. Macroprudential policy and bank risk in Central and Eastern Europe: The role of bank business models. Transform. Bus. Econ. 2016, 15, 544–564. [Google Scholar]
- Guidara, A.; Soumaré, I.; Tchana, F.T. Banks’ capital buffer, risk and performance in the Canadian banking system: Impact of business cycles and regulatory changes. J. Bank. Financ. 2013, 37, 3373–3387. [Google Scholar] [CrossRef] [Green Version]
- Sakti, M.R.P.; Thas Thaker, H.M.; Qoyum, A.; Qizam, I. the concept and practice of macroprudential policy in Indonesia: Islamic and conventional. Al-Iqtishad J. Islamic. Econ. 2018, 10, 75–96. [Google Scholar] [CrossRef]
- Ma, Y.; Yao, C. Regulatory pressure, economic cycle, and effectiveness of macro-prudential policy. Econ. Theory Bus. Manag. 2017, 10, 5–16. [Google Scholar]
- Altunbas, Y.; Binici, M.; Gambacorta, L. Macroprudential policy and bank risk. J. Int. Money Financ. 2018, 81, 203–220. [Google Scholar] [CrossRef]
- Drehmann, M.; Borio, C.; Tsatsaronis, K. Anchoring countercyclical capital buffers: The role of credit aggregates. BIS Work. Pap. 2011, 7, 189–240. [Google Scholar]
- Drehmann, M.; Gambacorta, L. The effects of countercyclical capital buffers on bank lending. Appl. Econ. Lett. 2012, 19, 603–608. [Google Scholar] [CrossRef]
- Ibrahim, M.H.; Rizvi, S.A.R. Bank lending, deposits and risk-taking in times of crisis: A panel analysis of Islamic and conventional banks. Emerg. Mark. Rev. 2018, 35, 31–47. [Google Scholar] [CrossRef]
- Balla, E.; Mckenna, A.B. Dynamic provisioning: A countercyclical tool for loan loss reserves. Econ. Q. 2009, 95, 383–418. [Google Scholar]
- Fendoğlu, S. Credit cycles and capital flows: Effectiveness of the macroprudential policy framework in emerging market economies. J. Bank. Financ. 2017, 79, 110–128. [Google Scholar] [CrossRef]
- Vandenbussche, J.; Kongsamut, P.; Dimova, D. Macroprudential policy effectiveness: Lessons from Southeastern Europe. J. Bank. Financ. Econ. 2018, 1, 60–102. [Google Scholar] [CrossRef]
- Jiang, S.X.; Chen, Y.C. Monetary policy, bank capital and risk-taking. J. Financ. Res. 2012, 4, 1–16. [Google Scholar]
- Laeven, L.; Levine, R. Bank governance, regulation and risk taking. J. Financ. Econ. 2009, 93, 259–275. [Google Scholar] [CrossRef] [Green Version]
- Liao, M.; Lin, X.G.; Guan, H. Study on the efficiency of macroprudential regulation tools and policy coordination. Financ. Regul. Res. 2012, 12, 1–23. [Google Scholar] [CrossRef]
- Fang, Y. A study on the effectiveness of macro-prudential policies. J. World Econ. 2016, 8, 25–49. [Google Scholar]
- Mora, N.; Logan, A. Shocks to bank capital: Evidence from UK banks at home and away. Appl. Econ. 2012, 44, 1103–1119. [Google Scholar] [CrossRef]
- Bruno, V.; Shim, I.; Shin, H.S. Comparative assessment of macroprudential policies. J. Financ. Stab. 2017, 28, 183–202. [Google Scholar] [CrossRef]
- Basel Committee on Banking Supervision. Guidance for National Authorities Operating the Countercyclical Capital Buffer. 2010. Available online: https://www.bis.org/publ/bcbs187.pdf (accessed on 16 December 2010).
- Blundell, R.; Bond, S. Initial conditions and moment restrictions in dynamic panel data models. J. Econ. 1998, 87, 115–143. [Google Scholar] [CrossRef] [Green Version]
Figure 1.
Macroprudential policy indicator (MPI), reserve requirement (RR) and loan-to-value (LTV) from 2003 to 2016. Source: the MPI is from the 2010 IMF’s survey on Financial Stability and Macroprudential Policy, Lim et al. [26] and the website of the People’s Bank of China; the RR and LTV are from the Wind database.

Table 1.
Descriptive statistics.
| Variables | N | Mean | s.d. | min | p25 | p50 | p75 | max |
|---|---|---|---|---|---|---|---|---|
| NPL | 1928 | 0.0187 | 0.0208 | 0.0006 | 0.0080 | 0.0130 | 0.0206 | 0.1339 |
| RCP | 1928 | 0.0023 | 0.1358 | −1.7402 | −0.0181 | 0.0022 | 0.0196 | 2.5994 |
| RR | 1928 | 0.1362 | 0.0507 | 0.0600 | 0.0750 | 0.1600 | 0.1900 | 0.1983 |
| LTV | 1928 | 0.7089 | 0.0909 | 0.5750 | 0.6000 | 0.7000 | 0.8000 | 0.8000 |
| LTD | 1928 | 0.6757 | 0.2281 | 0.3163 | 0.5798 | 0.6606 | 0.7164 | 2.0904 |
| ROE | 1928 | 0.1499 | 0.0772 | −0.0183 | 0.1028 | 0.1499 | 0.1931 | 0.3744 |
| NIA | 1928 | 0.0051 | 0.0047 | −0.0030 | 0.0018 | 0.0039 | 0.0073 | 0.0232 |
| TA | 1928 | 15.5755 | 1.6965 | 12.1835 | 14.4086 | 15.4032 | 16.4093 | 20.6987 |
| IBOR90 | 1928 | 0.0366 | 0.0105 | 0.0171 | 0.0286 | 0.0341 | 0.0463 | 0.0529 |
Note: N is the number of samples. mean is the average of the whole sample banks. s.d. is the standard variation of the whole sample. min, p25, p50, p75 and max are the minimum, 25% quantile, median, 75% quantile and maximum values of the whole sample, respectively. Source: authors calculation.
Table 2.
Pairwise correlations.
| NPL | CP | RR | LTV | RCP_B | MPI | ROE | LTD | NIAA | TA | IBOR90 | |
|---|---|---|---|---|---|---|---|---|---|---|---|
| NPL | 1 | ||||||||||
| CP | −0.165 *** | 1 | |||||||||
| RR | −0.483 *** | −0.222 *** | 1 | ||||||||
| LTV | 0.233 *** | 0.050 *** | −0.582 *** | 1 | |||||||
| RCP_B | −0.033 | 0.196 *** | −0.023 | 0.032 | 1 | ||||||
| MPI | −0.341 *** | −0.187 *** | 0.835 *** | −0.406 *** | −0.084 *** | 1 | |||||
| ROE | −0.190 *** | −0.117 *** | 0.119 *** | −0.132 *** | −0.133 *** | −0.054 ** | 1 | ||||
| LTD | −0.004 | 0.121 *** | −0.213 *** | 0.106 *** | 0.207 *** | −0.212 *** | −0.267 *** | 1 | |||
| NIA | −0.084 *** | 0.088 *** | 0.120 *** | 0.015 | 0.019 | 0.199 *** | −0.021 | −0.049 ** | 1 | ||
| TA | −0.042 * | −0.261 *** | 0.144 *** | −0.011 | −0.141 *** | 0.212 *** | 0.136 *** | −0.137 *** | 0.051 ** | 1 | |
| IBOR90 | −0.038 * | 0.014 | 0.153 *** | −0.317 *** | 0.005 | 0.038 ** | 0.156 *** | −0.024 | −0.079 *** | −0.075 *** | 1 |
Source: authors calculation. *, ** and *** denote significance of thresholds at 1%, 5% and 10%, respectively.
Table 3.
Estimation results of the system generalized method of moment (SYS-GMM).
| (1) | (2) | (3) | (4) | (5) | |
|---|---|---|---|---|---|
| NPL | NPL | NPL | NPL | NPL | |
| L.NPL | 0.620 *** | 0.586 *** | 0.585 *** | 0.548 *** | 0.537 *** |
| (25.88) | (22.03) | (23.59) | (18.13) | (16.87) | |
| CP | −0.0027 ** | −0.0019 * | −0.0022 * | ||
| (−2.30) | (−1.69) | (−1.86) | |||
| RR | −0.0959 *** | −0.0665 *** | −0.0466 * | ||
| (−3.93) | (−2.72) | (−1.90) | |||
| LTV | 0.0285 *** | 0.0194 *** | 0.0205 *** | ||
| (5.43) | (4.11) | (4.51) | |||
| RCP_B | −0.0645 ** | ||||
| (−2.37) | |||||
| LTD | 0.00517 | −0.00117 | 0.00178 | −0.00279 | 0.00429 |
| (1.58) | (−0.40) | (0.55) | (−0.94) | (1.22) | |
| ROE | −0.0615 *** | −0.0575 *** | −0.0589 *** | −0.0624 *** | −0.0580 *** |
| (−5.14) | (−5.18) | (−4.80) | (−4.88) | (−4.37) | |
| NIA | 0.240 ** | 0.218 ** | 0.215 ** | 0.212 ** | 0.236 ** |
| (2.44) | (2.29) | (2.30) | (2.31) | (2.41) | |
| TA | −0.00119 * | −0.000627 | −0.00168 ** | −0.00164 ** | −0.00160 ** |
| (−1.83) | (−1.14) | (−2.49) | (−2.31) | (−2.10) | |
| IBOR90 | 0.103 *** | 0.236 *** | 0.130 *** | 0.222 *** | 0.179 *** |
| (4.93) | (5.66) | (5.30) | (5.21) | (4.37) | |
| cons | 0.0173 | 0.0274 ** | 0.0294 ** | 0.0444 *** | 0.0358 ** |
| (1.18) | (2.22) | (2.17) | (3.04) | (2.37) | |
| N | 1845 | 1845 | 1845 | 1845 | 1845 |
| AR(2) | −0.37 | −0.38 | −0.50 | −0.56 | −0.79 |
| (0.713) | (0.702) | (0.62) | (0.579) | (0.427) | |
| Hansen | 4.02 | 4.21 | 2.89 | 5.01 | 1.19 |
| (0.675) | (0.378) | (0.822) | (0.543) | (0.977) |
Notes: t statistics are given in parentheses. *, ** and *** denote significance of thresholds at 1%, 5% and 10%, respectively. Source: authors calculation.
Table 4.
Robustness Checks: estimation results by the OLS.
| (1) | (2) | (3) | (4) | (5) | |
|---|---|---|---|---|---|
| NPL | NPL | NPL | NPL | NPL | |
| CP | −0.00588 *** | −0.00273 *** | −0.00288 *** | ||
| (−7.42) | (−3.89) | (−4.69) | |||
| RR | −0.230 *** | −0.204 *** | −0.197 *** | ||
| (−11.54) | (−10.19) | (−9.67) | |||
| LTV | 0.0932 *** | 0.0236 *** | 0.0239 *** | ||
| (8.38) | (2.65) | (2.70) | |||
| RCP_B | −0.0304 | ||||
| (−1.61) | |||||
| LTD | −0.00547 *** | −0.0125 *** | −0.00836 *** | −0.0116 *** | −0.00696 *** |
| (−3.23) | (−6.58) | (−4.84) | (−6.22) | (−3.42) | |
| ROE | −0.0451 *** | −0.0427 *** | −0.0413 *** | −0.0433 *** | −0.0404 *** |
| (−6.29) | (−6.51) | (−5.95) | (−6.67) | (−6.51) | |
| NIA | −0.158 *** | −0.0684 | −0.213 *** | −0.0565 | −0.0463 |
| (−2.60) | (−1.17) | (−3.51) | (−0.97) | (−0.81) | |
| TA | −0.00105 *** | −0.000478 ** | −0.000671 *** | −0.000685 *** | −0.000742 *** |
| (−4.02) | (−2.24) | (−2.87) | (−2.98) | (−3.69) | |
| IBOR90 | −0.0432 * | 0.0854 *** | 0.105 *** | 0.109 *** | 0.100 *** |
| (−1.67) | (2.86) | (2.95) | (3.18) | (3.04) | |
| cons | 0.0474 *** | 0.0779 *** | 0.0418 *** | 0.0782 *** | 0.0745 *** |
| (10.13) | (14.27) | (10.18) | (14.10) | (13.69) | |
| N | 1928 | 1928 | 1928 | 1928 | 1870 |
| adj.R-sq | 0.084 | 0.209 | 0.105 | 0.218 | 0.213 |
Notes: t statistics are given in parentheses. *, ** and *** denote significance of thresholds at 1%, 5% and 10%, respectively. Source: authors calculation.
Table 5.
Robustness Checks: Z-score for bank risk-taking and MPI for macroprudential policy.
| (1) | (2) | (3) | (4) | (5) | (6) | (7) | |
|---|---|---|---|---|---|---|---|
| Z-Score | Z-Score | Z-Score | Z-Score | Z-Score | NPL | NPL | |
| L.Z-score | 0.686 *** | 0.598 *** | 0.766 *** | 0.697 *** | 0.674 *** | ||
| (21.33) | (7.37) | (23.30) | (20.04) | (20.07) | |||
| L.NPL | 0.587 *** | 0.445 *** | |||||
| (23.38) | (9.78) | ||||||
| CP | 0.148 *** | 0.0471 *** | 0.0529 *** | ||||
| (7.27) | (4.60) | (5.29) | |||||
| RR | 1.545 ** | 0.903 | 0.803 | ||||
| (2.33) | (0.96) | (1.35) | |||||
| LTV | −0.112 * | −0.122 * | −0.0315 | ||||
| (−2.45) | (−2.68) | (−1.30) | |||||
| RCP_B | 1.551 *** | ||||||
| (3.35) | |||||||
| MPI | −0.0124 *** | −0.0155 *** | |||||
| (−3.59) | (−4.39) | ||||||
| MPI_B | −0.00242 *** | ||||||
| (−3.59) | |||||||
| LTD | 0.204 ** | 0.162 * | 0.388 *** | 0.408 *** | 0.258 ** | −0.00218 | 0.00561 |
| (2.05) | (1.68) | (3.83) | (3.60) | (2.56) | (−0.61) | (1.43) | |
| ROE | 0.127 | 0.0132 | 0.478 *** | 0.457 ** | 0.255 * | −0.0650 *** | −0.0554 *** |
| (0.85) | (0.07) | (2.93) | (2.39) | (1.74) | (−5.03) | (−4.42) | |
| NIA | 4.368 *** | 4.686 ** | 2.488 | 2.159 | 3.150 ** | 0.191 ** | 0.349 *** |
| (2.74) | (2.45) | (1.53) | (1.03) | (2.06) | (2.33) | (3.61) | |
| TA | 0.0320 *** | 0.0162 | 0.0107 | 0.0246 * | 0.0267 ** | −0.000527 | 0.000679 |
| (2.70) | (1.51) | (1.10) | (1.86) | (2.21) | (−1.10) | (1.31) | |
| IBOR90 | 1.015 ** | −1.130 | −0.346 | −1.445 | −0.195 | 0.123 ** | 0.236 *** |
| (1.98) | (−1.12) | (−0.74) | (−1.04) | (−0.21) | (2.47) | (5.25) | |
| cons | 0.0395 | 0.669 *** | 0.186 | 0.101 | 0.279 | 0.0481 *** | 0.0256 * |
| (0.16) | (2.62) | (0.97) | (0.45) | (1.36) | (3.50) | (1.93) | |
| N | 1085 | 1085 | 1085 | 1085 | 1085 | 1845 | 1845 |
| AR(2) | −1.63 | 0.32 | −0.07 | −0.92 | −1.24 | −0.33 | −0.42 |
| (0.104) | (0.751) | (0.965) | (0.360) | (0.215) | (0.740) | (0.674) | |
| Hansen | 0.36 | 3.79 | 5.33 | 4.83 | 0.16 | 1.93 | 3.40 |
| (0.986) | (0.435) | (0.255) | (0.305) | (0.999) | (0.587) | (0.182) |
Notes: t statistics are given in parentheses. *, ** and *** denote significance of thresholds at 1%, 5% and 10%, respectively. Source: authors calculation.
© 2018 by the authors. Licensee MDPI, Basel, Switzerland. This article is an open access article distributed under the terms and conditions of the Creative Commons Attribution (CC BY) license (http://creativecommons.org/licenses/by/4.0/).
Share and Cite
MDPI and ACS Style
Zhang, X.; Li, F.; Li, Z.; Xu, Y. Macroprudential Policy, Credit Cycle, and Bank Risk-Taking. Sustainability 2018, 10, 3620. https://doi.org/10.3390/su10103620
AMA Style
Zhang X, Li F, Li Z, Xu Y. Macroprudential Policy, Credit Cycle, and Bank Risk-Taking. Sustainability. 2018; 10(10):3620. https://doi.org/10.3390/su10103620
Chicago/Turabian StyleZhang, Xing, Fengchao Li, Zhen Li, and Yingying Xu. 2018. "Macroprudential Policy, Credit Cycle, and Bank Risk-Taking" Sustainability 10, no. 10: 3620. https://doi.org/10.3390/su10103620
Note that from the first issue of 2016, this journal uses article numbers instead of page numbers. See further details here.