The Projected Impact of a Neighborhood-Scaled Green-Infrastructure Retrofit

Department of Landscape Architecture and Urban Planning, Texas A&M University, College Station, TX 77843, USA
*
Author to whom correspondence should be addressed.
Sustainability 2018, 10(10), 3665; https://doi.org/10.3390/su10103665
Submission received: 12 September 2018
/
Revised: 10 October 2018
/
Accepted: 11 October 2018
/
Published: 13 October 2018
(This article belongs to the Special Issue Urban Green Infrastructure and Climate Adaptation)
Abstract
:Climate change and its related factors are increasing the frequency of hurricanes, coastal storms, and urban flooding. Recovery from disasters can be slow, with jurisdictions failing to rebuild better, wasting time and money without improving resilience for the next disaster. To help attenuate floods and mitigate their impact, Low-Impact Development (LID) and the incorporation of green infrastructure (GI) is gaining in popularity. LID includes more natural methods of absorbing, redirecting, retaining, and filtering water through GI installations such as rain gardens, detention ponds, and the reduction of impervious surfaces. LID is, however, primarily implemented and evaluated only on a local scale; few studies have assessed the broader impact of GI on a larger scale. In fact, most performance calculators that evaluate the effects of GI are only useful at the site scale. Further, most GI advocates propose its use in new developments without much attention to retrofitting existing suburban development. This article seeks to determine what the potential effects of retrofitting an existing suburban neighborhood with GI for flood protection at a larger scale could be, using Sugar Land, Texas, United States as a case site. First, low-impact facilities are proposed and schematically designed at a site scale for a typical single-family lot. The volume of rainfall that can be retained on site, due to each incorporated feature, was then derived using the Green Values National Stormwater Management Calculator. Using these data, the total volume of rainfall that could be retained if all residential sites in Sugar Land incorporated similar facilities was then projected. The results show that Sugar Land has the capacity to annually capture 56 billion liters of stormwater if all residential properties use LID. Additional benefits of the use of GI include reduced heat (37%), improved aesthetics and property values (20%), increased recreational opportunities (18%), improved water quality (12%), improved air quality (5%), increased green collar jobs (4%), reduced damage from harmful gas emissions (3%), and increased energy savings (1%), thereby surpassing conventional stormwater management techniques.
1. Introduction
Infrastructure issues and conditions can significantly contribute to flood mitigation efforts during disaster events [1]. Headlines like these were seen after Hurricane Harvey impacted Texas: “Water rescues increase in Sugar Land, TX as flood levels rise” [2]; “Texas sheriff asks residents to leave the Sugar Land community due to flooding” [3]; “The mayor of Rockport, TX, suggests people to mark their arms with their name and social security number in case flooding threatens their lives” [4]. Headlines like these, seen across the United States and the rest of the world, demonstrate some of the reasons due to which cities need to develop more comprehensive mitigation strategies to address both property damage and deaths caused by flooding. One of the primary reasons for increased flooding is amplified amounts of impervious surfaces due to development [5]. The urban land area in North America quadrupled between 1945 and 2010 [6]. When urban areas grow, and especially when they sprawl, impervious surface coverage increases, altering watershed hydrology [7], reducing or eradicating native vegetation and soil layers that intercept, absorb, store, and filter stormwater. Less infiltration by vegetation and soil leads to reduced pollutant filtering [8]. The resulting increase in both runoff volume and intensity erodes streams/banks, degrades stream ecosystems, and displaces organisms [9].
Conventional stormwater management (also called “gray infrastructure”) in the United States consists of a system of pipes, tunnels, gutters, pumps, culverts, basins, and other systems that help to capture and convey runoff from urban areas to natural areas, such as watersheds and rivers [10]. Conventional methods, however, can cause rainwater to pick up pollutants such as fertilizers, pesticides, chemicals, pet waste, and debris, which eventually make their way into larger waterbodies, negatively affecting the ecosystem [11]. Thus, conventional stormwater management through engineered infrastructure can increase water pollution. It can also have several other drawbacks, including high maintenance, high installation costs, and aesthetic problems. While engineered infrastructure is typically linked to most development, Low-Impact Development (LID) techniques can help address flood issues, improve water quality [12], improve groundwater recharge capacity [13], and help mitigate the effects of changing climate, water scarcity, and urban sprawl [14]. In the United States, local ordinances guide the design and construction of any new development, but these ordinances are often outdated [15]. Some of the most frequent challenges faced by developers who contemplate the use of LID are restrictive local ordinances, lack of funding, local officials, and citizen opposition to the approach due to lack of awareness and the common misconception that green infrastructure (GI) is expensive and difficult to maintain [16]. However, careful planning, collaboration with the government, and education programs to address lack of knowledge can reduce these challenges [17], and assist in mitigating the impacts of flooding.
In the current research, there are few sources comparing the results of incorporating conventional stormwater-management techniques to GI techniques, even at site scale. This article seeks to bridge this gap by examining this difference. The article highlights the benefits of incorporating GI techniques as a supplement to conventional stormwater-management techniques. To achieve this, the article describes LID, its goals, benefits, GI facilities, and how it compares to conventional stormwater management. A methodological discussion and a description of the step-by-step process utilized to develop and measure the impact of the described LID site plan follows. Calculations on how much water each GI feature in the site plan can capture are described, based on Green Values National Stormwater Calculator outputs. Costs, performance measures, and benefits of using LID techniques versus conventional stormwater-management techniques are then compared and discussed.
2. Literature Review
Stormwater runoff can result in flood damage when large amounts of precipitation collect on the ground glide over impervious surfaces without being absorbed [18]. Ideally, cities should seek to alleviate water pollution and the consequences of standing water during floods while simultaneously using opportunities to reuse urban space and improve neighborhoods. LID is a land-use planning and design approach that seeks to mitigate urban impact on the environment by treating stormwater at its source [5]. LID works by reducing runoff from impervious areas by slowing and filtering water to reduce pollutants and sediment amounts before they reach the mainstream network [19]. GI, natural features used to manage stormwater runoff, are a large part of LID facilities [20].
Residential land uses make up 85% of urban land uses in the United States [21]. In general, most U.S. residential areas have large amounts of turf areas or manicured landscapes and an abundance of impervious surfaces created by roadways, driveways, sidewalks, and rooftops. These large expanses of impervious surfaces can result in excessive volumes of stormwater runoff [22]. Therefore, the need to manage stormwater runoff in already developed sites and areas should be considered a priority. While future developments may be required to meet contemporary stormwater regulations, older developments are larger in number, and constructed well before the need for severe stormwater management was recognized. The previous literature suggests that retrofitting LID into exiting residential lots could have important implications on urban stormwater management, especially when done in a larger scale [23]. Although retrofitting LID facilities into already developed communities can come with various challenges due to previously existing infrastructure and utilities, it has been found to increase infiltration volume, reduce peak discharges and runoff rates by half, and double concentration time [24].
No space is useless and, therefore, a successful LID retrofit should evaluate various design alternatives and consider site-specific constraints. Communities can benefit greatly from retrofitting green infrastructure into their homes and lots as stormwater effects are collectively managed. In addition, property owners can protect air and water quality, reduce heat-island effects, reduce utility maintenance costs, increase property values, and save money due to water conservation and tax incentives [25].
As noted, an effective LID technique controls stormwater from its source, using nonstructural methods and natural onsite features [26]. Some LID techniques that can be used for retrofitting in a residential site are:
- Vegetated filtered strips: strips of land planted with native vegetation that usually acts as a buffer between a waterway and impervious surfaces.
- Bioretention facilities: Shallow landscape depressions that consist of a mix of plants and soil and are designed to closely mimic natural forested conditions [5]. Rain gardens and bioswales fall under this category:
- i.
- Rain gardens—depressed landscape areas constructed using high-permeability media such as soil, organic matter, and plants that collect rainwater from roofs, streets, or driveways and allow it to soak into the ground [27].
- ii.
- Bioswales—linear vegetated or mulched channels that slope gently to reduce and slow stormwater runoff while acting as a filter for pollutants and are mostly placed near parking lots [28].
- Permeable pavement: allows water to infiltrate and be absorbed through surfaces that would otherwise be impermeable [29]. The general categories of permeable paving systems include porous hot-, warm-, or mixed-asphalt pavement; pervious Portland cement concrete; permeable interlocking concrete pavement (PICP); and concrete/plastic grid systems [5].
- Green roofs: typically consisting of a rooftop planted with vegetation over a waterproof material/membrane that may include a drainage or irrigation system [30].
- Rainwater harvesting: uses under- or aboveground storage containers to capture stormwater runoff that can then be used for other purposes, such as irrigation.
The suitability of a LID technique or combination of techniques varies according to the physical constraints and opportunities of a site. Physical factors that must be considered to determine suitability include the amount of space available, soil permeability, distance of slopes from water table/bedrock, proximity to building foundations, depth requirements, and maintenance needs of the homeowner [31]. Studies show that once residents understand the low-impact benefits on their local water quality, they are more likely to accept and support alternatives and LID-based technologies [32]. To encourage homeowners to retrofit LID into their property, the government can offer incentives such as reduced impact fees, development fees, and density bonuses to help offset additional costs. Further, local government can prepare educational campaigns and employ LID consultants to work in neighborhoods to raise awareness.
3. Materials and Methods
3.1. Study Area
Houston, TX has experienced increases in development and impervious surfaces such as roads, parking lots, sidewalks, or any land cover with concrete and asphalt, which can exacerbate the effects of flooding through limiting infiltration opportunities [33]. Further, new development replaces natural facilities such as the Katy Prairie, a large area west of Houston that has long acted as a sponge for absorbing water [34]. In a flat area like Houston, the soil is compacted and sheets of water are sent to low-lying areas nearby. According to the Houston Chronicle, between 2001 and 2011, Fort Bend County (the county in which Sugar Land is located) had a 53% increase in impervious surface. The increase in pavement in the Houston region alone between 1996 and 2011 was 25%. This could potentially be a major problem as, “on an average, every square meter of pavement/ impervious surface, translates into around $4000 of flood damage” [35].
Sugar Land has an average elevation of 30 m and two major waterways that run through the city (Figure 1). The Brazos River runs through the southern and southwestern portion of the city, and Oyster Creek runs through the eastern and the northwestern part of the city [37]. Many other artificial lakes connect Oyster Creek and the Brazos River with the city’s communities. Therefore, it is often susceptible to flooding [38]. Many neighborhoods in Sugar Land that have potential flooding issues are currently being protected by a levee, as most of Sugar Land lies within the 100- and 500-year-old flood plains also known as high-risk areas [38].
The chosen site (Figure 2) is in a neighborhood in Sugar Land called Abbott Circle that is located 30 min away from Houston. The site was chosen as a repressive location because (1) it is susceptible to flooding, (2) there is a large degree of impervious development and minimal green infrastructure, (3) the site has clay soils and slow/low infiltration rates, and (4) is it developed as a typical suburban community in Texas with small, single-family lots. To protect the anonymity of existing residents, the exact location is not disclosed. The site, a typical single-family residential parcel, is a 0.28 acre parcel located in a suburban area. The slope is nearly flat, and the site has a total of 5 existing trees. The soils include mostly clay, and thus do not drain well. The total impervious cover of the site is 34%, which includes 93.92 m2 of impervious pavement in the driveway, and 273.97 m2 of roof/built-up areas. Due to these existing conditions and clayey soils, stormwater-runoff infiltration is severely limited.
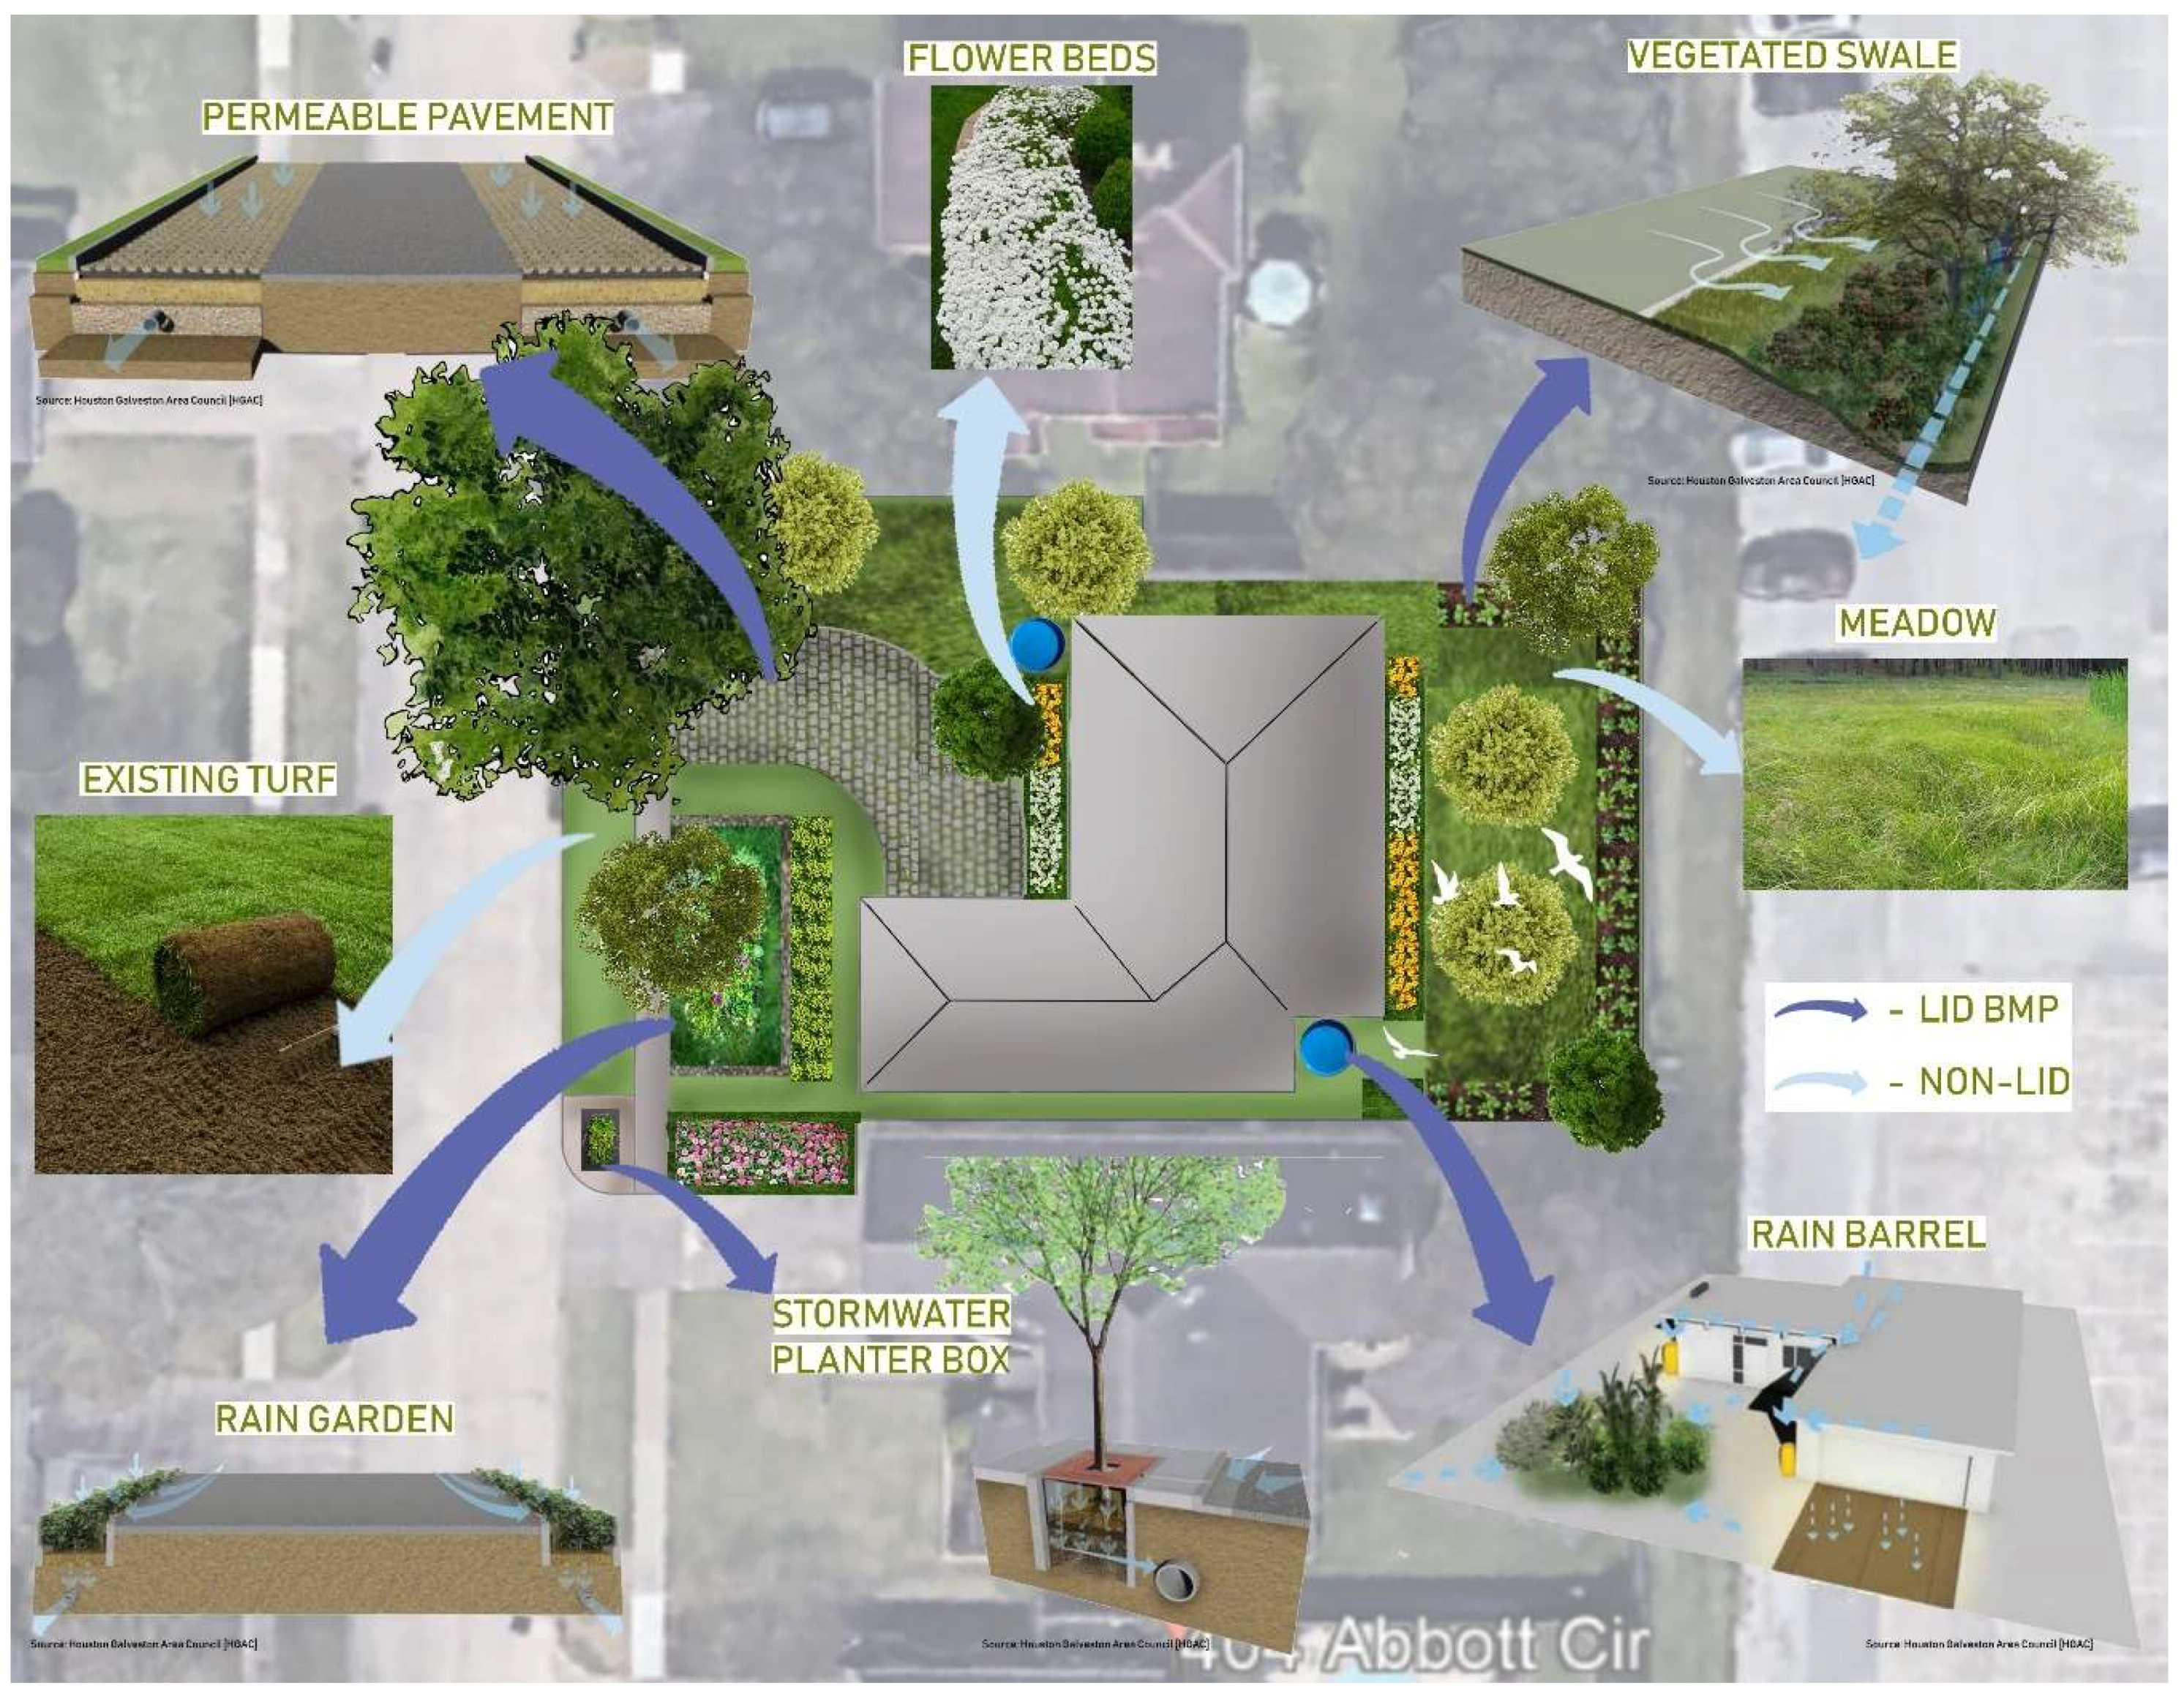
To manage stormwater runoff, a series of LID facilities were proposed in strategic, retrofitted locations based on certain their location and the functionality needed to assist in stormwater treatment (Figure 3). The 6 utilized facilities are described below:
- Permeable pavement: the impervious driveway can be replaced with pervious material, such as grass pavers (concrete pavers that allow grass to grow in between) [5], so water seeps through, into the underlying soil, instead of running to nearby sewers.
- Vegetated swale: These are proposed closer to the building so that runoff from downspouts can be directed into them. Curb openings from the adjacent parking lot also allow stormwater to enter these landscaped features, and natural features slow runoff volume and allow for more infiltration.
- Rain barrel: Two rain barrels, each with a capacity of 757 L, are proposed on either side of the building and connected to downspouts to decrease rooftop runoff. Since rain barrels can be easily installed and maintained by single-family homes, they can be used to collect water from the roof through a downspout. Stored rainwater can then be utilized for irrigation purposes.
- Stormwater planter boxes: These vegetated, enclosed stormwater storage basins must have an underdrain and are usually enclosed in a concrete container with porous soil and plants to capture runoff [17]. They are proposed near sidewalks to capture runoff from impermeable surfaces, provide optimal urban streetscapes, and increase permeability.
- Rain garden: Since these systems typically have an underdrain [17], they can be placed near sidewalks or in vast swaths of grasslands. It is proposed in the front of the building to be aesthetically appealing as well as to be in an existing depression/topographical low point.
- Additional trees (shown in light green) and flower beds: these are proposed to decrease the turf area and effectively slow and clean stormwater runoff.
3.2. Methodology
The methodological approach followed a 3-step process. First, the site was assessed examining setbacks, soil infiltration rates, and surrounding development. The second step was to determine the appropriate LID best management practices and ideal locations to install facilities through a preliminary low-impact design. Third, GI Best Management Practices (BMPs) and their sizes were adjusted according to location, site constraints, and cost estimates. The above steps were repeated until requirements and goals were met. To calculate the benefits derived from the proposed GI BMPs and how they compare to convectional stormwater management techniques, the parameters of the final site plan were entered into the Green Values National Stormwater Calculator [39].
In 2010, the Center for Neighborhood Technology developed formulas to determine the volume of rainfall that is retained on the site due to each LID technique used. The National Green Values Calculator is an online tool developed to compare GI costs, benefits, and performance compared to conventional stormwater-management practices [39]. It has been used to assess the impact of stormwater-management practices on water quality [40], adaptive capacity [41], runoff capture [42], and GI impact on new housing [43], Using the calculator formulas, the total runoff reduction due to the LID retrofit design was calculated. Table 1 shows the input data used from Sugarland’s site characteristics into the National Green Values Calculator.
The Green Values National Stormwater Management Calculator [39] is also a tool for calculating and comparing the costs, performance, and benefits of using Green Infrastructure with conventional stormwater-management techniques. This calculator considers the site-specific features that were entered (in Table 1).
Table 2 shows the measurements and specifications of LID green improvements that were entered into the National Stormwater Management Calculator based on the proposed GI site plan in Figure 3. These inputs were used to compare conventional development, or development without green infrastructure, to the low-impact retrofit design. The calculator generated results based on all the above information (from Table 1 and Table 2).
4. Results and Analysis
Table 3 shows total runoff reduction, while Table 4 shows values for different parameters when conventional stormwater management is used and when GI is used in the site. The total number of households in Sugar Land is 28,020, out of which 81.9% are owner-occupied [44]. According to the output data, if LID techniques are incorporated into the all these houses (using identical design specifications), Sugar Land can see an annual reduction of 56 billion liters of stormwater (reduction of 2.611 million liters × 22,696 houses) from exacerbating flood conditions (Table 3).
After adding LID techniques/green improvements, there is a dramatic change in the capacity of the site to retain more water. Overall, we see that the benefits of using GI features on site surpass conventional stormwater management. In terms of volume control, stormwater captured by GI BMPs is 25.7 m3, which is 25 times the volume captured by conventional development. This means that more stormwater is captured and infiltrated on site. The total runoff volume when GI is used is 1292.46 m3, which is 79.6 m3 less than conventional stormwater management (Table 4). This suggests that the volume of water running to major water bodies and contributing to increased flooding is reduced when GI is used. The total pervious area in the site when GI is incorporated is 932.5 m2, which is 190.9 m2 more than conventional stormwater management. This indicates a 49% decrease in impervious surfaces when LID is used, allowing more permeability.
Unlike typical water damage from rainfall or plumbing issues, flood damage is more severe due to the movement of the water that often brings considerable lateral force with it, which can impact the structural integrity of buildings. Repairing flood damage usually involves not only the pipe repair and water removal, but can also involve excavation and reinforcement of building foundation, which is something that cannot be handled by home owners or occupants, as it involves large equipment and machinery [46]. This can cost a lot of money from the inspection stage to the final repair stage. In Sugar Land, the average total cost to clean up flood damage for 19.97 sq.m. is $3155, in addition to flood-damage labor ($2521.73 for 33.4 h), and job materials and supplies cost ($633.27 for 18.6 sq.m.) [46]. The construction cost of installing LID is $37,206 higher than conventional development, and the annual maintenance cost is $602 higher. Although the cost for LID is higher than conventional development, there are various other benefits that GI can offer and pay back in time that surpass conventional stormwater-management techniques. GI reduces air pollutants, provides compensatory values for trees, replenishes groundwater, and reduces treatment costs. The total annual benefits that LID offers are $1106, while the total life-cycle benefit is $35,050 more than conventional stormwater management.
5. Conclusions
This paper distills the impact that can be reaped by retrofitting GI on a large scale compared to conventional stormwater management. Overall, the National Stormwater Management Calculator shows that retrofitting LID into residential lots has important implications on urban stormwater management, especially when done on a larger scale. Through a GI retrofit of single-family lots, Sugar Land can achieve a reduction of 56 billion liters of stormwater annually. In addition, the results implicate that the installation cost of LID BMPs is affordable, easy to maintain, and offers various other environmental benefits to the community. These findings are similar to other research using the Green Values Calculator that also found long-term economic benefits and stormwater reduction [40,41,42,47].
Traditional stormwater approaches aim to convey runoff off-site to a combined sewer system, to receiving waters, or to a regional facility. But these designs also need supplemental infrastructure that demands costs. In contrast, LID techniques reduce the amount of materials required for paving or installing curbs and gutters. In addition, GI practices can offset costs related to regulatory stormwater requirements. In urban redevelopment projects, the land is unlikely to be available for stormwater-management practices, and, in cases like this, developers can employ various BMPs that are dispersed within the site, thereby avoiding penalties or fees that many municipalities charge when mitigation requirements are not met.
In addition, the city can also address flooding concerns, improve water quality, protect aquatic habitats, mitigate the urban heat-island effect, and balance increased population density by incorporating LID. It should be noted that the calculator estimates outcomes based on available information such as soil type, landscape, land-use information, and historical weather. These estimates can be affected by limitations on site-specific information and uncertainties about climate conditions in the future.
It should be noted that this paper is the first attempt to scale up findings to a broader area using local and community-scaled landscape performance data. To ensure stronger generalizability, future monitoring and assessments are needed using similar methods across differing localities to confirm or challenge these results. The field of landscape performance studies is quite young, and validation of such innovative approaches to operationalizing these tools is continually needed.
Author Contributions
Conceptualization, M.T. and G.N.; methodology, M.T.; software, M.T. and G.N.; validation, M.T., G.N., and S.V.Z.; formal analysis, M.T.; investigation, M.T.; resources, M.T. and G.N.; data curation, M.T.; writing—original draft preparation, M.T.; writing—review and editing, G.N. and S.V.Z.; visualization, M.T.; supervision, G.N. and S.V.Z.; project administration, M.T., G.N., and S.V.Z.; funding acquisition, G.N.
Funding
The research reported in this publication was supported by the National Institute of Environmental Health Sciences of the National Institutes of Health under Award Number P42ES027704, the Superfund Research Program (https://superfund.tamu.edu/).
Acknowledgments
Thank you to the Center for Housing and Urban Development, the Institute for Sustainable Communities, and the Hazard Reduction and Recovery Center at Texas A and M University for their support on this research. The open access publishing fees for this article have been covered by the Texas A&M University Open Access to Knowledge Fund (OAKFund), supported by the University Libraries and the Office of the Vice President for Research.
Conflicts of Interest
The authors declare no conflict of interest.
References
- U.S. Environmental Protection Agency. Green Infrastructure Case Studies: Municipal Policies for Managing Stormwater with Green Infrastructure; U.S. Environmental Protection Agency: Washington, DC, USA, 2010; Volume 32.
- USA Today. Water Rescues at Sugar Land as Flood Levels Rise. Available online: https://www.usatoday.com/videos/news/nation/2017/08/28/water-rescues-sugar-land-flood-levels-rise/105057798/ (accessed on 10 November 2017).
- CBS News. Texas Sheriff Asks Residents to Leave Sugar Land Community. Available online: https://www.cbsnews.com/video/texas-sheriff-asks-residents-to-leave-sugar-land-community/ (accessed on 10 November 2017).
- ABC News. Mayor Tells Those Not Evacuating for Hurricane to Put Social Security Numbers on Arms. Available online: https://abcnews.go.com/US/mayor-tells-evacuating-hurricane-harvey-put-social-security/story?id=49417573 (accessed on 10 November 2017).
- Hinman, C. Low Impact Development: Technical Guidance Manual for Puget Sound; Puget Sound Action Team: Olympia, WA, USA, 2005; Volume 8.
- Krannich, J.M. A Modern Disaster: Agricultural Land, Urban Growth, and the Need for a Federally Organized Comprehensive Land Use Planning Model. Cornell J. Law Public Policy 2006, 16, 104. [Google Scholar]
- Shuster, W.D.; Bonta, J.; Thurston, H.; Warnemuende, E.; Smith, D.R. Impacts of impervious surface on watershed hydrology: A review. Urban Water J. 2005, 2, 263–275. [Google Scholar] [CrossRef]
- Food and Agriculture Organization. Available online: http://www.fao.org/docrep/010/a1598e/a1598e03.htm (accessed on 24 September 2018).
- USGS. Effects of Urbanization on Stream Ecosystems. Available online: https://www.usgs.gov/media/audio/effects-urbanization-stream-ecosystems (accessed on 10 November 2017).
- Static Sustainability. Available online: https://static.sustainability.asu.edu/giosMS-uploads/sites/22/2015/01/Mesa-LID-Report.pdf (accessed on 11 November 2017).
- Tsihrintzis, V.A.; Hamid, R. Modeling and management of urban stormwater runoff quality: A review. Water Resour. Manag. 1997, 11, 136–164. [Google Scholar] [CrossRef]
- Independent Building Corp. We are a Low Impact Development. Available online: http://independentbuildingcorp.com/low-impact-development/ (accessed on 11 November 2017).
- Newcomer, M.E.; Gurdak, J.J.; Sklar, L.S.; Nanus, L. Urban recharge beneath low impact development and effects of climate variability and change. Water Resour. Res. 2014, 50, 1716–1734. [Google Scholar] [CrossRef] [Green Version]
- Pyke, C.; Warren, M.P.; Johnson, T.; LaGro, J.; Scharfenberg, J.; Groth, P.; Freed, R.; Schroeer, W.; Main, E. Assessment of low impact development for managing stormwater with changing precipitation due to climate change. Lands. Urban Plan. 2011, 102, 166–173. [Google Scholar] [CrossRef]
- A Review of Municipal Ordinances for Sustainable Development. Available online: http://www.myfloridagreenbuilding.info/pdf/Review_Municipal_Ord.pdf (accessed on 11 November 2017).
- Matthews, T.; Lo, A.Y.; Byrne, J.A. Reconceptualizing green infrastructure for climate change adaptation: Barriers to adoption and drivers for uptake by spatial planners. Lands. Urban Plan. 2015, 138, 155–163. [Google Scholar] [CrossRef]
- Houston—Galveston Area Council [HGAC]. A Regional Guide to Low Impact Development. Available online: http://www.h-gac.com/community/low-impact-development/documents/Designing-For-Impact-Guide-for-Governments.pdf (accessed on 24 September 2018).
- Moglen, G. Hydrology and impervious areas. J. Hydrol. Eng. 2009, 14, 303–304. [Google Scholar] [CrossRef]
- Mayer, P.; Reynolds, K.S.; McCutchen, M.D.; Canfield, T.J. Meta-Analysis of Nitrogen Removal in Riparian Buffers. J. Environ. Qual. 2007, 36, 1172–1180. [Google Scholar] [CrossRef] [PubMed]
- U.S. Environmental Protection Agency [EPA]. Green Infrastructure. Available online: https://www.epa.gov/green-infrastructure/what-green-infrastructure (accessed on 24 September 2018).
- Reja, M.Y.; Brody, S.; Highfield, W.; Newman, G. Hurricane Recovery and Ecological Resilience: Measuring the Impacts of Wetland Alteration Post Hurricane Ike on the Upper TX Coast. J. Environ. Manag. 2017, 60, 1116–1126. [Google Scholar] [CrossRef] [PubMed]
- Todeschini, S. Hydrologic and Environmental Impacts of Imperviousness in an Industrial Catchment of Northern Italy. J. Hydrol. Eng. 2016, 21, 05016013. [Google Scholar] [CrossRef]
- Sohn, W.; Kim, J.H.; Newman, D.G. A Blueprint for Stormwater Infrastructure Design: Implementation and Efficacy of LID. Lands. Res. Rec. 2014, 2, 50–61. [Google Scholar]
- Research Gate. Retrofitting Urban Residential Areas with L.I.D Techniques: Impact on Stormwater Runoff. Available online: https://www.researchgate.net/publication/283665654_RETROFITTING_URBAN_RESIDENTIAL_AREAS_WITH_LID_TECHNIQUES_IMPACT_ON_STORMWATER_RUNOFF (accessed on 24 September 2018).
- U.S. Environmental Protection Agency [EPA]. Urban Runoff: Low Impact Development. Available online: https://www.epa.gov/nps/urban-runoff-low-impact-development (accessed on 24 September 2018).
- Science Direct. Identifying Priority Sites for Low Impact Development (LID) in a Mixed-Use Watershed. Available online: https://www.sciencedirect.com/science/article/pii/S016920461500078X#bib0150 (accessed on 23 November 2017).
- U.S. Environmental Protection Agency [EPA]. Soak Up the Rain: Rain Gardens. Available online: https://www.epa.gov/soakuptherain/soak-rain-rain-gardens (accessed on 23 November 2017).
- Michigan State University. Bioswales Can Improve Water Quality Resources. Available online: http://msue.anr.msu.edu/news/bioswales_can_improve_water_quality_resources (accessed on 16 October 2017).
- North Carolina Department of Environment and Natural Resources (NCDENR). NCDENR Stormwater BMP Manual. Chapter 18. Available online: http://swpermits.nc.gov/c/document_library/get_file?uuid=473e686c-ac2a-4a09-9f2c-fcb709bceb6b&groupId=38364 (accessed on 12 September 2018).
- How Stuff Works. What Is a Green Roof? Available online: https://science.howstuffworks.com/environmental/green-science/green-rooftop.htm (accessed on 16 October 2017).
- Hudson County Planning Board. Low Impact Development & Best Management Practices. Available online: https://nacto.org/docs/usdg/sustainable_stormwater_management_hudson_county.pdf (accessed on 16 October 2017).
- Sarvilinna, A.; Lehtoranta, V.; Hjerppe, T. Willingness to participate in the restoration of waters in an urban–rural setting. Environ. Sci. Policy 2018, 85, 11–18. [Google Scholar] [CrossRef]
- McGuire, K. Houston’s Development Boom and Reduction of Wetlands Leave Region Flood Prone. Available online: https://www.houstonchronicle.com/news/houstontexas/houston/article/Houston-s-development-boom-and-reduction-of-8403838.php (accessed on 10 September 2018).
- Houston Wilderness. Ecosystem Services in the Greater Houston Region a Case Study Analysis and Recommendations for Policy initiatives. Available online: https://pdfs.semanticscholar.org/presentation/3129/c5e301dba388d9ed6845ac6b5adfc497957c.pdf (accessed on 10 September 2018).
- Brody, S. Houston Flood Damage: Chronic, Expensive, and Avoidable. Available online: https://www.cnbc.com/2016/04/20/houston-flood-damage-chronic-expensive-and-avoidable.html (accessed on 24 September 2018).
- FEMA Flood Map Service Center. Available online: https://msc.fema.gov/portal/home (accessed on 20 September 2018).
- Sugar Land, Texas. Available online: https://en.wikipedia.org/wiki/Sugar_Land,_Texas (accessed on 10 December 2017).
- Sugar Land Flood Zones. Available online: http://www.sugarlandtxhome.com/sugar-land/sugar-land-flood-zones (accessed on 10 December 2017).
- Green Values Calculator. Available online: http://greenvalues.cnt.org/calculator/calculator.php (accessed on 10 May 2018).
- Liu, Y.; Theller, L.O.; Pijanowski, B.C.; Engel, B.A. Optimal selection and placement of green infrastructure to reduce impacts of land use change and climate change on hydrology and water quality: An application to the Trail Creek Watershed, Indiana. Sci. Total Environ. 2016, 553, 149–163. [Google Scholar] [CrossRef] [PubMed]
- Wen, M.; Zhang, X.; Harris, C.D.; Holt, J.B.; Croft, J.B. Spatial disparities in the distribution of parks and green spaces in the USA. Ann. Behav. Med. 2013, 45 (Suppl. 1), 18–27. [Google Scholar] [CrossRef] [PubMed]
- Carson, T.; Keeley, M.; Marasco, D.E.; McGillis, W.; Culligan, P. Assessing methods for predicting green roof rainfall capture: A comparison between full-scale observations and four hydrologic models. Urban Water J. 2017, 14, 589–603. [Google Scholar] [CrossRef]
- Wright, T.J.; Liu, Y.; Carroll, N.J.; Ahiablame, L.M.; Bernard, B.A. Retrofitting LID practices into existing neighborhoods: Is it worth it? Environ. Manag. 2016, 57, 856–867. [Google Scholar] [CrossRef] [PubMed]
- The United States Census Bureau. Quick facts of Sugar Land City. Available online: https://www.census.gov/quickfacts/fact/table/sugarlandcitytexas/HSG445216#viewtop (accessed on 13 December 2017).
- The Center for Neighborhood Technology. The Value of Green Infrastructure—A Guide to Recognizing its Economic, Environmental and Social Benefits. Available online: http://www.cnt.org/sites/default/files/publications/CNT_Value-of-Green-Infrastructure.pdf (accessed on 12 September 2018).
- Homeyou. How Much Does It Cost to Repair Flood Damage in Sugar Land? Available online: https://www.homeyou.com/tx/flood-damage-repair-sugar-land-costs (accessed on 12 September 2018).
- Foster, J.; Lowe, A.; Winkelman, S. The value of green infrastructure for urban climate adaptation. Center Clean Air Policy 2011, 750, 1–52. [Google Scholar]
Figure 1.
The Federal Emergency Management Agency (FEMA) 100 year floodplain in Sugar Land, Texas (GIS Data from FEMA [36]; Generated using ArcMAP 10.4 (Esri, Redlands, CA, USA).
Figure 1.
The Federal Emergency Management Agency (FEMA) 100 year floodplain in Sugar Land, Texas (GIS Data from FEMA [36]; Generated using ArcMAP 10.4 (Esri, Redlands, CA, USA).

Figure 2.
Site plan before Low-Impact Development (LID) (generated using Google Earth Pro 2017: Mountain View, CA, USA; version, and Adobe Photoshop, CC version: San Jose, CA, USA).
Figure 2.
Site plan before Low-Impact Development (LID) (generated using Google Earth Pro 2017: Mountain View, CA, USA; version, and Adobe Photoshop, CC version: San Jose, CA, USA).

Figure 3.
Site plan after being equipped with listed LID Facilities (generated using Google Earth Pro 2017: Mountain View, CA, USA; version, and Adobe Photoshop, CC version: San Jose, CA, USA).
Figure 3.
Site plan after being equipped with listed LID Facilities (generated using Google Earth Pro 2017: Mountain View, CA, USA; version, and Adobe Photoshop, CC version: San Jose, CA, USA).


Table 1.
Lot information enterted into the National Stormwater Management Calculator.
| Lot Information | |
| Zip Code | 77498 |
| Annual Rainfall (cm) | 125.83 |
| Storm Type * | 85% |
| Storm Rainfall (cm) | 2.6 |
| Size of Lot (sq.m) | 1133.12 |
| Soil Type | D (clayey soil) |
| Predevelopment Conditions | |
| Impervious Area (%) | 34 |
| Lawn in good condition | 30 |
| Runoff Volume Reduction Goal | |
| Goal | North Carolina Ordinance |
| Precipitation Depth (cm) | 3.81 |
| Volume captured over | Whole Site |
| Required Volume to capture on Site (m3) | 11.80 |
| Existing Conventional Development | |
| Impervious Area | |
| Roof Size (m2) | 274.02 |
| Driveways and Alleys Area (m2) | 93.9 |
| Other Land Cover | |
| Total Impervious Area (%) | 34 |
| Lawn in good condition (%) | 30 |
* Calculated by taking standard daily rainfall values (removing all records less than one-tenth of an inch), arranging from smallest to largest, and finding the value for which 85% of all the values are less.
Table 2.
Green improvement inputs used in the National Stormwater Management Calculator.
| Planter Boxes (Disconnected Downspout) | |
| Area (sq.m.) | 2.22 |
| Soil: 1. Depth (cm) 2. Porosity (Void Ratio) | 30.48 0.25 |
| Underlying Aggregate: 1. Depth (cm) 2. Porosity (Void Ratio) | 30.48 0.35 |
| Rain Garden (Disconnected Downspout) | |
| Amount (m3) | 43 |
| Prepared Soil: 1. Depth (cm) 2. Porosity (Void Ratio) | 30.48 0.35 |
| Underlying Aggregate: 1. Depth (cm) 2. Porosity (Void Ratio) | 30.48 0.25 |
| Rain Barrels (Disconnected Downspout) | |
| Rain Barrel Capacity (liters) 2 nos. | 757.08 each |
| Native Vegetation | |
| Amount (%) | 80 |
| Vegetation Filter Strips | |
| Area (m2) | 46.07 |
| Depth of Prepared Soil (cm) | 30.48 |
| Porosity of Prepared Soil (cm) | 0.89 |
| Trees | |
| Quantity | 4 |
| Average Canopy (sq. m.) | 18.6 |
| Average Tree Box: Width (m) Length (m) | 1.2 1.2 |
| Depth of Prepared Soil (cm) | 121.9 |
| Porosity of Prepared Soil | 0.35 |
| Permeable Pavement on Driveways | |
| Amount (%) | 100 |
| Material | Porous |
| Underlying Aggregate: 1. Depth (cm) 2. Porosity (Void Ratio) | Asphalt 20.32 0.25 |
| Permeable Pavement on Sidewalks | |
| Amount (%) | 100 |
| Material | Porous |
| Underlying Aggregate: 1. Depth (cm) 2. Porosity (Void Ratio) | Asphalt 20.32 0.25 |
Table 3.
Runoff reduction calculation for LID Best Management Practices (BMPs).
| LID Best Management Practices (BMPs) | Formula | Calculation | Total Runoff Reduction (Liters Per Cubic Centimeter) |
| Green Roof | (Annual precipitation × Green Infrastructure Area × % Retained) × 13.38 sq.m × 0.001 L/cm3 = Total Runoff reduction [45]. | (125.83 cm × 274.94 sq.m × 0.60) × 13.38 sq. m × 0.001/cm3 | 277.77 |
| Vegetated Swales | (Annual precipitation × (Feature Area + Drainage Area) × % of rainfall captured) × 13.38 sq.m × 0.001 L/cm3) = Total Runoff reduction [45]. | (25.83 cm) × (41.99 sq.m + 1120.485 sq.m) × 0.80 × 13.38 sq.m × 0.001/cm3 | 1565.72 |
| Rain Garden | (Annual precipitation × (Feature Area + Drainage Area) × (% of rainfall captured) × 13.37 sq.m × 0.001 L/cm3) = Total Runoff reduction [45]. | (125.83 cm × (13.93 sq.m + 1120.485 sq.m) × 0.80 × 13.38 sq.m × 0.001/cm3) | 1909.9 |
| Permeable Pavement | (Annual precipitation × Green Infrastructure Area × % retained) × (13.37 sq.m × 0.001/cm3) = Total Runoff reduction [45]. | (125.83 cm × 95.97 sq.m × 0.80) × 13.38 sq.m × 0.001/cm3) | 129.26 |
| Total Runoff Reduction | 277.77 + 1565.72 + 1909.9 + 129.26 | 3882.65 | |
Table 4.
Values obtained before and after Green Infrastructure Design Provisions.
| Conventional Stormwater Management | Green Infrastructure | Difference | |
|---|---|---|---|
| Volume Control: | |||
| 1. Required volume capture from 1.5” over whole site (m3) | 43.18 | 43.18 | 0 |
| 2. Volume captured by current BMPs (m3) | 0 | 25.77 | 25.77 |
| 3. Required volume captured by current BMPs (%) | 0 | 60 | 60 |
| 4. Decrease in impervious area (%) | 0 | 49 | 49 |
| Coefficients and runoff: | |||
| 1. Total Runoff (cm) | 121.08137 | 114.07 | 7.017 |
| 2. Total Runoff Volume (m3) in 85% storm | 2.06 | 1292.5 | 9.6 |
| 3. Total Runoff (cm) | 0.53 | 0.02 | 0.51 |
| 4. Total Runoff Volume (m3) | 6.14 | 0.25 | 5.89 |
| Land Use: | |||
| 1. Conventional Area (sq.m) | 274.9 | 274.9 | 0 |
| 2. Total Impervious | 391.6 7 | 200.6 | 191.1 |
| 3. Total Pervious | 41.5 | 932.47 | 190.9 |
| Costs ($): | |||
| 1. Construction cost | $48,644 | $85,850 | $37,206 |
| 2. Annual Maintenance costs | $962 | $1564 | $602 |
| 3. Life-Cycle Cost (NPV) | $89,709 | $154,054 | $64,345 |
| Annual benefits: | |||
| 1. Reduced air pollutants | 0 | 1 | 1 |
| 2. Compensatory value of trees | 0 | 1100 | 1100 |
| 3. Groundwater replenishment | 0 | 3 | 3 |
| 4. Reduced treatment benefits | 0 | 2 | 2 |
| Life-Cycle benefits (NPV): | |||
| 1. Reduced air pollutants | 0 | 23 | 23 |
| 2. Compensatory value of trees | 0 | 34,856 | 34,856 |
| 3. Groundwater replenishment | 0 | 110 | 110 |
| 4. Reduced treatment | 0 | 61 | 61 |
© 2018 by the authors. Licensee MDPI, Basel, Switzerland. This article is an open access article distributed under the terms and conditions of the Creative Commons Attribution (CC BY) license (http://creativecommons.org/licenses/by/4.0/).
Share and Cite
MDPI and ACS Style
Thiagarajan, M.; Newman, G.; Zandt, S.V. The Projected Impact of a Neighborhood-Scaled Green-Infrastructure Retrofit. Sustainability 2018, 10, 3665. https://doi.org/10.3390/su10103665
AMA Style
Thiagarajan M, Newman G, Zandt SV. The Projected Impact of a Neighborhood-Scaled Green-Infrastructure Retrofit. Sustainability. 2018; 10(10):3665. https://doi.org/10.3390/su10103665
Chicago/Turabian StyleThiagarajan, Manasvini, Galen Newman, and Shannon Van Zandt. 2018. "The Projected Impact of a Neighborhood-Scaled Green-Infrastructure Retrofit" Sustainability 10, no. 10: 3665. https://doi.org/10.3390/su10103665
Note that from the first issue of 2016, this journal uses article numbers instead of page numbers. See further details here.