Article

Influence of Reduced Protein Content in Complete Diets with a Consistent Arginine–Lysine Ratio on Performance and Nitrogen Excretion in Broilers

1
Institute for Animal Nutrition, University of Veterinary Medicine Hannover, Foundation, Bischofsholer Damm 15, D-30173 Hanover, Germany
2
Institute for Anatomy, University of Veterinary Medicine Hannover, Foundation, Bischofsholer Damm 15, D-30173 Hanover, Germany
3
BEST 3 Gefluegelernaehrung GmbH, Ringstrasse 16, D-27239 Twistringen, Germany
4
CJ Europe GmbH, Ober der Röth 4, D-65824 Schwalbach, Germany
*
Author to whom correspondence should be addressed.
Sustainability 2018, 10(11), 3827; https://doi.org/10.3390/su10113827
Submission received: 30 September 2018 / Revised: 18 October 2018 / Accepted: 19 October 2018 / Published: 23 October 2018
(This article belongs to the Special Issue Environmentally Sustainable Livestock Production)

Abstract

:
The current discussion concerning resource-efficient broiler production inevitably leads to diets with lowered crude protein (CP) levels. Therefore, the hypothesis was formed that crude protein reduction far below the recommended levels can significantly lower the nitrogen (N) content in litter, if essential amino acids are added and a constant lysine-arginine ratio is guaranteed. In a five-week feeding trial, 360 ROSS 308 broilers of both sexes were randomly assigned to four feeding groups with six replicates each with a standard three-phase feeding program (d 1–7, d 8–14, d 15–35). The control group was offered a complete diet with a common protein content found in practice (CP-% as fed; starter: 21.5, grower: 20.5, finisher: 20.0; lysine/arginine: 100/115). In the experimental diets the lysine/arginine ratio was constant, whereas the protein content was lowered in steps of 1.00 percent each with simultaneous supplementation of growth limiting amino acids. Feeding a diet with a 2.00 percent reduced protein content led to higher body weights after 34 days compared to the control (2329 g vs. 2192 g). The N content in the total litter decreased significantly with a 2.00 and 3.00 percent reduction in the CP content (51.2 vs. 46.2 or rather 36.2 g/kg dry matter (DM)). Meticulous balanced protein-reduced diets therefore allow a significant environmental relief.

1. Introduction

The impact of livestock production on the environment is significant [1,2,3,4]. Due to the intensification of pig and poultry production, owing to efficiency, environmental problems occurred in some areas of the world [5,6]. Differences in environmental impact among different production systems (e.g., pork, chicken and beef) can be explained by the following three factors: feed efficiency, differences in enteric CH4 emission between monogastric animals and ruminants, and differences in reproduction rates [1,7]. The production of 1 kg of beef protein also has the highest impact, followed by pork protein, whereas chicken protein has the lowest impact when only meat production is considered [1,8]. Although feed is the primary input source of nutrients, the amount of nutrients ultimately emitted into the environment is dependent on the efficiency of nutrient utilization of the animal [2,5].
Low protein diets with the correct amino acid (AA) supplementation promote a reduction in N excretion and ammonia emission from the litter of broiler chickens [9]. Reduction in dietary crude protein (CP) content resulted in a 10–27% reduction in the total amount of N excreted during a six-week broiler rearing period [10]. Low CP diets, namely to supply sufficient amounts of essential AA to meet the requirements only, can in turn help to decrease the amounts of excess dietary non-essential AA [11]. Although reducing dietary CP reduces N content and, therefore, pollution potential of the resulting litter, adverse effects can occur in live performance [11]. In some studies, low protein diets failed to support equal growth performance of that of high protein control diets [9,12,13,14]. Feeding broiler chickens diets containing a high proportion of crystalline amino acids with low intact CP can cause retarded growth when using diets below 19% CP [15]. In a recent study, crystalline amino acid supplementation based on a similar amino acid profile could reduce N excretion and foot pad dermatitis without having any negative effects on growth performance by reducing dietary CP levels from 19% to 17% of free-range yellow broilers [16].
In particular, arginine is important in broiler nutrition because in uricotelic animals exogenous arginine is needed for the urea cycle [17,18]. The National Research Council (NRC) recommends an arginine–lysine ratio of 1.14 (lysine content in diet: 1.10% at 90% dry matter (DM)) for broilers in the first three weeks of fattening and a ratio of 1.10 in the fourth to sixth week (lysine content in diet: 1.00% at 90% DM [19]). The information in the literature, however, is not without contradiction. In younger broilers males optimized body weight gain was found for 1.15% dietary arginine (1.21% lysine; 20.6% CP; [20]). In older birds, the final body weight together with body weight gain and feed conversion throughout the 42-to-56-d experimental period were optimized at 0.98% arginine and 0.85% lysine (ratio = 1.15; [21]). In a preliminary study a constant arginine–lysine ratio of 1.15 in protein was found to be the optimum for broiler nutrition under European conditions during the starter period [22].
Therefore, the objective of the present study was to evaluate the effects of reduced protein content in complete diets with a consistent arginine–lysine ratio on performance and N excretion in broilers during a 34-day rearing period.

2. Materials and Methods

Animal experiments were carried out in accordance with German regulations. These animal experiments require no notification or approval in accordance with the Animal Protection Act (§ 7, paragraph 2, sentence 3). Interventions before dissection were not carried out. The animals were killed in accordance with § 4, paragraph 3 of the Animal Protection Act, exclusively to use their organs or tissues for scientific purposes. The experiments were approved by the Animal Welfare Officer of the University of Veterinary Medicine Hannover, Germany (reference: TVT-2018-V-102).

2.1. Animals, Housing and Experimental Design

Experiments were performed with a common line of broilers kept for fattening purposes (as hatched; ROSS 308; BWE-Brüterei Weser-Ems GmbH & Co. KG; Visbek-Rechterfeld, Germany). In total 360 one-day-old broiler chickens were divided into four different groups depending on the CP content or rather reduction in CP content (in steps of 1%) in the diet (n = 4: CP-C, CP-1; CP-2; CP-3; with six replicates each; 15 animals per replicate/subgroup). If an animal died or showed weakness during the first two weeks of the trial, it was replaced by a broiler from a reserve group. After that time, no replacement was made.
From day 1 onwards the animals were kept in 24 boxes (1.20 × 0.80 m; AviMax, Big Dutchman International GmbH, Vechta-Calveslage, Germany). One subgroup of each group was placed in a block (=4 boxes) in a randomised sequence, with six blocks in the same stable. A vacuum air ventilation system was installed in the ceiling in two rows above the pens. The boxes were littered with approximately 1 cm (1 kg per square metre) of wood shavings (GOLDSPAN®, Goldspan GmbH and Co. KG, Goldenstedt, Germany). By the end of the trial stocking densities had reached a maximum of 35 kg per square metre. On the left-hand side of each pen, there was a scratching area, and on the right-hand side there was a feeding area equipped with one hanging-type feeder (Klaus Gritsteinwerk GmbH & Co. KG, Bünde, Germany). Drinking lines with nipple drinkers (two nipples per box) for broilers (Big Dutchman International GmbH, Vechta, Germany) were used. The environmental temperature was gradually reduced from about 33 °C for the one-day-old birds to about 20 °C by day 34. Lights were continuously on at days one, two, and three, and the photoperiod from day four onwards amounted to 16 h of light and 8 h of darkness with dimmed night lighting.

2.2. Diets and Feeding Concept

All birds were fed ad libitum with specifically prepared pelleted diets. For the trial, 12 different diets (four different starter diets, four grower diets, and four finisher diets) were produced at the Institute for Animal Nutrition, University of Veterinary Medicine Hannover, Foundation, Hannover, Germany. One component (80% of diet; Best 3 Geflügelernährung GmbH, Twistringen, Germany) of each of the 12 diets was the same supplementary feed with vitamins, minerals and coccidiostats (narasin/nicarbacin). This maximized the comparability of the final diets with each other.
The remaining 20% of the specific compound feedingstuffs consisted of corn, soybean meal, amino acids and some minerals (limestone, monocalciumphosphate, salt, sodium bicarbonate) to make up the 12 different experimental diets (Table 1).
One group received a standard control diet (starter: d 1–7, grower: d 8–14; finisher: d 15–35), the other groups, specially prepared experimental diets. The control diet was a complete feedingstuff with a common protein content (as fed; starter: 21.5% CP; grower: 20.5% CP; finisher: 20.0% CP; each designed for an arginine–lysine ratio of 115:100; Table 2). In the experimental diets, the arginine–lysine ratio was constant; the protein was lower in steps of 1.00 per cent. The levels of essential amino acids were held at the same level due to the supplementation of single amino acids. To ensure the optimum composition and to verify the ratio between the components, these 12 different diets (in total: four starters, growers and finishers each) were analyzed (Table 2).

2.3. Measurements

2.3.1. Technical Performance

The individual body weight (BW) was measured weekly on the same day. One exception was the last week, in which the interval had to be shortened by one day for technical reasons (six days). Feed intakes (FI) as well as losses were determined at subgroup level. The feed conversion ratio (FCR) was estimated from feed consumed and body weight growth throughout the experimental period at box level.

2.3.2. Excreta and Litter Sampling

Excreta samples were obtained by means of a rubber mat placed on top of the litter for one hour in each box once a week. Excreta samples were collected without wood shavings contaminating the samples. Litter samples for measuring the DM content were collected weekly from three defined locations along a diagonal line through the box (at both ends and a central one). At each area, over the whole bedding height a sample was punched out from the full depth of the litter using a cup with a 5 cm diameter. At the end of the experiment, the entire litter material was removed, weighed and homogenised with a rotating machine. An aliquot was taken from this material and used for further analyses.

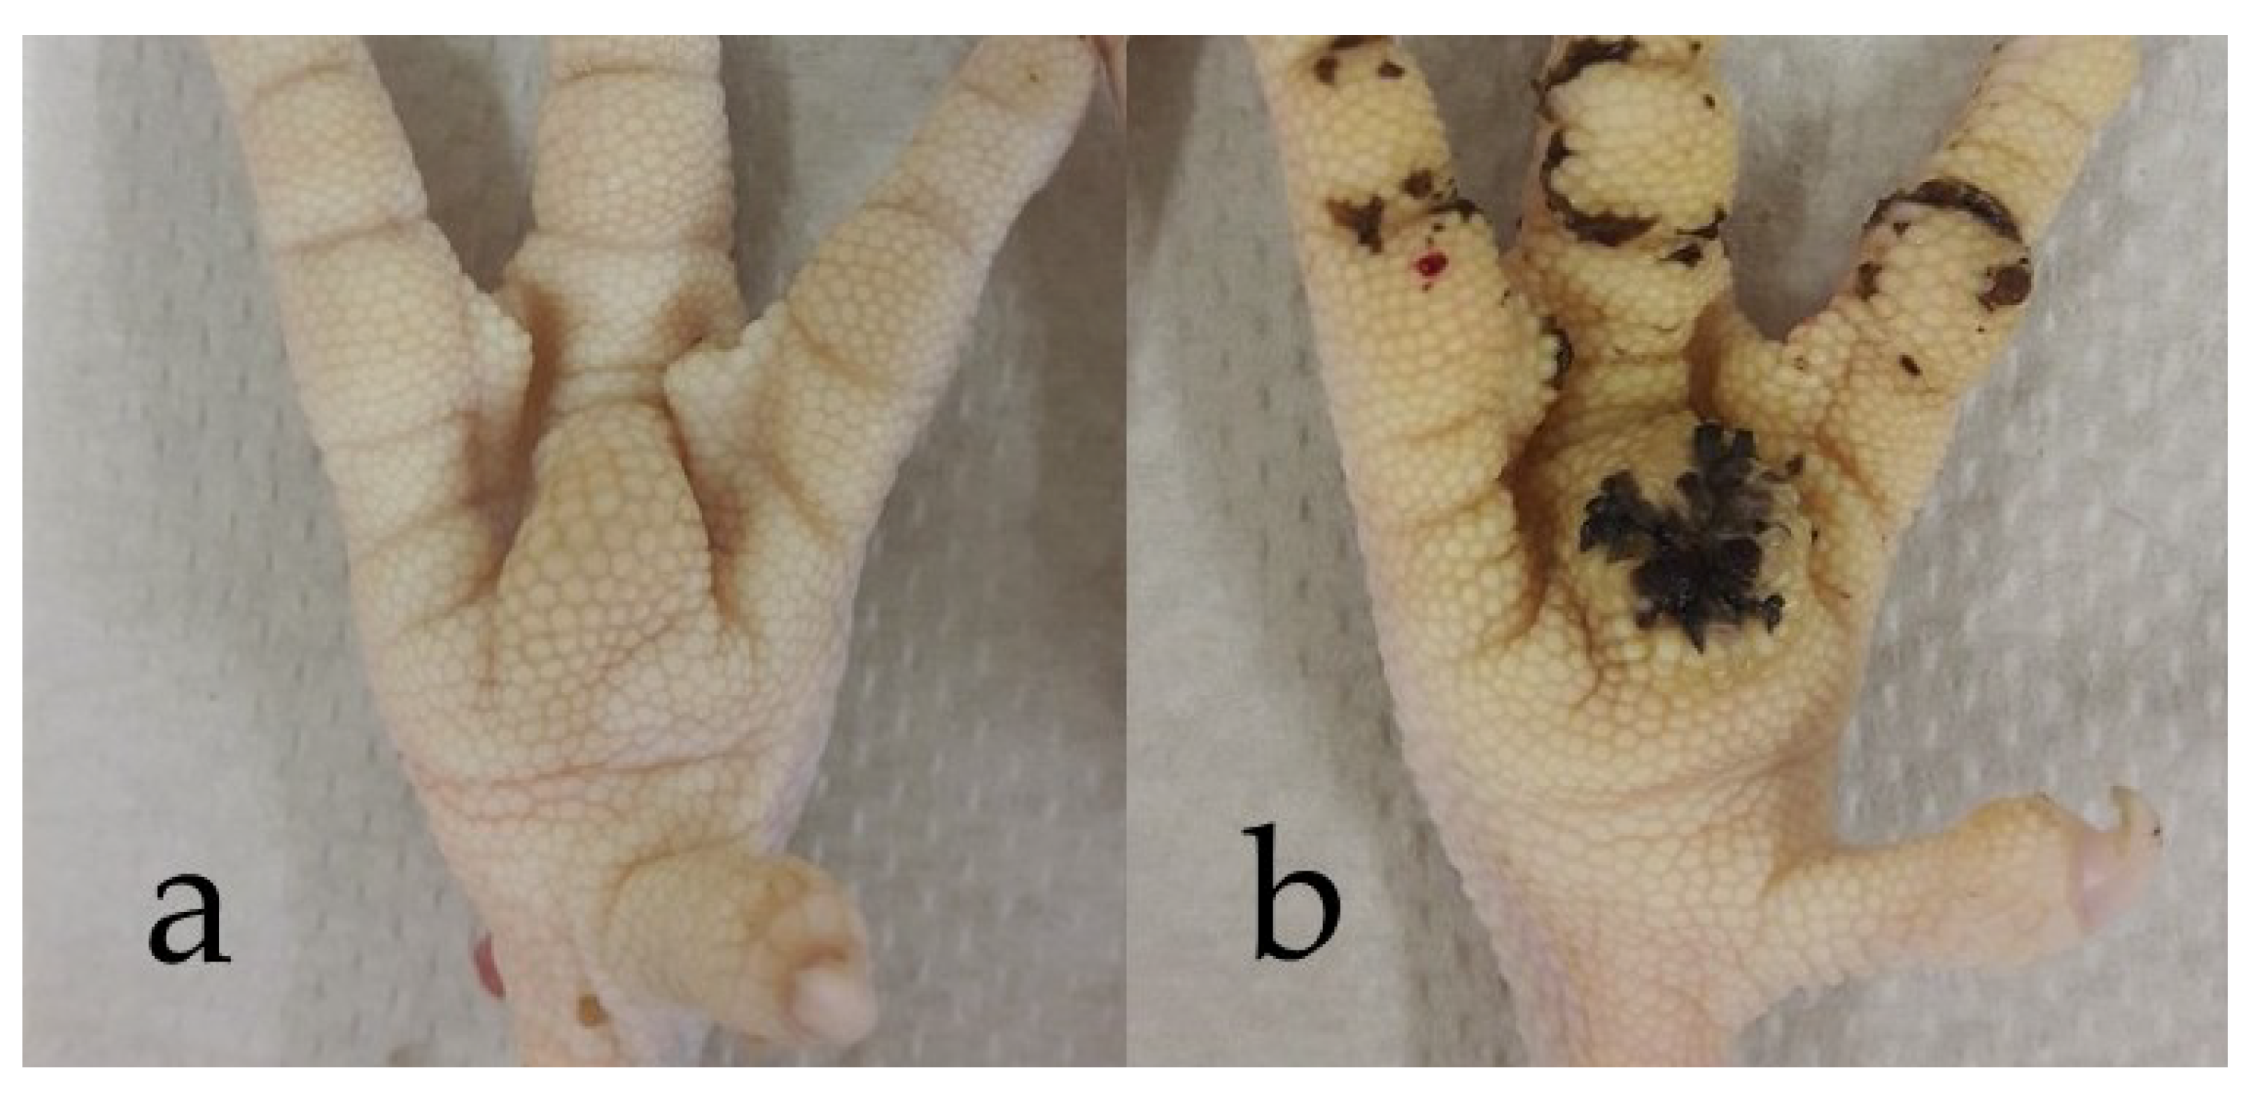
2.3.3. Foot Pad Dermatitis Scoring Criteria

Foot pads were examined weekly, starting at the end of week one. Dirty feet were carefully washed with a wet cloth to remove slightly adhering litter and excreta. Only the dried central plantar of foot pads were scored. The foot pads of the animals were scored with a scoring system from 0–7 designed by Mayne, et al. [23]: score 0 represents healthy skin with no swelling or redness, whereas score 7 stands for a foot pad more than 50% necrotic (Figure 1). Other measures concerning behaviour, use of space, use of the sandbox, and other welfare indicators might have been very useful, but were not part of the study. They should be considered in further studies.

2.3.4. Dissection

After 35 days, 120 animals (n = 30 per group) were dissected. A percussive blow to the head was used as anaesthesia or rather the stunning method in accordance with Annex I of Council Regulation (EC) No. 1099/2009, Chapter I, Methods, Table 1—Mechanical methods, No. 6. After bleeding the animals, the body cavity was opened, the sternum lifted up and samples of the ileum were taken for histological investigations. All remaining birds were sold.

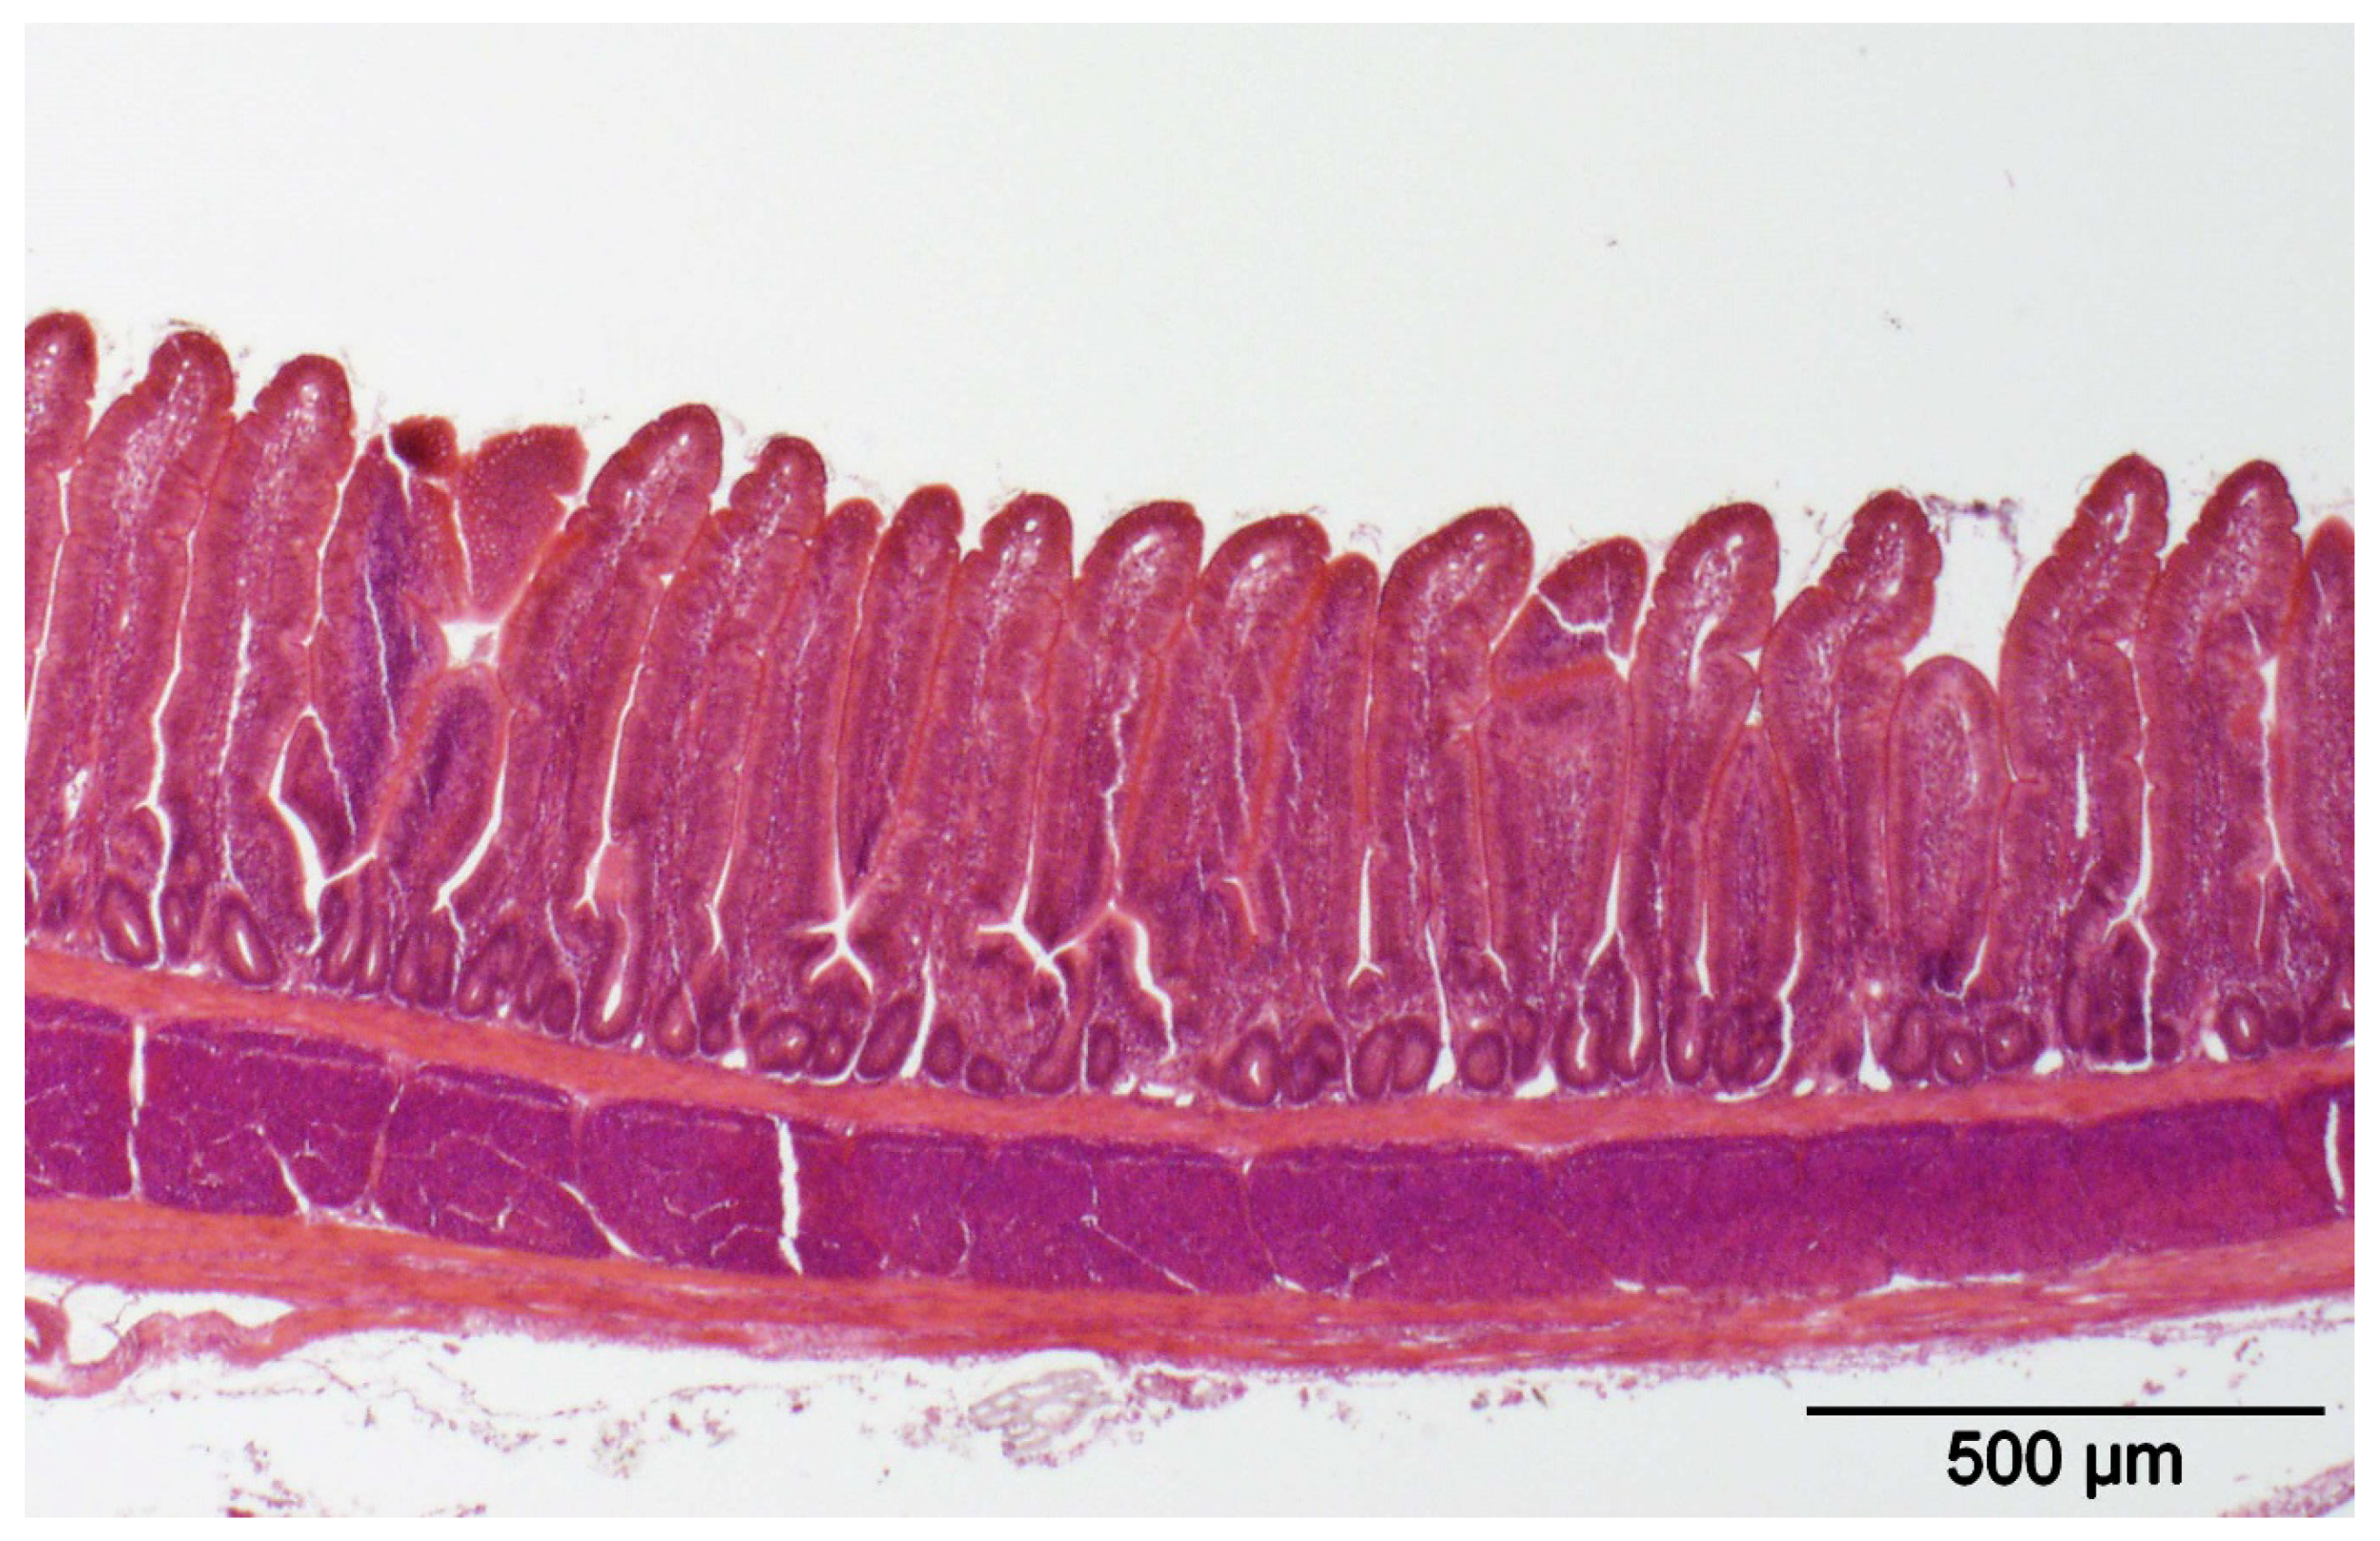
2.3.5. Histological Investigations

For histological investigations, an approximately 1 cm long piece was removed from the ileum (in the middle between the diverticulum and cranial part of the caecum) and fixed in 4% formaldehyde for 48 h. After fixation, tissue samples were embedded in paraffin using standard techniques [24]. For histological evaluation, 4 µm sections of all samples were stained with haematoxylin and eosin (HE) using established protocols [24]. The villus height was measured from the tip of the villi to the villus crypt junction; villus width was measured at the base of the villus above the villus crypt junction using a Zeiss axioscope (Carl Zeiss Jena GmbH, Jena, Germany).

2.3.6. Analysis of Feed, Excreta, and Litter Samples

The official methods of the VDLUFA were the basis of the standard procedures being used to analyze all diets [25]. Determining the dry matter content and the crude ash content works through action of heat; drying the samples to the weight constancy at 103 °C delivers the results for the DM content. Through combustion of the sample at 600 °C in a muffle furnace the crude ash content was analyzed. The total N content was determined by the DUMAS combustion method (Vario Max, Elementar, Hanau, Germany). The crude fat content was determined by standard protocol (soxhlet apparatus). Crude fiber was analyzed after washing in dilute acids and alkalis. Starch determination was carried out polarimetrically (Polatronic E, Schmidt und Haensch GmbH & Co., Berlin, Germany). The Luff-Schoorl method was used to determine the sugar content. Minerals were analyzed by atomic absorption spectrometry (Unicam Solaar 116, Thermo, Dreieich, Germany). Amino acids were determined by ion-exchange chromatography (AA analyzer LC 3000, Biotronic, Maintal, Germany).

2.3.7. Estimations of Efficiencies of Nitrogen or Rather Protein Utilisation

The single box was the observation unit for assessing nutrient efficiency between groups. The basis for the considerations was the total FI in the box, the increase in body weight (final body weight minus weight at hatch; including the increase in deceased animals), and the amount of final litter material in the box. The N content in the different diets and in the litter were analyzed by standard methods described above (2.2.6). To calculate the N content in the fresh whole body of birds (including feathers), crude protein contents from various publications were used as a basis [12,26,27,28]. From the means (in g N/100 g fresh total body: 3.312 [27], 3.016 [26], 2.754 [28], 2.598 [12]) a factor was derived (2.920) and used as the basis for calculating parameters in accordance with Aletor, Hamid, Niess and Pfeffer [26], modified.
N-retention efficiency (%) = g N retained/g N consumed × 100
N-efficiency rate = g weight gain/g N consumed
N excretion (apparent) = g N consumed − g N retained

2.4. Statistical Analysis

Data analyses were performed using the SAS statistical software package version 7.1 (SAS Inst., Cary, NC, USA). Mean values, as well as the standard deviation of the mean (standard deviation (SD)), were calculated for all parameters. The mean footpad dermatitis (FPD) scores were evaluated by using the mean of both feet. For the values of body weight (BW), the foot pad dermatitis scores and the results of the histopathological investigations as well as the individuum were the basis of observation. All other parameters were analyzed at box-level. The group comparisons were performed by one-way analysis of variance (ANOVA) for independent samples. In general, the Ryan–Einot–Gabriel–Welsch multiple-range test (REGWQ) was used for multiple pairwise means comparisons between the four groups. All statements of statistical significance were based on p < 0.05.

3. Results

The experiments ran without complications. From the start of week 3, six out of 360 animals died (CP-C: 2; CP-1: 1; CP-2: 1; CP-3:2). There was no antibiotic treatment during the trial.

3.1. Technical Performance

Results relating to growth performance of broilers are shown in Table 3. At day 1, the average weight per chicken was 43.0 g. In broilers, after 34 days of fattening, BW exceeded the performance goals of the breeding company [29]. At the end of the first and the second week of fattening the BW already showed significant differences between groups, being lowest in group CP-3 (Table 3). In weeks three, four, and five, birds in group CP-2 were significantly heavier than in groups CP-C and CP-3.
No differences were observed concerning the feed conversion rate (FCR) in broilers depending on the dietary feeding concept. The FCR showed numerically lowest values for group CP-2 during the entire period (CP-C: 1.474 ± 0.036; CP-1: 1.457 ± 0.010; CP-2: 1.454 ± 0.017; CP-3: 1.489 ± 0.016, respectively).

3.2. Excreta and Litter Quality

There were no differences in DM content of excreta between groups CP-C, CP-1 and CP-2 (Table 4). Excreta of group CP-3 were the driest from week two onwards. The control group had the wettest litter in the fourth week of fattening. At the end of the experiment, groups CP-C, CP-1 and CP-2 were not significantly different concerning DM content in litter. The group CP-3 had the driest litter at week five. The litter material was finally removed from the boxes. The dry matter content was significantly higher in material from group CP-3 than in the other groups (in g DM/kg; CP-C: 584 B ± 31.3; CP-1: 602 B ± 39.7; CP-2: 603 B ± 44.4; CP-3: 698 A ± 30.7, respectively).
Analyzing the N content in the excreta showed that diets with lower CP content led to significantly lower N values in the excreta (Table 5). In comparison to the control, in week 5 the N content was reduced by 36.6%. Also, the mean N content in the total litter was significantly lower in group CP-3 (36.2 ± 1.64 g/kg DM) than in all other groups. Additionally, group CP-2 (46.2 ± 1.30 g/kg DM) showed significantly lower concentrations of N in the total litter compared to the material from the groups CP-1 (49.7 ± 1.57 g/kg DM) and CP-C (51.2 ± 2.22 g/kg DM).
The level of FI and the protein content in the feed determined the average total N intake per box. The birds in group CP-2 showed the significantly highest FI compared to groups CP-1 and CP-3 (per animal; CP-C: 3169 B g, CP-1: 3210 A,B g; CP-2: 3323 A g; CP-3 3107 C g, respectively). Total N uptake was significantly higher in the control group than in CP-2 and CP-3 (Table 6). The total amount of N in the litter material harvested at the end of the experiment was gradually reduced analogous to the protein reduction in the feed. The group CP-2 showed the highest absolute weight gain per box and accordingly the highest absolute N retention per box compared to the other groups.
The N retention efficiency in the groups CP-C and CP-1 was significantly worse than in the groups CP-2 and CP-3 (Table 7). Compared to the control, the efficiency could be improved step by step by 1.4, 7.1 and 9.6 percentage points from CP-1 to CP-3, respectively.

3.3. Footpad Dermatitis

In this trial there were no clinical issues concerning foot pad health. The foot pad health was very good overall (Table 8). A comparison between groups showed significant differences at the end of the third week. In group CP-2, the scores were significantly higher.

3.4. Histological Investigations

There were no differences in the results of the histological examinations (Table 9).
The intestinal wall of the ileum showed no alterations (Figure 2).

4. Discussion

The investigations were conducted without incidents. Animal losses were very low (1.66% mortality) from day 14 onwards. Performance parameters were above performance goals of the breeding company [29]. With a final average body weight between 2131 g (CP-3) and 2329 g (CP-2), the body weight development excelled the guidelines of the breeding organization (2050 g). Thus, the performance was higher in each group (CP-C: +6.93%; CP-1: +9.46%; CP-2: +13.6%; CP-3: +3.95%, respectively). Moreover, the feed utilization per kg body weight gain was lower in all groups compared to the performance goals (cumulative feed expenditure in accordance with Aviagen [29]: 1528; reduction: CP-C: −3.53%; CP-1: −4.65%; CP-2: −4.84%; CP-3: −2.55%, respectively). Moran et al. [11] observed in early studies on CP reduction (downwards to 17.8%; weeks 4–6) an increase in feed to gain ratio from 1.72 to 1.76. However, the rations were balanced only with L-lysine HCl, DL-methionine, and L-threonine. The arginine–lysine ratio was therefore not optimal, this being 1.04 in the first three weeks (20.8% CP) and 0.99 in weeks 4–6 (17.8% CP). In a frequently cited study by Bregendahl et al. [12], the performance deteriorated when reducing the protein content to a level comparable to ours in the present study. In the study mentioned above [12], at protein levels of 185–186.5 g CP per kg diet and supplementation of identical amino acids used in our study, complemented by glutamine, the performance was lower compared to the control (23% CP). Nonetheless, the two investigations differ in terms of the absolute levels of supplemented amino acids. Especially methionine seemed to be much higher in the study of Bregendahl et al. [12]. Namroud et al. [15] were able to show a comparable body weight in broilers using crystalline amino acids in protein reduced diets (reduction of 23% to 19% CP at day 28). A further reduction to 17% CP led to a significant decrease in the final body weight at day 28 by 17.5%. In comparison to Namroud et al. [15], no comparable effect occurred in the present study, although reduction in CP content was nearly the same (a decrease to 17.7% percent by day 14 or to 17% thereafter). The greatest difference between Namroud et al. [15] and the present trial can be seen in the methionine content (approx. 1 g higher for Namroud et al. [15]), and leucine (up to 5 g surplus in the study of Namroud et al. [15]). In studies with free-range chickens, however, observations were in line with the present study [16]. The performance was comparable when reducing from 19% to 17% CP and balancing essential amino acid content. From these observations, it can be concluded that with increasing crude protein reduction, the targeted application of certain amino acids must be given more emphasis if performance is to be maintained. Feed costs represent about 70% of the cost of poultry production [30]. Therefore, this makes a bird’s ability to use feed efficiently very important [30]. Precisely following the nutritional requirements of poultry is the guarantor for optimum feed efficiency [30]. Therefore, studies like this can help to maintain profitability while at the same time taking into account other aspects of sustainability like ecological dimensions of production.
In the present investigations, the N content in the excreta could be lowered significantly using CP reduced diets. The N content in the excreta was reduced by up to 36.6% at a comparable performance by reducing the protein content from 20% to 17% (reduction in N content in excreta compared to CP-C in week 5: CP-1: −4.20%; CP-2: −15.2%; CP-3: −36.6%, respectively). The ratios were also reflected in the content of the entire litter material. The protein reduction of up to 3% starting from a diet with moderate protein content in the present study resulted in a reduction in the N content in the total litter material of up to 37.3% (N reduction in litter compared to CP-C: CP-1: −5.70%; CP-2: −22.3%; CP-3: −37.3%, respectively). The N efficiency could be further increased by almost 10 percentage points (CP-C: 61.9%; CP-3: 71.5%, respectively) due to the feeding concept, in spite of an already high efficiency. The present investigations are in line with the results of Ospina-Rojas et al. [9]. This research group was able to reduce the N content in the litter from 47.2 g N/kg DM to 31.9 g N/kg DM (−32.4%) by reducing the protein content in the diet from 19% to 16% by supplementing valine, isoleucine, arginine and glycine achieving a constant performance. When supplementation of valine, isoleucine and glycine or valine, isoleucine and arginine or of all four aforementioned amino acids was not made, a significant performance depression occurred [9]. Blair et al. [10] were able to achieve a reduction in the N content in the excreta from 52.5 g/kg DM to 47.2 g/kg DM without affecting the performance by reducing the protein contents from 21% to 18% in weeks 3 to 6 while balancing essential amino acids. The N retention could be increased from 47% to 51%. In the same study, the N retention could be increased from 61% to 63% under conditions of a total of 6 weeks’ adjustment in the protein content. Namroud et al. [15] were able to reduce the N content in excreta from 50.3 g/kg DM to 36.3 g/kg DM (−27.8%) by achieving a constant amino acid content in the diet, reducing the crude protein content from 23% to 17%. Shao et al. [16] were able to reduce the N content in the excreta from 65.2 g/kg DM to 47.3 g/kg DM (−27.4%) in free-range chickens by reducing the protein content from 19% to 17%. In the present investigations, the reduction in the N content in excreta or litter material was higher in its peak than in the aforementioned publications. Overall, the protein reduction was accompanied to a certain extent by an increased performance (CP-2), which was also reflected in the high absolute N efficiency. The current global production of ammonia, CH4, and N2O by the poultry industry is significant [30]. Improvements in feed conversion ratio have a favorable effect on environmental emissions and decrease the environmental impact of poultry production [30]. Therefore, the present investigations thus show that the environment can be relieved to the maximum by continuously optimizing the rations.
In this study, no clinical problems concerning the foot pad health of the broilers could be determined, independent of CP level in the diets. After 34 days of fattening, nearly 100% of the broilers had an FPD score ≤1, despite the high stocking density of about 35 kg/m2. Only one animal in group CP-C and three animals in group CP-3 had a score of 2 in one foot. Therefore, the results of this study show neither negative nor positive effects of using the different dietary concepts.
The results of the histological examination were used to check whether the reduction in the protein content also had an influence on intestinal histology. The results of the study gave no indication of this.
With maximum protein reduction (CP-3), we used a diet containing kaolin at the beginning of the third fattening week effectuating a dilution of the ration. Due to the kaolin the effect of differences in diet composition between the feeding phases and between the groups in one feeding phase (80% supplement concept) was minimized. However, it cannot be ruled out that this ingredient might have influenced the FI. The results of the investigations suggest that further analyses would be useful. In these investigations the use of kaolin should be avoided on the one hand. Furthermore, it should be examined to what extent very expensive amino acids such as isoleucine etc. have to be completely balanced in the rations. If reductions are possible, this would allow the already economical concept to be continuing optimized and at the same time the environmental burden could be further reduced.

5. Conclusions

The potential environmental impact is an important evaluation factor for the sustainability of animal production. Meticulous balanced protein-reduced diets allow a significant reduction in the use of nutrients, especially in high N containing components. Under these conditions, the adjustment of the amino acid content becomes more and more important if the performance is at least kept constant. As the degree of crude protein reduction increases, N excretion falls disproportionately. This nutritional intervention enables significant improvements in terms of the environmental impact of animal production.

Author Contributions

Conceptualization, C.V., V.T. and D.S.; Methodology, C.V., M.L. and R.B.; Validation, C.V., C.U., M.L. and R.B.; Formal Analysis, C.U. and C.V.; Investigation, C.U., M.L. and C.V.; Resources, C.V., V.T. and R.B.; Data Curation, C.U. and C.V.; Writing—Original Draft Preparation, C.U. and C.V.; Writing—Review & Editing, C.U., M.L., R.B., V.T., D.S. and C.V.; Visualization, C.U., C.V., M.L. and R.B.; Supervision, C.V. and R.B.; Project Administration, C.V. and R.B.; Funding Acquisition, C.V.

Funding

The study was financially supported by CJ Europe GmbH, Schwalbach, Germany. The role of the funding body was merely financial. The CJ Europe GmbH did not have any role in collecting, interpreting, analyzing or writing up the data. This publication was also supported by the Deutsche Forschungsgemeinschaft and University of Veterinary Medicine Hannover, Foundation, Germany within the funding program Open Access Publishing.

Acknowledgments

We would like to thank Frances Sherwood-Brock for proof-reading the manuscript to ensure correct English.

Conflicts of Interest

Venja Taube is an employee of BEST 3 Gefluegelernaehrung GmbH, Twistringen, Germany. The BEST 3 Gefluegelernaehrung GmbH had no role in the design of the study; in the collection, analyses, or interpretation of data; in the writing of the manuscript, or in the decision to publish the results. Diana Siebert is an employee of CJ Europe GmbH, Schwalbach, Germany. The CJ Europe GmbH had no role in the design of the study; in the collection, analyses, or interpretation of data; in the writing of the manuscript, or in the decision to publish the results.

References

  1. De Vries, M.; de Boer, I.J.M. Comparing environmental impacts for livestock products: A review of life cycle assessments. Livestig. Sci. 2010, 128, 1–11. [Google Scholar] [CrossRef]
  2. Steinfeld, H.; Gerber, P.; Wassenaar, T.; Castel, V.; Rosales, M.; Rosales, M.; de Haan, C. Livestock’s Long Shadow: Environmental Issues and Options; Food & Agriculture Org.: Rome, Italy, 2006. [Google Scholar]
  3. Leip, A.; Billen, G.; Garnier, J.; Grizzetti, B.; Lassaletta, L.; Reis, S.; Simpson, D.; Sutton, M.A.; De Vries, W.; Weiss, F. Impacts of european livestock production: Nitrogen, sulphur, phosphorus and greenhouse gas emissions, land-use, water eutrophication and biodiversity. Environ. Res. Lett. 2015, 10, 115004. [Google Scholar] [CrossRef]
  4. Meier, M.S.; Stoessel, F.; Jungbluth, N.; Juraske, R.; Schader, C.; Stolze, M. Environmental impacts of organic and conventional agricultural products—Are the differences captured by life cycle assessment? J. Environ. Manag. 2015, 149, 193–208. [Google Scholar] [CrossRef] [PubMed]
  5. Ferket, P.R.; van Heugten, E.; van Kempen, T.A.T.G.; Angel, R. Nutritional strategies to reduce environmental emissions from nonruminants. J. Anim. Sci. 2002, 80, E168–E182. [Google Scholar] [CrossRef]
  6. Mallin, M.A.; Cahoon, L.B. Industrialized animal production—A major source of nutrient and microbial pollution to aquatic ecosystems. Popul. Environ. 2003, 24, 369–385. [Google Scholar] [CrossRef]
  7. Clark, M.; Tilman, D. Comparative analysis of environmental impacts of agricultural production systems, agricultural input efficiency, and food choice. Environ. Res. Lett. 2017, 12, 064016. [Google Scholar] [CrossRef] [Green Version]
  8. Leip, A.; Weiss, F.; Lesschen, J.; Westhoek, H. The nitrogen footprint of food products in the european union. J. Agric. Sci. 2014, 152, 20–33. [Google Scholar] [CrossRef]
  9. Ospina-Rojas, I.C.; Murakami, A.E.; Duarte, C.R.A.; Eyng, C.; Oliveira, C.A.L.; Janeiro, V. Valine, isoleucine, arginine and glycine supplementation of low-protein diets for broiler chickens during the starter and grower phases. Br. Poult. Sci. 2014, 55, 766–773. [Google Scholar] [CrossRef] [PubMed]
  10. Blair, R.; Jacob, J.P.; Ibrahim, S.; Wang, P. A quantitative assessment of reduced protein diets and supplements to improve nitrogen utilization. J. Appl. Poult. Res. 1999, 8, 25–47. [Google Scholar] [CrossRef]
  11. Moran, E.T.; Bushong, R.D.; Bilgili, S.F. Reducing dietary crude protein for broilers while satisfying amino-acid-requirements by least-cost formulation—Live performance, litter composition, and yield of fast-food carcass cuts at 6 weeks. Poult. Sci. 1992, 71, 1687–1694. [Google Scholar] [CrossRef]
  12. Bregendahl, K.; Sell, J.L.; Zimmerman, D.R. Effect of low-protein diets on growth performance and body composition of broiler chicks. Poult. Sci. 2002, 81, 1156–1167. [Google Scholar] [CrossRef] [PubMed] [Green Version]
  13. Laudadio, V.; Passantino, L.; Perillo, A.; Lopresti, G.; Passantino, A.; Khan, R.; Tufarelli, V. Productive performance and histological features of intestinal mucosa of broiler chickens fed different dietary protein levels. Poult. Sci. 2012, 91, 265–270. [Google Scholar] [CrossRef] [PubMed]
  14. Laudadio, V.; Dambrosio, A.; Normanno, G.; Khan, R.U.; Naz, S.; Rowghani, E.; Tufarelli, V. Effect of reducing dietary protein level on performance responses and some microbiological aspects of broiler chickens under summer environmental conditions. Avian Biol. Res. 2012, 5, 88–92. [Google Scholar] [CrossRef]
  15. Namroud, N.F.; Shivazad, M.; Zaghari, M. Effects of fortifying low crude protein diet with crystalline amino acids on performance, blood ammonia level, and excreta characteristics of broiler chicks. Poult. Sci. 2008, 87, 2250–2258. [Google Scholar] [CrossRef] [PubMed]
  16. Shao, D.; Shen, Y.R.; Zhao, X.; Wang, Q.; Hu, Y.; Shi, S.R.; Tong, H.B. Low-protein diets with balanced amino acids reduce nitrogen excretion and foot pad dermatitis without affecting the growth performance and meat quality of free-range yellow broilers. Ital. J. Anim. Sci. 2018, 17, 698–705. [Google Scholar] [CrossRef]
  17. Khajali, F.; Wideman, R. Dietary arginine: Metabolic, environmental, immunological and physiological interrelationships. World Poult. Sci. J. 2010, 66, 751–766. [Google Scholar] [CrossRef]
  18. Wu, G.; Bazer, F.W.; Dai, Z.; Li, D.; Wang, J.; Wu, Z. Amino acid nutrition in animals: Protein synthesis and beyond. Annu. Rev. Anim. Biosci. 2014, 2, 387–417. [Google Scholar] [CrossRef] [PubMed]
  19. Council, N.R. Nutrient Requirements of Poultry; National Academic Press: Washington, DC, USA, 1994. [Google Scholar]
  20. Corzo, A.; Kidd, M. Arginine needs of the chick and growing broiler. Int. J. Poult. Sci. 2003, 2, 379–382. [Google Scholar]
  21. Corzo, A.; Moran, E., Jr.; Hoehler, D. Arginine need of heavy broiler males: Applying the ideal protein concept. Poult. Sci. 2003, 82, 402–407. [Google Scholar] [CrossRef] [PubMed]
  22. Siebert, D.; Khan, D.R.; Esteve-Garcia, E. Investigations on the optimal arginine:lysine ratio in the starter phase of meat-type chickens. In Proceedings of the 21st European Society of Veterinary and Comparative Nutrition Congress; Harris, P., Moore-Colyer, M., Eds.; European Society of Veterinary & Comparative Nutrition: Cirencester, UK, 2017; Volume 21, p. 144. [Google Scholar]
  23. Mayne, R.; Else, R.; Hocking, P. High litter moisture alone is sufficient to cause footpad dermatitis in growing turkeys. Br. Poult. Sci. 2007, 48, 538–545. [Google Scholar] [CrossRef] [PubMed]
  24. Slaoui, M.; Fiette, L. Histopathology procedures: From tissue sampling to histopathological evaluation. In Drug Safety Evaluation; Springer: Cham, Switzerland, 2011; pp. 69–82. [Google Scholar]
  25. Naumann, C.; Bassler, R. Methoden der Landwirtschaftlichen Forschungs-und Untersuchungsanstalt, Biochemische Untersuchung von Futtermitteln; Methodenbuch iii (einschließlich der achten Ergänzungen); VDLUFA: Darmstadt, Germany, 2012. [Google Scholar]
  26. Aletor, V.A.; Hamid, I.I.; Niess, E.; Pfeffer, E. Low-protein amino acid-supplemented diets in broiler chickens: Effects on performance, carcass characteristics, whole-body composition and efficiencies of nutrient utilisation. J. Sci. Food. Agric. 2000, 80, 547–554. [Google Scholar] [CrossRef]
  27. Ernährungsphysiologie, G.F. Empfehlungen zur Energie-und Nährstoffversorgung der Legehennen und Masthühner (Broiler); DLG Verlag: Frankfurt am Main, Germany, 1999. [Google Scholar]
  28. Kamran, Z.; Sarwar, M.; Nisa, M.; Nadeem, M.; Ahmad, S.; Mushtaq, T.; Ahmad, T.; Shahzad, M. Effect of lowering dietary protein with constant energy to protein ratio on growth, body composition and nutrient utilization of broiler chicks. Asian Austral J. Anim. 2008, 21, 1629–1634. [Google Scholar] [CrossRef]
  29. Aviagen. Ross 308 Broiler Performance Objectives; Aviagen Group: Huntsville, AL, USA, 2014. [Google Scholar]
  30. Willems, O.; Miller, S.; Wood, B. Aspects of selection for feed efficiency in meat producing poultry. World Poult. Sci. J. 2013, 69, 77–88. [Google Scholar] [CrossRef]
Figure 1. Foot pad lesions with different scores. (a) Score 0: no alterations detected; and (b) Score 7: more than half of the foot pad covered with necrotic cells (photo: ©University of Veterinary Medicine, Hannover).
Sustainability 10 03827 g001
Figure 2. HE staining from ileal intestinal wall of broiler chickens with CP-1 diet. Scale bars = 500 μm.
Sustainability 10 03827 g002
Table 1. Ingredient composition of the diets during the whole experimental period. CP: crude protein.
Parameter [%]StarterGrowerFinisher
CP-CCP-1CP-2CP-3CP-CCP-1CP-2CP-3CP-CCP-1CP-2CP-3
Supplementary Feedingstuff *80.080.080.080.080.080.080.080.080.080.080.080.0
Corn0.304.518.8313.64.319.4413.19.957.1510.815.37.77
Soybean meal14.810.86.832.4010.86.002.400.008.505.251.000.00
Plant oil3.402.681.851.004.153.302.604.354.103.302.505.60
Limestone0.750.740.730.720.300.290.300.280.050.040.020.00
Mono-Ca-phosphate0.500.570.630.700.250.330.390.520.000.060.130.26
Salt0.120.080.040.000.100.050.020.000.070.040.000.00
Sodium Bicarbonate0.000.000.050.000.000.060.110.140.000.050.090.10
Arginine0.000.120.230.360.000.140.250.350.000.100.220.29
Isoleucine0.000.070.140.210.000.080.150.210.000.060.130.17
L-Lysine-HCl0.040.170.300.440.040.200.320.420.040.150.290.35
L-Methionine0.030.050.060.080.000.020.040.060.000.010.030.05
Threonine0.070.130.190.260.050.010.180.240.080.130.190.24
Valine0.000.070.130.200.000.080.140.200.000.050.120.17
Caolin0.000.000.000.000.000.000.003.320.000.000.005.00
* Containing 51.4% wheat, 24.1% soybean meal, 15.0% corn, 5.08% plant oil, 1.30% limestone, 0.94% mono-Ca-phosphate, 0.70% formic acid, 0.40% Alimet, 0.25% enzyme mixture (phytase, xylanase), 0.25% premix, 0.22% sodium bicarbonate, 0.22% salt, 0.10% lysine, 0.06% betaine (33%); feed additives per kg: 12,500 IU vitamin A, 6250 IU vitamin D3, 43 mg Vitamin E, 18.7 mg Cu, 25 mg Fe, 87.5 mg Mn, 62.5 mg Zn, 2.5 mg I, 0.37 mg Se, acetic acid, formic acid, 625 FTU 6-phytase, 3000 U Endo 1,4-ß-xylanase, 62.5 mg narasin, 62.5 mg nicarbacin.
Table 2. Concentrations of ingredients and energy content after chemical analysis in the starter, grower and finisher diets.
Item [g/kg; 88% DM]StarterGrowerFinisher
CP-CCP-1CP-2CP-3CP-CCP-1CP-2CP-3CP-CCP-1CP-2CP-3
Crude ash58.756.454.451.950.548.647.673.845.446.543.384.4
Crude fat (EE)78.875.368.764.489.883.379.393.793.383.576.4103
Crude fibre20.519.618.516.219.219.118.218.420.720.719.318.2
Crude protein222215202192205194186177199192181170
Nitrogen free extract 1500514536556516535549517522537560504
Starch335356382410355384406380376385412371
Sugar52.551.947.243.348.744.641.137.449.144.439.835.8
Calcium9.679.729.699.678.027.627.597.606.036.046.046.07
Phosphorus7.436.597.257.476.346.425.996.135.775.455.245.31
Potassium9.858.918.127.298.877.927.227.618.417.737.448.37
Arginine14.814.814.314.813.513.614.113.613.713.112.812.6
Cysteine2.232.282.032.022.242.232.051.842.022.301.971.66
Histidine5.875.534.764.725.284.984.684.285.225.004.334.04
Isoleucine9.629.428.999.389.248.729.048.737.968.558.188.11
Leucine16.916.114.614.016.314.714.412.715.515.013.312.5
Lysine12.812.912.412.612.011.712.311.711.711.411.310.8
Methionine5.185.735.435.595.045.455.015.005.185.104.705.16
Phenylalanine10.810.29.048.7410.49.308.997.9610.19.418.247.66
Threonine8.308.648.148.647.776.738.187.567.868.117.827.36
Valine10.310.59.8610.39.839.4710.19.699.309.339.078.85
Metabolizable energy AMEN 2 [MJ/kg DM]12.412.512.512.612.812.912.912.813.212.812.812.8
1 Nitrogen-free extract = DM − (crude ash + crude fat + crude fibre + crude protein); 2 AMEN = nitrogen-corrected apparent metabolizable energy; AMEN (per kg) = 0.1551 × % CP + 0.3431 × % ether extracts (EE) + 0.1669 × % starch + 0.1301 × % sugar (as sucrose).
Table 3. Average body weight and feed conversion ratio (FCR) during the trial (mean ± standard deviation (SD)).
ItemGroupWeek 1Week 2Week 3Week 4Week 5 *
Body weight
[in g; end of week]
CP-C216 A ± 19.8535 A ± 58.1989 B,C ± 1161589 B,C ± 1892192 B,C ± 258
CP-1218 A ± 16.5541 A ± 51.71004 A,B ± 1161632 A,B ± 1992244 A,B ± 275
CP-2217 A ± 15.6552 A ± 47.11034 A ± 1061678 A ± 1822329 A ± 266
CP-3206 B ± 20.1517 B ± 45.6956 C ± 99.81548 C ± 1752131 C ± 244
FCR [Ø in week]CP-C0.987 ± 0.0731.169 ± 0.0231.363 ± 0.0431.488 ± 0.0391.848 ± 0.066
CP-10.952 ± 0.0341.185 ± 0.0251.342 ± 0.0261.474 ± 0.0261.817 ± 0.020
CP-20.996 ± 0.0441.165 ± 0.0091.334 ± 0.0471.494 ± 0.0321.776 ± 0.050
CP-31.025 ± 0.0701.199 ± 0.0421.389 ± 0.0471.518 ± 0.0261.827 ± 0.104
A,B,C averages differ significantly within a column (p < 0.05); * only six days—measurement end of day 34.
Table 4. Dry matter content of excreta and litter material during the five-week trial period (mean ± SD).
ItemGroupWeek 1Week 2Week 3Week 4Week 5 *
Dry matter (DM) excreta
[in g/kg; end of week]
CP-C188 B ± 8.34200 B ± 10.8189 B ± 7.92188 B ± 9,31184 B ± 9.46
CP-1193 A,B ± 9.27208 B ± 9.27188 B ± 6.62186 B ± 11.9184 B ± 8.18
CP-2199 A,B ± 14.8207 B ± 12.1192 B ± 16.9184 B ± 14.2181 B ± 8.01
CP-3206 A ± 9.47228 A ± 7.25228 A ± 20.2232 A ± 2.76219 A ± 9.77
Dry matter litter
[in g/kg; end of week]
CP-C815 ± 36.2816 B ± 23.9712 A,B ± 53.8588 B ± 54.3609 B ± 69.8
CP-1829 ± 29.3837 A,B ± 24.6698 B ± 42.2596 A,B ± 67.6610 B ± 31.3
CP-2817 ± 31.5831 A,B ± 43.9718 A,B ± 58.0617 A,B ± 58.0584 B ± 61.6
CP-3830 ± 30.7856 A ± 24.3763 A ± 49.7667 A ± 66.7709 A ± 45.1
A,B averages differ significantly within a column (p < 0.05); * only six days—measurement end of day 34; REGWQ-test; LSD-test.
Table 5. Nitrogen content in excreta during the five-week trial period (mean ± SD).
ItemGroupWeek 1Week 2Week 3Week 4Week 5
Nitrogen content
[in g/kg DM; end of week]
CP-C44.7 A ± 2.1643.5 A ± 1.4544.8 A ± 1.2846.3 A ± 1.4350.0 A ± 3.13
CP-143.4 A,B ± 2.0538.7 B ± 0.7142.1 B ± 1.7945.0 A ± 1.5947.9 A ± 3.02
CP-240.4 A,B ± 2.1236.4 C ± 2.0136.4 C ± 2.5641.2 B ± 1.9442.4 B ± 2.64
CP-335.4 C ± 3.0329.1 D ± 0.8628.4 D ± 1.2929.7 C ± 1.6331.7 C ± 1.99
A,B,C averages differ significantly within a column (p < 0.05).
Table 6. Estimations of nitrogen balance over the entire trial period (mean ± SD).
GroupN-Intake From Feed [g/box]N-Amount in Final Litter [g/box]Weight Gain ∆ Final-Start [g/box]N-Retained [g/box]
CP-C1517 A ± 52.5581 A ± 39.632,033 B,C ± 781938 B ± 22.8
CP-11484 A,B ± 52.9522 B ± 28.232,923 A,B ± 1147938 B ± 22.9
CP-21451 B ± 35.8477 C ± 25.334,190 A ± 9871001 A ± 28.8
CP-31278 C ± 30.8416 D ± 20.031,220 C ± 803914 B ± 23.5
A,B,C,D averages differ significantly within a column (p < 0.05).
Table 7. Estimations of efficiencies of nitrogen utilization (mean ± SD).
GroupN-Retention Efficiency * [%]N-Efficiency Ratio [g/g]N-Excretion (Apparent) [g/box]N-Excretion (Apparent) [g/animal]
CP-C61.9 C ± 1.4621.1 D ± 0.50579 A ± 39.838.6 A ± 2.66
CP-163.3 C ± 2.7622.2 C ± 0.17546 A ± 56.736.4 A ± 3.78
CP-269.0 B ± 0.8123.6 B ± 0.28450 B ± 15.230.0 B ± 1.01
CP-371.5 A ± 0.7024.4 A ± 0.24364 C ± 12.624.2 C ± 0.84
A,B,C,D averages differ significantly within a column (p < 0.05). * Nitrogen retention efficiency (%) = (g N retained/g N consumed) × 100; Nitrogen efficiency rate = g weight gain/g N consumed; Nitrogen excretion (apparent) = g N consumed − g N retained.
Table 8. Foot pad (FPD) scores in broilers during the five-week trial period (mean ± SD).
ItemGroupWeek 1Week 2Week 3Week 4Week 5
FPD Scores
[averages of both feet; end of week]
CP-C0.04 ± 0.130.46 ± 0.380.94 B ± 0.200.97 ± 0.150.68 ± 0.39
CP-10.03 ± 0.120.43 ± 0.371.02 A,B ± 0.230.97 ± 0.120.61 ± 0.41
CP-20.05 ± 0.170.38 ± 0.371.04 A ± 0.230.97 ± 0.120.63 ± 0.40
CP-30.03 ± 0.120.45 ± 0.380.99 A,B ± 0.281.01 ± 0.120.74 ± 0.41
A,B averages differ significantly within a column (p < 0.05).
Table 9. Average villus height * and villus width in the ileum of broilers (mean ± SD).
ItemGroupDissection
Villus height * [in µm]CP-C454 ± 68.3
CP-1448 ± 58.1
CP-2455 ± 50.4
CP-3446 ± 75.9
Villus width [in µm]CP-C139 ± 23.0
CP-1142 ± 18.1
CP-2140 ± 26.9
CP-3140 ± 25.8
* Villus height was measured from the tip of the villi to the villus crypt junction; villus width was measured at the base of the villus above the villus crypt junction.

