The Effect of Social Ties between Outside and Inside Directors on the Association between Corporate Social Responsibility and Firm Value


School of Business, Yonsei University, Seoul 03722, Korea
*
Author to whom correspondence should be addressed.
Sustainability 2018, 10(11), 3840; https://doi.org/10.3390/su10113840
Submission received: 17 September 2018
/
Revised: 10 October 2018
/
Accepted: 16 October 2018
/
Published: 23 October 2018
(This article belongs to the Special Issue Corporate Social Responsibility (CSR) in Developing Countries: Current Trends and Development)
Abstract
:The purpose of this paper is to examine the association between activities related to corporate social responsibility (C81SR) and firm value, and whether social ties between outside and inside directors within the board (social ties) affect this association. We analyzed a sample of non-financial firms with fiscal year-end in December listed in the Korea Stock Exchange market for the period of 2012–2017, measuring the intensity of social ties based on region and school relations using the concept of density from social network theory. Using environment, social, and governance (ESG) scores from the Korea Corporate Governance Service to measure CSR activities, we find that, on average, firms can increase their value through CSR activities in Korea. In addition, in firms with strong social ties, the positive association between CSR activities and firm value is attenuated, indicating that boards with strong social ties are ineffective in monitoring CSR activities. Although the government has made great efforts to improve corporate governance with a focus on independence of outside directors, the results of our analysis indicate that there is room for firms to improve board independence substantively in a society where nepotism is widespread.
1. Introduction
The purpose of this study is to examine how activities related to corporate social responsibility (hereafter CSR activities) affect long-term firm value, and whether social ties between outside and inside directors within the board affect this association between CSR activities and long-term firm value. In particular, we focus on social ties based on region and school relations in Korea, where widespread nepotism developed from a strong and long history of Confucianism. This study clarifies the effect of CSR activities on firm value in a culture characterized by Confucianism, and shows that social ties can be a very important factor that investors and financial information users must consider in evaluating the effectiveness of corporate governance.
Firms’ CSR activities are not mandatory and incur costs; furthermore, these activities may not be directly related to firm’s value. Nevertheless, many firms devote their resources to CSR activities, and are willing to disclose details about these activities to investors and the general public. Prior studies have provided mixed results associated with the effect of CSR activities on firm value, examining the motivations behind engagement in these activities. First, managers invest in CSR activities from a purely ethical point of view, which can improve the reputation of the company, gauge public interest, and increase firm value in the long term [1,2,3,4,5]. Second, some CSR activities can be conducted with a short-term view, rather than a macroscopic one, as a means of pursuing private interests or of defending decision-making based on personal gain [6,7,8].
Corporate engagement in CSR activities has increased significantly in Korea in recent years. The amount of spending on CSR activities increased from about 700 billion Korean won (KRW) in 2000 to about 2900 billion KRW in 2015, and the ratio of CSR expenditure to sales was 0.24% on average in 2010, which is higher than that of US (0.11%) and Japanese companies (0.09%) in the same year [9]. The incentive to engage in these activities was strengthened following the International Monetary Fund (IMF) financial crisis in 1997, in which the IMF forced Korean public firms to reform their complex and opaque governance structures [10], which were cited as one of the main factors contributing to the crisis. Thus, Korean firms engaged in CSR activities to counteract the negative image related to poor governance and/or deflect stakeholders’ attention from it. Not surprisingly, managers of Korean firms tend to abuse these activities; therefore, their boards of directors are expected to monitor whether investment in CSR activities contributes positively to long-term firm value. The board not only makes resolutions and discusses various topics, approving corporate financial statements, paying bonuses to directors, and paying dividends to shareholders, but also makes important investment decisions on CSR activities, and nominates candidates for outside directors. Because the board deals with decisions related to investment in CSR activities, its advisory and supervisory roles are important. In this study, we identify the underlying motivation behind engagement in CSR activities, and examine the effects of investment in CSR activities on corporate value. In addition, we examine the factors influencing the election of outside directors. In a country which is highly influenced by Confucianism such as Korea, nepotism is rampant; this compromises the objectivity of management decisions. Because nepotism considers social relations among members of an organization to be more important than other factors in decision-making, the election of outside directors may be based on social networking with inside directors, rather than objective factors.
Social ties within the board can affect the advisory and monitoring roles of directors in different ways. Strong social ties between outside and inside directors may facilitate effective and efficient decision-making [11,12,13]. On the other hand, while CSR activities contribute positively to firm value and the welfare of society, they can also be a means of defending the management’s decision-making processes, with private intention from an opportunistic point of view when monitoring is not effective. Boards with strong social ties may be unable to perform the monitoring role adequately, due to a lack of board independence [11,14,15,16]. Recently, research has shown that a lack of board independence due to strong social ties substantially compromises monitoring [14,15,17,18,19,20,21,22,23]. In this study, we focus on the negative aspects of social ties in light of the characteristics of Korean society, including the heavy influence of nepotism. We posit that boards of directors that lack independence due to social ties are less likely to conduct adequate monitoring for the curtailment of their management’s opportunistic behavior associated with CSR activities.
This study encompasses firm-years listed in the Korea Stock Exchange (KSE) market for the period from 2012 to 2017. The results of this study are as follows: First, CSR activities are positively associated with long-term firm value. The results of this study show that CSR activities performed in Korea increase firm value on average by strengthening the reputation of firms and reducing the possibility of litigation [1,5,24]. Second, this study provides evidence that a positive relationship between a firm’s CSR activities and firm value wanes with an increase in social ties within the board. The results imply that boards with strong social ties lack substantive independence, and thus, do not adequately monitor and supervise investment decisions related to CSR activities that do not contribute to the enhancement of the firm’s value. CSR activities, when they are not properly monitored by an independent board, only increase cash expenditure in the short term, and undermine firm value in the long term. This negative impact is more pronounced when social ties are based on region and high school attended.
The contributions of this study are as follows. First, we show evidence that regulations related to board independence do not reflect cultural substance in a culture heavily influenced by nepotism. Korean society has endeavored to improve the corporate governance of its firms by focusing on factors related to the board, such as board size and the ratio of outside directors to the total number of board members. This has been true for many years since the IMF financial crisis; regulators expect that effective monitoring by the board of directors of management’s opportunistic behavior [25,26,27] will result in enhanced efficiency of operations and increased accounting transparency [28]. However, appointing outside board candidates who have specific social ties with inside directors compromises the effectiveness of the monitoring role in a culture characterized by nepotism. This raises public concerns about the objectivity and independence of outside directors who are appointed to monitor management. After being elected, non-objective outside directors may simply rubber stamp management decisions [1]. Our results suggest that even when the ratio of outside to inside directors has been systematically satisfied, the board’s monitoring role is ineffective. Second, we add new evidence to the mixed results about the positive association between CSR activities and firm value by showing that the board of directors is less likely to perform the monitoring role adequately due to a lack of independence.
In Korea, outside directors are defined as “directors who do not engage in the business of the company” according to the Korean Commercial Law of 2009 (Article 382, Section 2). These regulations allow room for selecting non-independent outside directors and treatment of the ratio of outside directors as only a formality [16]. Under Confucianism, people often form a confederacy to protect certain common values or interests among members who share the same regional and/or school background. Outside directors who have strong social ties in terms of region and school with inside directors are likely to act as strong supporters of these executives; the result is the board failing to function as an effective monitor. The results of this study suggest that institutional requirements regarding board independence should be developed with consideration of cultural characteristics and board independence.
This study continues as follows. In the next section, we review relevant prior studies and develop our research hypotheses. Section 3 explains the research model and the selection process for the sample used in this study. Section 4 and Section 5 report the results of our empirical analyses and conclude this study.
2. Literature Review and Hypothesis
2.1. CSR Activities and Firm Value
Firms are finding it more and more necessary to engage in CSR activities. But what is their motivation for doing so? We examine this question from two different perspectives.
Companies engage in CSR activities in the public interest, for philanthropic and/or ethical reasons [29,30]. The philanthropic/ethical perspective on CSR engagement may be firm-value neutral, or it may imply a cost increase with the expectation of future returns. On the other hand, firms can improve their reputation and brand value in the capital market through engagement in CSR activities for philanthropic/ethical purposes. This may indicate high management integrity, which is associated with low monitoring costs. In turn, engagement in CSR activities may improve long-term firm value resulting from sales increases, acquisition of talented human resources, and enhanced corporate image, among other things [1,4,5]. In addition, information asymmetry with external investors may be mitigated by improving communication channels through engagement in CSR activities [2]. McGuire et al. [24] argue that firms actively engaging in CSR activities can improve relationships with government agencies, attenuate control by regulatory authorities, and reduce the probability of litigation. Likewise, Wood and Ross [31] show that since enforcement of surveillance by environmental organizations increases litigation and related costs, companies actively try to invest in CSR activities, including environmental activities, to offset these costs. Furthermore, firms engaging in CSR activities for ethical reasons are more active in terms of public disclosure, and less involved in private profit-seeking activities, such as earnings management [32,33]. In response, socially-conscious investors are willing to pay higher premiums to firms that actively engage in CSR activities, which results in improved market value, lower cost of equity, and diminishing uncertainty about cash flow [34,35,36].
The other perspective is that some CSR activities are performed with a short-term view to defend management’s decision-making based on their personal interest. From this opportunistic point of view, CSR activities are pursued as a means of achieving managers’ private interest to the detriment of the interest of shareholders, often resulting in lower firm performance [7,8,37,38]. Since CSR activities have no direct causal relationship with profit, and the results of those activities are not visible in the short term, it is unlikely that incumbent managers will bear the responsibility for failed investment in CSR activities. In a similar vein, Lee and Byun [36] argue that CSR activities may increase the agency problem, and diminish firm value. Barnea and Rubin [6] also point out the possibility of overinvestment in CSR activities, arguing that CSR activities may lead to negative results, such as increased risk level if those activities are indiscriminately performed as a result of managers’ overinvestment to signal their reputation in the capital market. Sprinkle and Maines [39] suggest that engagement in CSR activities can be a cost factor when other profitable business opportunities are abandoned or missed.
Several studies have suggested a positive relationship between engagement in CSR activities and earnings management. For example, Barnea and Rubin [6], Chih et al. [40] and Prior et al. [41] point out that managers pursuing private interest and engaging in earnings management also actively engage in CSR activities. Barnea and Rubin [6] show that the lower the percentage of manager ownership, the less the need for managers to bear the costs of excessive investment in CSR activities. They suggest that CSR activities can be carried out indiscriminately based on managerial overinvestment incentives to signal managers’ reputations in the capital market. In this case, CSR activities signal to shareholders that the firm engages in CSR activities to reduce the possibility of being controlled by shareholders in response to executives’ opportunistic behavior.
Hoskisson et al. [42], Makhija [43], Peng [44], and Wright et al. [45] contend that CSR activities can be used for strategic decision making, and such strategic engagements are likely to vary according to institutional differences, such as the level of economic and institutional development, which is the institutional difference hypothesis [46]. For example, firms in developing countries, such as sub-Saharan African economics, are not receiving potential strategic benefit by engaging in CSR activities because they may find it difficult to raise capital, or not regard CSR activities as an integral part of their corporate goals [46,47,48,49]. In contrast, Korean firms have engaged deeply in CSR activities compared to firms in other Asian countries, and this engagement has increased significantly in the last ten years. Specifically, expenditure on CSR activities increased from about 700 billion won to about 2900 billion won in 2015 [9]. For Korean companies listed in the KSE market, 13% issued public reports related to CSR activities from 2008 to 2012 [50]. Kim and Shin [10] argue that after the IMF financial crisis of 1997, firms had the incentive to reform their corporate structure and improve their corporate image, which had been questioned and criticized. The economic crisis in Korea was partly due to the complex governance structure of Chaebols and their indiscriminate expansion. Chaebols used CSR activities to repair their damaged corporate image. Like this, Korean firms had the opportunity to receive such strategic benefits by investing in CSR activities, and as a result, CSR activities in Korea increased.
These two competing views on CSR activities make it difficult to conclude whether the purpose of engaging in these activities is solely for the pursuit of the public interest, intended to hide opportunistic behaviors, or is reflective of management’s ethically-motivated social values. An effective board is expected to play a significant role in monitoring management and determining the underlying motivation for engagement in CSR activities to ensure that these activities are conducted in a way that provides value to the firm, and not as a means of concealing opportunistic behaviors. In this study, we examine whether the board properly monitors and supervises CSR activities, because firms may have the opportunistic intentions behind engagement in CSR activities.
2.2. Board Independence and Social Ties
Intimate relationships between outside and inside directors have conflicting effects on firms. First, high intimacy between outside directors and directors within the board enables faster decision-making and effective information delivery, and facilitates efficient decision-making, which impacts firm value positively by increasing trust and the sharing of information [13]. Cooperation enhances the value of the firm for stakeholders [12]. An independent board is a corporate board that has a majority of outside directors who are not affiliated with the top executives of the firm, and who have minimal or no business dealings with the company to avoid potential conflicts of interest. Therefore, when outside directors who have social relations with inside directors are nominated, the board becomes less independent, making it hard to monitor and curtail management’s opportunistic behaviors such as earnings management, which has a negative impact on firm value. To encourage monitoring and supervising by an independent board of directors, firms must form a management-friendly board [11].
This study focuses on the effect of social ties on board independence. Krishnan et al. [16] argue that there is no formal relationship between the ratio of outside directors and substantive independence of the board. In Korean society, which is based on Confucianism with its emphasis on social relationships, deep-rooted, relationship-oriented customs are based on school ties and regionalism; this results in various social problems. The media and government agencies have questioned the practice of selecting outside directors based on social ties. Prior literature also shows an association between social ties within the board and a failure to curtail managers’ opportunistic behaviors and the negative effect on firm value and performance [18,19,20]. Likewise, Lim et al. [51] show an increase in outside directors who are bureaucrats in Korea. Research has shown that the ratio of bureaucratic outside directors to total directors has a significant negative impact on firm value. Park et al. [21] argue that earnings management is less problematic in firms with a higher ratio of outside directors with no social relationships with inside directors. Park et al. [21] point out that when social ties within the board are strong, insider trading by managers and earnings management significantly increase. In addition, Shawn and Jung [22] show an association between social ties between outside directors and the CEO and firms’ propensity toward overinvestment. Bruynseels and Cardinaels [14] show that when intimacy between members of the audit committee and the CEO is increased, the supervisory activities of the audit committee are hindered, expenses related to auditing services are reduced, and earnings management is increased. Based on these results of previous studies, we posit that when the board is characterized by many social ties, independence of the board is substantially compromised, which undermines firm value.
2.3. Research Hypotheses
While CSR activities are of great interest to stakeholders, the underlying motivations for engagement in these activities are questionable, and their effects on firm value are also unclear. There are competing views on CSR activities in terms of their effects on firm value. First, firms can engage in CSR activities to improve their overall reputation and image in the capital market; such engagement can ultimately improve long-term firm value [1,4,5]. As previously mentioned, this is known as the philanthropic and ethical view of CSR activities [29]. However, firms can also engage in CSR activities based on firms’ economic interests. This is known as the economic and legal view of CSR activities [29]. There is a third view: firms may spend their resources on CSR activities for opportunistic reasons related to management. This can be described as the opportunistic view. For example, firms may spend their resources on CSR activities to improve the personal reputation of the CEO, and to avoid negative publicity regarding managers’ opportunistic behaviors such as earnings management and excessive perks ([6,7,8,37,38,40,41], among others). Consistent with these competing views, empirical studies present mixed results on the association between CSR activities and firm value. Peloza [52] shows that 63% of the 159 studies investigating the association between CSR activities and firm value reported a positive relationship. We conjecture that these differing results stem from the different intentions for engaging in CSR activities.
Under the institutional difference hypothesis, CSR activities can be used for strategic decision making, and such strategic engagements are likely to vary according to institutional differences, such as level of economic and institutional development [46]. Involvement in CSR activities has continuously increased in Korea to the point where 13% of listed companies from 2008 to 2012 disclosed reports related to CSR activities [50]. However, Kim and Shin [10] explain this trend as corporate intention to counteract criticism of overly complex governance structures, wealth transfers from minority shareholders to the largest shareholders, and reckless diversification of Korean conglomerates, which were identified as among the causes of the IMF financial crisis in Korea. In summary, since engagement in CSR activities in Korea may be based on management’s strategic motivation to avoid negative publicity arising from such behaviors, because Korean firms were facing pressure for social engagement from diverse institutions, they could be viewed from an opportunistic rather than from an ethical perspective.
While most prior literature reports a positive relationship between CSR activities and firm value, an environment of opportunistic motivation may change this relationship. Our research question arises from the mixed results of studies of this relationship. We therefore state our first hypothesis in the null form:
Hypothesis 1.
Corporate CSR activities are not associated with long-term firm value.
Nepotism, which emphasizes collective relationships and connections by blood, region, and school, is one of the distinctive cultural characteristics of Korea and many Asian countries. In a country like Korea that is highly influenced by Confucianism, nepotism is rampant. For example, school ties are often formed when students enter high school, university, or graduate school by taking an entrance exam. In the process of preparing for this exam, a bond of sympathy is formed, and a group consciousness arises among the students based on affection for the school and each other. This situation can create elitism that carries on in the future, when membership in alumni associations affects appointment of professors, bureaucrats, auditors, and of course, outside directors. This collectivism has been criticized as a negative factor that damages pluralism and democracy in Korea. This cultural phenomenon can also influence corporate governance.
Since the underlying motivations for engagement in CSR activities are unobservable, we focus on the role of independent board members in monitoring the allocation of resources to CSR activities by management. In order to improve our understanding of the role of board independence with respect to CSR activities and firm value, it is necessary to examine the effect of board independence on the association between CSR activities and firm value. This is an especially important question in a culture where nepotism is dominant across organizations and society as a whole. The role of the board associated with CSR activities as related to firm value is expected to be ineffective if the board lacks substantive independence as a result of the heavy influence of nepotism in a Confucianistic culture.
Korea is deeply rooted in relationship-oriented customs and relationship-based characteristics. The resulting lack of board independence due to social ties is often publicly criticized. Seo et al. [53] point out that the greater the incentive for the CEO to weaken the supervisory function of the independent board, the more likely it is that the CEO will appoint outside directors with social ties based on region and school. Thus, outside directors who have social ties with management are not free from management’s influence. As a result, stakeholders may view the appointment of outside directors who have deep social ties with management negatively [1].
Social ties within the board have a very negative influence on board independence [15,17,23,54], and considerable research has been conducted on the impact of this lack of independence. Social ties within the board have a negative relation with firm value, failure to prevent earnings management or insider trading, and increased corporate overinvestment [19,20,21,22].
Candidates for outside directors are nominated by the board, which implies that management can easily appoint outside directors with whom they have social ties [1]. In addition, CSR investment decisions are treated as board resolutions. While CSR activities contribute positively to firm value and the welfare of society, CSR activities can also be a means of defending management’s decision-making with private intention when monitoring is not effective. Boards with strong social ties may be unable to perform the monitoring role adequately due to lack of board independence [11,14,16,42]. To understand the effect of CSR activities and the role of the board, we examine whether and how the characteristics of decision-making bodies (social ties in this study) affect the association between investment in CSR activities and firm value. We examine how social ties within the board affect the monitoring function by analyzing the effects of CSR activities on long-term firm value. We posit that boards of directors that lack independence due to social ties are less likely to conduct adequate monitoring for curtailing of management’s opportunistic behavior associated with CSR activities. If firms engage in CSR activities for ethical reasons, which can enhance firm value, boards with strong social ties (less independent boards) can weaken the positive association between CSR and firm value. On the other hand, if firms engage in CSR activities for opportunistic reasons, boards with strong social ties can cause a negative association between CSR and firm value. Based on the arguments above, we hypothesize as follows:
Hypothesis 2.
The positive (negative) association between a firm’s CSR activities and firm value is attenuated (exacerbated) by an increase in social ties within the board.
3. Research Model
3.1. Sample Selection
The sample of this study encompasses December fiscal year-end firms listed in the KSE market for the period 2012 to 2017; firms in the finance and insurance industry are not considered. Korea Corporate Governance Service (KCGS, hereafter) evaluated annual ESG reports in 2011 (KCGS has conducted evaluations of corporate governance since 2003. In 2011, it adopted the annual ESG evaluation adding social responsibility and environmentally responsible management to measure the level of sustainable management in listed companies in Korea.). As we use a lagged dependent variable model, the sample period is from 2012. We manually collect data regarding board members’ characteristics including region, high school, university, and graduate school from the KIS-LINE database. We obtain financial accounting data from the Fn-Guide database.
Table 1 describes the sample selection procedures. Between 2012 and 2017, 4128 non-financial firm-years with December fiscal year-end are recorded. We excluded 530 observations that lack ESG score data. We discarded another 84 observations without information on board members. Finally, we also excluded 124 observations because of missing data for the dependent variable and control variables. Thus, our final sample consists of 3390 firm-years that satisfy these requirements.
3.2. Research Model
3.2.1. Measurement of Firm Value
To measure firm value, we employ Tobin’s Q, which is the market value of the firm, divided by the replacement value of its assets. We use the firm’s market-to-book value as a proxy for Tobin’s Q, and we use the market value of common stock and preferred stock plus the book value of debt as a proxy for the firm’s market value. Tobin’s Q has been used widely in economics, finance, and accounting research (for example, [55]). It captures how much value the firm creates with its asset base. The advantage of using Tobin’s Q is that it is a long-term measure based on the market value of the firm.
3.2.2. Measurement of CSR
To measure a firm’s CSR activities, we employ ESG score data provided by KCGS. KCGS is a semi-governmental organization that assesses various aspects of sustainability management within Korean firms for policy-making purposes. Since 2011, KCGS has been performing annual ESG evaluations and publicly disclosing ESG scores. E score (environmental responsibility score) evaluation quantifies planning, execution, performance management, and reporting of environmental responsibilities within firms. S score (social responsibility score) evaluation quantifies the social responsibility of firms towards employees, customers, partners, competitors, and local communities. G score (governance score) evaluation includes investor protection, board and auditor effectiveness, and disclosure. Finally, the ESG score is the sum of the E score, S score, and G score. The ESG evaluation model was developed by KCGS independently, i.e., it was not only aligned with international standards such as the Organization for Economic Cooperation and Development (OECD) principles on corporate governance and ISO26000, but also faithfully reflective of legal and management circumstances in Korea.
3.2.3. Measurement of Social Ties
Social ties are measured by adopting concepts from social network theory. A social network is a set of people or groups of people with some pattern of interaction or ties between them. A social network analysis investigates the social structures that are inherent in networks, characterizing network structures in terms of actors and the ties that connect them [56,57]. In order to measure the intensity of social ties within the board, we use the concept of network density, which is a measure of how many connections there are among actors compared to the maximum possible number of connections that could exist among them; the higher the proportion, the denser the network [58]. The density of a binary network is the actual number of ties divided by the total number of possible ties. Group density can vary from 0, when members have no ties, to a maximum of 1, when all members have mutual ties for all dyads in the group. Likewise, we measure social ties within the board by how many connections there are between outside directors and inside directors compared to the maximum possible number of connections that could exist between outside directors and inside directors.
We identify social ties within the board based on region, high school, university, and graduate school, respectively. Social ties in Korea are mainly based on blood, region, and school [59]. However, we do not consider blood ties in this study, since they may exist among inside directors, whereas we do investigate social ties between outside and inside directors. Thus, we measure social ties within the board by the number of ties divided by the total number of possible ties between outside and inside directors based on region, high school, university, and graduate school.
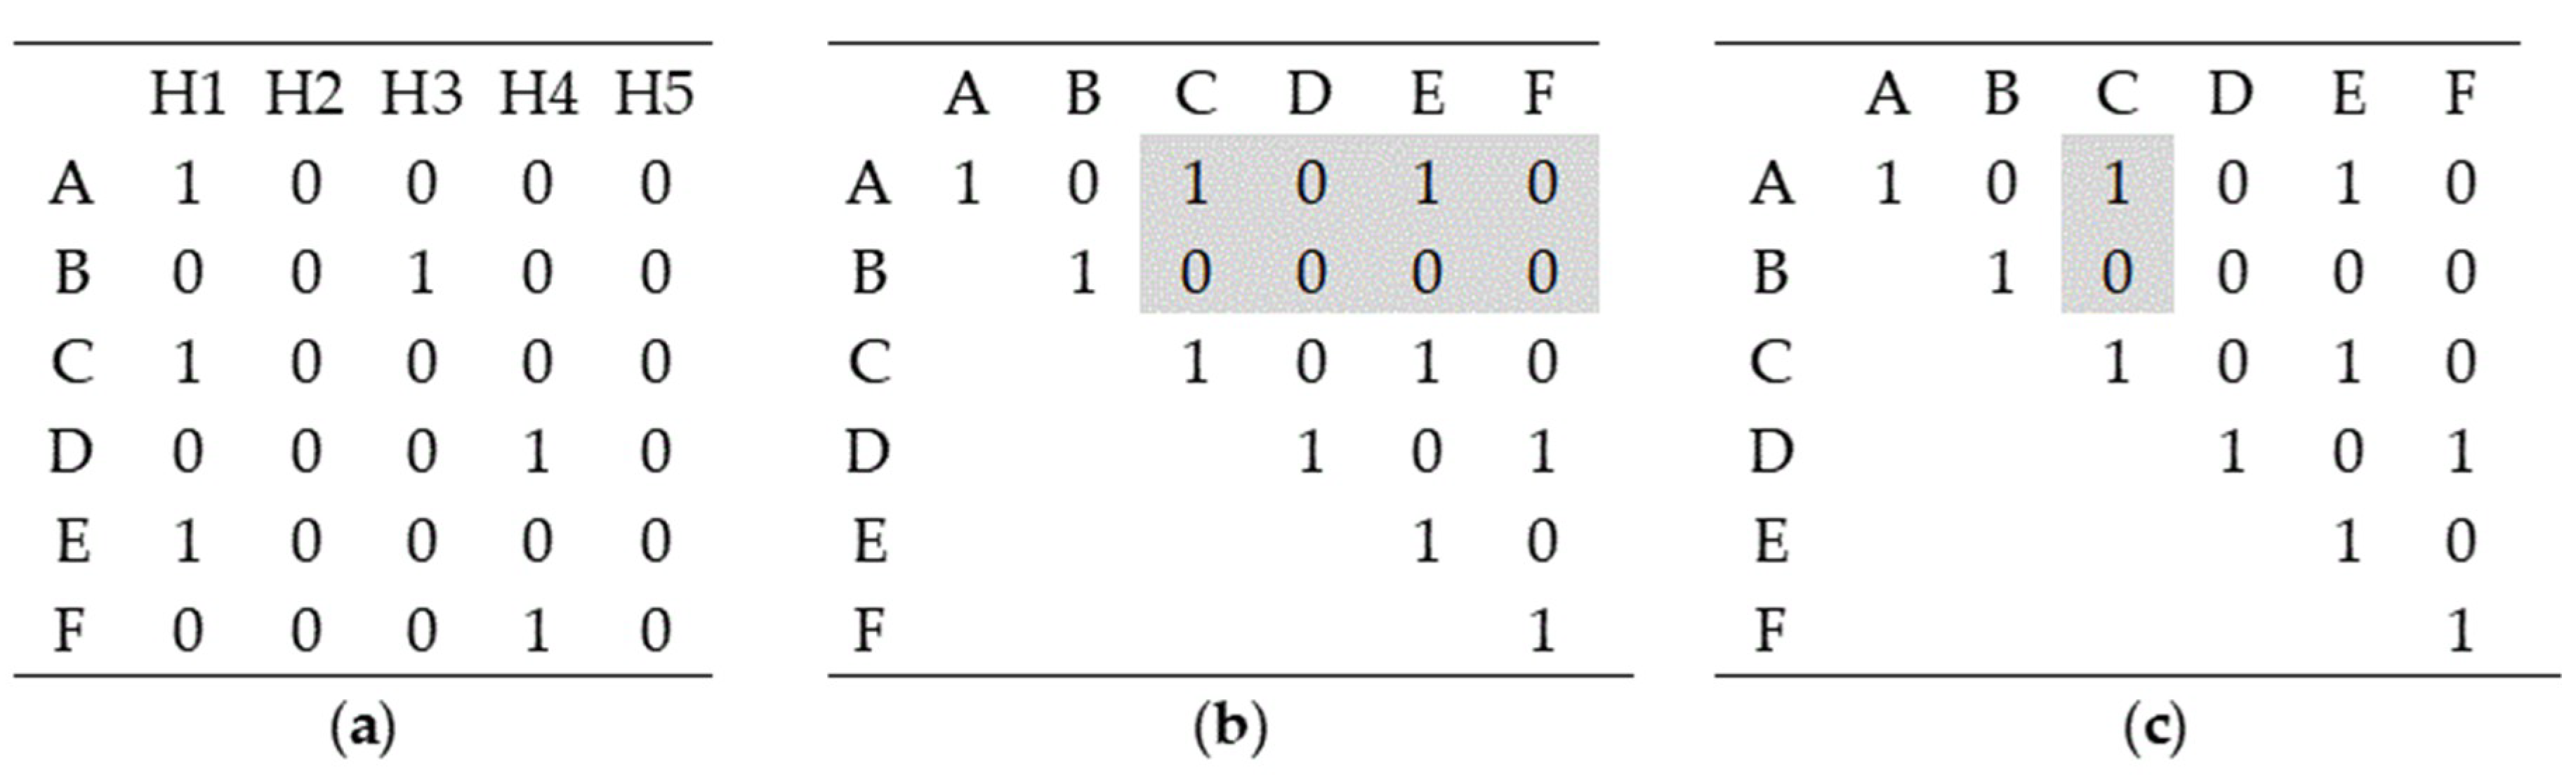
In order to measure regional, high school, university, and graduate school ties, we manually collect information about board members from the KIS-LINE database. Based on the concept of network density, we measure the regional, high school, university, and graduate school tie indices between outside directors and inside directors for each firm-year. Using information on each director’s region, high school, university, and graduate school, we construct an N × M matrix for each type of tie, in which N represents entries of all directors and M represents entries of each type of tie. Xijk is a binary variable, where the value 1 represents that director i belongs to j element of k type of tie. Here, k {1, 2, 3, 4}, where 1, 2, 3, and 4 represent regional, high school, university, and graduate school ties, respectively. Using the N × M matrix, we construct adjacent N × N matrices, which represent tie relations among directors. X of each N × N matrix is a binary variable, where the value 1 represents that there is a tie.
Figure 1 represents social ties within the board based on high school. X112 = 1 of the N × M matrix indicates that director A belongs to H1 high school. X variable of each N × N matrix has the value 1 if there is a social tie between directors. In Figure 1, when A and B are outside directors and C, D, E, and F are inside directors, the maximum possible number of connections that could exist between outside directors and inside directors is 8 (=2 × 4). Outside director A and inside director C have a high school tie, as do outside director A and inside director E. Thus, the index representing high school ties between outside directors and inside directors gives us a value of 0.25 (=2/8) in (b) of Figure 1. When A and B are outside directors and C is the CEO, the maximum possible number of connections that could exist between outside directors and the CEO is 2 (=2 × 1) in (c) of Figure 1. Outside director A and inside director C have a high school tie; thus, we utilize the high school tie index between outside directors and the CEO and obtain a value of 0.5 (=1/2).
3.2.4. Regression Model
Hypothesis 1 predicts that a firm’s CSR activities are not associated with long-term firm value, since CSR activities are performed with either an ethical view or an opportunistic view. To test Hypothesis 1, we estimate the following OLS (ordinary least squares) regression model (1);
where
| Q | = | Tobin’s Q (= market value of equity + book value of debt)/book value of total assets; |
| ESG | = | ESG score standardized by total asset (= ESG score/total assets), n = 1, 2, and 3; |
| SIZE | = | firm size (= log(1 + total assets)); |
| LEV | = | leverage (= total debts/total assets); |
| ROA | = | return on assets (= net income/total assets); |
| GROWTH | = | growth rate (= salest+n/salest, n = 1, 2, and 3); |
| VOL | = | the standard deviation of daily stock returns; |
| INTAN | = | intangible asset ratio (= intangible assets/total assets); |
| AGE | = | firm age (= log(age)); |
| BOD | = | number of directors on the board; |
| OWN | = | largest shareholder ownership; |
| FOR | = | foreign investor ownership; |
| ∑IND | = | industry dummies; |
| ∑YR | = | year dummies; |
| ε | = | error term; and |
| i, t | = | firm i, period t. |
The dependent variable in regression model (1) is firm value measured as Tobin’s Q (Q). We use a lagged dependent variable model to investigate long-term causal effects of CSR activities on firm value. The key independent variable in regression model (1) is ESG score (ESG), which measures CSR activities. Motivated by existing studies on the determinants of Tobin’s Q [60,61,62,63], we control for factors that affect firm value, such as firm size (SIZE), leverage (LEV), profitability (ROA), sales growth (GROWTH), stock return volatility (VOL), R&D intensity (INTAN), and firm age (AGE). We also control the size of the board (BOD) as board characteristics may drive CSR activities [64,65]. Finally, many studies have demonstrated the influence of ownership structure on CSR activities [66,67], we include largest shareholder ownership (OWN), as the corporate ownership structure of firms in Korea is characterized by the existence of the largest shareholders who typically have a heavy influence in management and control in excess of their ownership. We also include foreign investor ownership (FOR), as foreign investors represent a distinctive class of shareholders in the Korean capital market.
Hypothesis 2 predicts that positive (negative) association between a firm’s CSR activities and firm value is attenuated (exacerbated) with an increase in social ties within the board; we establish this definition in order to examine whether social ties within the board affect the monitoring role. To test Hypothesis 2, we estimate the following OLS regression model (2):
where
| Q | = | Tobin’s Q (= market value of equity + book value of debt)/book value of total assets; |
| ESG | = | ESG score standardized by total assets (= ESG score/total assets); |
| BODTIETOTAL | = | sum of tie indexes between outside directors and inside directors(= BODTIEHOME + BODTIEHIGH + BODTIEUNIV + BODTIEGRAD); |
| BODTIEHOME | = | region tie index between outside directors and inside directors; |
| BODTIEHIGH | = | high school tie index between outside directors and inside directors; |
| BODTIEUNIV | = | university tie index between outside directors and inside directors; |
| BODTIEGRAD | = | graduate school tie index between outside directors and inside directors; |
| SIZE | = | firm size (= log (1 + total assets)); |
| LEV | = | leverage (= total debt/total assets); |
| ROA | = | return on asset (= net income/total assets); |
| GROWTH | = | growth rate (= salest+n /salest, n = 1, 2, and 3); |
| VOL | = | standard deviation of daily stock returns; |
| INTAN | = | intangible asset ratio (= intangible assets/total assets); |
| AGE | = | firm age (= log (age)); |
| BOD | = | number of directors on the board; |
| OWN | = | largest shareholder ownership; |
| FOR | = | foreign investor ownership; |
| ∑IND | = | industry dummies; |
| ∑YR | = | year dummies; |
| ε | = | error term; and |
| i, t | = | firm i, period t. |
The dependent variable in regression model (2) is firm value measured as Tobin’s Q (Q). Likewise, in model (1), we also use a lagged-variable model to investigate long-term causal effects of CSR activities on firm value. In order to investigate long-term causal relationships between CSR activities and firm value, we also use independent variables in years t − 2 and t − 3 consistent with the analysis for testing of Hypothesis 1. The untabulated results are consistent with those of the main analysis. The key independent variables in regression model (2) are interaction terms between ESG score (ESG) and social ties (BODTIE).
4. Results of the Empirical Analysis
4.1. Descriptive Statistics and Correlation Analysis
Descriptive statistics for variables used in the regression are presented in Table 2. We winsorize continuous values among independent variables and dependent variables at the 1% and 99% levels to mitigate the effects of outliers. The mean of the dependent variable, Tobin’s Q (Q), which is measured by the firm’s market-to-book value, is 1.2010. The mean of one of our key independent variables, ESG score (ESG), which is a proxy for the firm’s CSR activities, is 289.1582, and the value is distributed from 88.0000 to 670.0000. As ESG score is highly correlated with firm size, we use ESG score standardized by total assets to estimate models (1) and (2).
Other key independent variables are social ties based on region, high school, university, and graduate school. The mean of BODTIEHOME is 0.0585, which indicates that the average value on the regional tie index between outside directors and inside directors is 0.0585 (i.e., the number of regional ties divided by the total number of possible regional ties is 0.0585 on average). The mean values of BODTIEHIGH, BODTIEUNIV, and BODTIEGRAD indicate that the average values on the high school tie index, university tie index, and graduate school tie index between outside directors and inside directors are 0.0214, 0.0953, and 0.0235, respectively. The mean of BODTIETOTAL is 0.2006, which is based on the sum of BODTIEHOME, BODTIEHIGH, BODTIEUNIV, and BODTIEGRAD. The mean value of BODTIETOTAL appears to be somewhat low, because a relatively large portion of boards in the sample firms is not made up of social ties based on region or school. The minimum, median, and maximum values of BODTIE show that its distribution is skewed; thus, we conduct a robustness analysis using a dummy variable for the existence of social ties within the board.
Table 3 presents a correlation matrix of the variables. The results show that the dependent variable, firm value (Q), is positively and significantly correlated with ESG score (ESG Score), indicating that firms’ CSR activities are positively associated with firm value. Q is negatively and significantly correlated with social ties between outside directors and inside directors (BODTIETOTAL), suggesting that social ties within the board are negatively associated with firm value. Specifically, Q is negatively correlated with BODTIEHOME and BODTIEHIGH, while it is positively correlated with BODTIEGRAD. This indicates that social ties based on region and high school may have a negative impact on firm value. By contrast, social ties based on graduate school may have a positive impact on firm value. In addition, none of the correlations among independent variables are high enough to cause concern, and the analysis of variance inflation factors associated with our regressions do not suggest that multicollinearity is a concern.
4.2. Results of the Multivariate Analysis
4.2.1. Hypothesis 1: The Impact of CSR on Firm Value
Table 4 reports the results of our multivariate analysis testing our Hypothesis 1 using Equation (1). Columns (1), (2), and (3) of Table 4 display the regression results using Tobin’s Q (Q) in years t + 1, t + 2, and t + 3, respectively as dependent variables. The coefficients of ESG score (ESG) are positively and statistically significant in all columns. These findings indicate that firms’ CSR activities are positively associated with firm value on average. While CSR activities are performed to contribute positively to the firm and society, CSR activities are also performed as a means of defending management’s decision-making based on private intention and opportunism. The results of this study show that engagement in CSR activities by Korean firms increases firm value on average, possibly by strengthening firms’ overall reputation and corporate image in the capital market [1,4,5].
4.2.2. Hypothesis 2: The Impact of Social Ties on the Relationship between CSR and Firm Value
Table 5 reports the results of the multivariate analysis testing our Hypothesis 2 using equation (2). Column (1) of Table 5 shows the results using BODTIETOTAL, that is, the sum of BODTIEHOME, BODTIEHIGH, BODTIEUNIV, and BODTIEGRAD, as the independent variables. Columns (2), (3), (4), and (5) of Table 5 show the results using BODTIEHOME, BODTIEHIGH, BODTIEUNIV, and BODTIEGRAD, respectively as independent variables.
The coefficient of the interaction term between ESG and BODTIETOTAL is negatively and statistically significant in Column (1), indicating that the positive relationship between firms’ CSR activities and firm value is attenuated with an increase in social ties within the board. These results imply that boards with strong social ties lack independence, and do not adequately monitor and supervise investment decisions regarding CSR activities that cannot contribute to enhancing firm value. We conjecture that engagement in CSR activities, which are not properly monitored by an independent board, can only increase cash expenditure in the short term, and undermine firm value in the long term. More specifically, the coefficients of the interaction term between ESG and BODTIEHOME and the interaction term between ESG and BODTIEHIGH are negatively and statistically significant in Columns (2) and (3). These results suggest that the negative impact of social ties on the relationship between a firm’s CSR activities and firm value is more pronounced in firms where board members have social ties based on region and high school. N.B While the effect of social ties on firm value is not of interest in this paper, it is interesting to see that the coefficient of BODTIEUNIV in itself is significantly positive and the sum of the coefficient of the interaction term between ESG and BODTIEUNIV and the coefficient of BODTIEUNIV is positive. This result may suggest that the negative monitoring effect of BODTIEUNIV on CSR activities may be outweighed by the positive effect of social ties based on university on firm value. This is possibly because social ties based on university enable management to identify adequate channels through which to lobby for favorable transitions for their firms. This phenomenon is consistent with stories in numerous newspapers in Korea indicating that the key personnel in major corporations and regulatory agencies are alumni of several major universities in Korea. These alumni groups are very active, frequently conducting meetings, and holding various types of events to develop strong informal ties and foster smoother and more favorable treatments in return for business transactions, promotion, approvals, and penalties among members. This practice of taking advantage of social ties is similar to Kwhanxi in China, but it is stronger, and focuses on a narrower range (i.e., university ties).
In the past, the benefits of industrialization were mainly concentrated in certain areas in Korea, resulting in strong regional nepotism [69]. The fact that Hyang Woo Hoe, which means “community based on region”, permeates all levels of Korean society proves that social ties based on region are important in Korea [70]. Students enter high school by taking exams [71]; through preparing for these exams, a bond of sympathy is formed and a group consciousness arises among the students based on affection for the school and each other. This situation can create elitism. Unlike university and graduate schools, high schools are relatively small; thus, students share the same cultural and environmental characteristics of the region where the schools are located. We conjecture that the significantly positive association between ESG and BODTIEHOME and the positive association between ESG and BODTIEHIGH can be explained by these Korean cultural characteristics regarding region and high school [21]. The coefficient of the interaction term between ESG and BODTIEUNIV is also significantly negative in Column (4). Even if members of the board graduated from the same university or graduate school, intimacy is likely to be lower when they studied in different departments. University ties may be weaker in terms of social connection and group consciousness compared to high school ties, because the entrance quota is larger than that of high school [22]. Considering the average age of managers of public firms in Korea, admission to elite high schools was very competitive when today’s inside directors were teenagers. They share very strong emotional ties, having come from the same region and gone through difficult times together in a challenging high school environment [21]. Because our main question concerns the effect of social ties within the board of directors, especially those between outside directors and inside directors, on monitoring of CSR activities that can contribute to enhancing firm value, we focus on the moderating effects of social ties (coefficients of ESG × BODTIE).
4.3. Additional Analyses
4.3.1. Additional Analysis 1: Social Ties as a Dummy Variable
The above descriptive statistics show that the distribution of BODTIE is skewed; thus, we conduct a robustness analysis using a dummy variable for the existence of social ties within the board. The results are reported in Table 6. Columns (1), (2), (3), (4), and (5) of Table 6 show the results using dBODTIETOTAL, dBODTIEHOME, dBODTIEHIGH, dBODTIEUNIV, and dBODTIEGRAD, respectively, as independent variables. The coefficients of the interaction term between ESG and dBODTIEHOME and the interaction term between ESG and dBODTIEHIGH are negatively and statistically significant in Columns (2) and (3). The results support those of the main analysis that the negative impact of social ties on the relationship between a firm’s CSR activities and firm value is especially pronounced when social ties exist based on region and high school.
4.3.2. Additional Analysis 2: ESG Score
To measure a firm’s CSR activities, we employ ESG score data provided by KCGS. ESG score is comprised of E score (environmental responsibility score), S score (social responsibility score), and G score (governance score). As a robustness analysis, we use the sum of E score and S score, since doing so may be a more appropriate proxy to measure a firm’s CSR activities. G score reflects a firm’s governance characteristics. While governance characteristics are important to measure a firm’s sustainability management level, which is the purpose of ESG evaluation, they are likely to less important in measurement of a firm’s CSR activities.
We report the results in Table 7. Columns (1), (2), (3), (4), and (5) of Table 7 show the results using BODTIETOTAL, BODTIEHOME, BODTIEHIGH, BODTIEUNIV, and BODTIEGRAD, respectively as independent variables. The coefficients of the interaction term between ES and BODTIETOTAL, the interaction term between ES and BODTIEHOME, and the interaction term between ES and BODTIEHIGH are negatively and statistically significant in Columns (1), (2) and (3), which indicates that the results using the ES score are consistent with those of the main analysis.
4.3.3. Additional Analysis 3: Social Ties between Outside Directors and the CEO
Prior literature on social ties [15,16,72] analyzes the social ties between outside directors and the CEO. We also conduct a robustness analysis using social ties between outside directors and the CEO. We measure the social tie index between outside directors and the CEO by the number of ties divided by the total number of possible ties between outside directors and the CEO in accordance with the density concept from social network theory. Table 8 presents the results. Columns (1), (2), (3), (4), and (5) of Table 8 show the results using CEOTIETOTAL, CEOTIEHOME, CEOTIEHIGH, CEOTIEUNIV, and CEOTIEGRAD, respectively as independent variables. The coefficients of the interaction term between ESG and CEOTIEHOME and the interaction term between ESG and CEOTIEHIGH are negatively and statistically significant in Columns (2) and (3). The results using social ties between outside directors and the CEO are generally consistent with those of the main analysis.
4.3.4. Additional Analysis 4: Instrumental Variables
To control for endogeneity concerns, we conduct a two-stage instrumental variable analysis according to the approach of Bruynseels and Cardinaels [14]. Because social ties are persistent over time [73], we run a first-stage model that estimates the observed level of social ties through other activities with the lag of BODTIE as an instrumental variable and all previously used control variables of equation (2) as exogenous variables [14]. The predicted social ties from the first stage then replace BODTIE in our second-stage model. We report the second-stage results in Table 9. Columns (1), (2), (3), (4), and (5) of Table 9 show the results using instrumental variables for social ties within the board (BODTIETOTAL, BODTIEHOME, BODTIEHIGH, BODTIEUNIV, and BODTIEGRAD, respectively) as independent variables. The results for our second-stage models produce similar conclusions, suggesting that our main results are robust to the endogeneity problem.
As our sample contains observations on multiple firms across multiple time periods, our sample is subject to the potential heteroscedasticity problem. To address the potential heteroscedasticity problem, we include year dummy variables to absorb the year fixed effects, and our tabulated test statistics are based on heteroscedasticity consistent standard errors using White [68] procedure. In order to consider firm effects simultaneously, first, we include firm fixed effects and year fixed effects in model (1) and (2), as the Hausman test results show that a fixed effects model is more appropriate than a random effects model (fixed effects analysis). Second, according to the arguments of Petersen [74] that including year fixed effects and then estimating standard errors clustered by firm is appropriate when both firm effects and year effects are present and panel data set has much more firms than years, we conduct clustering by firm (one-way clustering). Finally, based on the arguments that clustering by firm and year is robust to cross-sectional and time-series dependence [75,76], we simultaneously cluster by firm and year (two-way clustering). Untabulated results show that our main results are robust to fixed effects analysis, one-way clustering, and two-way clustering.
5. Conclusions
This study examines how CSR-related activities affect long-term firm value, and whether social ties between outside and inside directors within the board affect the association between CSR activities and long-term firm value. The results of this study are as follows. First, we find that a firm’s CSR activities are positively associated with long-term firm value. This implies that CSR activities performed in Korea increase firm value on average by strengthening the overall reputation and image of firms and reducing the possibility of litigation. Second, the positive relationship between a firm’s CSR activities and firm value is attenuated with an increase in social ties within the board. These results suggest that outside directors having strong social ties with inside directors are less likely to supervise investment decisions adequately regarding CSR activities that do not contribute to enhancing firm value. CSR activities, which are not properly monitored by a substantially independent board, can only increase cash expenditure in the short term, and undermine long-term firm value. Our main results are robust to using a dummy variable for the existence of social ties within the board, using social ties between outside directors and the CEO, or using only environmental responsibility score and social responsibility score to measure a firm’s CSR activities. In addition, our main results hold in the two-stage instrumental variable analysis to control for endogeneity concerns and fixed effects analysis, one-way clustering, and two-way clustering to address heteroscedasticity problems.
In Korea, regional nepotism has been influential since the formation of the Joseon Dynasty in 1392, and developed as the benefits of industrialization in certain regions became concentrated over time [77]. Elite groups in the Joseon Dynasty were trained in local and/or central elite schools known as Hyanggyo and Seonggyungwan. This elitist tradition continued in certain high schools after the dynasty collapsed, and even today, students enter elite high schools by taking a very competitive entrance exam [71]. They share the cultural and environmental characteristics of the region where these schools are located, along with a bond of sympathy and group consciousness. Similarly, intimacy among university alumni is very likely to be high, although the entrance quota is larger than that of high schools.
For twenty years after the IMF financial crisis, the Korean government has made great efforts to improve corporate governance. Regulatory authorities focus on the independence of outside directors in enhancing efficient operation, effective monitoring, and accounting transparency. However, the results of our study suggest that there is room for firms to improve board independence in a society where nepotism is influential. Outside directors may lack substantive independence because firms are only formally obliged to meet the ratio of outside to inside directors on the board. This may particularly be the case in a society where the cultural climate is heavily affected by nepotism which developed over a long history of strong Confucianism. Under Confucianism, people from the same school or region often form a confederacy to protect certain values or common interests among members who share the same background. Outside directors having strong social ties of region and schools with inside directors often become strong supporters for company executives, and therefore, fail to function as effective monitors. The results of this study suggest that institutional requirements of board independence should be developed to counteract cultural characteristics and enhance substantive board independence.
Like other studies, our paper has a few limitations, and we suggest future research opportunities based on the limitations. First, our study is analyzing Korean firms’ CSR activities; however, since a firm’s CSR activities are likely to vary according to institutional differences such as level of economic and institutional development [46], caution should be exercised in generalizing our results to other countries. For example, in the institutionally-stable and resource-abundant countries of North America and Europe, firms are more likely to act in socially responsible ways as they operate in an environment where normative calls for such behavior are institutionalized [78]. In contrast, as firms in developing countries are not receiving potential strategic benefit by investing in CSR activities [47,48,49], CSR activities has the low priority status. Second, since the necessity of board monitoring is different depending on the firm characteristics, future studies could investigate the effect of social ties within the board on the relationship between CSR activities and firm value according to firm size or family firms versus non-family firms. For example, large firms can be criticized for undermining shareholder value when they invest in CSR activities that cannot contribute to the enhancement of firm value since they are under political scrutiny and extensive monitoring [79]. Therefore, the monitoring role of the independent board associated with CSR activities is important in large firms. On the other hand, small firms or family firms are not likely to face such pressure from diverse parties including stockholders [77,79]. Finally, our data could be exposed to the endogeneity and heteroscedasticity problem. Though we address the issues using two-stage instrumental variable analysis and using fixed effects analysis, one-way clustering, and two-way clustering, the econometric techniques employed in this study could still be subject to limitations.
Author Contributions
Conceptualization, J.H.P., H.-Y.P., and H.-Y.L.; Methodology and Software, H.-Y.P.; Formal Analysis and Investigation, H.-Y.P.; Resources, H.-Y.L.; Data Curation, J.H.P.; Writing-Original Draft Preparation, J.H.P. and H.-Y.L.; Writing-Review & Editing, H.-Y.L.; Supervision, H.-Y.L.
Funding
This research received no external funding
Conflicts of Interest
The authors declare no conflict of interest.
References
- Adams, C.A. Internal organisational factors influencing corporate social and ethical reporting: Beyond current theorising. Account. Audit. Account. J. 2002, 15, 223–250. [Google Scholar] [CrossRef]
- Cui, J.; Jo, H.; Na, H. Does corporate social responsibility affect information asymmetry? J. Bus. Ethics 2016, 148, 549–572. [Google Scholar] [CrossRef]
- Ko, S.C.; Park, R.S. Corporate social responsibility and firm value. J. Taxation Account. 2011, 12, 105–134. (In Korean) [Google Scholar]
- Patten, D.M.; Zhao, N. Standalone CSR reporting by US retail companies. Account. Forum 2014, 38, 132–144. [Google Scholar] [CrossRef]
- Schwartz, R. Corporate philanthropic contributions. J. Financ. 1968, 23, 479–497. [Google Scholar] [CrossRef]
- Barnea, A.; Rubin, A. Corporate social responsibility as a conflict between shareholders. J. Bus. Ethics 2010, 97, 71–86. [Google Scholar] [CrossRef]
- Brammer, S.; Brooks, C.; Pavelin, S. Corporate social performance and stock returns: UK evidence from disaggregate measures. Financ. Manag. 2006, 35, 97–116. [Google Scholar] [CrossRef]
- Vance, S.C. Are socially responsible corporations good investment risks. Manag. Rev. 1975, 64, 19–24. [Google Scholar]
- The Federation of Korean Industries. Corporate Community Relations White Book 2010; The Federation of Korean Industries: Seoul, Korea, 2010. (In Korean) [Google Scholar]
- Kim, J.O.; Shin, Y.J. The long-term effect of CSR and role of board of directors. Korean Account. J. 2015, 24, 277–311. (In Korean) [Google Scholar]
- Adams, R.; Ferreira, D. A theory of friendly boards. J. Financ. 2007, 62, 217–250. [Google Scholar] [CrossRef]
- Hoitash, U. Should independent board members with social ties to management disqualify themselves from serving on the board? J. Bus. Ethics 2010, 99, 399–423. [Google Scholar] [CrossRef]
- Westphal, J.D. Collaboration in the boardroom: Behavioral and performance consequences of CEO-board social ties. Acad. Manag. J. 1999, 42, 7–24. [Google Scholar]
- Bruynseels, L.; Cardinaels, E. The audit committee: Management watchdog or personal friend of the CEO? Account. Rev. 2014, 89, 113–145. [Google Scholar] [CrossRef]
- Hwang, B.H.; Kim, S. It pays to have friends. J. Financ. Econ. 2009, 93, 138–158. [Google Scholar] [CrossRef]
- Krishnan, G.V.; Raman, K.K.; Yang, K.; Yu, W. CFO/CEO-board social ties, Sarbanes-Oxley, and earnings management. Account. Horiz. 2011, 25, 537–557. [Google Scholar] [CrossRef]
- Fracassi, C.; Tate, G. External networking and internal firm governance. J. Financ. 2012, 67, 153–194. [Google Scholar] [CrossRef]
- Kang, Y.S.; Kook, C.P. The effect of independent outside directors on firm value. Asian Rev. Financ. Res. 2012, 25, 451–498. (In Korean) [Google Scholar]
- Kim, J.K.; Shin, J.Y. The effect of social ties of outside board directors and their independence on firm value. Korean J. Financ. Stud. 2016, 45, 713–739. (In Korean) [Google Scholar]
- Lee, J.H.; Choi, C.; Kim, J.M. Outside directors’ social capital and firm performance: A Complex Network Approach. Soc. Behav. Pers. Int. J. 2012, 40, 1319–1331. [Google Scholar] [CrossRef]
- Park, J.H.; Lee, H.Y.; Shin, H.M. The effect of social ties between outside directors and inside directors on insider trading and earnings management. Korean Manag. Rev. 2016, 45, 1697–1733. (In Korean) [Google Scholar] [CrossRef]
- Shawn, H.; Jung, J.G. Watchdog or lapdog of the CEO? Effects of social ties between outside directors and the CEO on the overinvestment. Korean Account. Rev. 2015, 40, 327–366. (In Korean) [Google Scholar]
- Westphal, J.D.; Graebner, M.E. A matter of appearances: How corporate leaders manage the impressions of financial analysts about the conduct of their boards. Acad. Manag. J. 2010, 53, 15–43. [Google Scholar] [CrossRef]
- McGuire, J.B.; Sundgren, A.; Schneeweis, T. Corporate social responsibility and firm financial performance. Acad. Manag. J. 1988, 31, 854–872. [Google Scholar]
- Armstrong, C.S.; Guay, W.R.; Weber, J.P. The role of information and financial reporting in corporate governance and debt contracting. J. Account. Econ. 2010, 50, 2–3. [Google Scholar] [CrossRef]
- Bushman, R.M.; Piotroski, J.D.; Smith, A.J. What determines corporate transparency? J. Account. Res. 2004, 42, 207–252. [Google Scholar] [CrossRef]
- Cai, J.; Garner, J.L.; Walkling, R.A. Electing directors. J. Financ. 2009, 64, 2389–2421. [Google Scholar] [CrossRef]
- Lee, S.C.; Lee, K.T. An empirical study on the effect of an audit committee on earnings management. Korean Account. Rev. 2003, 28, 143–172. (In Korean) [Google Scholar]
- Carroll, A.B. A Three-Dimensional Conceptual Model of Corporate Performance. Acad. Manag. Rev. 1979, 4, 497–505. [Google Scholar] [CrossRef]
- Carroll, A.B. The pyramid of corporate social responsibility: Toward the moral management of organizational stakeholders. Bus. Horiz. 1991, 34, 39–48. [Google Scholar] [CrossRef]
- Wood, D.; Ross, D.G. Environmental social controls and capital investments: Australian evidence. Account. Financ. 2006, 46, 677–695. [Google Scholar] [CrossRef]
- Choi, T.H.; Pae, J. Business ethics and financial reporting quality: Evidence from Korea. J. Bus. Ethics 2011, 103, 403–427. [Google Scholar] [CrossRef]
- Gelb, D.S.; Strawser, J.A. Corporate social responsibility and financial disclosure: An alternative explanation for increased disclosure. J. Bus. Ethics 2001, 33, 1–13. [Google Scholar] [CrossRef]
- Anderson, J.; Franke, A. Voluntary social reporting: An ISO-beta portfolio analysis. Account. Rev. 1980, 15, 467–479. [Google Scholar]
- Dhaliwal, D.S.; Li, O.Z.; Tsang, A.; Yang, Y.G. Voluntary nonfinancial disclosure and the cost of equity capital: The initiation of corporate social responsibility reporting. Account. Rev. 2011, 86, 59–100. [Google Scholar] [CrossRef]
- Lee, J.H; Byun, H.S. Does corporate social responsibility activities reduce the risk of firms? Evidence from Korea. Korean Manag. Rev. 2016, 45, 1551–1586. (In Korean) [Google Scholar] [CrossRef]
- Shane, P.B.; Spicer, B.H. Market response to environmental information produced outside the firm. Account. Rev. 1983, 58, 521–538. [Google Scholar]
- Wright, P.; Ferris, S.P. Agency conflict and corporate strategy: The effect of divestment on corporate value. Strateg. Manag. J. 1997, 18, 77–83. [Google Scholar] [CrossRef]
- Sprinkle, G.; Maines, L. The benefits and costs of Corporate Social Responsibility. Bus. Horiz. 2010, 53, 445–453. [Google Scholar] [CrossRef]
- Chih, H.; Shen, C.; Kang, F. Corporate social responsibility, investor protection, and earnings management: Some international evidence. J. Bus. Ethics 2008, 79, 179–198. [Google Scholar] [CrossRef]
- Prior, D.; Surroca, J.; Tribo, J. Are socially responsible managers really ethical? Exploring the relationship between earnings management and corporate social responsibility. Corp. Gov. Int. Rev. 2008, 16, 160–177. [Google Scholar] [CrossRef] [Green Version]
- Hoskisson, R.E.; Eden, L.; Lau, C.M.; Wright, M. Strategy in emerging economies. Acad. Manag. J. 2000, 43, 249–267. [Google Scholar]
- Makhija, M. Comparing the resource-based and market-based views of the firm: Empirical evidence from Czech privatization. Strateg. Manag. J. 2003, 24, 433–451. [Google Scholar] [CrossRef]
- Peng, M.W. Institutional transitions and strategic choices. Acad. Manag. Rev. 2003, 28, 275–296. [Google Scholar] [CrossRef]
- Wright, M.; Filatotchev, I.; Hoskisson, R.E.; Peng, M.W. Guest editors’ introduction strategy research in emerging economies: Challenging the conventional wisdom. J. Manag. Stud. 2005, 42, 1–33. [Google Scholar] [CrossRef]
- Julain, S.; Ofori-dankwa, J. Financial resource availability and corporate social responsibility expenditures in a sub-saharan economy. Strateg. Manag. J. 2013, 34, 1311–1330. [Google Scholar]
- Austin, J.A.Q.; Kresge, S.S.; Cohn, W. Pathways to business success in sub-Saharan Africa. J. Afr. Financ. Econ. Dev. 1996, 2, 56–76. [Google Scholar]
- Chu, H.M.; Benzing, C.; McGee, C. Ghanaian and Kenyan entrepreneurs: A comparative analysis of their motivations, success characteristics and problems. J. Dev. Entrep. 2007, 12, 295–322. [Google Scholar] [CrossRef]
- Frynas, J.G. The false development promise of corporate social responsibility: Evidence from multinational oil companies. Int. Aff. 2005, 81, 581–598. [Google Scholar] [CrossRef]
- Ahn, S.A. Analysis on sustainability reports of publicly traded firms in Korea. Corp. Gov. Rev. 2013, 68, 88–111. (In Korean) [Google Scholar]
- Lim, T.K.; Huh, J.J.; Bae, S.H.; Jeong, S.W. Corporate value differences in the appointment, appointment change, and proportion of ex-bureaucrats as outside directors—Focused on KOSPI Market. Korean Manag. Rev. 2015, 44, 1305–1326. (In Korean) [Google Scholar] [CrossRef]
- Peloza, J. The challenge of measuring financial impacts from investments in corporate social performance. J. Manag. 2009, 35, 1518–1541. [Google Scholar] [CrossRef]
- Seo, J.I.; Lee, G.H.; Nam, Y.S. A study on the determinants of outside director appointment: Institutional change and CEO’s decoupling behavior. J. Organ. Manag. 2011, 35, 103–129. (In Korean) [Google Scholar]
- Schmidt, B. Costs and benefits of friendly boards during mergers and acquisitions. J. Financ. Econ. 2015, 117, 424–447. [Google Scholar] [CrossRef] [Green Version]
- Morck, R.; Shleifer, A.; Vishny, R.W. Management ownership and market valuation: An empirical analysis. J. Financ. Econ. 1988, 20, 293–315. [Google Scholar] [CrossRef]
- Scott, J. Social Network Analysis; Sage: London, UK, 2000. [Google Scholar]
- Wasserman, S.; Faust, K. Social Network Analysis: Methods and Applications; Cambridge University Press: Cambridge, UK, 1994. [Google Scholar]
- Kilduff, M.; Tsai, W. Social Networks and Organizations; Sage: London, UK, 2003. [Google Scholar]
- Kim, Y.H. Social Network Analysis, 3rd ed.; Parkyoungsa: Seoul, Korea, 2011. (In Korean) [Google Scholar]
- Kalcheva, I.; Lins, K.V. International evidence on cash holdings and expected managerial agency problems. Rev. Financ. Stud. 2007, 20, 1087–1112. [Google Scholar] [CrossRef]
- Laeven, L.; Levine, R. Complex ownership structures and corporate valuations. Rev. Financ. Stud. 2008, 21, 579–604. [Google Scholar] [CrossRef]
- Padgett, R.C.; Galan, J.I. The effect of R&D intensity on corporate social responsibility. J. Bus. Ethics 2010, 93, 407–418. [Google Scholar]
- Servaes, H.; Tamayo, A. The impact of corporate social responsibility on firm value: The role of customer awareness. Manag. Sci. 2013, 59, 1045–1061. [Google Scholar] [CrossRef]
- Buchanan, B.; Cao, C.X.; Chen, C. Corporate social responsibility, firm value, and influential institutional ownership. J. Corp. Financ. 2018, 52, 73–95. [Google Scholar] [CrossRef]
- Giannarakis, G. The determinants influencing the extent of CSR disclosure. Int. J. Law Manag. 2014, 56, 393–416. [Google Scholar] [CrossRef]
- Grougiou, V.; Dedoulis, E.; Leventis, S. Corporate social responsibility reporting and organizational stigma: The case of “sin” industries. J. Bus. Res. 2016, 69, 905–914. [Google Scholar] [CrossRef]
- Iyer, V.; Lulseged, A. Does family status impact US firms’ sustainability reporting? Sustain. Account. Manag. Policy J. 2013, 4, 163–189. [Google Scholar] [CrossRef]
- White, H. A heteroskedasticity-consistent covariance matrix estimator and a direct test for heteroskedasticity. Econ. J. Econ. Soc. 1980, 817–838. [Google Scholar] [CrossRef]
- Kim, M.H. Political cleavages, party politics, and localism in Korea. Korean Polit. Sci. Rev. 1995, 28, 215–237. (In Korean) [Google Scholar]
- Cheong, B.E. The social capital of Hyangwoohoe (hometown-friends association) and regionalism—An empirical study of the Andong-Hyangwoohoe in Seoul. Soc. Sci. Res. Rev. 2007, 23, 331–358. (In Korean) [Google Scholar]
- Kang, D.J. Progress of high school standardization. Educ. Crit. 2002, 6, 56–74. (In Korean) [Google Scholar]
- Rose, J.M.; Rose, A.M.; Norman, C.S.; Mazza, C.R. Will disclosure of friendship ties between directors and CEOs yield perverse effects? Account. Rev. 2014, 89, 1545–1563. [Google Scholar] [CrossRef]
- Carcello, J.V.; Hermanson, D.R.; Ye, Z. Corporate governance research in accounting and auditing: Insights, practice implications, and future research directions. Audit. J. Pract. Theory 2011, 30, 1–31. [Google Scholar] [CrossRef]
- Petersen, M.A. Estimating standard errors in finance panel data sets: Comparing approaches. Rev. Fianac. Stud. 2009, 22, 435–480. [Google Scholar] [CrossRef]
- Gow, I.D.; Ormazabal, G.; Taylor, D.J. Correcting for cross-sectional and time-series dependence in accounting research. Account. Rev. 2010, 85, 483–512. [Google Scholar] [CrossRef]
- Thompson, S.B. Simple formulas for standard errors that cluster by both firm and time. J. Financ. Econ. 2011, 99, 1–10. [Google Scholar] [CrossRef]
- Panwar, R.; Paul, K.; Nybakk, E.; Hansen, E.; Thompson, D. The legitimacy of CSR actions of publicly traded. J. Bus. Ethics 2014, 125, 481–496. [Google Scholar] [CrossRef]
- Campbell, J.L. Why would corporations behave in socially responsible ways? An institutional theory of corporate social responsibility. Acad. Manag. Rev. 2007, 32, 946–967. [Google Scholar] [CrossRef]
- Panwar, R.; Nyabakk, E.; Hansen, E.; Pinkse, J. Does the business case matter? The effect of a perceived business case on small firms’ small engagement. J. Bus. Ethics 2017, 144, 597–608. [Google Scholar] [CrossRef]
Figure 1.
Social Ties on the Board: (a) N × M matrix; (b) N × N matrix (social ties between outside directors and inside directors); (c) N × N matrix (social ties between outside directors and CEO); A and B are outside directors; C, D, E, and F are inside directors; C is CEO [21,59].


Table 1.
Sample Selection Process.
| Sample Selection Process | N |
|---|---|
| Total listed non-financial firms with December fiscal year-end 2012–2017 | 4128 |
| Firms without ESG score data | (530) |
| Firms without board member characteristics data | (84) |
| Firms without necessary data for dependent variable and control variables | (124) |
| Final sample firm-years | 3390 |
Table 2.
Descriptive Statistics (n = 3390).
| Variable | Mean | SD | Min | 25% | Median | 75% | Max |
|---|---|---|---|---|---|---|---|
| Q | 1.2010 | 0.7562 | 0.4504 | 0.8042 | 0.9848 | 1.2904 | 5.2464 |
| ESG Score | 289.1582 | 126.5490 | 88.0000 | 198.0000 | 274.9000 | 342.0000 | 670.0000 |
| ESG | 1.0636 | 1.2418 | 0.0149 | 0.2608 | 0.6523 | 1.3588 | 6.7688 |
| BODTIETOTAL | 0.2006 | 0.2460 | 0.0000 | 0.0000 | 0.1111 | 0.3333 | 1.0000 |
| BODTIEHOME | 0.0585 | 0.1248 | 0.0000 | 0.0000 | 0.0000 | 0.0667 | 0.6667 |
| BODTIEHIGH | 0.0214 | 0.0636 | 0.0000 | 0.0000 | 0.0000 | 0.0000 | 0.3333 |
| BODTIEUNIV | 0.0953 | 0.1447 | 0.0000 | 0.0000 | 0.0000 | 0.1667 | 0.6667 |
| BODTIEGRAD | 0.0235 | 0.0656 | 0.0000 | 0.0000 | 0.0000 | 0.0000 | 0.3333 |
| SIZE | 19.9929 | 1.5120 | 17.0875 | 18.9519 | 19.7621 | 20.7876 | 24.2880 |
| LEV | 0.4121 | 0.2121 | 0.0141 | 0.2412 | 0.4107 | 0.5676 | 0.9286 |
| ROA | 0.0160 | 0.0802 | −0.4049 | 0.0024 | 0.0246 | 0.0513 | 0.2107 |
| GROWTH | 0.0327 | 0.2278 | −0.5763 | −0.0637 | 0.0161 | 0.0943 | 1.2544 |
| VOL | 0.3837 | 0.1538 | 0.1408 | 0.2759 | 0.3565 | 0.4543 | 0.9376 |
| INTAN | 0.0190 | 0.0306 | 0.0000 | 0.0031 | 0.0076 | 0.0200 | 0.1973 |
| AGE | 3.7506 | 0.4657 | 2.6135 | 3.6131 | 3.8762 | 4.0658 | 4.5225 |
| BOD | 3.4522 | 1.2356 | 1.0000 | 3.0000 | 3.0000 | 4.0000 | 8.0000 |
| OWN | 0.4372 | 0.1646 | 0.0916 | 0.3168 | 0.4370 | 0.5434 | 0.8290 |
| FOR | 0.1016 | 0.1300 | 0.0000 | 0.0131 | 0.0448 | 0.1450 | 0.6058 |
Definitions of variables: Q = Tobin’s Q (= (market value of equity + book value of debt)/book value of total assets; ESG Score = ESG score by Korea Corporate Governance Service (KCGS); ESG = ESG score standardized by total assets (= ESG score/total assets); BODTIETOTAL = sum of tie indexes between outside directors and inside directors (= BODTIEHOME + BODTIEHIGH + BODTIEUNIV + BODTIEGRAD); BODTIEHOME = regional tie index between outside directors and inside directors; BODTIEHIGH = high school tie index between outside directors and inside directors; BODTIEUNIV = university tie index between outside directors and inside directors; BODTIEGRAD = graduate school tie index between outside directors and inside directors; SIZE = firm size (= log (1 + total assets)); LEV = leverage (= total debt/total assets); ROA = return on asset (= net income/total assets); GROWTH = growth rate (= salest+n/salest); VOL = standard deviation of daily stock returns; INTAN = intangible asset ratio (= intangible assets/total assets); AGE = firm age (= log (age)); BOD = number of directors on the board; OWN = largest shareholder ownership; FOR = foreign investor ownership.
Table 3.
Correlation Coefficients (n = 3390).
| (1) | (2) | (3) | (4) | (5) | (6) | (7) | (8) | (9) | (10) | (11) | (12) | (13) | (14) | (15) | (16) | (17) | (18) | |
| (1) | 1 | 0.04 | 0.15 | −0.03 | −0.11 | −0.09 | 0.02 | 0.14 | −0.04 | −0.07 | 0.07 | 0.13 | 0.21 | 0.16 | −0.13 | 0.03 | −0.14 | 0.20 |
| ** | *** | * | *** | *** | *** | ** | *** | *** | *** | *** | *** | *** | * | *** | *** | |||
| (2) | 1 | −0.27 | 0.08 | −0.01 | 0.02 | 0.12 | 0.03 | 0.71 | 0.17 | 0.09 | −0.04 | −0.25 | 0.12 | −0.01 | 0.02 | −0.11 | 0.42 | |
| *** | *** | *** | *** | *** | *** | ** | *** | *** | *** | *** | ||||||||
| (3) | 1 | −0.11 | −0.06 | −0.06 | −0.14 | 0.03 | −0.72 | −0.13 | −0.20 | 0.03 | 0.32 | 0.02 | −0.02 | −0.06 | −0.13 | −0.30 | ||
| *** | *** | *** | *** | * | *** | *** | *** | *** | *** | *** | *** | |||||||
| (4) | 1 | 0.65 | 0.50 | 0.71 | 0.39 | 0.14 | 0.00 | 0.07 | −0.02 | −0.05 | −0.02 | 0.00 | −0.02 | −0.04 | 0.03 | |||
| *** | *** | *** | *** | *** | *** | *** | ** | * | ||||||||||
| (5) | 1 | 0.30 | 0.10 | 0.05 | 0.03 | 0.01 | 0.06 | −0.04 | −0.03 | −0.08 | 0.05 | −0.02 | 0.00 | −0.01 | ||||
| *** | *** | *** | * | *** | ** | *** | *** | |||||||||||
| (6) | 1 | 0.15 | 0.01 | 0.06 | 0.00 | 0.02 | −0.03 | −0.02 | −0.01 | 0.03 | 0.01 | 0.00 | −0.02 | |||||
| *** | *** | * | * | |||||||||||||||
| (7) | 1 | 0.14 | 0.19 | 0.00 | 0.05 | 0.00 | −0.07 | 0.01 | −0.03 | −0.02 | −0.03 | 0.05 | ||||||
| *** | *** | *** | *** | ** | * | *** | ||||||||||||
| (8) | 1 | 0.00 | −0.02 | 0.04 | 0.03 | 0.02 | 0.04 | −0.02 | −0.01 | −0.07 | 0.04 | |||||||
| ** | ** | *** | ** | |||||||||||||||
| (9) | 1 | 0.18 | 0.16 | −0.01 | −0.33 | 0.08 | 0.00 | 0.08 | −0.02 | 0.51 | ||||||||
| *** | *** | *** | *** | *** | *** | |||||||||||||
| (10) | 1 | −0.32 | −0.04 | 0.22 | 0.01 | 0.00 | −0.01 | −0.12 | −0.15 | |||||||||
| *** | *** | *** | *** | *** | ||||||||||||||
| (11) | 1 | 0.21 | −0.33 | −0.05 | −0.03 | −0.03 | 0.19 | 0.25 | ||||||||||
| *** | *** | *** | * | * | *** | *** | ||||||||||||
| (12) | 1 | 0.05 | 0.06 | −0.03 | 0.00 | 0.02 | 0.02 | |||||||||||
| *** | *** | * | ||||||||||||||||
| (13) | 1 | 0.03 | 0.01 | −0.04 | −0.19 | −0.29 | ||||||||||||
| ** | *** | *** | ||||||||||||||||
| (14) | 1 | −0.07 | 0.01 | −0.09 | 0.09 | |||||||||||||
| *** | *** | *** | ||||||||||||||||
| (15) | 1 | 0.06 | −0.06 | −0.05 | ||||||||||||||
| *** | *** | *** | ||||||||||||||||
| (16) | 1 | −0.06 | 0.11 | |||||||||||||||
| *** | *** | |||||||||||||||||
| (17) | 1 | −0.17 | ||||||||||||||||
| *** | ||||||||||||||||||
| (18) | 1 |
(1) = Q, (2) = ESG Score, (3) = ESG, (4) = BODTIETOTAL, (5) = BODTIEHOME, (6) = BODTIEHIGH, (7) = BODTIEUNIV, (8) = BODTIEGRAD, (9) = SIZE, (10) = LEV, (11) = ROA, (12) = GROWTH, (13) = VOL, (14) = INTAN, (15) = AGE, (16) = BOD, (17) = OWN, (18) = FOR. Detailed definitions of variables are presented in the note of Table 2. *, **, and *** denote significance at the 10%, 5%, and 1% levels, respectively.
Table 4.
Hypothesis 1: The Impact of CSR on Firm Value.
| Variables | (1) Y = Q (n = 1) | (2) Y = Q (n = 2) | (3) Y = Q (n = 3) | |||
|---|---|---|---|---|---|---|
| Coef. | p-Value | Coef. | p-Value | Coef. | p-Value | |
| Intercept | 1.4835 | (4.89) *** | 1.1725 | (4.21) *** | 1.1662 | (4.03) *** |
| ESG | 0.0818 | (4.3) *** | 0.1015 | (7.01) *** | 0.1020 | (6.51) *** |
| SIZE | −0.0160 | (−1.14) | −0.0059 | (−0.45) | −0.0082 | (−0.63) |
| LEV | 0.0333 | (0.43) | 0.0809 | (1.03) | 0.0694 | (0.86) |
| ROA | 1.0440 | (3.99) *** | 1.3144 | (5.19) *** | 1.2303 | (4.59) *** |
| GROWTH | 0.2063 | (2.88) *** | 0.0086 | (0.62) | 0.0148 | (1.02) |
| VOL | 1.3604 | (12.5) *** | 1.3330 | (12.09) *** | 1.3282 | (11.86) *** |
| INTAN | 2.3732 | (4.5) *** | 2.4162 | (4.52) *** | 2.3001 | (4.28) *** |
| AGE | −0.1454 | (−5.42) *** | −0.1254 | (−4.52) *** | −0.1233 | (−4.29) *** |
| BOD | 0.0219 | (2.13) ** | 0.0220 | (2.12) ** | 0.0177 | (1.67) * |
| OWN | −0.1820 | (−2.07) ** | −0.1411 | (−1.58) | −0.1374 | (−1.53) |
| FOR | 1.5365 | (8.7) *** | 1.5474 | (8.69) *** | 1.5741 | (8.67) *** |
| ΣIND, ΣYR | Included | Included | Included | |||
| Adjusted R2 | 22.20% | 24.08% | 24.33% | |||
| F Statistics | 35.53 *** | 38.32 *** | 38.02 *** | |||
| Sample Size | 3390 | 3296 | 3224 | |||
Table 5.
Hypothesis 2: The Impact of Social Ties on the Relationship between CSR and Firm Value.
| Variables | (1) Y = Q | (2) Y = Q | (3) Y = Q | (4) Y = Q | (5) Y = Q | |||||
|---|---|---|---|---|---|---|---|---|---|---|
| Coef. | p-Value | Coef. | p-Value | Coef. | p-Value | Coef. | p-Value | Coef. | p-Value | |
| Intercept | 1.5543 | (5.13) *** | 1.5322 | (5.08) *** | 1.4831 | (4.92) *** | 1.6297 | (5.38) *** | 1.4240 | (4.72) *** |
| ESG | 0.0991 | (4.89) *** | 0.0853 | (4.4) *** | 0.0831 | (4.33) *** | 0.0921 | (4.7) *** | 0.0836 | (4.21) *** |
| ESG×BODTIETOTAL | −0.1439 | (−2.97) *** | ||||||||
| ESG×BODTIEHOME | −0.1953 | (−3.75) *** | ||||||||
| ESG×BODTIEHIGH | −0.2804 | (−2.21) ** | ||||||||
| ESG×BODTIEUNIV | −0.2573 | (−3.28) *** | ||||||||
| ESG×BODTIEGRAD | −0.1322 | (−0.79) | ||||||||
| BODTIETOTAL | 0.1499 | (1.54) | ||||||||
| BODTIEHOME | −0.1033 | (−1.17) | ||||||||
| BODTIEHIGH | −0.4825 | (−2.93) *** | ||||||||
| BODTIEUNIV | 0.4036 | (3.53) *** | ||||||||
| BODTIEGRAD | 1.2756 | (4.11) *** | ||||||||
| SIZE | −0.0215 | (−1.52) | −0.0186 | (−1.33) | −0.0154 | (−1.1) | −0.0262 | (−1.85) * | −0.0161 | (−1.15) |
| LEV | 0.0427 | (0.55) | 0.0453 | (0.59) | 0.0249 | (0.32) | 0.0382 | (0.49) | 0.0319 | (0.41) |
| ROA | 1.0645 | (4.11) *** | 1.1027 | (4.2) *** | 1.0707 | (4.1) *** | 1.0399 | (3.99) *** | 0.9947 | (3.85) *** |
| GROWTH | 0.2034 | (2.87) *** | 0.1985 | (2.79) *** | 0.1969 | (2.77) *** | 0.2088 | (2.94) *** | 0.2025 | (2.86) *** |
| VOL | 1.3625 | (12.56) *** | 1.3603 | (12.54) *** | 1.3584 | (12.5) *** | 1.3623 | (12.55) *** | 1.3508 | (12.68) *** |
| RD | 2.3678 | (4.52) *** | 2.2859 | (4.33) *** | 2.3908 | (4.57) *** | 2.3935 | (4.55) *** | 2.3238 | (4.4) *** |
| AGE | −0.1433 | (−5.36) *** | −0.1435 | (−5.36) *** | −0.1424 | (−5.33) *** | −0.1421 | (−5.31) *** | −0.1404 | (−5.23) *** |
| BOD | 0.0224 | (2.18) ** | 0.0213 | (2.08) ** | 0.0221 | (2.16) ** | 0.0233 | (2.26) ** | 0.0223 | (2.17) ** |
| OWN | −0.1762 | (−2.02) ** | −0.1856 | (−2.12) ** | −0.1952 | (−2.23) ** | −0.1703 | (−1.95) * | −0.1486 | (−1.72) * |
| FOR | 1.5380 | (8.73) *** | 1.5331 | (8.68) *** | 1.5096 | (8.6) *** | 1.5511 | (8.8) *** | 1.5265 | (8.71) *** |
| ΣIND, ΣYR | Included | Included | Included | Included | Included | |||||
| Adjusted R2 | 22.41% | 22.55% | 22.58% | 22.50% | 23.07% | |||||
| F Statistics | 33.63 *** | 33.90 *** | 33.95 *** | 33.80 *** | 34.88 *** | |||||
| Sample Size | 3390 | 3390 | 3390 | 3390 | 3390 | |||||
Table 6.
Additional Analysis 1: Social Ties as a Dummy Variable.
| Variables | (1) Y = Q | (2) Y = Q | (3) Y = Q | (4) Y = Q | (5) Y = Q | |||||
|---|---|---|---|---|---|---|---|---|---|---|
| Coef. | p-Value | Coef. | p-Value | Coef. | p-Value | Coef. | p-Value | Coef. | p-Value | |
| Intercept | 1.5507 | (4.98) *** | 1.5460 | (4.96) *** | 1.3935 | (4.6) *** | 1.5892 | (5.02) *** | 1.5610 | (5.16) *** |
| ESG | 0.0926 | (4.54) *** | 0.0842 | (4.42) *** | 0.0864 | (4.5) *** | 0.0843 | (4.4) *** | 0.0800 | (4.07) *** |
| ESG × dBODTIETOTAL | −0.0275 | (−0.99) | ||||||||
| ESG × dBODTIEHOME | −0.0839 | (−3.06) *** | ||||||||
| ESG × dBODTIEHIGH | −0.0701 | (−3.2) *** | ||||||||
| ESG × dBODTIEUNIV | −0.0131 | (−0.42) | ||||||||
| ESG × dBODTIEGRAD | −0.0073 | (−0.21) | ||||||||
| dBODTIETOTAL | 0.0448 | (1.19) | ||||||||
| dBODTIEHOME | −0.0468 | (−1.4) | ||||||||
| dBODTIEHIGH | −0.0929 | (−2.99) *** | ||||||||
| dBODTIEUNIV | 0.0618 | (1.71) * | ||||||||
| dBODTIEGRAD | 0.1830 | (3.88) *** | ||||||||
| SIZE | −0.0208 | (−1.42) | −0.0197 | (−1.4) | −0.0121 | (−0.87) | −0.0229 | (−1.53) | −0.0215 | (−1.53) |
| LEV | 0.0411 | (0.53) | 0.0585 | (0.76) | 0.0262 | (0.34) | 0.0379 | (0.49) | 0.0304 | (0.39) |
| ROA | 1.0435 | (3.98) *** | 1.1251 | (4.3) *** | 1.0852 | (4.16) *** | 1.0480 | (4.04) *** | 0.9956 | (3.84) *** |
| GROWTH | 0.2071 | (2.9) *** | 0.1993 | (2.82) *** | 0.1940 | (2.73) *** | 0.2061 | (2.89) *** | 0.2026 | (2.85) *** |
| VOL | 1.3666 | (12.58) *** | 1.3414 | (12.42) *** | 1.3511 | (12.43) *** | 1.3669 | (12.56) *** | 1.3445 | (12.53) *** |
| RD | 2.3818 | (4.53) *** | 2.2266 | (4.22) *** | 2.3544 | (4.51) *** | 2.3615 | (4.47) *** | 2.3453 | (4.45) *** |
| AGE | −0.1446 | (−5.41) *** | −0.1428 | (−5.3) *** | −0.1394 | (−5.21) *** | −0.1437 | (−5.37) *** | −0.1407 | (−5.26) *** |
| BOD | 0.0208 | (1.99) ** | 0.0278 | (2.67) *** | 0.0277 | (2.66) *** | 0.0192 | (1.86) * | 0.0172 | (1.66) * |
| OWN | −0.1775 | (−2.01) ** | −0.1867 | (−2.13) ** | −0.1993 | (−2.28) ** | −0.1739 | (−1.98) ** | −0.1524 | (−1.76) * |
| FOR | 1.5436 | (8.75) *** | 1.5531 | (8.77) *** | 1.5025 | (8.59) *** | 1.5542 | (8.79) *** | 1.5131 | (8.61) *** |
| ΣIND, ΣYR | Included | Included | Included | Included | Included | |||||
| Adjusted R2 | 22.20% | 22.77% | 22.70% | 22.25% | 22.85% | |||||
| F Statistics | 33.24 *** | 34.31 *** | 34.18 *** | 33.33 *** | 34.46 *** | |||||
| Sample Size | 3390 | 3390 | 3390 | 3390 | 3390 | |||||
dBODTIE is 1 if social ties exist on the board, and 0 otherwise. Detailed definitions of other variables are in the note of Table 2; T-values are based on heteroscedasticity consistent standard errors using White [68] procedure; *, **, and *** denote significance at the 10%, 5%, and 1% levels, respectively.
Table 7.
Additional Analysis 2: ESG Score.
| Variables | (1) Y = Q | (2) Y = Q | (3) Y = Q | (4) Y = Q | (5) Y = Q | |||||
|---|---|---|---|---|---|---|---|---|---|---|
| Coef. | p-Value | Coef. | p-Value | Coef. | p-Value | Coef. | p-Value | Coef. | p-Value | |
| Intercept | 1.8672 | (6.61) *** | 1.8320 | (6.43) *** | 1.7625 | (6.21) *** | 1.8901 | (6.39) *** | 1.6442 | (6.05) *** |
| ES | 0.1056 | (5.12) *** | 0.0886 | (4) *** | 0.0885 | (4.02) *** | 0.0994 | (4.76) *** | 0.0988 | (4.87) *** |
| ES×BODTIETOTAL | −0.2102 | (−2.85) *** | ||||||||
| ES×BODTIEHOME | −0.3151 | (−4.26) *** | ||||||||
| ES×BODTIEHIGH | −0.4394 | (−2.69) *** | ||||||||
| ES×BODTIEUNIV | −0.3389 | (−2.54) ** | ||||||||
| ES×BODTIEGRAD | −0.3381 | (−1.67) * | ||||||||
| BODTIETOTAL | 0.1362 | (1.48) | ||||||||
| BODTIEHOME | −0.1166 | (−1.42) | ||||||||
| BODTIEHIGH | −0.4982 | (−3.27) *** | ||||||||
| BODTIEUNIV | 0.3640 | (3.13) *** | ||||||||
| BODTIEGRAD | 1.3970 | (5.13) *** | ||||||||
| SIZE | −0.0366 | (−2.79) *** | −0.0333 | (−2.55) ** | −0.0292 | (−2.24) ** | −0.0389 | (−2.81) *** | −0.0275 | (−2.22) ** |
| LEV | 0.0379 | (0.49) | 0.0403 | (0.52) | 0.0212 | (0.27) | 0.0320 | (0.41) | 0.0265 | (0.34) |
| ROA | 1.1290 | (4.37) *** | 1.1581 | (4.41) *** | 1.1272 | (4.33) *** | 1.0939 | (4.22) *** | 1.0593 | (4.15) *** |
| GROWTH | 0.2079 | (2.92) *** | 0.2025 | (2.84) *** | 0.2002 | (2.81) *** | 0.2118 | (2.97) *** | 0.2040 | (2.89) *** |
| VOL | 1.3757 | (12.74) *** | 1.3723 | (12.73) *** | 1.3697 | (12.68) *** | 1.3778 | (12.76) *** | 1.3637 | (12.89) *** |
| RD | 2.4730 | (4.76) *** | 2.3843 | (4.56) *** | 2.4899 | (4.79) *** | 2.4920 | (4.78) *** | 2.4099 | (4.61) *** |
| AGE | −0.1379 | (−5.13) *** | −0.1378 | (−5.12) *** | −0.1362 | (−5.07) *** | −0.1364 | (−5.07) *** | −0.1340 | (−4.97) *** |
| BOD | 0.0209 | (2.05) ** | 0.0201 | (1.97) ** | 0.0208 | (2.03) ** | 0.0218 | (2.12) ** | 0.0207 | (2.03) ** |
| OWN | −0.1953 | (−2.22) ** | −0.2015 | (−2.28) ** | −0.2111 | (−2.39) ** | −0.1896 | (−2.15) ** | −0.1588 | (−1.82) * |
| FOR | 1.5428 | (8.76) *** | 1.5394 | (8.72) *** | 1.5145 | (8.63) *** | 1.5552 | (8.83) *** | 1.5260 | (8.73) *** |
| ΣIND, ΣYR | Included | Included | Included | Included | Included | |||||
| Adjusted R2 | 22.74% | 22.85% | 22.90% | 22.77% | 23.51% | |||||
| F Statistics | 34.25 *** | 34.47 *** | 34.55 *** | 34.31 *** | 35.73 *** | |||||
| Sample Size | 3390 | 3390 | 3390 | 3390 | 3390 | |||||
ES is the sum of the E score (environmental responsibility score) and S score (social responsibility score), provided by the KCGS, standardized by total assets. Detailed definitions of variables are presented in the note of Table 2; T-values are based on heteroscedasticity consistent standard errors using White [68] procedure; *, **, and *** denote significance at the 10%, 5%, and 1% levels, respectively.
Table 8.
Additional Analysis 3: Social Ties between Outside Directors and the CEO.
| Variables | (1) Y = Q | (2) Y = Q | (3) Y = Q | (4) Y = Q | (5) Y = Q | |||||
|---|---|---|---|---|---|---|---|---|---|---|
| Coef. | p-Value | Coef. | p-Value | Coef. | p-Value | Coef. | p-Value | Coef. | p-Value | |
| Intercept | 1.5135 | (4.92) *** | 1.5116 | (5) *** | 1.4398 | (4.75) *** | 1.4955 | (4.78) *** | 1.4940 | (4.98) *** |
| ESG | 0.0835 | (4.33) *** | 0.0852 | (4.43) *** | 0.0834 | (4.37) *** | 0.0821 | (4.32) *** | 0.0809 | (4.26) *** |
| ESG×CEOTIETOTAL | −0.0358 | (−0.42) | ||||||||
| ESG×CEOTIEHOME | −0.3080 | (−3.21) *** | ||||||||
| ESG×CEOTIEHIGH | −0.4119 | (−2.51) ** | ||||||||
| ESG×CEOTIEUNIV | 0.0377 | (0.22) | ||||||||
| ESG×CEOTIEGRAD | −0.6798 | (−1.13) | ||||||||
| CEOTIETOTAL | 0.0746 | (0.86) | ||||||||
| CEOTIEHOME | −0.0376 | (−0.25) | ||||||||
| CEOTIEHIGH | −0.4664 | (−2.08) ** | ||||||||
| CEOTIEUNIV | 0.1266 | (0.89) | ||||||||
| CEOTIEGRAD | 1.8472 | (2.84) *** | ||||||||
| SIZE | −0.0182 | (−1.26) | −0.0173 | (−1.24) | −0.0134 | (−0.96) | −0.0176 | (−1.19) | −0.0191 | (−1.37) |
| LEV | 0.0374 | (0.48) | 0.0385 | (0.5) | 0.0182 | (0.23) | 0.0372 | (0.48) | 0.0417 | (0.54) |
| ROA | 1.0440 | (4.01) *** | 1.0795 | (4.12) *** | 1.0622 | (4.07) *** | 1.0387 | (3.96) *** | 1.0247 | (3.94) *** |
| GROWTH | 0.2063 | (2.89) *** | 0.2045 | (2.87) *** | 0.1992 | (2.8) *** | 0.2058 | (2.88) *** | 0.1994 | (2.82) *** |
| VOL | 1.3624 | (12.51) *** | 1.3556 | (12.47) *** | 1.3659 | (12.55) *** | 1.3645 | (12.51) *** | 1.3524 | (12.71) *** |
| RD | 2.3811 | (4.52) *** | 2.3243 | (4.4) *** | 2.3669 | (4.51) *** | 2.3928 | (4.53) *** | 2.4303 | (4.61) *** |
| AGE | −0.1451 | (−5.41) *** | −0.1454 | (−5.4) *** | −0.1447 | (−5.42) *** | −0.1444 | (−5.36) *** | −0.1427 | (−5.3) *** |
| BOD | 0.0225 | (2.17) ** | 0.0213 | (2.08) ** | 0.0225 | (2.19) ** | 0.0227 | (2.19) ** | 0.0245 | (2.38) ** |
| OWN | −0.1776 | (−2.02) ** | −0.1803 | (−2.06) ** | −0.1805 | (−2.06) ** | −0.1774 | (−2.02) ** | −0.1440 | (−1.65) * |
| FOR | 1.5461 | (8.71) *** | 1.5339 | (8.67) *** | 1.5087 | (8.56) *** | 1.5500 | (8.73) *** | 1.5428 | (8.77) *** |
| ΣIND, ΣYR | Included | Included | Included | Included | Included | |||||
| Adjusted R2 | 22.17% | 22.35% | 22.42% | 22.19% | 22.93% | |||||
| F Statistics | 33.17 *** | 33.52 *** | 33.65 *** | 33.22 *** | 34.60 *** | |||||
| Sample Size | 3390 | 3390 | 3390 | 3390 | 3390 | |||||
CEOTIE is a variable representing tie indexes between outside directors and the CEO. Detailed definitions of variables are presented in the note of Table 2; T-values are based on heteroscedasticity consistent standard errors using White [68] procedure; *, **, and *** denote significance at the 10%, 5%, and 1% levels, respectively.
Table 9.
Additional Analysis 4: Instrumental Variables.
| Variables | (1) Y = Q | (2) Y = Q | (3) Y = Q | (4) Y = Q | (5) Y = Q | |||||
|---|---|---|---|---|---|---|---|---|---|---|
| Coef. | p-Value | Coef. | p-Value | Coef. | p-Value | Coef. | p-Value | Coef. | p-Value | |
| Intercept | 1.5585 | (5.1) *** | 1.5381 | (5.06) *** | 1.4895 | (4.9) *** | 1.6352 | (5.35) *** | 1.4297 | (4.7) *** |
| ESG | 0.0984 | (4.71) *** | 0.0842 | (4.23) *** | 0.0821 | (4.17) *** | 0.0912 | (4.53) *** | 0.0821 | (4.02) *** |
| ESG×BODTIETOTAL | −0.1435 | (−2.92) *** | ||||||||
| ESG×BODTIEHOME | −0.1981 | (−3.75) *** | ||||||||
| ESG×BODTIEHIGH | −0.2892 | (−2.24) ** | ||||||||
| ESG×BODTIEUNIV | −0.2570 | (−3.23) *** | ||||||||
| ESG×BODTIEGRAD | −0.1285 | (−0.76) | ||||||||
| BODTIETOTAL | 0.1544 | (1.59) | ||||||||
| BODTIEHOME | −0.1022 | (−1.14) | ||||||||
| BODTIEHIGH | −0.4773 | (−2.88) *** | ||||||||
| BODTIEUNIV | 0.4099 | (3.56) *** | ||||||||
| BODTIEGRAD | 1.3107 | (4.2) *** | ||||||||
| SIZE | −0.0224 | (−1.58) | −0.0195 | (−1.4) | −0.0163 | (−1.17) | −0.0272 | (−1.91) * | -0.0171 | (−1.22) |
| LEV | 0.0443 | (0.57) | 0.0462 | (0.59) | 0.0251 | (0.32) | 0.0395 | (0.5) | 0.0329 | (0.42) |
| ROA | 1.0949 | (4.15) *** | 1.1356 | (4.24) *** | 1.1024 | (4.14) *** | 1.0716 | (4.04) *** | 1.0207 | (3.88) *** |
| GROWTH | 0.2001 | (2.78) *** | 0.1951 | (2.7) *** | 0.1934 | (2.68) *** | 0.2056 | (2.84) *** | 0.1982 | (2.76) *** |
| VOL | 1.3666 | (12.38) *** | 1.3660 | (12.38) *** | 1.3627 | (12.33) *** | 1.3660 | (12.37) *** | 1.3564 | (12.53) *** |
| RD | 2.4412 | (4.58) *** | 2.3599 | (4.39) *** | 2.4617 | (4.62) *** | 2.4672 | (4.61) *** | 2.3883 | (4.44) *** |
| AGE | −0.1407 | (−5.2) *** | −0.1406 | (−5.19) *** | −0.1392 | (−5.15) *** | −0.1392 | (−5.14) *** | −0.1373 | (−5.06) *** |
| BOD | 0.0225 | (2.16) ** | 0.0214 | (2.05) ** | 0.0222 | (2.13) ** | 0.0234 | (2.23) ** | 0.0224 | (2.15) ** |
| OWN | −0.1796 | (−2.04) ** | −0.1887 | (−2.13) ** | −0.1991 | (−2.25) ** | −0.1738 | (−1.97) ** | −0.1504 | (−1.72) * |
| FOR | 1.5374 | (8.73) *** | 1.5318 | (8.68) *** | 1.5080 | (8.59) *** | 1.5503 | (8.8) *** | 1.5271 | (8.72) *** |
| ΣIND, ΣYR | Included | Included | Included | Included | Included | |||||
| Adjusted R2 | 22.43% | 22.58% | 22.60% | 22.52% | 23.15% | |||||
| F Statistics | 33.09 *** | 33.37 *** | 33.41 *** | 33.27 *** | 34.43 *** | |||||
| Sample Size | 3331 | 3331 | 3331 | 3331 | 3331 | |||||
Detailed definitions of variables are presented in the note of Table 2; T-values are based on heteroscedasticity consistent standard errors using White [68] procedure; *, **, and *** denote significance at the 10%, 5%, and 1% levels, respectively; First-stage model using the lag of BODTIE as an instrumental variable: .
© 2018 by the authors. Licensee MDPI, Basel, Switzerland. This article is an open access article distributed under the terms and conditions of the Creative Commons Attribution (CC BY) license (http://creativecommons.org/licenses/by/4.0/).
Share and Cite
MDPI and ACS Style
Park, J.H.; Park, H.-Y.; Lee, H.-Y. The Effect of Social Ties between Outside and Inside Directors on the Association between Corporate Social Responsibility and Firm Value. Sustainability 2018, 10, 3840. https://doi.org/10.3390/su10113840
AMA Style
Park JH, Park H-Y, Lee H-Y. The Effect of Social Ties between Outside and Inside Directors on the Association between Corporate Social Responsibility and Firm Value. Sustainability. 2018; 10(11):3840. https://doi.org/10.3390/su10113840
Chicago/Turabian StylePark, Ju Hyoung, Hyun-Young Park, and Ho-Young Lee. 2018. "The Effect of Social Ties between Outside and Inside Directors on the Association between Corporate Social Responsibility and Firm Value" Sustainability 10, no. 11: 3840. https://doi.org/10.3390/su10113840
Note that from the first issue of 2016, this journal uses article numbers instead of page numbers. See further details here.