Travel Choice Analysis under Metro Emergency Context: Utility? Regret? Or Both?

1
School of Traffic and Transportation, Beijing Jiaotong University, Beijing 100044, China
2
MOE Key Laboratory for Urban Transportation Complex Systems Theory and Technology, Beijing Jiaotong University, Beijing 100044, China
*
Author to whom correspondence should be addressed.
Sustainability 2018, 10(11), 3852; https://doi.org/10.3390/su10113852
Submission received: 27 September 2018
/
Revised: 13 October 2018
/
Accepted: 21 October 2018
/
Published: 24 October 2018
(This article belongs to the Section Sustainable Transportation)
Abstract
:With the continuous expansion of the network scale and increasing of passengers, metro emergencies such as operational equipment failure are happening more frequently. Due to the narrow space and crowds of people, metro emergencies always have more of an impact than road traffic emergencies. In order to adopt appropriate measures to ensure passenger safety and avoid risks, we need to get a better understanding of passengers’ travel choice behaviors under emergencies. Most of the existing research studies related to travel choice behaviors took the random utility maximization (RUM) principle for granted, but failed to realize the potential of different decision-making processes and changes to the decision-making environment. In this research, we aim to analyze metro passengers’ travel choice behaviors under metro network emergency contexts. Based on the data collected from a survey about travel choices under metro emergencies in the Guangzhou Metro, we compared the performances of models that follow the RUM and random regret minimization (RRM) principles, and established a hybrid RUM-RRM model as well as a nested logit model following RRM (NL-RRM) to estimate the effects of various factors on passengers’ travel choice behaviors. Comparisons illustrate that the hybrid model and NL-RRM model can improve model fit, and the combination of RUM and RRM outperforms either of them respectively.
1. Introduction
With the rapid development of the metro system, emergencies in the metro network are happening much more frequently than before. Train delay, line disruption, or even network failure caused by emergencies could enormously reduce the reliability of the metro system, and passengers’ safety and security are too important to be neglected for metro operators. Moreover, unlike road traffic modes, metro systems are suffering from a much more crowded space, which is significantly incommensurate to its massive and still-increasing number of passengers. Emergencies such as network failures, outbursts of passenger flows, natural disasters, and terrorist activities in the metro network could lead to much tougher problems, as there are very limited choices for passengers [1].
It is, of course, difficult to predict when and where will emergencies will occur; thus, once it happens, it always brings uncertainty to both passengers and metro operators. Under this kind of disordered context, passengers can hardly remain rational and consider the total utilities of each choice. The unexpected interruptions of their trips are bound to alter their travel choices, especially when the emergencies happen at peak hours and emotions such as anxieties and panic start to spread through the crowded passengers.
The conventional discrete choice models, such as the random utility maximization (RUM) model, take all of the possible attributes into the alternative’s utility; meanwhile, all of the alternatives are independent of each other. However, it seems reasonable under normal conditions that when there are emergencies in the metro network and passengers may have bounded rationality, they may choose to think differently and adopt a new decision-making principle under emergency contexts.
In order to ensure the reliability of the metro system and the sustainable development of urban public transportation, we focused our attention on the delays caused by metro emergencies and the delay-derived travel choice behaviors among multiple traffic modes, such as metro, bus, and taxi. We analyzed metro passengers’ travel choice behaviors using a hybrid model and nested logit model with the random regret minimization (RRM) principle. Section 2 shows the recent research about metro network topology characteristics and passengers’ travel choice behaviors, especially regarding the usage of the RRM model. Section 3 describes the data that we used in our research and the particular variables that we considered in the travel choice models under metro emergencies. Section 4 illustrates the specification of the RRM model, and proposes the hybrid RUM-RRM model and the nested logit model following the RRM principle (NL-RRM). Section 5 is a case study of Guangzhou Metro, China, with parameter estimations of passengers’ travel choice and discussion. Section 6 presents the conclusions.
2. Literature Review
In recent years, with the expansion of metro networks, the networking characteristics of metro systems are becoming more and more obvious. In order to identify bottlenecks and improve the efficiencies of the metro networks, graph theory and complex network theory have been introduced to analyze metro network topology characteristics. Daniel Sun et al. [2] evaluated the vulnerability of the Shanghai Metro with full-scale network and real world traffic data, and found that a large node degree for metro stations is important for maintaining network size, while the network efficiency and origin-destination connectivity are closely related to node betweenness. Sun Huijun et al. [3] used the traffic flow propagation method to analyze the traffic congestion and bottlenecks in a small-world network and regular network, and the result indicated that a random network is the optimal network structure and the regular network is much easier to be congested. With complex network theory and measurements considering the numbers of effective paths to evaluate a network’s connectivity, Dai Hongna et al. [4] revealed that we should focus more on nodes with high structure betweenness for improving network reliability. It is worth mentioning that the metro network structure does not only influence network characteristics, it also influences the travel choice behaviors when passengers are traveling in the metro network. Containing concepts such as the directness of the chosen route and the user knowledge of the network [5], the neglected topological variables always play an important role in passengers’ travel choices.
For quite a long time, the conventional models for discrete choice were based on the RUM theory, which was derived in the 1970s [6,7], and assumes that decision-makers always choose the alternative with maximum utility in the choice set. The succinct and easily understood concept of RUM leads to its dominated position in behavior research, and it has been adopted to solve problems in many other fields besides travel behavior analysis. The most used RUM model is the multinomial logit (MNL) model, which takes passengers’ socio-economical characteristics and attributes of routes or traffic modes into consideration to describe passengers’ preferences in travel behaviors. Both the advantages and disadvantages of the MNL model are derived from its utility function; the linear-additive formulation simplifies the model structure and accelerates the calculation speed. However, this straightforward form has leaded to another tough question—the property of independence of irrelevant alternatives (IIA), when the error term of the utility function follows identical and independent distribution (IID, extreme value type I-distribution). The IIA property reflects a phenomenon of the MNL model in which the alternatives in the choice set are independent from each other, and the probability ratio between two alternatives is indifferent to the changes to other alternatives or the increase (or decrease) in the quantity of alternatives in the choice set. To offset this disadvantage, researchers have made several efforts; Cascetta [8] modified the MNL model and created the conditional logit (CL) model to improve the performances of the MNL model in truck drivers’ route choice behavior. Besides that, the nested logit (NL) model has been put forward mainly to overcome the unreasonable assumption of the independence of error terms that led to the IIA property; the research of the NL model is still improving in behavior analysis. Heiss [9] found that the RUM nested logit model was preferable to the non-normalized nested logit model in most situations, and numerous examples were found to support their ideas. Han Y et al. [10] established an integrated model of structure equation model and an NL model to estimate the travel mode choice of passengers waiting for buses. Newman et al. [11] presented new computational methods for MNL, NL, and cross-nested logit (CNL) models for semi-aggregated data. Further models such as the mixed logit model and latent class model have both been put forward to settle more complicated problems and acquire much more specific results of choice behaviors.
Similar to utility theory, regret theory has been presented for more than two decades [12]; it was originally designed for modeling choice behaviors under uncertainty conditions. Regret is a negative, cognitively-based emotion that people experience when realizing or imagining that their present situation would have been better if they had made different decisions. Generally, regret is generated when people know that they can get a better result by making a different choice. Thus, some researchers [13] argued that we sometimes base our decisions on the “regret minimum principle”, which means that when choosing from more than one alternative, decision-makers anticipate and aim to minimize regret rather than maximize utility. Regret arises when one or more non-chosen alternatives perform better than the chosen one in terms of one or more attributes, and the regret will not rise (or even decrease) when the chosen alternative performs better than the unchosen ones. Regret theory reflects the common attitude of the detestation of losses (in terms of money or time), and this change in attitude would bring impact to decision-makers when making choices.
Nevertheless, regret theory and the RRM model are different, as the former one considers regret as a function of relative utility between alternatives, while the latter one takes regret as the function of the relative value of attributes in the alternatives from the choice set. Regret theory provides the behavioral roots for the RRM model, and it has been adapted to accommodate for traveler decision-making among multi-attribute alternatives [14]. The RRM model was first designed as a form of extreme value function [13], which makes the model specification likelihood function non-smooth, and creates difficulties during calculations. To solve this problem, Chorus [15] presented a new model for the RRM approach with a smooth likelihood function that could be estimated by common software packages such as Nlogit, Biogeme [16], etc. Also, the generalized RRM (GRRM) model [17] was presented to be more flexible in estimating travelers’ route choice behaviors and marginal effects or elastics.
The continued study has tremendously expanded the research field of the RRM model, and models have been applied to a range of choice problems, including travel choice [18], leisure-related decision-making [19], driver crash avoidance maneuvers [20], automobile fuel choice [21], and shopping choice behaviors [22,23]. Comparisons between the RUM model and RRM model have been performed many times. According to the literature statistics [24,25,26], research studies on the RRM model increased rapidly from 2010, most of which used stated preference (SP) data to estimate the parameters, and compared these with the MNL model under various choice contexts. Empirical evidence showed that although differences in model fit and predictive performance between the RUM and RRM models may not be significantly distinguished, the policy implications may vary a lot between these two models.
We can draw a preliminary conclusion through the existing research studies listed above, that the RRM model is getting increasing attention in choice behavior analysis, and show considerable potential compared to the conventional method of the RUM models. While the disadvantage lies in the metro passengers’ travel choice behaviors under metro emergency contexts seemingly being neglected in many cases, and the RUM model and the RRM model often being investigated separately. To get a better travel choice model under metro extreme scenarios, this paper proposed a hybrid model of RUM-RRM (HUR) and nested logit model following RRM (NL-RRM) approaches to combine the merits of both models.
3. Data and Variables
3.1. Data
In this study, we take the Guangzhou Metro as an example to examine the performances of our models. The Guangzhou Metro is an important part of the urban public transportation system in the city of Guangzhou, China. Having been under construction for over 20 years, the Guangzhou Metro now has 13 lines, 206 stations in operation, and the total distance of the Guangzhou Metro system is more than 390 km, with a daily average ridership of over 8.2 million people. Figure 1 shows the network of the Guangzhou Metro in 2018.
As the emergencies in the metro system are unexpected and unpredictable, it is difficult to identify passengers that have been directly impacted by the emergencies. Therefore, we built our models on the stated preference (SP) data from the survey of Guangzhou Metro passengers’ travel characteristics. The survey was designed to reflect passengers’ travel behavior changes under emergency contexts, including the reset of origins and destinations, as well as changes of routes and traffic modes. There are six kinds of routes presented as alternatives for metro passengers to choose from. Only route 1 contains the delayed time caused by the emergencies, route 2 is the alternative route between origin and destination, route 3 and route 4 are combined metro with road traffic modes such as bus or taxi, respectively. Route 5 and route 6 abandon the metro because of the emergencies. Figure 2 presents the routes’ details in one scenario from the investigation. The sections between station S1 and station S2 are interrupted areas, and only route 1 goes through this area. The specific characteristics of these routes are presented in Table 1.
This survey was made using the random sampling method during April and May in 2016 in the stations of the Guangzhou Metro system. Each respondent was asked to make travel choices in two or four scenarios; there were six scenarios in the investigation, and each of them had different origins and destinations as well as different route attributes. Finally, 5553 questionnaires were collected, among which 5520 were valid for analysis. Based on the results of the survey, there are a total of 10,128 valid choice samples.
Among all the respondents, 37.5% were female and 62.5% were male. About 70% of them were between 23–45 years old, 25% were younger than 22, less than 5% were between 46–60 years old, less than 1% were older than 60. People with a monthly income under 5000 yuan accounted for more than 50% of survey respondents, which means that metro passengers mainly consist of low-income and middle-income people. About 66.34% respondents choose the metro as their way to work or school, and more than half of the respondents take the metro during peak hours. Figure 3 shows the detailed proportion of travel times, longest waiting time, and transfer times of the respondents.
3.2. Variables
Generally, the metro network can be described as an undirected graph G = {V, L}, where V = {vi|i = 1, 2, …, n} denotes the node set of the network, and L = {lij|link between vi and vj, vi, vj ∈ V} denotes direct connections between node vi and vj. In complex network theory and graph theory, the node degree is the basic concept, which is used to describe the relation between nodes. Node degree ki is the number of links connected to the node vi. If a metro network contains no multiple links or self-loops, the node degree equals the number of the nodes connected to node vi.
Betweenness centrality (BC) is a very different concept than node degree. It measures the extent to which a node lies on paths between other nodes. As an indicator that is used to describe a node’s importance in the entire network, nodes with higher BC may have a considerable influence within a network by virtue of their control over the paths passing between other nodes. The existing research studies [2,27] have shown that the nodes with the largest BC are the ones whose removal from the network will most disrupt connections between other nodes, for they lie on the largest number of paths. Instead of being principally a measure of how well-connected a node is, BC differs from the other measures of the complex network theory in it measures how much a node falls “between” other nodes. Indeed, a node can have quite a low degree or other unsatisfying characteristics, but still a have high BC [27]. The BC of node vi is the ratio between the number of shortest paths that pass through node vi, and the number of all of the shortest paths in the entire network. Summing all of the bc values of the nodes in route lp, we can get the BC of the route. It can be calculated using Equation (1):
where Njl(i) is the number of the shortest path between node vj and vl, which go through node vi at the same time, Njl is the total number of all of the shortest paths between node vj and vl, and p is the number of nodes in route lp.
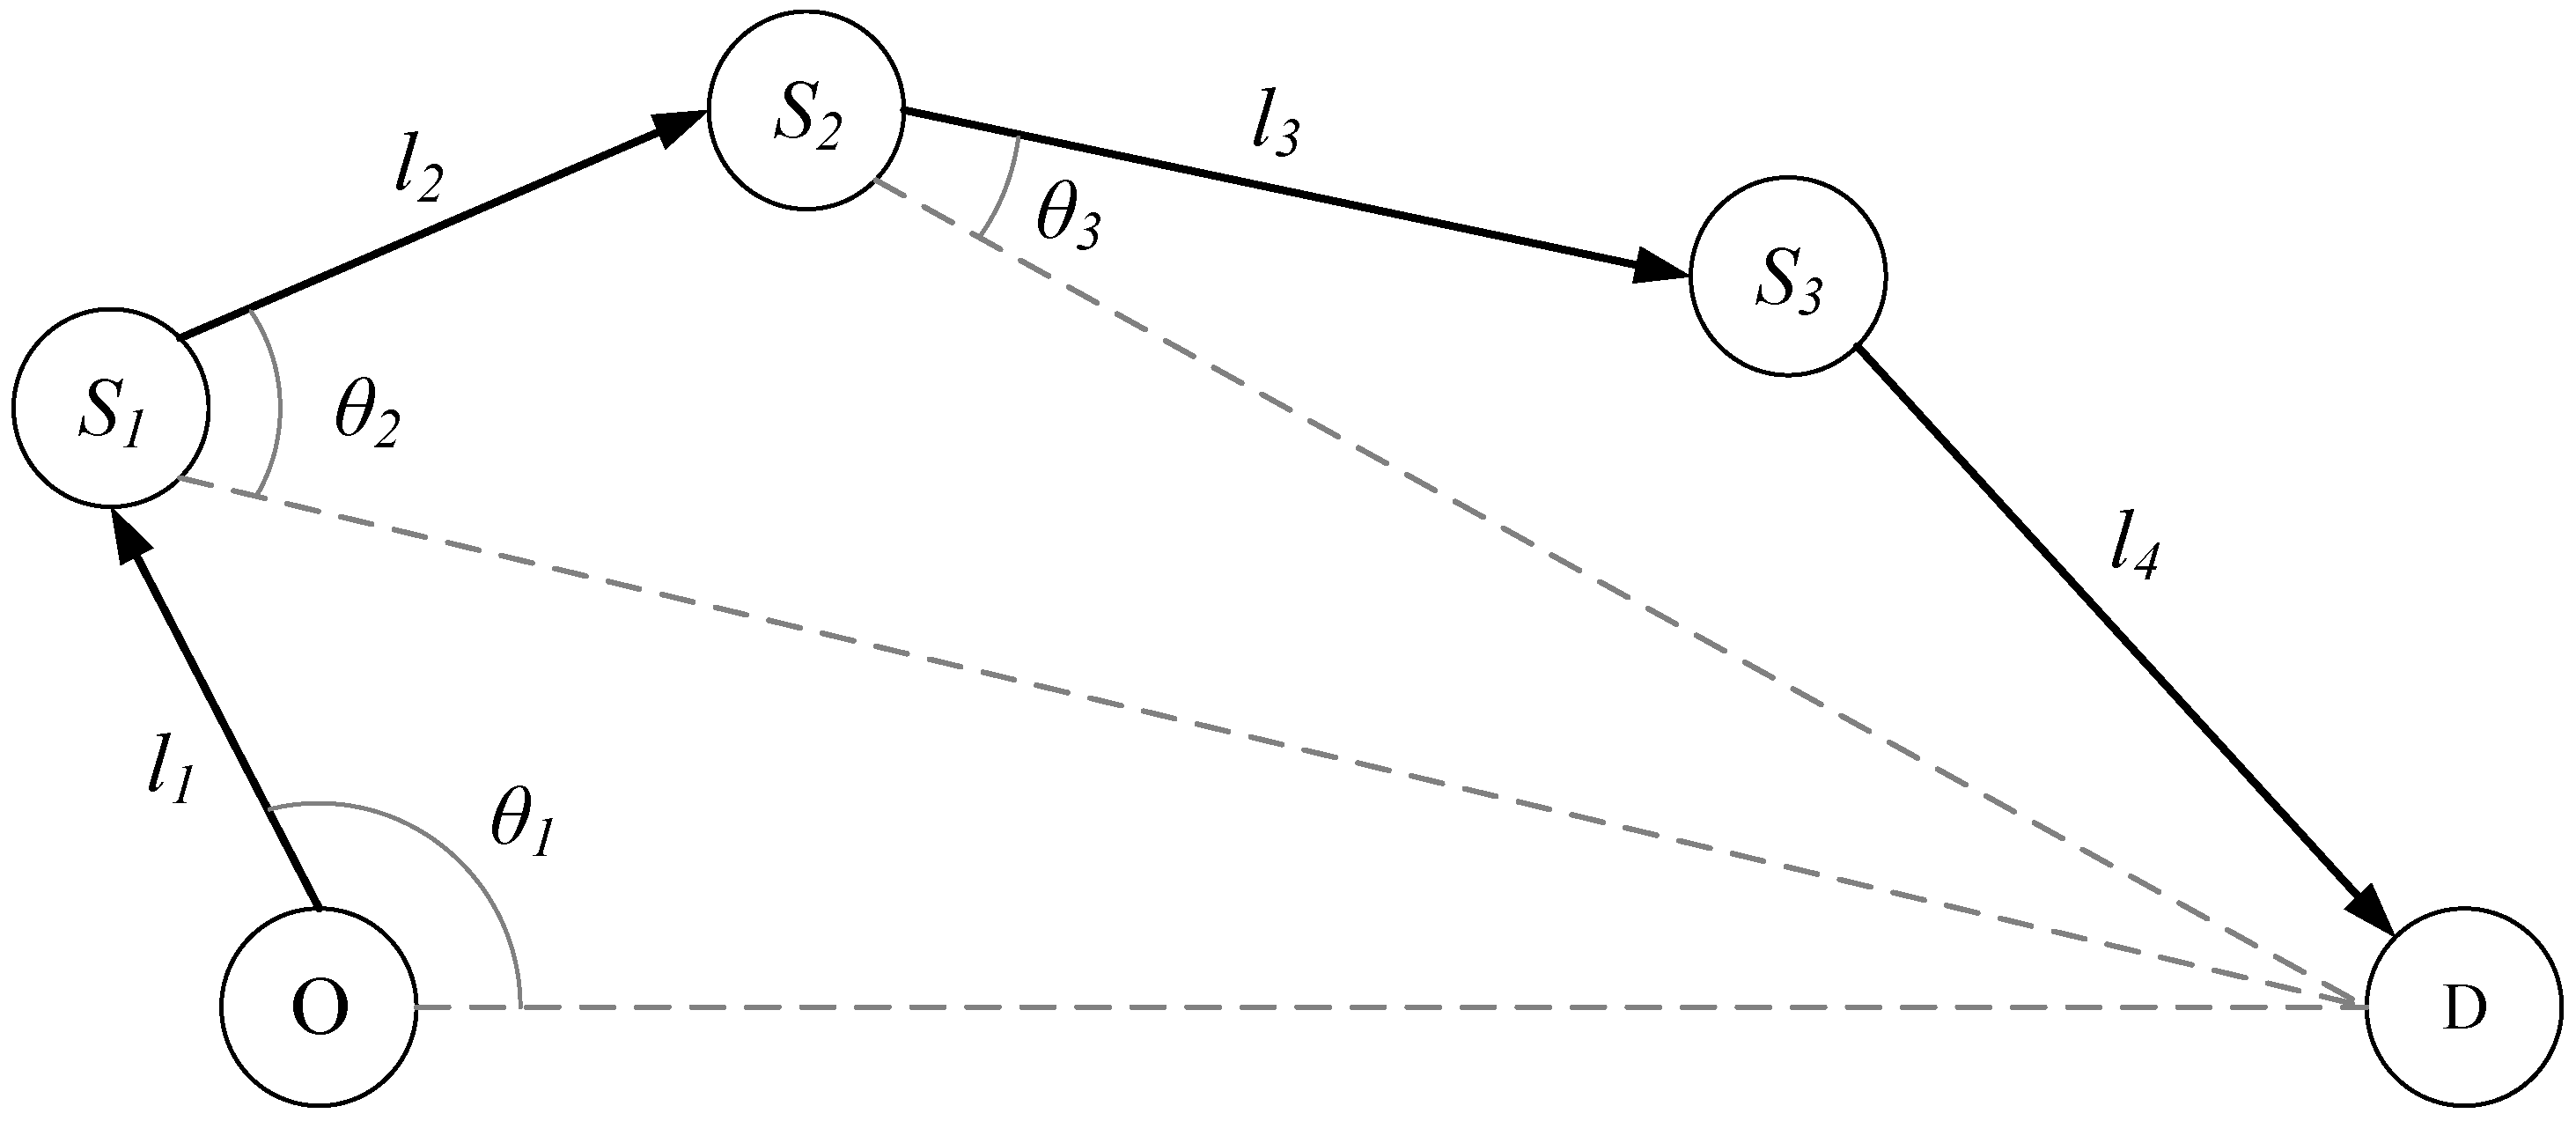
Besides the concepts deriving from the complex network theory, the influence of network topology characteristics can be reflected in a more intuitionistic method. Angular cost (AC) was proposed by Raveau and Muñoz [5] to depict the route’s deviation between origin and destination. It is reasonable to assume that passengers prefer the most direct route from their origin to their destination. As shown in Figure 4, the angular cost is defined as a plenty indictor that at its minimum value when route segments head directly to the destination, and at its maximum value when the route segments head opposite to the passenger’s destination. However, the sinusoidal function of the original AC only has litter changes when the extent of the route angular deviation increases, while it should reflect the actual situation that the angular cost changes a lot when the deviation increases. Therefore, Zhang Yongsheng et al. [28] adapted the original angular cost function into a tangent function to compensate for the shortcoming of the indictor. His research showed that the adapted function satisfies the increasing trend with the increase of route angular deviation, and it is derivable and also a monotone increasing function that is bigger than 0.
The adapted angular cost can be calculated by Equation (2):
where is the route k’s angular cost from origin o to destination d, Ll is the length of link l of route k, θl is the angular deviation between link l and the route from origin o to destination d, , and Ns is the number of links in the route.
4. Methodology
4.1. Random Regret Minimization
The utility function and the regret function are formed differently. In the linear-additive RUM model, the utility of an alternative is the summation of its own parameters βm and attribute values xim. The utility function can be calculated by the maximum likelihood method, which means that in an iterative optimization process, parameters are found that maximize the likelihood of the data, given the choice model and parameter estimates. This likelihood of the data as a function of a set of parameters inserted into a choice model can be put as follows:
where δin equals 1 when the decision-maker n chooses alternative i, otherwise δin equals 0; and N is the number of decision-makers.
The RRM model is built on the following postulates: (a) when a considered alternative outperforms another alternative in terms of a particular attribute, the comparison of the considered alternative with the other alternatives on that attribute does not generate anticipated regret; (b) when a considered alternative is outperformed by another alternative in terms of a particular attribute, the comparison generates anticipated regret; (c) anticipated regret increases when the factors of the considered alternative such as the importance of the attribute, the magnitude of the extent, or when the number of attributes is outperformed by another alternative in the choice set; (d) anticipated regret increases with the number of alternatives that outperformed a considered alternative on a particular attribute. With the limitation of observation, some of the anticipated regret is “observable” and some of it is “unobservable”.
Based on the basic postulates above, the RRM model could be specified by Equation (4):
where RRi is the random regret that is associated with a considered alternative i for choice set J, Ri is the fixed term in the regret function, which represents the “observed” regret associated with alternative i, εi is the random term (or error term), which represents the “unobserved” regret associated with alternative i, βm denotes the estimated parameter associated with attribute xm, xim and xjm denote the values attribute xm for the considered alternative i and another alternative j, respectively, and M is the number of attributes in an alternative.
The core of this equation is, and in this part, the comparison between the considered alternative i and alternative j in terms of attribute xm is established to quantify the amount of regret. This attribute-level regret is computed for each of the bilateral comparisons with other alternatives, and for all of the available attributes; the summation of these attribute-level regret terms forms the observed regret that is associated with the considered alternative. In the regret function of βm and (xjm − xim), when βm∙(xjm − xim) are positive (i.e., the considered alternative is outperformed by the other alternatives), regret increases rapidly; however, when βM·(xjm − xim), which is a negative (i.e., the considered alternative outperforms the other alternatives), regret approaches zero.
Similar to its counterpart in the RUM model, the RRM model can be estimated in the form of MNL by adding a negative sign to the regret function and turning the minimization of regret into maximization negative regret. The probability of alternative i can estimated by Equation (5):
4.2. Generalized and Hybrid RRM Model
A GRRM model has been put forward as a more flexible solution of estimation by Chorus in 2014 [17]. GRRM model replaces 1 in the regret function with the so-called regret-weight γ that varies from 0 to 1, which makes the core equation of the GRRM. The regret-weight can be altered with each attribute similar to γm or be constant with all of the attributes. When the regret-weight equals 0 for a particular attribute, the regret function turns out to be a linear-additive form that is similar to the RUM model. When the regret-weight equals 1, a conventional RRM model will be obtained. While the regret-weight is between 0 and 1, the regret curve is less non-linear (i.e., it implies a lesser degree of reference dependent asymmetry) than the conventional RRM model.
Considering the similarities of utility maximization theory and regret minimization theory, Chorus and Rose [29] presented a hybrid model that allows for some of the attributes to be processed using regret-minimization-based rules, while others are being processed using conventional linear-additive utility maximization-based rules. Anowar and Eluru [30] estimated a hybrid utility-regret-based model system to analyze the impact of automated vehicles in freight transportation, and their research found that not all of the attributes impacting freight mode choice are evaluated following a homogenous decision rule, and the introduction of automation in the freight industry would be more beneficial for the long-haul hire truck mode than the short-haul private truck mode. The existing research studies have verified the validity of the hybrid utility and regret (HUR) model, and the function of the hybrid model is proposed in Equation (6):
where attribute 1 to attribute k are processed in utility maximization rules, while the remaining k + 1 to M attributes are processed in regret minimization rules. The error term εi follows extreme value type-I distribution.
4.3. Nested Logit Model Following RRM Principle
As an important tool for the empirical analysis of discrete outcomes, the nested logit model becomes attractive, since it relaxes the strong assumptions of the IIA property in the MNL model and it has a straightforward, quick calculation process. The nested multinomial logit (NMNL, NL for short) allows groups of alternatives to be similar to each other in an observed or unobserved way, and a structure is specified so that the alternatives could be partitioned into several nests. Alternatives in the nests should follow the following properties. (1) For any two alternatives that are in the same nest, the ratio of probabilities is independent of the attributes or the existence of all other alternatives, i.e., IIA property still exists inside the nest. (2) For any two alternatives in different nests, the ratio of probabilities can depend on the attributes of other alternatives in the two nests. IIA does not hold in general for alternatives in different nests [31]. (3) Each alternative belongs to one and only one nest.
Assuming that the alternatives in the choice set J are partitioned into K nests 1, 2, …, k, …, K, the probability of decision-maker n choosing alternative i in the NL model equals the joint effects of the probability of choosing nest k from K nests and the probability of choosing alternative i from alternatives in nest k, as is shown in Equation (7):
Within each nest, the probability of choosing a specific alternative can be estimated by the MNL model, and the NL model can be regarded as the composition of several MNL models. As mentioned above, the similarities between the NL model and the MNL model lead to the suffering of the IIA property inside each nest in the traditional NL model. Based on this situation, we modified the traditional NL model with the lower level changed into the RRM forms, and the probability can be estimated by combining Equation (5) with Equation (7):
where Rikn is the random regret value when decision-maker n chooses alternative i from nest k and Vkn is the utility of nest r. The utility Vkn that the decision-maker receives from nest k determines the probability of choosing this nest, and it includes the utility when the decision-maker choosing between the nests, plus the total regret of the lower level that influences the utility of choosing the nest, Vkn, can be calculated by Equation (9):
Due to the modification in the lower level, the function of the NL model has been modified as well. In Equation (9), Vk is the utility of choosing between nests, Ri|kn is the total regret of the lower level, Jk is the number of alternatives in nest k, Mk is the number of attributes in the upper level, and βk and θk are parameters to be estimated.
5. Result and Discussion
Initially, we selected route attribute (total travel time, travel cost, and number of transfers) and emergency attribute (delay time) as factors influencing passengers’ travel choice behavior under an emergency context; Table 2 shows the estimated results of the parameters. As can be seen, all of the parameter estimations are statistically significant at the 95% level, as the t-test values are all bigger than 1.96 (or smaller than −1.96). Attributes such as delay time, travel time, and travel cost are all negative in these three models, while the number of transfers is positive, which is against common knowledge, since passengers are reluctant to take more transfers when they are traveling by metro. In the RRM model and GRRM model, the estimation values of travel time and travel cost are pretty close. The regret-weight in the GRRM model equals 0.284, which means that when emergencies occurs in the metro system, each of the passengers is assumed to behave according to the regret function with a degree of non-linearity, which makes the RRM model a little bit linear-additive similar to the RUM-MNL model, instead of fully accordant with either the RRM model or the RUM model. The model fit (rho-square and adjusted rho-square) has an increasing trend from the MNL model to the GRRM model, and that means compared with the MNL model, the RRM model and the GRRM model are more flexible regarding estimating data under an emergency context.
Regret-weight in the GRRM model shows the non-fully accordant property with either the RUM model or the RRM model, which makes us speculate that in an emergency context, metro passengers may accommodate their choice behaviors by combining RUM with RRM principles instead of just adopting one of them. Under this assumption, we built the hybrid utility-regret (HUR) model to test our idea. Furthermore, passengers’ socio-economical characteristics (such as income, sex, travel aim, etc.) may influence their judgments under uncertainties, and this kind of influence is embedded into passengers’ daily lives, which makes the choice behaviors a reflection of passengers’ personal characteristics. Still, there may be factors hidden from our observation that influence passengers’ travel choices; alternative specific constants (ASCs) could help us get a clear sight when the travel choices are made. We added four ASCs into four metro-related routes (route 1 to route 4) to observe whether passengers insist on adopting the metro or just change to another traffic mode.
Additionally, as analyzed in Section 2 and Section 3, the network topology characteristics of the metro system may also be a factor influencing passengers’ travel choices; therefore, we added BC and AC into the travel choice model. As the metro network and the road network are separate from each other, and the network scales are tremendously different, these two factors of road network are neglected. The NL-RRM model was established because of the differences between these alternatives. In the nested model, we divided the alternatives into two nests: (a) metro-related traffic modes, and (b) road traffic modes. Nest (a) contains route 1 to route 4, and nest (b) contains route 5 to route 6, and the routes are specified in Section 3.1. The structure of the nested model can be seen in Figure 5.
Passengers’ characteristics in the HUR and NL-RRM models are defined as follows: if the passenger is male, sex equals 0 and female equals 1; income is defined as 0 if passengers’ monthly income is less than 10 thousand yuan (RMB), or it is 1 when the monthly income is bigger than 10 thousand yuan; travel aim equals 0 if passengers are going to work or school, and it equals 1 if passengers have other purposes; longest waiting time equals 1 if it is bigger than 15 min, else it is 0; if the passengers already get in the subway stations before the emergency occurs, then the value of location equals 0, or if passengers haven’t got into the metro stations before emergencies, it equals 1; period equals 1 if passengers are traveling during non-peak hours; and travel times is 1 when passengers take six or more subway trips in one week.
The estimation results are presented in Table 3. From Table 3, we can obtain clear evidence that the HUR model and NL-RRM model do improve the performances of the RRM model and GRRM model, and the NL-RRM model has the best model fit among all of the models presented in this research. Estimations of delay time, travel time, travel cost, and number of transfers are all negative, and all of the estimations of the HUR model and NL-RRM model are statistically significant at the 95% level. The MNL model with passengers’ characteristics and ASCs have two parameter estimations that are not statistically significant: number of transfers and ASC_route1, which implies that these two attributes may not be crucial factors when passengers are making their choices. The logsum value of the NL-RRM model is 0.897, which is between 0 and 1, and means that the substitution in the nests is bigger than the substitution among the nests, and the grouping in the NL-RRM model is valid and reasonable. AC and BC are both positive in the NL-RRM model, but BC is not statistically significant at the 95% value. It implies that metro passengers tend to choose routes with bigger values for these two factors, although the routes may be detours compared with the original routes, and the nodes’ status in the network has limited effects on the metro passengers when the emergency occurs.
With the definition above, we can get clear conclusions about passengers’ personal preferences from Table 3; based on estimations of the HUR model and the NL-RRM model, female passengers are less likely to wait for the trains to resume operation, and they are more easily shifting to alternative routes in the metro system. In contrast, passengers traveling during non-peak hours behave similar to those who can endure a longer waiting time; they tend to be patient enough to stick to their original choices and wait for the delayed trains. On the contrary, if metro passengers have not gotten into the station or they are more familiar with the metro network (take more than six subway trips per week), they tend to abandon the metro as their way to their destination and turn to other public transportation such as buses to continue their trips. Passengers with higher income (more than 10,000 a month) quit the metro more decisively and choose taxis to get to their destinations when they encounter a metro emergency. Throughout these three models in Table 3, the estimated values of the personal characteristics are relatively stable, which illustrates that passengers’ travel choice patterns are fixed with their personalities under emergencies, which we can also call habits, and may come from the accumulation and repetition of daily life experiences.
The ASCs of route 1 to route 3 are positive, indicating that there are unrevealed factors that appeal to passengers who choose the metro or a metro and bus combined traffic mode. A big difference between the HUR model and the NL-RRM model appears in the estimation of ASC_route4. The negative sign of ASC_route4 in the HUR model clearly tells us that metro passengers are not willing to use a metro and taxi combined mode for their trip, which may be because taxis are much more expensive than the bus. It is reasonable that passengers would rather take taxis from the start than take the congested subway to a transfer station and then change to a taxi; after all, this combined mode wouldn’t save much money, but would suffer from plenty of inconvenience. However, in the NL-RRM model, the sign of the ASC_route4 is positive, after considering network topology characteristics. This indicates that when taking the metro network structure into consideration, metro passengers are more willing to improve their current situation with the help of the metro system. A proper explanation lies in that taxis may not be easy to get to near the metro stations that have the emergencies; the well-briefed metro passengers have to choose to continue their trip in the metro and find convenient (less crowded and less influenced by metro emergencies) stations so that they can change to taxis to reach their destinations.
From the analyses above, the combination of the RUM and RRM models has revealed a potential advantage in describing the emergency-caused travel choice behaviors for metro passengers. It may indicate a possible direction for us that the integration of various decision-making principles could be better in dealing with passengers’ travel choice behaviors in a more complicated environment. After all, people’s decision-making processes are rather complicated; when the decision-making environment changes, different decision-making methods will also participate in the process and jointly influence passengers’ choice behaviors. With the help of multiple decision-making principles, we can depict a much clearer picture of the choice behaviors for metro operators. It is the foundation for making detailed management measures to evacuate passengers and restore operation orders under metro emergency contexts.
Admittedly, the limitations for the hybrid models are quite clear. Due to the different complexity in their function equations, a huge variation in the convergence time exists among the MNL model, the RRM model, the HUR model, and the NL-RRM model. Under the same hardware conditions, the models in Table 3 have distinctly different convergence times, MNL2 converged in about one second, while the HUR model took about four and a half minutes (4:34) and, amazingly, it took about 20 min (19:29) for the NL-RRM model to reach convergence. The requirement for better hardware conditions or a longer calculation time may impose restrictions on the application of the HUR model and the NL-RRM model in a much wider range.
6. Conclusions
With the continuous expansion of the metro network scale and passenger flow scale, emergencies in the metro network are occurring more frequently than before. Passengers’ travel choice behaviors in the metro network under emergency contexts are closely related to the development of evacuation plans and operation plans. In this research, in order to avoid further losses caused by the emergencies, we analyzed metro passengers’ travel choices with the RUM method and the RRM method. Based on a survey of the Guangzhou Metro, the MNL model, RRM model, GRRM model, HUR model, and NL-RRM model are established, and influence factors such as network topology attributes, emergency attributes, route attributes, and passengers’ socio-economical attributes are estimated. The result shows that:
- The GRRM model illustrates that metro passengers do not have stronger preferences for either the RUM rule or the RRM rule respectively to help them make travel choice decisions, while the combination of the RUM and RRM model shows more explanatory ability for passengers’ decision basis.
- We have integrated RUM with RRM so that the HUR model and NL-RRM model are established. The estimations indicate that the HUR model and NL-RRM model have better model fits and estimation results, compared with the MNL, RRM, and GRRM models, which just follow one decision principle.
- Although these are not all statistically significant at the 95% level, network topology characteristics such as AC and BC, have shown their influences in passengers’ travel choice behaviors. This result gives us a hint that when making evacuation and operation plans, we should take full advantage of the characteristics of the metro network structure, whereas this part has been neglected in many research studies.
To sum up, the combination of two different decision processes has shown its power in estimating passengers’ travel choice behaviors in an emergency context. Moreover, analyzing passengers’ behaviors is a crucial step to handle emergencies in the metro network, but these analyses are just the beginning for making detailed management measures. It is also the foundation for further research studies such as some regarding passenger flow prediction, passenger flow network propagation analysis, and the development of evacuation strategies. We firmly believe that our research will provide useful information and important suggestions for metro operators and further studies.
Author Contributions
Conceptualization, X.W. and E.Y.; Methodology, X.W. and E.Y.; Software, X.W.; Validation, E.Y.; Formal Analysis, X.W. and E.Y.; Writing—Original Draft Preparation, X.W.; Writing—Review & Editing, X.W., E.Y., S.L.
Funding
This research was funded by Beijing Natural Science Foundation (8171003).
Conflicts of Interest
The authors declare no conflict of interest.
References
- Nguyen, T.P.K.; Beugin, J.; Marais, J. Method for evaluating an extended Fault Tree to analyse the dependability of complex systems: Application to a satellite-based railway system. Reliab. Eng. Syst. Saf. 2015, 133, 300–313. [Google Scholar] [CrossRef]
- Sun, D.; Zhao, Y.; Lu, Q.C. Vulnerability analysis of urban rail transit networks: A case study of Shanghai, China. Sustainability 2015, 7, 6919–6936. [Google Scholar] [CrossRef]
- Sun, H.; Wu, J.; Ma, D.; Long, J. Spatial distribution complexities of traffic congestion and bottlenecks in different network topologies. Appl. Math. Model. 2014, 38, 496–505. [Google Scholar] [CrossRef]
- Dai, H.; Yao, E.; Lu, N.; Bian, K.; Zhang, B. Freeway Network Connective Reliability Analysis Based Complex Network Approach. Procedia Eng. 2016, 137, 372–381. [Google Scholar] [CrossRef]
- Raveau, S.; Muñoz, J.C.; Grange, L.D. A topological route choice model for metro. Transp. Res. Part A Policy Pract. 2011, 45, 138–147. [Google Scholar] [CrossRef]
- Mcfadden, D. The revealed preferences of a government bureaucracy: Theory. Bell J. Econ. 1975, 6, 401–416. [Google Scholar] [CrossRef]
- Daganzo, C.F.; Sheffi, Y. On stochastic models of traffic assignment. Transp. Sci. 1977, 11, 253–274. [Google Scholar] [CrossRef]
- Cascetta, E. A modified logit route choice model overcoming path overlapping problems: Specification and some calibration results for inter-urban networks. In Proceedings of the 13th International Symposium on Transportation and Traffic Theory, Lyon, France, 24–26 July 1996. [Google Scholar]
- Heiss, F. Specification(s) of Nested Logit Models. MEA Discussion Papers 2002. Available online: http://www.mea.mpisoc.mpg.de/uploads/user_mea_discussionpapers/dp16.pdf (accessed on 3 May 2018).
- Han, Y.; Li, W.; Wei, S.; Zhang, T.; Rosen, M.A. Research on passenger’s travel mode choice behavior waiting at bus station based on semi-logit integration model. Sustainability 2018, 10, 1996. [Google Scholar] [CrossRef]
- Newman, J.P.; Lurkin, V.; Garrow, L.A. Computational methods for estimating multinomial, nested, and cross-nested logit models that account for semi-aggregate data. J. Choice Model. 2018, 26, 28–40. [Google Scholar] [CrossRef]
- Loomes, G.; Sugden, R. Regret theory: An alternative theory of rational choice under uncertainty. Econ. J. 1982, 92, 805–824. [Google Scholar] [CrossRef]
- Chorus, C.G.; Arentze, T.A.; Timmermans, H.J.P. A random regret-minimization model of travel choice. Transp. Res. Part B 2008, 42, 1–18. [Google Scholar] [CrossRef]
- Chorus, C.G. Random regret minimization: An overview of model properties and empirical evidence. Transp. Rev. 2012, 32, 75–92. [Google Scholar] [CrossRef]
- Chorus, C.G. A new model of random regret minimization. Eur. J. Transp. Infrastruct. Res. 2010, 10, 181–196. [Google Scholar]
- Bierlaire, M. BIOGEME: A free package for the estimation of discrete choice models. In Proceedings of the 3rd Swiss Transportation Research Conference, Ascona, Switzerland, 19–21 March 2003. [Google Scholar]
- Chorus, C.G. A generalized random regret minimization model. Transp. Res. Part B 2014, 68, 224–238. [Google Scholar] [CrossRef]
- Charoniti, E.; Rasouli, S.; Timmermans, H.J.P. Context-driven regret-based model of travel behavior under uncertainty: A latent class approach. Transp. Res. Procedia 2017, 24, 89–96. [Google Scholar] [CrossRef]
- Thiene, M.; Boeri, M.; Chorus, C.G. Random regret minimization: Exploration of a new choice model for environmental and resource economics. Environ. Resour. Econ. 2012, 51, 413–429. [Google Scholar] [CrossRef] [Green Version]
- Kaplan, S.; Prato, C.G. The application of the random regret minimization model to drivers’ choice of crash avoidance maneuvers. Transp. Res. Part F Psychol. Behav. 2012, 15, 699–709. [Google Scholar] [CrossRef]
- Hensher, D.A.; Greene, W.H.; Chorus, C.G. Random regret minimization or random utility maximization: An exploratory analysis in the context of automobile fuel choice. J. Adv. Transp. 2013, 47, 667–678. [Google Scholar] [CrossRef]
- Rasouli, S.; Timmermans, H. Specification of regret-based models of choice behavior: Formal analyses and experimental design based evidence. Transportation 2017, 44, 1–22. [Google Scholar] [CrossRef]
- Jang, S.; Rasouli, S.; Timmermans, H. Incorporating psycho-physical mapping into random regret choice models: Model specifications and empirical performance assessments. Transportation 2016, 44, 1–21. [Google Scholar] [CrossRef]
- Jing, P.; Zhao, M.; He, M.; Chen, L. Travel mode and travel route choice behavior based on random regret minimization: A systematic review. Sustainability 2018, 10, 1185. [Google Scholar] [CrossRef]
- Chorus, C.; Cranenburgh, S.V.; Dekker, T. Random regret minimization for consumer choice modeling: Assessment of empirical evidence. J. Bus. Res. 2014, 67, 2428–2436. [Google Scholar] [CrossRef] [Green Version]
- Hess, S.; Beck, M.J.; Chorus, C.G. Contrasts between utility maximization and regret minimization in the presence of opt out alternatives. Transp. Res. Part A 2014, 66, 1–12. [Google Scholar]
- Newman, M. Networks: An Introduction. Astron. Nachr. 2010, 327, 741–743. [Google Scholar]
- Zhang, Y.S.; Yao, E.J.; Dai, H.N. Transfer Volume Forecasting Method for the Metro in Networking Conditions. J. China Railway Soc. 2013, 35, 1–6. [Google Scholar]
- Chorus, C.G.; Rose, J.M.; Hensher, D.A. Regret minimization or utility maximization: It depends on the attribute. Environ. Plan. B Plan. Des. 2013, 40, 154–169. [Google Scholar] [CrossRef]
- Anowar, S.; Eluru, N. Freight mode choice: A regret minimization and utility maximization based hybrid model. Transp. Res. Rec. J. Transp. Res. Board. 2018. [Google Scholar] [CrossRef]
- Heiss, F. Discrete Choice Methods with Simulation; Cambridge University Press: Cambridge, UK, 2003. [Google Scholar]
Figure 1.
Network topology of Guangzhou Metro in 2018.

Figure 2.
Routes details in one scenario from the investigation.

Figure 3.
Travel attributes of the respondents.

Figure 4.
Calculation of angular cost.

Figure 5.
Structure of the nested model.


Table 1.
Specifications of six routes in the choice set.
| Alternatives | Traffic Mode | Specifications |
|---|---|---|
| Route1 | Metro | Interrupted route, passengers will wait until metro lines resume operation, delay time caused by emergencies is included. |
| Route2 | Alternative route (if there is any), no delay time included. | |
| Route3 | Metro & Bus | Without delay time, metro and bus combined traffic mode. |
| Route4 | Metro & Taxi | Without delay time, metro and taxi combined traffic mode. |
| Route5 | Bus | Without delay time, passengers quit metro and choose bus. |
| Route6 | Taxi | Without delay time, passengers quit metro and choose taxi. |
Table 2.
Parameter estimations of the random utility maximization (RUM) and random regret minimization (RRM) models. MNL: multinomial logit.
Table 2.
Parameter estimations of the random utility maximization (RUM) and random regret minimization (RRM) models. MNL: multinomial logit.
| Parameters | MNL1 (T-test) | RRM (T-test) | GRRM (T-test) |
|---|---|---|---|
| Delay time/min | −0.0717 (−32.30) | −0.0208 (−32.95) | −0.00471 (−6.37) |
| Travel time/min | −0.0539 (−44.78) | −0.0165 (−45.32) | −0.0146 (−39.78) |
| Travel cost/min | −0.0877 (−39.25) | −0.0258 (−40.40) | −0.0213 (−37.51) |
| Number of transfers | 0.1100(6.85) | 0.0328 (6.00) | 0.00784 (2.13) |
| Regret-weight | - | - | 0.284 (22.26) |
| Number of observations | 10,128 | 10,128 | 10,128 |
| Null log likelihood | −15,865.066 | −15,865.066 | −15,865.066 |
| Final log likelihood | −13,754.830 | −13,842.778 | −13,405.827 |
| Rho-square | 0.133 | 0.127 | 0.155 |
| Adjusted rho-square | 0.133 | 0.127 | 0.155 |
Table 3.
Parameter estimations with passengers’ personal characteristics. HUR: hybrid model of random utility maximization (RUM)-RRM, NL: nested logit.
Table 3.
Parameter estimations with passengers’ personal characteristics. HUR: hybrid model of random utility maximization (RUM)-RRM, NL: nested logit.
| Parameters | MNL2 (T-test) | HUR (T-test) | NL-RRM (T-test) |
|---|---|---|---|
| Regret Part | |||
| Delay time/min | −0.0515 (−14.65) | −0.0189 (−16.28) | −0.0247 (−15.93) |
| Travel time/min | −0.041 (−19.48) | −0.0126 (−19.73) | −0.0153 (−18.91) |
| Travel cost/min | −0.0311(−11.83) | −0.0099 (−12.51) | −0.0117 (−13.05) |
| Number of transfers | −0.0546 (−1.80) * | −0.0223 (−2.24) | −0.0483 (−2.84) |
| Utility Part | |||
| Sex | 0.457 (11.54) | 0.455 (11.51) | 0.472 (11.36) |
| Income/yuan | 0.859 (8.60) | 0.859 (8.60) | 0.879 (8.26) |
| Travel aim | 0.246 (4.27) | 0.246 (4.26) | 0.248 (4.23) |
| Longest waiting time/min | 1.320 (22.40) | 1.320 (22.38) | 1.320 (22.02) |
| Location | 0.728 (13.44) | 0.719 (13.26) | 0.702 (11.88) |
| Period (peak or non-peak) | 0.190 (3.37) | 0.190 (3.36) | 0.191 (3.33) |
| Travel times | 0.203 (3.25) | 0.205 (3.29) | 0.284 (4.26) |
| Angular cost | - | - | 0.000125 (7.65) |
| Betweenness centrality | - | - | 0.011 (0.20) * |
| Logsum value | - | - | 0.897 |
| ASCs | |||
| ASC_route1 | 0.044 (0.49) * | 3.560 (41.11) | 8.170 (63.65) |
| ASC_route2 | 1.160 (14.30) | 1.200 (15.06) | 5.520 (53.39) |
| ASC_route3 | 0.625 (9.79) | 0.622 (9.86) | 5.080 (51.07) |
| ASC_route4 | −0.386 (−5.54) | −0.389 (−5.61) | 3.850 (38.20) |
| Number of observations | 10,128 | 10,128 | 10,128 |
| Null log likelihood | −15,865.066 | −15,865.066 | −15,865.066 |
| Final log likelihood | −12,425.510 | −12,433.751 | −12,402.699 |
| Rho-square | 0.217 | 0.216 | 0.218 |
| Adjusted rho-square | 0.216 | 0.215 | 0.217 |
PS: ”*” in the table represents the parameter estimation is not statistically significant at 95% level (i.e., the absolute value of t-test is less than 1.96).
© 2018 by the authors. Licensee MDPI, Basel, Switzerland. This article is an open access article distributed under the terms and conditions of the Creative Commons Attribution (CC BY) license (http://creativecommons.org/licenses/by/4.0/).
Share and Cite
MDPI and ACS Style
Wang, X.; Yao, E.; Liu, S. Travel Choice Analysis under Metro Emergency Context: Utility? Regret? Or Both? Sustainability 2018, 10, 3852. https://doi.org/10.3390/su10113852
AMA Style
Wang X, Yao E, Liu S. Travel Choice Analysis under Metro Emergency Context: Utility? Regret? Or Both? Sustainability. 2018; 10(11):3852. https://doi.org/10.3390/su10113852
Chicago/Turabian StyleWang, Xingchuan, Enjian Yao, and Shasha Liu. 2018. "Travel Choice Analysis under Metro Emergency Context: Utility? Regret? Or Both?" Sustainability 10, no. 11: 3852. https://doi.org/10.3390/su10113852
Note that from the first issue of 2016, this journal uses article numbers instead of page numbers. See further details here.