How to Measure Urban Land Use Intensity? A Perspective of Multi-Objective Decision in Wuhan Urban Agglomeration, China

1
School of Geography and Ocean Science, Nanjing University, Nanjing 210023, China
2
Faculty of Resources and Environmental Science, Hubei University, Wuhan 430062, China
3
Institute of Geographic Sciences and Natural Resources Research, Chinese Academy of Sciences, Beijing 100101, China
*
Authors to whom correspondence should be addressed.
Sustainability 2018, 10(11), 3874; https://doi.org/10.3390/su10113874
Submission received: 20 September 2018
/
Revised: 20 October 2018
/
Accepted: 23 October 2018
/
Published: 25 October 2018
(This article belongs to the Special Issue Building Regional Sustainability in Urban Agglomeration: Theories, Methodologies, and Applications)
Abstract
:Urban land intensive use is an important part of regional planning and plays an important role in the sustainable development of cities. However, the research on how to measure urban land use intensity is still controversial. This paper gives a perspective of multi-objective decision to explore the criterion of urban land use intensity in the process of urbanization. The theory of factor substitution was applied to analyze the mechanism of urban land intensive use in different urbanization stage. Additionally, the matching degree model (MDM), curve estimation model, and multi-objective programming model were employed in the case study of Wuhan urban agglomeration to give a multi-objective decision on urban land intensive use. The results show that the level of urban land intensive use lagging behind the level of urbanization development in more than 60% of the counties. When the level of urbanization is less than 30%, 30–70% and greater than 70%, the optimal intensity of urban land use characterized by fixed investments of unit land is 2.6252, 4.6132, and 6.7648 million RMB respectively. Based on optimal intensity, the counties in Wuhan urban agglomeration were divided into key development zone and optimized development zone. Finally, different management strategies were designed for different zones for urban land intensive use.
1. Introduction
Urban expansion has been the focus of attention in the process of urbanization and industrialization in countries throughout the world [1,2,3,4]. From the perspective of regional planning, there are two modes of city expansion, one is “exogenous” and the other is “endogenous”. The exogenous mode refers to expanding laterally on an urban scale, while the endogenous form refers to intensifying urban land use [5]. Accompanying the exogenous mode is often the occupation of numerous high-quality cultivated land, the destruction of the ecological environment, and the intensification of social contradictions [6,7,8,9]. Consequently, it is often considered as an unsustainable mode for city development. By contrast, endogenous form has becoming the preferred pattern for urban smart growth in the current and future. Therefore, urban land intensive use has been getting more and more concern in the study of urban expansion. Based on the literature review, urban land intensive use is widely researched in urban planning, landscape analysis, and land use management. The related research can be summarized in five aspects: First, the discussion of the basic connotation of intensive use of urban land. For example, mixing residential, commercial, and other uses at higher densities was considered as achieving an intensification of land use. Optimized land use structure, and higher inputs and outputs are also deemed as land intensive use [10,11]. The second is the evaluation of urban land use intensity based on different scale units and land types. The scale of evaluation includes national, provincial, municipal, and even specific land types, such as industrial land, residential land, and commercial land [12,13,14]. Third, quantitative analysis of influencing factors of the intensive use of urban land using various model methods. Industrialization, urbanization, economic development level, location, transportation, and policy were thought to significantly impact factors on urban land intensive use [15,16,17,18]. The fourth is the exploration of the intensive utilization path and mode of construction land in the process of urbanization. Smart growth, compact development, and multifunctional intensive land use were proposed as the important modes for urban land intensive use [19,20,21,22]. The fifth is the research for evaluation and improvement of the intensive utilization policy of urban land. Composite indicator management policy, more scientific urban master planning, and strict industrial land policy were put forward to promote urban land intensive use [23,24,25]. Through the analysis of the literature, it can be found that the evaluation of intensity is the core issue of urban land intensive use research. How to measure urban land use intensity scientifically and accurately is the fundamental problem of other related research. Based on the lens of urban planning, urban land is the transmission and presentation of urban functions in the process of urbanization. Accordingly, urban land intensive use level should be compatible with the level of urbanization. That is to say, the judging criteria for intensive use of urban land should consider urbanization factors. Regrettably, the research on urban land intensive use has only focused on evaluation indicators and models, but ignored the urbanization process. Consequently, it is difficult to accurately judge urban land use intensification and identify the optimal intensification by the existing research.
With the rapid advancement of urbanization processes, China’s urban land is expanding at a crazy speed compared with Western countries. According to the statistics, during the years of 2000–2011, urban population in China increased 50.5% while urban land expanded 76.4% at the same time. Referring to Chinese scholars’ calculations, from 2006 to 2030, for every one percentage point increase in China’s urbanization rate, the required land for construction will reach 3.46 × 10³ km2. However, China has the strictest farmland protection system in the world. Under the double pressures of economic development and land resource constraints, the intensive use of urban land is becoming the only way to improve China’ urbanization quality. The central government has therefore proposed to save and intensive use land resources, and take a new-type urbanization path to coordinate land use and urbanization. Therefore, the issue of land intensive use in China should be particularly concerned. The efficient and intensive use of urban land directly affects China’s sustainable development.
In view of the shortcomings of the existing research, this paper starts with the analysis of the mechanism of land intensive use, and rethinks the evaluation criteria of land intensive use. It proposes to identify the optimal intensification through multi-objective comprehensive decision-making. The paper is organized as follows: The next section analyzes the mechanism of urban land intensive use through behavioral economics and factor substitution theory. Following, we consider urbanization as an important parameter for intensive use of urban land. The evaluation criteria and definition of optimal intensity for urban land intensive use is to be discussed in section ‘Evaluation Criteria of Urban land Intensive Use and The Optimal Intensity’. Meanwhile, the characteristic index system of optimal intensity is constructed as well in this section. In the section ‘Methodology and Materials’, a matching degree modeling approach is to be employed to judge the matching status between urban land intensive utilization level and urbanization level. Moreover, a multi-objective decision modeling approach is to be applied to calculate the dynamic optimal intensity of urban land. Wuhan urban agglomeration in China is to be taken as an empirical study, and a set of related data is to be collected. The section ‘Results and Discussion’ shows the intensive utilization status of urban land in Wuhan urban agglomeration under the new evaluation standard and the calculation result of optimal intensive degree in different urbanization stages. Finally, we conclude our study and suggest the possible issues for future study.
2. Mechanism of Urban Land Intensive Use: Perspective of Behavioral Economics and Factor Substitution Theory
According to scholars’ definition of urban land intensive use [20], the intensive use of construction land is essentially reflected by the input interrelationship between construction land, labor, and physical capital, and their output benefits. As we know, under the same conditions, the output benefits are often directly determined by the input level, and the input level is subject to the development stage of urbanization. Based on this, we try to apply economic theory that the factor input and substitution principle to explain the mechanism of urban land intensive use under different stages of urbanization development. On referring to the Northam S-curve, urbanization can be divided into three stages, which include the initial stage, accelerated development stage, and stable development stage. As shown in Figure 1, the L-axis represents the input of the urban land, the F-axis is the labor input, and the K-axis is the fund, technology, and other physical capital investment. In the initial stage of urbanization (Figure 1a), there is a sufficient supply of urban land and a low cost of labor. However, capital is a relatively scarce factor compared to construction land and labor. Consequently, the promotion of urbanization depends more on construction land and labor input instead of capital and technology. As shown in the Figure 1, the change from point A1 to A2 means that the improvement in urbanization rate from Q1 to Q2 relies on the significant increase in construction land investment from L1 to L2, while the physical capital input has only slightly increased from K1 to K2. That is to say, in the initial stage, urbanization is mainly driven by land investment, resulting in a low degree of intensive utilization of urban land.
At the accelerated development stage (Figure 1b), with the continuous accumulation of funds and the rapid development of technology, the physical capital elements have become more abundant than the previous stage. Meanwhile, the irrational expansion of construction land and the pressure of cultivated land protection have forced the government to control the supply of construction land. Land has therefore become a relatively scarce resource. So there is a substitution phenomenon in factor input, which more physical capital inputs have replaced construction land inputs. The driving force of urbanization has shifted from land to capital and technology in this stage, and the level of urban land use intensity has also increased. The change from point A1 to A2 in the figure represents that the substantial increase in physical capital input from K1 to K2 has brought about a raise in the level of urbanization from Q1 to Q2, while the increment rate in construction land input is smaller than that in physical capital.
During the stabilization phase of urbanization (Figure 1c), innovation and wealth have become the dominant factors driving urbanization. On the one hand, compared with the first two stages, the innovation of technology and the agglomeration of social wealth have made urbanization basically free from the constraints of land factor input. On the other hand, the cost of new construction land has become very high due to the limited land resources and the sharp increase in land value. The factor substitution effect forces urbanization to be based on the redevelopment and utilization of stock construction land. Moreover, this also makes it necessary to increase the investment in wealth, technology, and talents of the unit construction land. As a result, the degree of intensive use of urban land has been continuously improved, and even excessive utilization has occurred. In the figure, the urbanization process from Q1 to Q2 just with a certain amount of construction land input, which is driven by the massive expansion in input of other factors.
From the perspective of behavioral economics, the input decision-making behavior of the above production factors is actually the result of marginal cost and marginal output equilibrium. Taking the inputs of urban land (L) and capital (K) as examples: Assuming that the cost of inputting one unit of urban land and one unit of capital is PL and PK respectively. With the change in the relative prices of the two, the proportion of their investment has been adjusted accordingly. As shown in Figure 2, there are two scenarios:
Accelerated development stage scenario: To maintain the current urbanization level Q1, as the contradiction between supply and demand of urban land becomes increasingly prominent and its relative price continue to rise, it is necessary to readjust the allocation ratio of urban land and capital to minimize costs. C0 is the original equal cost line, and C1 is the equal cost line after the increase in relative price of urban land. At this point, the equilibrium of the two factors changes from E0 to E1, while the capital input increases from K0 to K1, and the urban land input decreases from L1 to L0. Assuming that MPK and MPL represent the marginal output of capital and construction land respectively, then the optimal combination of the two elements should meet the follow condition:
MPK/MPL = PK/PL,
Under this scenario, urbanization shows the characteristic of reducing the production factors of urban land by the increase of capital, resulting in a rise in the intensity of urban land use.
Stable development stage scenario: In order to improve the urbanization level from Q1 to Q2, it is necessary to increase the input of production factors. Due to the rise in the relative price of urban land, the rational choice for the combination of production factors should be to increase capital investment rather than to expand the scale of construction land. As a consequence, the capital input increases from K0 to K2, and the equilibrium of the factor allocation changes from E0 to E2, while the input of urban land remains unchanged at L1. Under this circumstance, the promotion in output level of one unit urban land mainly is attributed to the increase in capital input. At the same time, the total amount of construction land is used to encourage the vacant land in the city to be fully developed and utilized. Accordingly, the combined effect of the two aspects has enhanced the intensive use of urban land.
Overall, from the perspective of behavioral economics and factor substitution theory, the intensity of land use changes with the level of urbanization. The essence of this change is due to the relative scarcity and cost of urban land and physical capital, labor, technology, management innovation and other factors. It is the result of decision-making under the equilibrium of marginal cost and marginal output.
3. Evaluation Criteria of Urban Land Intensive Use and the Optimal Intensity
Comprehensive analysis of the existing literature on the intensive use of urban land and the regulations promulgated by Chinese government, most of which only consider the situation of land use but ignore the differences in regional economic and social development when determining intensive use evaluation criteria. The evaluation method is usually as follows: Through the extreme value method or the ideal value method to standardize the evaluation index. Then, calculate the intensive utilization index. And the index score is graded as the criterion for urban land intensive use. However, such judging criteria may lead to the following problems in research: Firstly, the evaluation score must be a relative value if the extreme value method is used for standardization. It is impossible to simultaneously analyze the inter-annual variation of a certain regional intensive degree and the difference of intensive utilization levels in different regions. Secondly, if the ideal value method is employed, then how to determine the ideal value often lacks a scientific method.
The mechanism analysis of urban land intensive use has shown that the intensity of urban land use has theoretically increased with the improvement of urbanization level. And the limited land resources makes urban land intensive use an inevitable choice for city sustainable development. Actually, the main goal of urban land intensive use is to promote regional economic, social and ecological sustainable development in the process of urbanization. However, land intensive use saves land resources by increasing land use intensity, but it may also cause problems such as space congestion and environmental pollution. Obviously, the ideal state is the coordination between the urban land use intensity and the level of urbanization from the perspective of regional sustainable development. Therefore, it is more scientific and reasonable to use the matching status of intensive utilization level and urbanization level as the criterion for evaluating the intensive use of urban land in the region.
Accordingly, by this standard, it is not difficult to speculate that there should be a corresponding optimal degree of urban land in the different stages of urbanization. In fact, the research of relevant scholars has realized the existence of the optimal intensity. Nevertheless, because of the rapid development of technology, the static equilibrium of urban land use intensity is often quickly broken by technological progress. It is difficult to find a clear equant equation due to the constant changes in its theoretical equilibrium. Consequently, the judgment conditions and methods of the optimal intensive degree have not given. In reality, the problem caused by deviating from the optimal intensive degree in urban development is extremely prominent: For instance, the low level of construction land intensive use leads to insufficient urban space utilization, waste of land resources, and even results in “ghost towns”; Instead, if the intensity is too high, the urban space will be crowded, and the per capita possession of public facilities will be insufficient, also people’s living comfort will be reduced. Hence, exploring the optimal urban land use intensity is of great significance for the rational allocation of land resources in the region and the healthy development of urbanization.
The optimal intensive degree of urban land use is dynamic process according to existing research. We consider that it should correspond to the level of urbanization in this paper. Furthermore, with the economic and social development, the measurement of land use efficiency has already become the optimization of comprehensive benefits such as economy, society and ecology instead of the simple economic output. When Theodor Brinkmann first proposed the concept of intensity, its essential definition was the consumption of physical capital, labor, and interest on per unit land area. Based on this, the connotation of the optimal intensity can be defined as: In a certain urbanization stage, the total amount of physical capital input on per unit construction land under the optimal balance of economic benefits, social benefits and ecological benefits.
Characterizing optimal intensification through reasonable indicators is the basis for quantitative exploration of optimal intensity. At present, the evaluation indicators widely used for economic benefits of land use mainly include GDP of unit area, non-agricultural output value or scalable industrial output value per unit construction land, fiscal revenue per unit area, etc.; The social benefit evaluation indicators include population density in construction areas, per capita construction area, employment rate, proportion of public facilities in construction areas, Engel coefficient, etc.; The evaluation indexes of ecological benefits mainly include green coverage rate of construction areas, compliance rate of industrial wastewater discharge, average ecological service value, industrial waste per unit area, and industrial solid waste generated per unit area [21,22,23,24,25,26]. Drawing on the indicators proposed by scholars, the characteristic index system of optimal intensity for urban land was constructed as shown in Table 1.
According to the connotation of the optimal intensity and the selected index system, the optimal intensity of urban land can be considered as an optimal fixed investment of unit urban land. This is achieved by the largest per capita GDP in the secondary and tertiary industries, the largest non-agricultural employment provided by the unit construction land, the largest space for per capita urban land and the minimum pollutant emission intensity per unit construction land.
4. Materials and Methods
4.1. Study Area
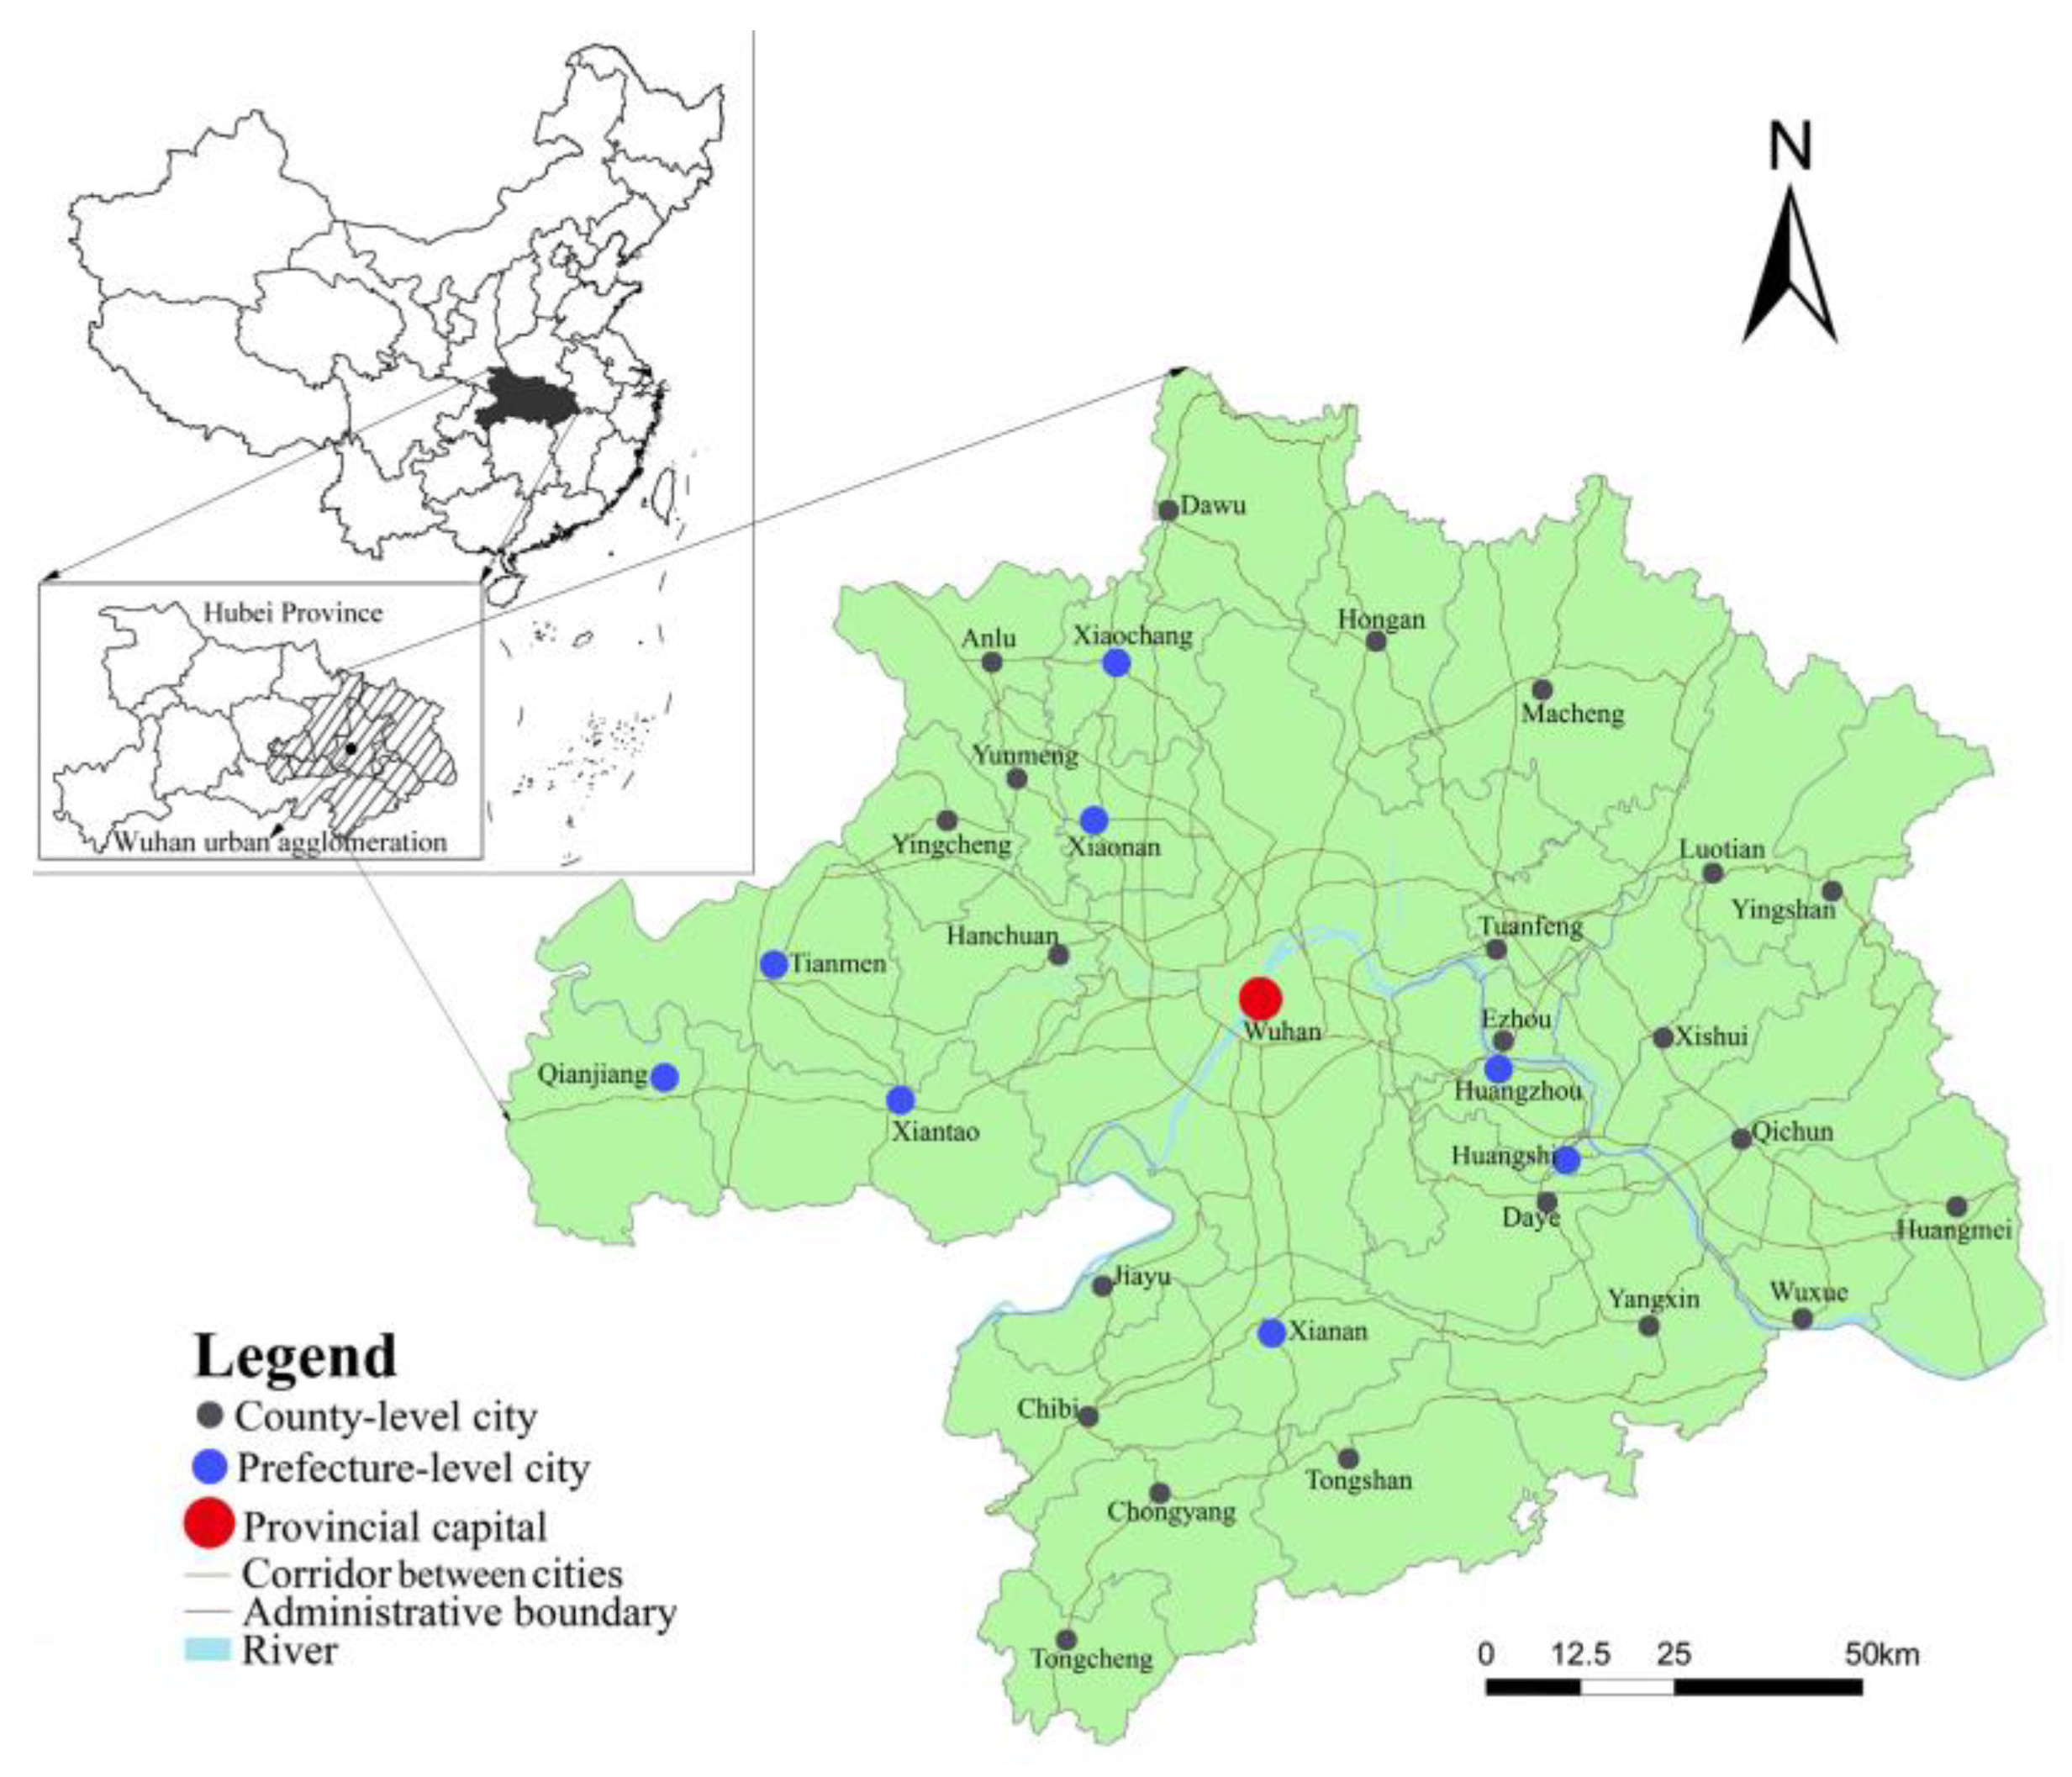
The urban agglomeration is the main form of urbanization in China. It is also the region with the strongest demand for construction land. The ability to coordinate the intensive use of urban land and urbanization in urban agglomeration will largely determine the quality of urbanization in China. Based on this, Wuhan urban agglomeration was chosen as an empirical study. Wuhan urban agglomeration is located in the middle reaches of the Yangtze River, with a total land area of 5.81 × 10⁴ km2. It is also known as the ‘1 + 8’ urban agglomeration due to the combination of Wuhan City and eight other cities within a radius of 100 km. Wuhan urban agglomeration is the largest economy in central China and is an important strategic fulcrum for the rise of Central China. At the same time, Wuhan urban agglomeration is also a pilot and demonstration area for the synthetically reform of the China’s resource-efficient and environment-friendly society. Under the background of the Yangtze River Economic Belt construction, Wuhan urban agglomeration will further develop into a key junction and an important growth pole in the Yangtze River Economic Belt for the interactive development of the East, Central, and West of China. Since 2000, the construction land in the Wuhan urban agglomeration has been rapidly expanding. The total area of construction land has increased from 7.97 × 10⁴ hm2 in 2000 to 19.39 × 10⁴ hm2 in 2012, with an average annual increments of 9155.36 hm2. With the acceleration of the urbanization process in Wuhan urban agglomeration, the demand for construction land in each region will continue to increase in the future. The limited land resources determine that Wuhan urban agglomeration will face severe man-land conflict issues. Therefore, the study on the intensive use of urban land in Wuhan urban agglomeration has a strong typicality. The location map of Wuhan urban agglomeration is shown in Figure 3.
4.2. Data
According to the characteristics of urbanization stage of Wuhan urban agglomeration, we selected typical years of 2000 (the year when the urbanization rate of Wuhan urban agglomeration is less than 30% and it is considered as the initial stage of urbanization), 2009 (the year when the society is affected by the global financial crisis) and 2012 (the year when the urbanization rate of Wuhan urban agglomeration is greater than 50% and it is considered as an important turning point in urbanization) for conducting research. The data includes land use data and socio-economic data of Wuhan urban agglomeration in 2000, 2009, and 2012. Among them, the land use data comes from the ‘Land Use Change Survey Data’ published by the Department of Land and Resources of Hubei Province. The socio-economic data comes from China City Statistical Yearbook, Hubei Statistical Yearbook, and the Statistical Yearbook of cities in Wuhan urban agglomeration. In terms of data processing, since Huangshigang District, Xisaishan District, Xialu District, and Tieshan District of Huangshi City are all relatively small, if these four regions are all studied as independent county units, there may be large estimated deviations in the overall research results. Therefore, using geographical unit merger method, the four districts were used as a unified evaluation unit ‘Huangshi urban area’, and then a total of 45 objects of study were eventually formed.
4.3. Matching Degree Model
How to calculate the matching degree between urban land intensive use and urbanization? Learning from the relevant methods in the exploration of the relationship between different objects, the matching state of the two can be used as a reference to the concept of ‘coupling’ in physics. Therefore, MDM was constructed for measuring the relationship between the intensity of urban land use and urbanization.
In the model, D is the matching degree coefficient of urban land intensive use and urbanization in a region. The larger the value of D, the better the matching state of the two. Ui is the urbanization level of the region i, and Li is the intensive utilization level of the urban land of this region; α, β are random coefficients, and α + β = 1; k is the adjustment coefficient, and 2 < k < 8; refer to related research [27,28], where α = β = 0.5 and k is 5. C is the relative level coefficient of urban land intensive use and urbanization in a region. It can further distinguish the specific relative level characteristics of the two. The division criteria of model results is shown in Table 2:
Through the MDM, the variable of urbanization level can be added to the evaluation criteria for intensive use of urban land, so that the relative advance or lagging relationship between urban land intensive use and urbanization can be accurately judged. Accordingly, scientific countermeasures can be suggested to achieve regional intensive urbanization and coordinated development.
4.4. Multi-Objective Decision Model
Through the above analysis on the definition of optimal intensity and its characterization index, the calculation of urban land optimal intensity has actually become a multi-objective planning problem. The next step is to build the appropriate objective function and the constraint function to construct a Multi-Objective Decision Model. We need to find the correspondence between dependent variable of the fixed investments of unit construction land and the independent variables GDP per capita of secondary/tertiary industry, non-farm payrolls in unit construction land, per capita urban land space, the intensity of pollutant emission of unit construction land respectively. In this paper, 11 kinds of curve estimation models in the regression analysis function of SPSS software are applied to perform curve estimation for the above groups of variables. According to the significance (Sig.) and the correlation coefficient (R2) to judge the pros and cons of the model, and to select the best-fit model to form the objective function [29]. For the constraint function, some binding indicators of regional land use can be selected, such as the total size of urban land determined by the plan, the total amount of new urban land, and the per capita urban land. Besides, existing studies have shown that in multi-objective planning, it is generally difficult to find an optimal solution that satisfies all constraints so that each objective function reaches a maximum or minimum value. It is usually to find the Pareto optimal solution or the weak Pareto optimal solution as the optimal solution to the desired objective function [30]. Consequently, the ‘ideal point’ method of LINGO software can be employed to estimate the Pareto optimal solution of the optimal intensity in Multi-Objective Decision Model.
5. Results and Discussion
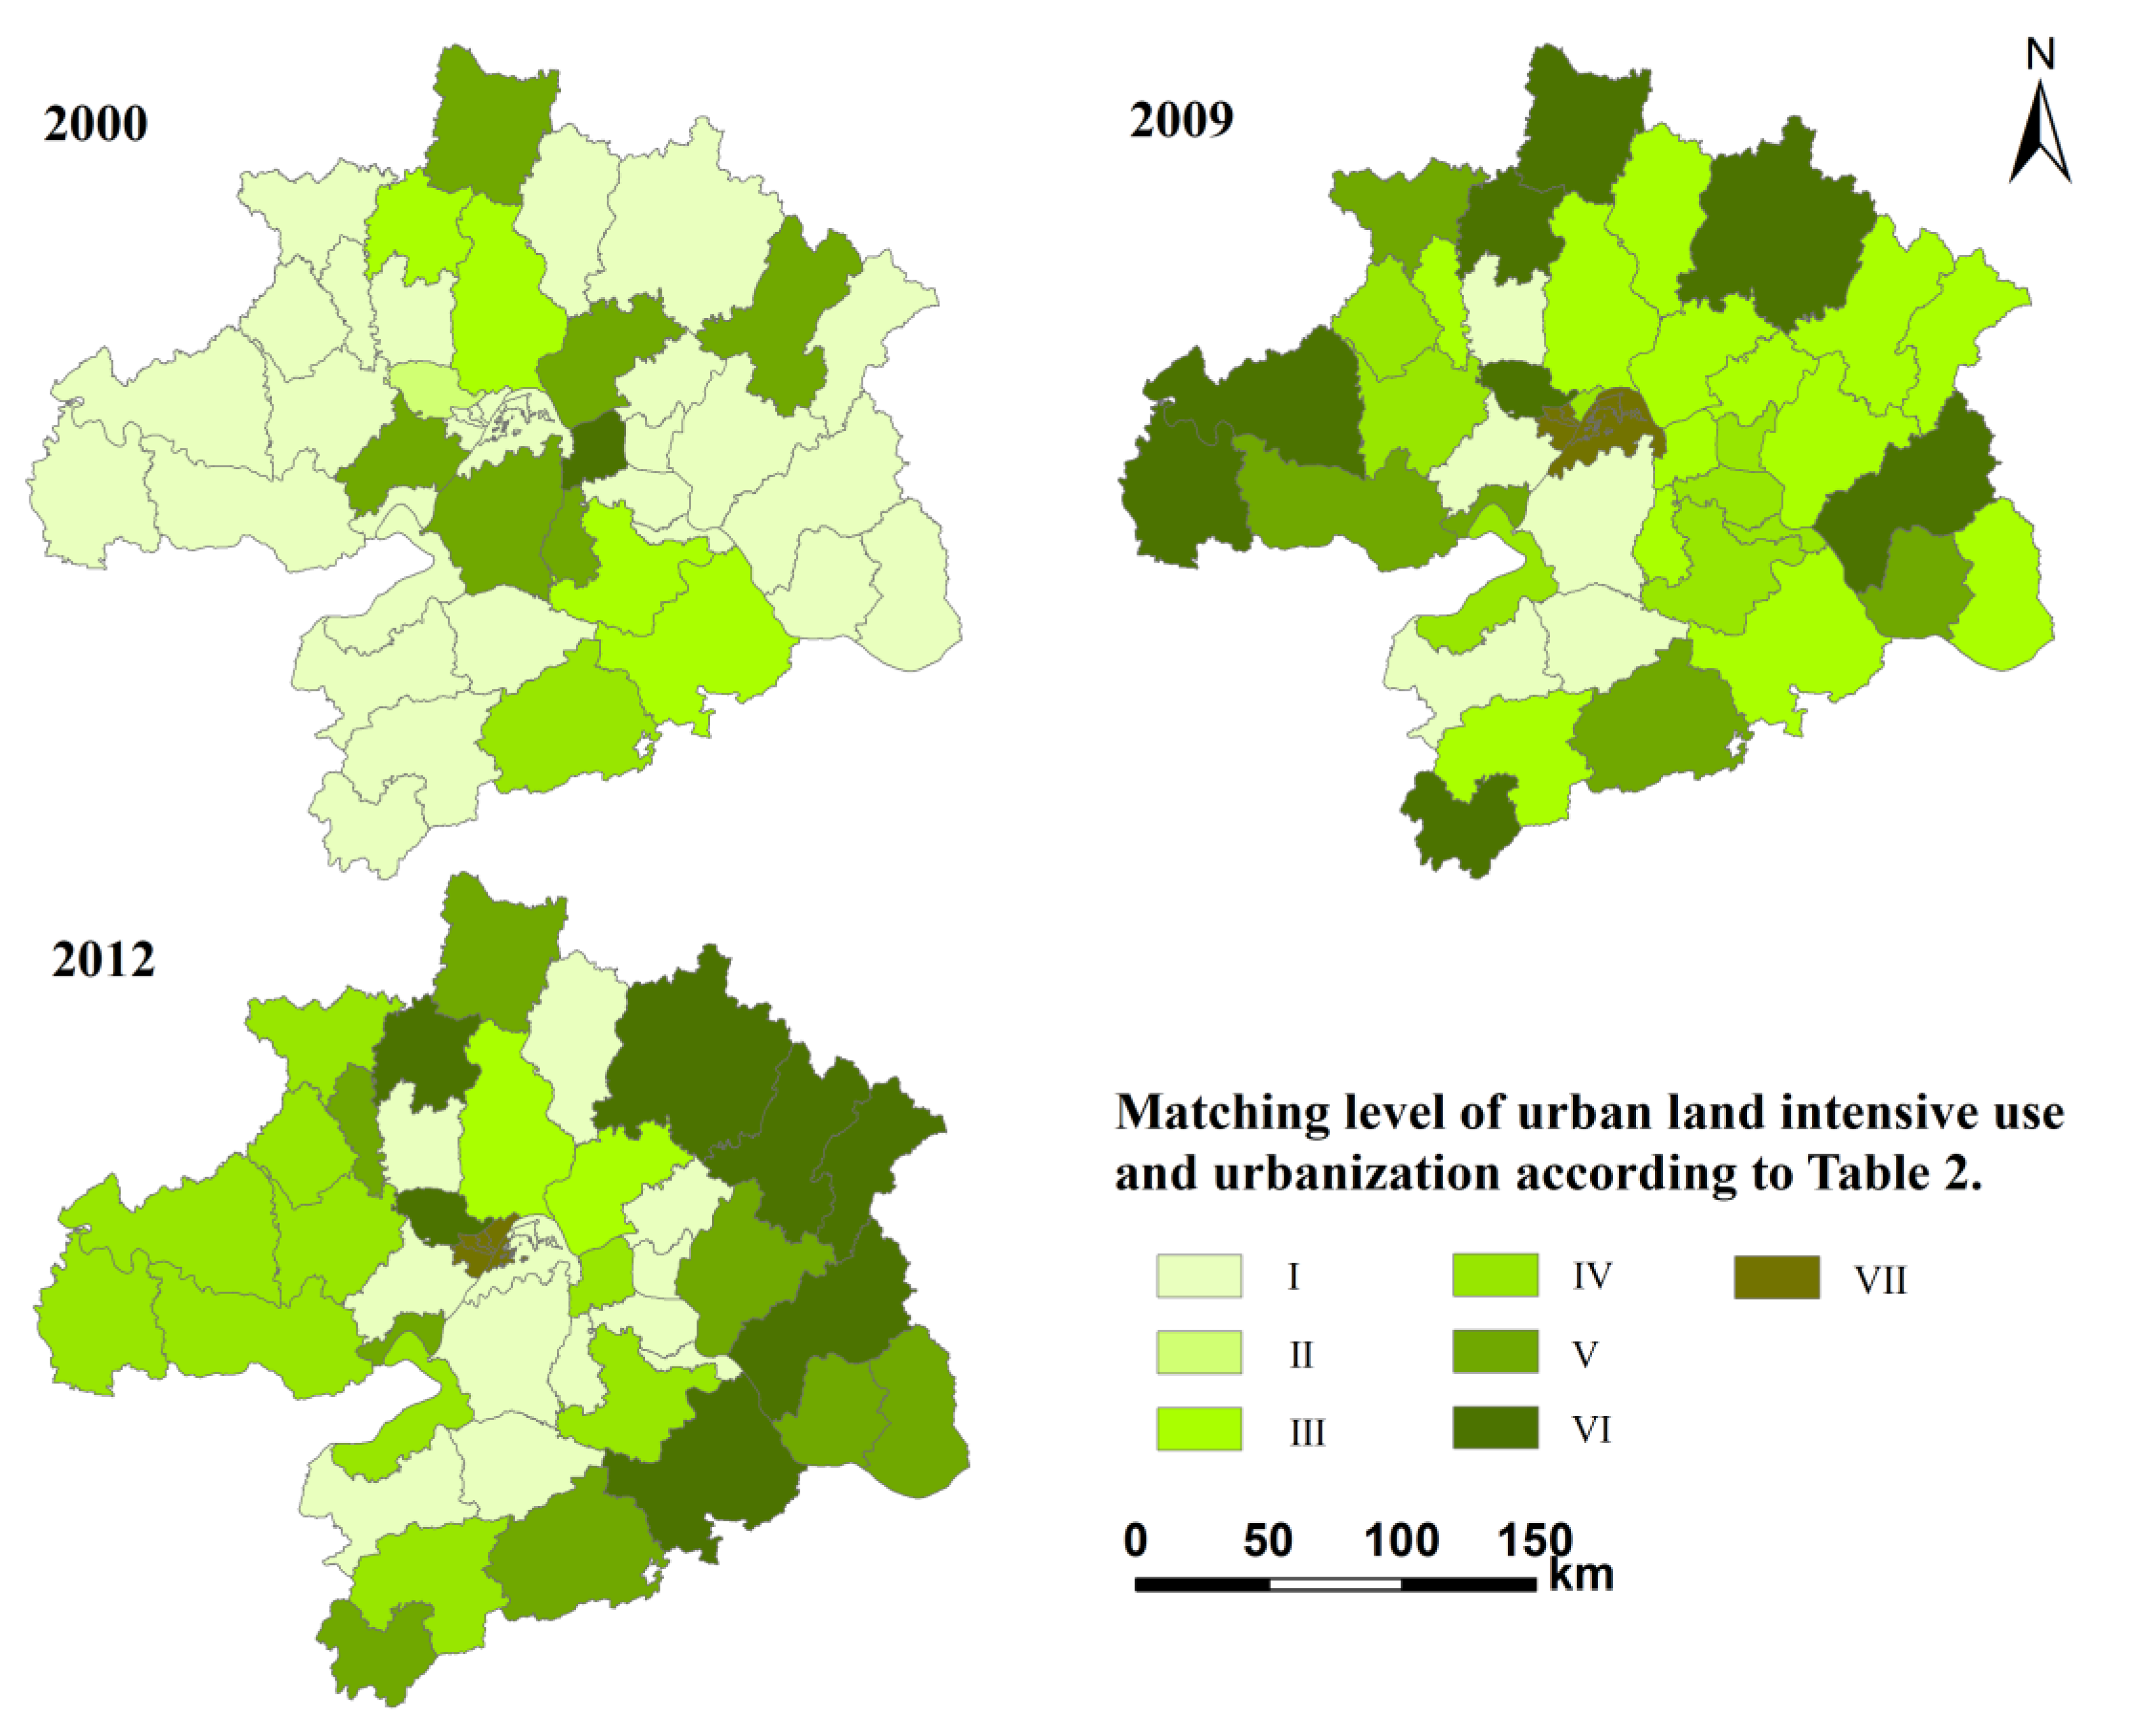
The coordination level between urbanization and intensive utilization in Wuhan urban agglomeration were estimated using the Equations (2) and (3) in order to evaluate the intensity of regional urban land use. According to the criteria of matching level in Table 2, the spatial differentiation of the matched development stages and types of construction land intensive use and urbanization in Wuhan urban agglomeration during the year 2000, 2009, and 2012 was shown in Figure 4.
The results show that the coordinated development of construction land intensive use and urbanization in Wuhan urban agglomeration can be divided into seven types and three stages. From the development stages, the number of antagonistic counties in Wuhan urban agglomerations has decreased from 37 in 2000 to 15 in 2012. The number of counties in running-in period has increased from 8 to 25, and the number of counties in a matched state has increased from 0 to 5. In general, the counties in adjustment period and coordinating state continue to increase while the counties in an antagonistic state continue to decrease. The matching between urban land intensive use and urbanization presenting a coordinated development trend. From the perspective of development types, in the year 2000, nearly 80% of the counties in Wuhan urban agglomeration were in the category of construction land intensive use level lagging behind the urbanization development level. It indicated that urban land was in an extensive use mode in most areas during the initial stage of urbanization. By 2009, the number of counties in this type has been reduced by half, which is due to the state’s policy of ‘Land bid invitation, auction and listing system’ in 2004. This policy effectively curbed the waste of construction land. However, under the pressure of GDP growth slowdown after the financial crisis, local governments have returned to the development mode of promoting economic growth through large amount of land sales. As a result, the level of construction land intensive use has declined again while the level of urbanization continues to increase rapidly. By 2012, the proportion of the counties in which the level of construction land intensive use lagging behind the level of urbanization development has increased to more than 60%. In general, there were very few counties in the simultaneous optimization of urban land intensive use and urbanization, and were all in the state of rivalry or running-in stage. The results show that there is still much room for improvement in the coordinated development of urban land intensive use and urbanization in Wuhan urban agglomeration. Furthermore, there is less counties which the level of construction land intensive use precede the level of urbanization. Its only 2009, due to the impact of the economic crisis, the intensive use of urbanization was slowed down and the intensive use was relatively advanced, making this type account for 40%. But, this type has an increasing trend in general, indicating that the phenomenon of excessive use of construction land in the future urbanization process of Wuhan urban agglomeration will probably increase.
According to Northam S-curve, the level of urbanization in each county of Wuhan urban agglomeration is divided into three stages in 2000, 2009 and 2012, respectively: urbanization rate is less than 30%, urbanization rate is between 30 and 70%, and urbanization rate is greater than 70%. According to the proposed indicator of the optimal intensive degree of urban land, the multi-objective function formed is as follows:
- (1)
- Urbanization rate is less than 30%Objective function:
- (2)
- Urbanization rate is between 30 and 70%Objective function:
- (3)
- Urbanization rate is greater than 70%Objective function:
In the above objective function, the per capita construction land area is not as large as possible. Referring to the standard stipulated in the ‘National New Urbanization Plan (2014–2020)’, urban per capita construction land area strictly controlled within 100 m2. Thereby, adding the per capita construction land area is less than or equal to 100 m2 in the constraint function. In addition, the total amount of regional construction land determined by the regional land use general plan is also an important condition of the constraint function. The optimal land use intensity in each urbanization stage of Wuhan urban agglomeration calculated by LINGO software is shown in Table 3.
According to optimal intensity of urban land in different urbanization stage, counties with a urbanization level of less than 30%, urbanization level of 30–70%, and urbanization level of more than 70% in Wuhan urban agglomeration is classified as key development zone (which the intensive use of construction land lags behind the optimal intensity) and optimized development zone (which the intensive use of construction land exceeds the optimal intensity), as shown in Table 4.
Regions with different urbanization levels have different characteristics in intensive use of construction land. Accordingly, regional differentiation management should be implemented.
Key zones for development are those where the land use intensity does not reach the optimal intensity. When the level of urbanization is lower than 30%, only the Caidian District of Wuhan City is in the key development area. This is mainly because the Caidian District belongs to the Wuhan suburban area. The economic development level and fixed investments are significantly smaller than those in central Wuhan. At the same time, the area of construction land is too large, resulting in a relatively small in fixed assets for per unit construction land. To improve the intensity of urban land use, the region should give full play to the advantages of land use resources. While undertaking industrial transfer in Wuhan’s central urban areas, it should appropriately set the bar to entry higher for the supply of construction land, and increase the investment in fixed investments for construction land. When the urbanization level is between 30 and 70%, key zones for development includes a large number of counties in the Wuhan urban agglomeration. It shows that the level of intensive use of construction land in these areas has not kept pace with the development of urbanization. The fixed investments per unit construction land are still insufficient; the benefits of intensive use of construction land have not been fully realized yet. These areas should be strictly controlled the total amount of land for construction use, and the investment should be further increased and optimized on the existing construction land to increase the land supply threshold; when the level of urbanization exceeds 70%, the urbanization of the county within the key zones for development is already at a relatively high level. It is necessary to take the limitations of the characteristics of each county in consideration when improve the land use intensity. For example, Hongshan District is a typical connected belt of urban-rural with a large area of construction land (the region with the largest construction land in the Wuhan urban agglomeration) and Qingshan District, a typical heavy industrial area, is an old industrial base in central China. The characteristics of these regions make the fixed investments for per unit construction land in these county is relatively low. More attention should be paid to the application of high and new technology in development in these areas. Existing construction land with inefficient use should be redeveloped, so as to increase the level of intensity of regional construction land, and to maximize the overall benefits of the land use.
The optimized development zone means that the intensity of regional land use has exceeded the optimal intensity under a certain level of urbanization, and construction land tends to be over-utilized. In the optimized development zone, the counties with an urbanization level of less than 30% have shown that their fixed investments in construction land is excessive relative to their urbanization level. These regions should be appropriately increased the supply of new construction land, encouraged to develop advantageous industries in combination with regional characteristic resources, to ensure economic growth and upgrade the level of urbanization; The optimized development areas with urbanization levels of between 30 and 70% are mostly counties with small construction land area. Therefore, the fixed investments for unit construction land has acquired a comparative advantage. In fact, these counties have great potential for intensive use of construction land, and they should tap into the potential of stock construction land. At the same time, they should replace the rural construction land through measures such as the increase or decrease of urban and rural construction land, thus providing space for urban development. The optimized development zone with urbanization level of more than 70%, where the level of land use intensity and urbanization has reached a higher level. The structure of construction land should be further optimized in conjunction with the development of regional industries. In addition, the transformation of inefficient urban land use should be strengthened to promote the three-dimensional development of construction land.
6. Conclusions
Urban land intensive use is a critical issue in regional planning and is of great significance to the sustainable development of a city. Literature review indicates that the research on the evaluation of urban land use intensity still needs to be improved. This paper analyzed the mechanism of urban land intensive use, and we believe that the intensive use of urban land should be measured from the matching state of intensity and urbanization. Based on this, a multi-objective decision method was employed to explore the optimal intensity, which was concerned in regional planning. Finally, Wuhan urban agglomeration was chosen as the study area in the empirical research section. There are five findings in this study:
(1) The factors substitution theory can well explain the mechanism of urban land intensive use. Land use intensification changes with the relative price of capital, land, labor, and other factors in different stages of urbanization. The essence of this change is the decision-making under the equilibrium of marginal cost and marginal output.
(2) The intensity of urban land use has theoretically increased with the improvement of urbanization level. Therefore, it is more scientific and reasonable to use the matching status of intensive utilization level and urbanization level as the criterion for evaluating the intensive use of urban land. Furthermore, there should be a corresponding optimal degree of urban land in the different stages of urbanization. We construct a characteristic index system of optimal intensity for urban land use including economic benefits, social benefits and ecological benefits.
(3) The matching degree model (MDM), curve estimation model, and multi-objective programming model were employed in the case study of Wuhan urban agglomeration to give a multi-objective decision on urban land intensive use. Empirical research results show that the level of urban land intensive use lagging behind the level of urbanization development in more than 60% of the counties in 2012. There is still much room for improvement in the coordinated development of urban land intensive use and urbanization. When the level of urbanization is less than 30%, 30–70%, and greater than 70%, the optimal intensity of urban land use characterized by fixed investments of unit land is 2.6252, 4.6132, and 6.7648 million RMB respectively in Wuhan urban agglomeration.
(4) According to the optimal intensity of urban land use, the counties in Wuhan urban agglomeration can be divided into two zones, namely key development zone and optimized development zone. There are different management strategies for different zones. For key development zone, it should appropriately set the land supply threshold higher, strictly control the total amount of land for construction use, and fully redevelop the land which is being inefficiently used. For optimized development zone, urban land structure needs to be further optimized, and three-dimensional development of construction land should be promoted.
(5) The multi-objective decision is an exploration on the study of urban land intensive use. The classification criteria and the characterization index system, objective functions, and constraint functions used in the model are not yet perfect. In particular, some comprehensive indicators, which reflect ecosystem service, should be added in the characterization index system. Consequently, further improvements and corrections are still needed in future research.
Author Contributions
J.Y., G.J. and X.H. designed the approach structure in the discussion and during the writing process; J.Y., G.J. and X.H. collected the data, completed data analysis and wrote the draft; K.C. and H.M. provided guidance and suggestions and revised the final manuscript.
Funding
This research was funded by National Natural Science Foundation of China, grant number 41601592, 41501593, 41771189; China Postdoctoral Science Foundation, grant number 2015M581775; Jiangsu Postdoctoral Science Foundation, grant number 1601261C; National Social Science Fund of China, grant number 17ZDA061.
Conflicts of Interest
The authors declare no conflict of interest.
References
- Colsaet, A.; Laurans, Y.; Levrel, H. What drives land take and urban land expansion? A systematic review. Land Use Policy 2018, 162, 580–586. [Google Scholar] [CrossRef]
- Skog, K.L.; Steinnes, M. How do centrality, population growth and urban sprawl impact farmland conversion in Norway? Land Use Policy 2016, 59, 185–196. [Google Scholar] [CrossRef]
- FAO. The Future of Food and Agriculture: Trends and Challenges. 2017. Available online: http://www.fao.org/3/a-i6583e.pdf (accessed on 18 October 2018).
- Hennig, E.I.; Schwick, C.; Soukup, T.; Orlitová, E.; Kienast, F.; Jaeger, J.A.G. Multi-scale analysis of urban sprawl in Europe: Towards a European de-sprawling strategy. Land Use Policy 2015, 49, 483–498. [Google Scholar] [CrossRef] [Green Version]
- Hui, E.C.M.; Wu, Y.Z.; Deng, L.J.; Zheng, B.B. Analysis on coupling relationship of urban scale and intensive use of land in China. Cities 2015, 42, 63–69. [Google Scholar] [CrossRef]
- Bai, Y.P.; Deng, X.Z.; Jian, S.J.; Zhang, Q.; Wang, Z. Exploring the relationship between urbanization and urban eco-efficiency: Evidence from prefecture-level cities in China. J. Clean. Prod. 2018, 195, 1487–1495. [Google Scholar] [CrossRef]
- Li, J.; Deng, X.; Seto, K.C. The impact of urban expansion on agricultural land use intensity in China. Land Use Policy 2013, 35, 33–39. [Google Scholar] [CrossRef]
- Han, J.; Meng, X.; Zhou, X.; Yi, B.; Liu, M.; Xiang, W.N. A long-term analysis of urbanization process, landscape change, and carbon sources and sinks: A case study in China’s Yangtze River Delta region. J. Clean. Prod. 2017, 141, 1040–1050. [Google Scholar] [CrossRef]
- Deng, X.Z.; Huang, J.K.; Rozelle, S.; Zhang, J.P.; Li, Z.H. Impact of urbanization on cultivated land changes in China. Land Use Policy 2015, 45, 1–7. [Google Scholar] [CrossRef] [Green Version]
- Lau, S.S.Y.; Giridharan, R.; Ganesan, S. Multiple and intensive land use: Case studies in Hong Kong. Habitat Int. 2005, 29, 527–546. [Google Scholar] [CrossRef]
- Zeng, C.; Zhang, A.; Liu, L.; Liu, Y. Administrative restructuring and land-use intensity—A spatial explicit perspective. Land Use Policy 2017, 67, 190–199. [Google Scholar] [CrossRef]
- Wang, J.; Lin, Y.; Glendinning, A.; Xu, Y. Land-use changes and land policies evolution in China’s urbanization processes. Land Use Policy 2018, 75, 28–41. [Google Scholar] [CrossRef]
- Qiao, W.; Gao, J.; Liu, Y.; Qin, Y.; Cheng, L.U.; Ji, Q.Q. Evaluation of Intensive Urban Land Use Based on an Artificial Neural Network Model: A Case Study of Nanjing City, China. Chin. Geogr. Sci. 2017, 27, 735–746. [Google Scholar] [CrossRef]
- Zheng, D.; Shi, M. Industrial land policy, firm heterogeneity and firm location choice: Evidence from China. Land Use Policy 2018, 76, 58–67. [Google Scholar] [CrossRef]
- Li, G.D.; Fang, C.L.; Pang, B. Quantitative measuring and influencing mechanism of urban and rural land intensive use in China. J. Geogr. Sci. 2014, 24, 858–874. [Google Scholar] [CrossRef]
- Lin, S.W.; Ben, T.M. Impact of government and industrial agglomeration on industrial land prices: A Taiwanese case study. Habitat Int. 2009, 33, 412–418. [Google Scholar] [CrossRef]
- Seto, K.C.; Fragkias, M.; Güneralp, B.; Reilly, M.K. A Meta-Analysis of Global Urban Land Expansion. PLoS ONE 2011, 6, e23777. [Google Scholar] [CrossRef] [PubMed]
- Meng, Y.; Zhang, F.R.; An, P.L.; Dong, M.L.; Wang, Z.Y.; Zhao, T. Industrial land-use efficiency and planning in Shunyi, Beijing. Landsc. Urban Plan. 2008, 85, 40–48. [Google Scholar] [CrossRef]
- Gabriel, S.A.; Faria, J.A.; Moglen, G.E. A multi-objective optimization approach to smart growth in land development. Socio-Econ. Plan. Sci. 2006, 40, 212–248. [Google Scholar] [CrossRef]
- Miller, J.S.; Hoel, L.A. The “smart growth” debate: Best practices for urban transportation planning. Socio-Econ. Plan. Sci. 2002, 36, 1–24. [Google Scholar] [CrossRef]
- Chen, H.; Jia, B.; Lau, S. Sustainable urban form for Chinese compact cities: Challenges of a rapid urbanized economy. Habitat Int. 2008, 32, 28–40. [Google Scholar] [CrossRef]
- Wiggering, H.; Dalchow, C.; Glemnitz, M.; Helming, K.; Müller, K.; Schultz, A.; Stachow, U.; Zander, P. Indicators for multifunctional land use—Linking socio-economic requirements with landscape potentials. Ecol. Indic. 2006, 6, 238–249. [Google Scholar] [CrossRef]
- Salata, S.; Gardi, C. From quantitative to qualitative analysis of Land-Take. The application of a Composite Indicator for targeted policies of Land Take reduction. City Saf. Energy 2014, 1, 15–31. [Google Scholar] [CrossRef]
- Gong, J.Z.; Chen, W.L.; Liu, Y.S.; Wang, J.Y. The intensity change of urban development land: Implications for the city master plan of Guangzhou, China. Land Use Policy 2014, 40, 91–100. [Google Scholar] [CrossRef]
- Long, H.L.; Qu, Y. Land use transitions and land management: A mutual feedback perspective. Land Use Policy 2018, 74, 111–120. [Google Scholar] [CrossRef]
- Jin, G.; Deng, X.Z.; Zhao, X.D.; Guo, B.S.; Yang, J. Spatiotemporal patterns in urbanization efficiency within the Yangtze River Economic Belt between 2005 and 2014. J. Geogr. Sci. 2018, 28, 1113–1126. [Google Scholar] [CrossRef]
- Mitchell, D.; Clarke, M.; Baxter, J. Evaluating land administration projects in developing countries. Land Use Policy 2008, 25, 464–473. [Google Scholar] [CrossRef]
- Fang, C.L.; Zhou, C.H.; Gu, C.L.; Chen, L.D.; Li, S.C. A proposal for the theoretical analysis of the interactive coupled effects between urbanization and the eco-environment in mega-urban agglomerations. J. Geogr. Sci. 2017, 27, 1431–1449. [Google Scholar] [CrossRef]
- Wang, Z.Q.; Yang, J.; Deng, X.Z.; Lan, X. Optimal water resources allocation under the constraint of land use in the Heihe River Basin of China. Sustainability 2015, 7, 1558–1575. [Google Scholar] [CrossRef]
- Nijkamp, P.; Rietveld, P.; Voogd, H. Multicriteria Evaluation in Physical Planning, 1st ed.; Elsevier: Amsterdam, The Netherlands, 2013; Volume 185. [Google Scholar]
Figure 1.
Mechanism of urban land intensive use explained by factor input and substitution theory in different urbanization stage: (a) Initial stage; (b) Accelerated development stage; (c) Stable development stage.
Figure 1.
Mechanism of urban land intensive use explained by factor input and substitution theory in different urbanization stage: (a) Initial stage; (b) Accelerated development stage; (c) Stable development stage.

Figure 2.
Mechanism of the alteration in production factor input explained by marginal cost theory.

Figure 3.
The location of Wuhan urban agglomeration.

Figure 4.
Matched development level of urban land intensive use and urbanization in Wuhan urban agglomeration.
Figure 4.
Matched development level of urban land intensive use and urbanization in Wuhan urban agglomeration.


Table 1.
Characteristic index system of optimal intensity for urban land.
| Layer of Characterization | Characteristic Index | Why Choose the Index |
|---|---|---|
| Intensity | Fixed investments of unit construction land | It is the most commonly used index in the evaluation of intensity of construction land. In scholars’ research, this index often with the largest weight, and the most representative of the input intensity of construction land. |
| Economic Benefits | GDP per capita of secondary/tertiary industry | It takes into account both the economic output of construction land and the development of regional economy. |
| Social benefits | Non-farm payrolls in unit construction land | It is the index with the highest frequency of social benefit evaluation for land use intensity, and it is also the most direct measure of the employment ability of the population. |
| Per capita urban land space | It is a comprehensive indicator of the per capita construction area and the proportion of public facilities used in construction areas, reflecting people’s comfort in life. | |
| Ecological benefits | The intensity of pollutant emission of unit construction land | It is the most commonly used indicator for the evaluation of ecological benefits of land use intensity. The data is relatively easy to obtain. |
Table 2.
Criteria of matching level of urban land intensive use and urbanization.
| D Value | C Value | Specific Relative Level Characteristics | Match State |
|---|---|---|---|
| The level of intensive use of construction land lags behind the level of urbanization, and the use of construction land tends to be extensive (Type I) | Rivalry | ||
| The level of intensive use of construction land is optimized simultaneously with the level of urbanization, and the use of construction land tends to be intensive (Type II) | |||
| The level of intensive use of construction land is ahead of the level of urbanization, and the use of construction land tends to be excessive (Type III) | |||
| The level of intensive use of construction land lags behind the level of urbanization, and the use of construction land tends to be extensive (Type IV) | Running-in | ||
| The level of intensive use of construction land is optimized simultaneously with the level of urbanization, and the use of construction land tends to be intensive (Type V) | |||
| The level of intensive use of construction land is ahead of the level of urbanization, and the use of construction land tends to be excessive (Type VI) | |||
| The level of intensive use of construction land lags behind the level of urbanization, and the use of construction land tends to be extensive (Type VII) | Matched | ||
| The level of intensive use of construction land is optimized simultaneously with the level of urbanization, and the use of construction land tends to be intensive (Type VIII) | |||
| The level of intensive use of construction land is ahead of the level of urbanization, and the use of construction land tends to be excessive (Type IX) |
Table 3.
Optimal intensity of urban land use in Wuhan urban agglomeration.
| Level of Urbanization (%) | Less Than 30% | 30~70% | Greater Than 70% |
|---|---|---|---|
| Intensity of construction land (10,000 yuan/ha) | 262.52 | 461.32 | 676.48 |
Table 4.
Zone division of urban land utilization in Wuhan urban agglomeration.
| Urbanization Level | Key Development Zone | Optimized Development Zone |
|---|---|---|
| Less than 30% | Caidian | Xinzhou, Macheng, Qichun, Huangpi, Tongcheng, Yangxin, Hanan, Xishui, Liangzi lake, Tuanfeng |
| 30–70% | Wuxue, Jiayu, Chongyang, Chibi, Hanchuan, Qianjiang, Anlu, Huangmei, Tianmen, Xiantao, Hongan, Xiaonan, Xianan, Jiangxia | Dongxihu, Huarong, Daye, Dawu, Yingshan, Yingcheng, Luotian, Xiaochang, Yunmeng |
| Greater than 70% | Hongshan, Echeng, Huangshi, Qingshan | Jianghan, Hanyang, Wuchang, Qiaokou, Jiangan |
© 2018 by the authors. Licensee MDPI, Basel, Switzerland. This article is an open access article distributed under the terms and conditions of the Creative Commons Attribution (CC BY) license (http://creativecommons.org/licenses/by/4.0/).
Share and Cite
MDPI and ACS Style
Yang, J.; Jin, G.; Huang, X.; Chen, K.; Meng, H. How to Measure Urban Land Use Intensity? A Perspective of Multi-Objective Decision in Wuhan Urban Agglomeration, China. Sustainability 2018, 10, 3874. https://doi.org/10.3390/su10113874
AMA Style
Yang J, Jin G, Huang X, Chen K, Meng H. How to Measure Urban Land Use Intensity? A Perspective of Multi-Objective Decision in Wuhan Urban Agglomeration, China. Sustainability. 2018; 10(11):3874. https://doi.org/10.3390/su10113874
Chicago/Turabian StyleYang, Jun, Gui Jin, Xianjin Huang, Kun Chen, and Hao Meng. 2018. "How to Measure Urban Land Use Intensity? A Perspective of Multi-Objective Decision in Wuhan Urban Agglomeration, China" Sustainability 10, no. 11: 3874. https://doi.org/10.3390/su10113874
Note that from the first issue of 2016, this journal uses article numbers instead of page numbers. See further details here.