Abstract
Pursuant to the concept of inclusive growth, the authors analyze the transition economies of Central and Eastern European countries, which have become EU members (Bulgaria, Croatia, the Czech Republic, Estonia, Latvia, Lithuania, Hungary, Poland, Romania, Slovakia, and Slovenia). CEE countries characterized by comparable historic and economic backgrounds now seem to reach diversified stages of development. The objective of the study is to identify the level of inclusive growth among CEE countries by taking into account indicators assigned to its seven pillars. The article’s thesis is that CEE countries represent social and economic heterogeneity as well as varied levels of sustainable development. Research methods included the application of the principal components analysis and the multivariate analysis. For a literature review, the bibliometric analysis was conducted with the visualization prepared by the VOSviewer software. The main findings suggest that Estonia, Slovenia, and the Czech Republic seem to exhibit the highest level of inclusive growth while Bulgaria and Romania represent the lowest level of indicators measured.
1. Introduction
Globalization, digitalization, and demographic changes are transforming present economies and societies [1,2]. While new opportunities are provided, at the same time, they cause evolution of new, unpredictable forms of risk and an increase in social inequalities in a broader sense. In addition, the economic growth resulting from new processes and phenomena may cause damage to the environment [3,4]. Special attention should also be paid to issues related to the skills of tomorrow’s workforce, support for entrepreneurship while safeguarding job quality, and ensuring social protection, standard of living, and trust in public institutions and public services.
The dynamically changing living conditions caused by the reasons indicated above imply the need to take steps that lead to sustainable development [5,6]. In general, sustainability is a complex concept based on the rule of balance between satisfying not only the needs but also the aspirations of the presence without compromising the needs and the aspirations of future generations [7]. The organizing principle of sustainability is a type of development that is defined through at least three main interconnected and equally important domains (pillars): economic growth, social well-being, and care for the environment [8]. All United Nations Member States adopted the 2030 Agenda for Sustainable Development encompassing the three pillars in order to provide peace and prosperity for the world population and the Earth [5]. The most important part of the Agenda is the collection of 17 global goals known as the Sustainable Development Goals—Figure 1. They emphasize that poverty and other deprivation eradication must happen parallel to the strategies that improve education and health, reduce inequality, and animate economic growth all while preserving the planet.
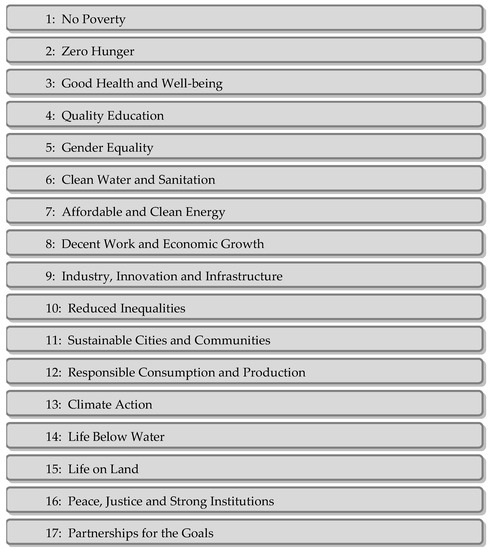
Figure 1.
The sustainable development goals. Source: United Nations.
In other words, according to this approach, development must be economically sustainable (which means: efficient), socially desirable (which can be interpreted as inclusive), and ecologically prudent (in the sense of being balanced) [9]. As such, these three pillars cannot be treated in the same way [10]. One of the consequences of this way of thinking is the concept of inclusive growth [11,12,13]. According to this model approach, the elimination of inequalities by making growth advantageous for all people is the best method that provides global prosperity in a long-term perspective. However, it cannot be understood as providing full equality [14]. These inequalities must be seen in three general contexts: income, wealth, and opportunities (some authors also add a gender perspective [15]). It is crucial as an increase in, for instance, labor productivity, which does not always translate into higher income for the middle-class. Therefore, the reduction of inequalities is not only the concern of the poorest social classes and cannot be associated only with poverty. It shows clearly the magnitude of the challenge.
Inclusive growth embraces the pace and pattern of economic growth, which aims to improve the quality of life especially by mitigating the issues of increasing income disparity and poverty in the world [16]. According to the analyzed concept, the support and, more equitably, the share of the profits derived from economic growth should be obtained by acting in three dimensions: investing in people, supporting business development, and creating proper conditions for life and entrepreneurship (including trusted governments with a number of responsive public institutions). What is also important, in the concept of inclusive growth, everyone has the opportunity to participate in and benefit from economic growth or even in a wider perspective—economic development [17,18]. This kind of dividend should be understood both in monetary and non-monetary terms. However, this process requires a lot of involvement of individuals, business entities, other institutions such as NGOs, and governments. From this point of view, inclusive growth can be seen as an important determinant of sustainable development.
The assumptions stated above as well the inclusive growth objectives are extremely important in Central and Eastern European (CEE) countries [19,20]. In its usual meaning, the term CEE refers to a group of countries including Albania, Bulgaria, Croatia, the Czech Republic, Estonia, Latvia, Lithuania, Hungary, Poland, Romania, Slovakia, and Slovenia. These countries are not only connected by a common geographic location but also are similar in terms of their common history related to the communist system [21]. In the last decade of the 20th century and in the first years of the 21st century, CEE countries underwent deep structural reforms together with the introduction of changes in their institutional framework and stabilization politics (related to the change of the political system). This leads to extremely rapid economic growth and a profound transformation encompassing all areas of life and affecting all social classes. However, this statement does not mean that all countries in the region have developed in the same way and have reached the same level of welfare. It must be emphasized that these processes cannot be uncritically equated with sustainable development.
The quintessence of inclusive growth is that one should not focus solely on economic growth. This concept is based on strong direct links between the micro-economic and macroeconomic determinants of economy and growth. Taking the first kind of factors into consideration, special attention is devoted to the structural change in economic diversification and competition. In the macroeconomic perspective, an important role is assigned to two metrics: gross domestic product (GDP) per capita and total factor productivity. Since the inclusive growth is perceived as economic growth distributed across the entire society in a fair way creating opportunities for all people, these two factors are only the starting point for the analysis. From this perspective, it can be clearly seen that GDP per capita (or similar) cannot be a cardinal measure of the socio-economic development and several new approaches have been proposed in this regard. One of the examples can be found in Europe in 2020 [22], which is a 10-year strategy proposed in 2010 by the European Commission for the development of economy in the European Union. The strategy is focused on growth, which is supposed to be smart, sustainable, and inclusive and is translated into five headline objectives related to: employment, investing in R&D, sources of the energy, education, and poverty.
Another well-known approach for inclusive growth and sustainability is the OECD’s “Framework for Policy Action on Inclusive Growth,” which goes beyond the above factors including simple GDP metrics and statistical averages. The OECD focuses on people’s welfare as well as their ability to create conditions for growth that are inclusive to all and maintain the sustainable development in a long-term perspective. In theory, this aim can be achieved by actions addressed at three types of receivers [23]:
- investing in people and places that have been left behind (through solutions in e.g., childcare, healthcare, education, justice, housing, and infrastructure as well as responsible environmental policy);
- supporting business dynamism and inclusive labor markets (through e.g., technology diffusion, innovation, competition and entrepreneurship, access to jobs and fair contracts regardless of gender or origin, and support in adaptation to future work);
- building efficient and responsive governments (through e.g., aligned policy, integrity, inclusive policy-making, and international coordination).
The World Economic Forum’s System Initiative on Economic Growth and Social Inclusion prepared its own concept of framework. It is a holistic vision based on seven pillars, which are divided into a further 15 sub-pillars (Figure 2) [24]. It is important to note that the scores are obtained in each pillar and they do not collapse into separate, index-crossed pillars, which could describe a new “inter-pillar”—an area independent of the previously defined pillars. The level of growth is calculated on the basis of a relevant set of indicators. Each pillar on its own can achieve and demonstrate inclusive growth. Macroeconomics, trade, and financial policies are still important but there are also new factors that should be included in the calculation of the level of growth in specific countries or, in a broader sense, their sustainable development.
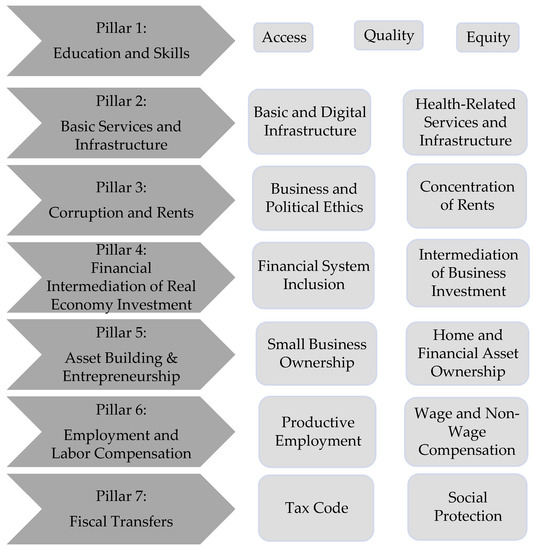
Figure 2.
Inclusive growth and development framework. Source: World Economic Forum.
In light of these considerations, the principal aim of the study is to identify the level of inclusive growth reached by the countries in the CEE region. In order to obtain a wider background, the level of sustainable development in researched countries was included by the authors. This article focuses on CEE countries that have been European Union members, i.e., Bulgaria, Croatia, the Czech Republic, Estonia, Latvia, Lithuania, Hungary, Poland, Romania, Slovakia, and Slovenia. The analysis is based on the seven pillars of the Inclusive Growth and Development Framework of World Economic Forum. Additionally, the concept of 17 goals of Sustainable Development set by the United Nations General Assembly was used. Indicators were assigned to the highlighted pillars, which enabled the measurement of growth in inclusive and sustainable terms. The authors’ original input was to group the indicators into key factors and conduct factor analysis on this basis. Such an approach served as a foundation for further conclusions on growth determinants and countries where a higher level of development was achieved and where the data analysis was expanded for the years 2006 and 2016. The overall thesis is that CEE countries represent social and economic heterogeneity and a noticeably different level of sustainable development.
2. Growth in CEE Countries—The Bibliometric Analysis
The authors used a standard technique of the bibliometric analysis of scientific literature from the Scopus database to characterize the phenomenon of growth in Central and Eastern European countries. The occurrence of key terms was analyzed in three stages in Figure 3. There were 1750 articles identified on growth in the Central and Eastern European region (the phrases ‘Central and Eastern Europe’ and ‘growth’ were encountered in the articles’ titles, abstracts, and among keywords). The analysis was limited to the following subject areas: Social Sciences; Economics, Econometrics, and Finance; Business, Management, and Accounting; Environmental Science; Decision Sciences, which allowed for the identification of 1138 scientific papers in the Scopus database.
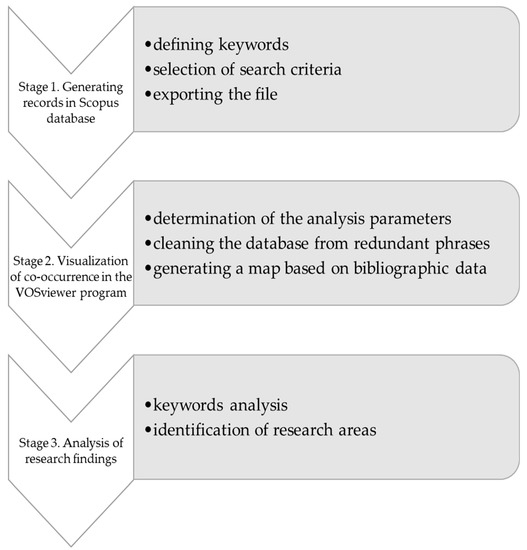
Figure 3.
Stages of bibliometric analysis. Source: own study.
The tool used for ordering and presenting data was the VOSviewer program. This software is particularly useful for working with a sheer volume of data [25]. It is a tool for constructing and visualizing bibliometric networks, which use an advanced layout and clustering techniques to show the existing relationships between keywords characterizing articles from scientific databases. The program highlights the frequency and co-occurrence of keywords that appear in the network [26].
It the second stage, the analysis parameters were determined such as the minimum number of occurrences of a keyword, which was 5. As a result, the number of keywords to be selected was 73. Cleaning the database from redundant phrases allowed for the removal of repeatable words as the names of countries and phrases, which did not match thematically.
The map of research trends connected with growth in Central and Eastern Europe was prepared for visualization (Figure 4). The main link was the economic growth of Central and Eastern Europe. However, the searched phrases also co-occurred with the majority of other areas of research interests. There was a field associated with the transition and development of the European Union. Another research trend was the influence of globalization in terms of competitiveness, trade, fertility, migration, poverty, and inequality. The co-occurrence of keywords also identified the area of regional growth, which refers to the EU enlargement and regional disparities. Regionalism was also reflected in the connection of entrepreneurship with innovation, small business, and transformation. The bibliometric analysis of the CEE growth indicated the relationship of those phrases with convergence, sustainability, total factor productivity, economic development, and tourism.
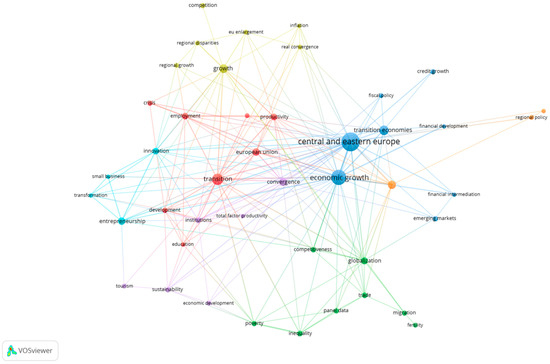
Figure 4.
Map of research trends based on the co-occurrence of the authors’ keywords in publications referring to growth in the Central and Eastern Europe from the Scopus database. Source: own study based on the VOSviewer software.
Regarding scientific research areas identified by the Scopus database, it can be concluded that the growth of CEE countries is understood in more than only an economic dimension. It is a multidimensional phenomenon that encompasses income, employment opportunity, economic security, and quality of life [27].
3. Research Method
The conditions in CEE countries in terms of inclusive growth and its connection with sustainable development was compared with the use of two multivariate techniques: factor analysis and principal components analysis.
Factor analysis, based on the principal components analysis, allowed for the reduction of a significant number of variables to a meaningful, interpretable, and manageable set of factors [28]. The main objective of the principal components analysis is mainly the analysis of the dependence structure, which ensures the simplicity of the description of that structure [29].
Manly [30] indicates that factor analysis is an interdependence technique that seeks to group variables that are similar in the sense that they “move together.” The basic idea is to identify similar variables among numerous indicators, which were qualified to seven pillars of inclusive growth variables and to group them together. Each group represents a key factor of Central and Eastern Europe’s inclusive growth. At the same time, indicators following 17 sustainable development goals were extracted and grouped to verify the connection between inclusive growth and sustainable development.
The application of those techniques fosters visual presentation of factors determining inclusive growth and sustainable development in the analyzed region as 3D scatterplots. They present the position of selected countries in terms of extracted key factors. Countries with similar inclusive growth/sustainable development indicators can be grouped together. This facilitates the possibility to see the position of each country in comparison with other CEE countries.
The research process went through three stages before the data were ready for analysis (Figure 5).
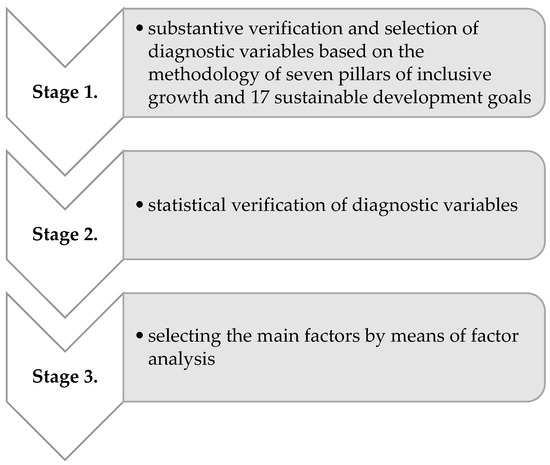
Figure 5.
Stages of the research process. Source: own study.
During the first stage, the data assigned to seven pillars of inclusive growth and 17 sustainable development goals were collected from resources of Eurostat, Worldbank, OECD, The European Environment Agency, International Monetary Fund, World Economic Forum, and the Heritage Foundation (“Index of Economic Freedom”) for 11 CEE countries in two years—2006 and 2016. After substantive verification of data, 56 diagnostic variables for inclusive growth and 51 for sustainable development were approved. The next research stage included statistical verification of diagnostic variables. The creation of a correlation matrix between variables allowed for the rejection of variables with a correlation coefficient smaller than 0.3. As a result, 29 diagnostic variables for inclusive growth and 24 for sustainable development have been qualified including the ones that, in 2006 and 2016, did not have a correlation coefficient below 0.3. Below, the authors present 29 variables for seven pillars of inclusive growth and 24 variables for 17 sustainable development goals that were taken for analysis.
The first pillar included the following variables:
X1: early leavers from education and training by sex as percentage of population aged 18 to 24,
X2: at least upper secondary educational attainment as percentage of population aged 25 to 64,
X5: underachievement in math as percentage of 15-year-old students failing to reach level 2 (‘basic skills level’) on the PISA scale,
X6: underachievement in reading as percentage of 15-year-old students failing to reach level 2 (‘basic skills level’) on the PISA scale,
X7: underachievement in science as percentage of 15-year-old students failing to reach level 2 (‘basic skills level’) on the PISA scale,
X8: participation in learning percentage of population aged 25 to 64 who stated that they received formal or non-formal education and training in the four weeks preceding the survey,
X9: general government expenditure for education as the percentage of GDP.
The second pillar involved:
X10: population having neither a bath, nor a shower, nor indoor flushing toilet in their household as the percentage of population,
X12: percentage of households who have internet access at home,
X13: Internet use by individuals as the percentage of individuals aged 16 to 74 ever used,
X17: self-reported unmet need for medical care by ‘Financial reasons,’ ‘Waiting list,’ and ‘Too far to travel’ as the percentage of population aged 16 and over.
The third pillar covered:
X19: public trust of politicians,
X20: ethical behavior of firms,
X22: diversion of public funds,
X23: government integrity,
X24: intensity of local competition,
X25: favouritism in decisions of government officials.
The fourth pillar took into account:
X27: financing through local equity market,
X29: branches of commercial banks per 100,000 adults,
X31: venture capital availability,
X32: individuals using the Internet for Internet banking as the percentage of individuals aged 16 to 74 within the last three months before the survey.
The fifth pillar encompassed:
X37: property rights as an assessment of the ability of individuals to accumulate private property, secured by clear laws that are fully enforced by the state per million inhabitants.
The sixth pillar took into account:
X42: NEET rate as the percentage of the population of young people aged 15–24 neither in employment nor in education or training,
X44: youth unemployment rate (aged 15–24),
X45: employment rate (females) (%),
X46: employment rate (males) (%),
X48: monthly earnings in industry, construction, and services (excluding public administration) (mean earnings in euro).
The seventh pillar included:
X49: people at risk of income poverty after social transfers in percentages,
X50: reduction in percentage of the risk of poverty rate due to social transfers (calculated comparing at-risk-of poverty rates before social transfers with those after transfers).
The sustainable development diagnostic variables included:
X1: people at risk of poverty or social exclusion as the percentage of total population,
X2: severely materially deprived people as the percentage of the total population,
X4: in work at-risk-of-poverty rate as the percentage of employed persons aged 18 or over,
X6: population unable to keep home adequately warm,
X7: overcrowding rate,
X9: ammonia emissions from agriculture in kilograms per hectare,
X10: life expectancy at birth in years,
X13: death rate due to chronic diseases (number per 100,000 persons aged less than 65),
X14: death rate due to tuberculosis, HIV, and hepatitis (number per 100,000 persons),
X15: people killed in accidents at work (number per 100,000 employees),
X26: gross domestic expenditure on R&D as the percentage of GDP,
X27: employment in high and medium-high technology manufacturing sectors and knowledge-intensive service sectors as the percentage of total employment,
X28: R&D personnel by sector as the percentage of the active population,
X30: share of rail and inland waterways activity in total freight transport,
X31: relative median at-risk-of-poverty gap,
X32: income distribution (quintile share ratio),
X33: income share of the bottom 40% of the population,
X35: people killed in road accidents,
X38: resource productivity and domestic material consumption (purchasing power standard (PPS) per kilogram),
X43: greenhouse gas emissions in tons per capita,
X44: surface of terrestrial sites designated under NATURA 2000,
X45: population-reporting occurrence of crime, violence, or vandalism in their area,
X46: general government total expenditure on law courts in euro per inhabitant,
X47: population with confidence in EU institutions by institution.
The last stage involved the identification of the key factors by using factor analysis. They are synthetic indicators for groups of variables representing a correlation equal or higher than 0.7. There are two groups of synthetic indicators because the article compares two years—2006 and 2016. This approach can help capture differences in the analyzed periods.
Cronbach’s alpha coefficients were calculated for reliability analysis. They show to what extent the set of variables that make up a given dimension measures a single one-dimensional construct. The scale reliability ratio should be at least 0.70 [31,32]. All constructs—for both inclusive growth as well as sustainable development—proved the acceptable reliability of the scale ranging from 0.7 to 0.8 (Table 1 and Table 2). In addition, the removal of any of the factors reduces the value of the Cronbach’s alpha. As a result, it can be assumed that the set of variables used in the factor analysis (in both analyzed cases) focuses well enough on a single construct (inclusive growth or sustainable development) [33].

Table 1.
Cronbach’s alpha coefficients for inclusive growth factors.
Table 2.
Cronbach’s alpha coefficients for sustainable development factors.
4. Results
The key factors were extracted for the years 2006 and 2016. The first one was associated with the period of economic prosperity. After two years, the period was associated with the accession of 10 new members to the EU (including eight CEE countries: the Czech Republic, Estonia, Hungary, Latvia, Lithuania, Poland, Slovakia, Slovenia). It was possible to obtain the most recent data in the year of 2016 when all the analyzed CEE countries were already benefitting from their EU membership.
With regard to factor analysis based on data from 2006, three factors of inclusive growth were extracted.
Factor 1 “State-created conditions for quality of life” included: pillar 1 (X6: underachievement in reading; X9: general government expenditure for education); pillar 2 (X12: percentage of households who have Internet access at home); pillar 3 (X19: public trust of politicians; X22: diversion of public funds; X25: favouritism in decisions of government officials); pillar 4 (X27: financing through local equity market); pillar 6 (X42: NEET rate; X48: monthly earnings in industry, construction, and services (excluding public administration)).
Factor 2 “Social inclusion” covered: pillar 1 (X1: early leavers from education and training); pillar 2 (X10: population having neither a bath, nor a shower, nor indoor flushing toilet in their household; X17: self-reported unmet need for medical care); pillar 7 (X49: people at risk of income poverty after social transfers, X50: reduction in percentage of the risk of poverty rate due to social transfers).
Factor 3 “Labor market situation and digitalization” gathered: pillar 4 (X32: individuals using the Internet for Internet banking); pillar 6 (X44: youth unemployment rate, X45: employment rate (females), X46: employment rate (males)).
The above factors covered 80% of variation among data. They included the selected variables from seven pillars of inclusive growth (out of the ones which were positively statistically verified). It can be observed that the variables from the fifth pillar are not represented in any of the key factors.
The analysis of the key factors proves a high level of heterogeneity among CEE countries (Table 3, Figure 6). The first factor, which refers to state-created conditions for quality of life, in 2006, indicated that, in Slovenia, Latvia, Croatia, and Estonia, there is a high level of public support. At the same time, the lowest state care when it comes to education, Internet access, or level of salaries in the first out of the two analyzed years took place in Bulgaria, the Czech Republic, Slovakia, and Romania. It can be surprising to see the Czech Republic included in that group due to its relatively better position among the new member states from the moment of joining the EU.
Table 3.
Factor scores in CEE countries in 2006.
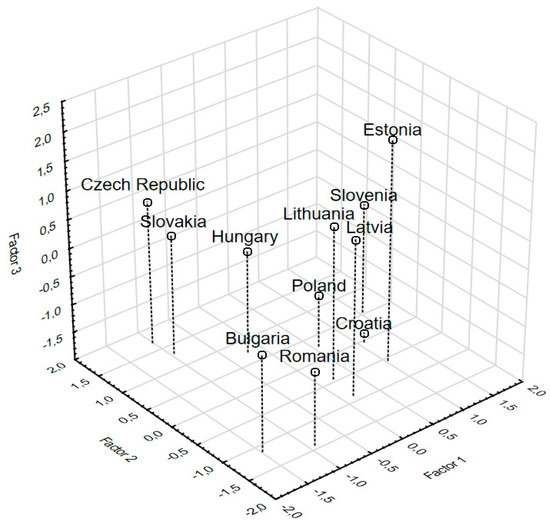
Figure 6.
Conceptual map—distribution of countries according to the selected factors of inclusive growth (2006). Source: own study.
The second key factor is linked to social inclusion. It shows that, in 2006, the most socially excluded countries were Romania, Bulgaria, and Latvia. It mainly results from a significant share of early leavers from education and training in the population aged 18 to 24 years and the unmet need for medical care. A high level of risk of income poverty after social transfers is observed in those countries and, at the same time, the impact of social transfers on poverty reduction is low. Additionally, for Romania, there was a significantly high share of the population without a bath or a shower or an indoor flushing toilet in their households. At the same time, the largest number of inclusive conditions for education or health issues existed in the Czech Republic and Slovakia. The level of development in those countries can be one of the reasons for lower state-support indicated by the first factor.
The third factor refers to the labor market situation and digitalization. When it comes to the level of factor 3, Estonia was the leader out of CEE countries. Its favorable labor market situation seems to be a long-term phenomenon, which took place before entering the EU [34]. Additionally, that country represented the highest share of the population using the Internet for Internet banking. The worst labor market situation and digitalization was observed in Croatia, which, at that time, did not belong to the EU.
Poland, Hungary, and Lithuania represented an average level among CEE countries in terms of all three factors.
In the analysis based on data from 2016, three key factors of inclusive growth were additionally extracted. However, they were slightly different in the composition of variables compared with 2006, so they covered marginally different research areas.
Factor 1 “Education expenditures, unsatisfactory medical services, and state transparency”: pillar 1 (X9: general government expenditure for education); pillar 2 (X17: self-reported unmet need for medical care); pillar 3 (X19: public trust of politicians; X20: ethical behavior of firms; X22: diversion of public funds; X23: government integrity; X25: favouritism in decisions of government officials).
Factor 2 “Social inclusion”: pillar 1 (X1: early leavers from education and training; X6: underachievement in reading;); pillar 2 (X10: population having neither a bath, nor a shower, nor indoor flushing toilet in their household); pillar 6 (X42: NEET rate; X48: monthly earnings in industry, construction, and services (excluding public administration)); pillar 7 (X49: people at risk of income poverty after social transfers; X50: reduction in percentage of the risk of poverty rate due to social transfers).
Factor 3 “Labor market situation”: pillar 4 (X31: venture capital availability); pillar 6 (X44: youth unemployment rate; X46: employment rate (males)).
The above factors covered 78% of variation among data. In 2016, similarly to 2006, almost all pillars were represented with the use of the created key factors apart from the variables from the fifth pillar. Again, CEE countries did not create a homogeneous group (Table 4, Figure 7).
Table 4.
Factor scores in CEE countries in 2016.
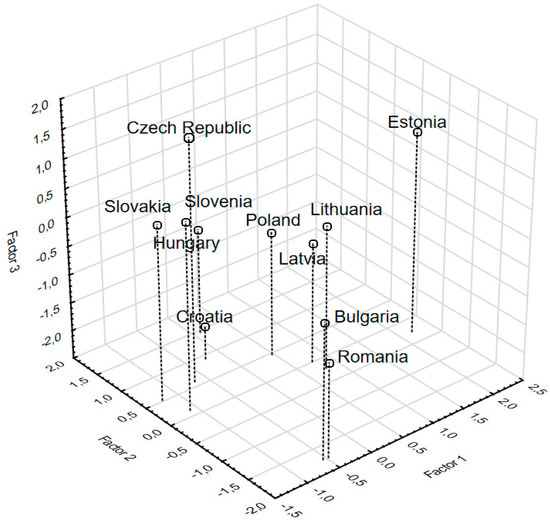
Figure 7.
Conceptual map—distribution of countries according to the selected factors of inclusive growth (2016). Source: own study.
Estonia reached the highest level measured by the first factor (education expenditures, unsatisfactory medical services, and state transparency). However, it was mainly caused by a significantly high, self-reported, and unmet need for medical care in that country in 2016. On the other hand, the lowest level of factor one was in Slovakia and Hungary because of the low level of educational expenditure but with satisfactory medical services and low favoritism in decisions made by government officials.
In 2016, the second factor (social inclusion) was highest in Slovenia and characterized by an inclusive educational and training system for youths, good sanitary living conditions, and the highest earnings. The lowest social inclusion, after 10 years, was still in Bulgaria and Romania.
The labor market situation (the third factor) on both the demand and supply side was the best in the Czech Republic. That country also significantly improved its labor market situation in 2016 in comparison to 2006. Nonetheless, it is worth mentioning that the employment rate of females, which, in the Czech Republic, is relatively low, was removed from the third factor in 2016. The worst labor market situation, which was the same as in 2006, was in Croatia.
The factor analysis of sustainable development in 2006 extracted the following three key factors:
Factor 1 “Prevalence of poverty” included: X1: people at risk of poverty or social exclusion, X2: severely materially deprived people, X6: population unable to keep home adequately warm, X38: rresource productivity and domestic material consumption, X44: surface of terrestrial sites designated under NATURA 2000.
Factor 2 “Risk of poverty” covered: X4: in work at-risk-of-poverty rate, X31: relative median at-risk-of-poverty gap, X32: income distribution, X33: income share of the bottom 40% of the population, X43: greenhouse gas emissions.
Factor 3 “Life threatening factors” gathered: X10: life expectancy at birth, X14: death rate due to tuberculosis, HIV, and hepatitis, X30: share of rail and inland waterways activity in total freight transport, X35: people killed in road accidents, X45: population-reporting occurrence of crime, violence, or vandalism in their area.
The above factors covered 77% of the variation among data. The analysis of the key factors of sustainable development also proves a high level of heterogeneity among CEE countries (Table 5, Figure 8).
Table 5.
Factor scores in CEE countries in 2006.
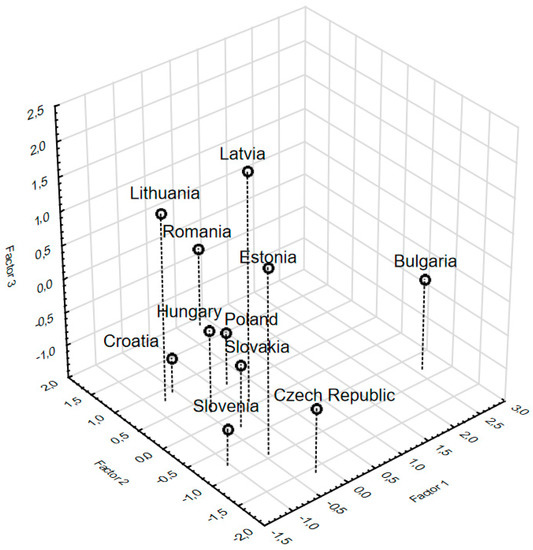
Figure 8.
Conceptual map—distribution of countries according to the selected factors of sustainable development (2006).
The highest prevalence of poverty was in Bulgaria while the lowest prevalence of poverty was in Slovenia and Lithuania. The dominance of Bulgaria was connected with the highest levels of variables among all CEE countries such as people at risk of poverty or social exclusion, severely materially deprived people, and a population unable to keep the home adequately warm. At the same time, resource productivity and domestic material consumption was the lowest in Bulgaria.
However, in 2006, Bulgaria was not a CEE country with the highest risk of poverty, but Romania was. This country obtained the highest level of the second factor, i.e., largest share in work at-risk-of-poverty rate, relative median at-risk-of-poverty gap, and income distribution. The lowest poverty risk was in the Czech Republic as well as a very low work and at-risk-of-poverty rate.
The third factor grouped variables describing life threat factors where the Baltic states scored the highest. Latvia and Lithuania were characterized by the lowest life expectancy at birth. All three Baltic countries recorded the highest death rates due to tuberculosis, HIV, and hepatitis as well as people killed in road accidents. Moreover, these countries represented the highest share of rail and inland waterways activity in total freight transport, which somehow can contribute to the road hazards. The lowest level of life threatening factors was in Croatia and Slovenia.
With regard to factor analysis based on data from 2016, three key factors of sustainable development were extracted. However, they were different in the composition of variables when compared with 2006, so they covered slightly different research areas.
Factor 1 “Poverty and its consequences” included: X1: people at risk of poverty or social exclusion, X2: severely materially deprived people, X6: population unable to keep home adequately warm, X32: income distribution, X35: people killed in road accidents, X45: population reporting occurrence of crime, violence, or vandalism in their area.
Factor 2 “Reasons of mortality” covered: X14: death rate due to tuberculosis, HIV, and hepatitis, X15: People killed in accidents at work, X30: share of rail and inland waterways activity in total freight transport, X33: income share of the bottom 40% of the population.
Factor 3 “Green quality of life” gathered: X7: overcrowding rate, X26: gross domestic expenditure on R&D, X28: R&D personnel by sector, X43: greenhouse gas emissions.
The above factors covered 78% of variation among data. The heterogeneity among CEE countries relating to sustainable development has been maintained in 2016 (Table 6, Figure 9).
Table 6.
Factor scores in CEE countries in 2016.
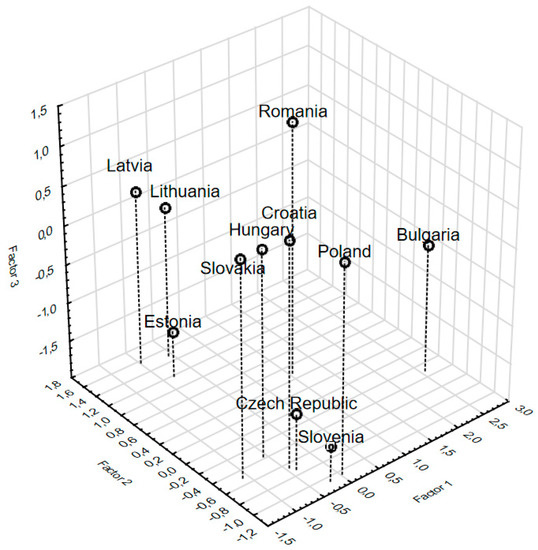
Figure 9.
Conceptual map—distribution of countries according to the selected factors of sustainable development (2016).
In 2016, the problems associated with poverty were still the most severe in Bulgaria. It is also worth noting that Bulgaria suffered the most serious consequences of poverty in the form of the population-reporting occurrence of crime, violence, or vandalism in their area. Romania ranked second in terms of the first factor. In 2016, the lowest poverty and its consequences occurred in Slovakia.
In 2016, the Baltic states were still the most endangered by mortality. Both a high death rate due to tuberculosis, HIV, and hepatitis and a significant share of rail and inland waterways activity in total freight transport caused the situation. The lowest indicator was observed in Slovenia and Poland.
The ‘Green quality of life’ factor was the highest in Romania because of the low greenhouse gas emissions. At the same time, in Bulgaria and Romania, the lowest gross domestic expenditure on R&D and R&D personnel by sector were noted, which lower the factor level. The lowest third factor was recorded in Slovenia, Estonia, and the Czech Republic, which were the most developed countries among CEE but had the highest greenhouse gas emissions as well as the expenditure and employment in R&D [35]. Furthermore, the authors analyzed the relation of inclusive growth to sustainable development by measuring correlation coefficients between factors’ scores (Table 7 and Table 8).
Table 7.
Correlation coefficients between factors’ scores of inclusive growth and sustainable development in 2006.
Table 8.
Correlation coefficients between factor scores of inclusive growth and sustainable development in 2016.
In 2006, the strongest positive correlation between factors out of two research areas was identified between the third factor of inclusive growth and the third factor of sustainable development. The better labor market situation and digitalization are connected to more life threatening factors. A strong negative correlation can also be observed between the first factor of inclusive growth and the first factor of sustainable development. It can be assumed that better state-created conditions for quality of life generate a lower prevalence of poverty.
A relatively strong positive correlation was identified in the 2016 data between the first factor of inclusive growth and the second factor of sustainable development. It can be described as the impact of unsatisfactory medical services on the reasons of mortality. The strongest negative correlation was observed for the second factor of inclusive growth and the first factor of sustainable development. It can be said that higher social inclusion causes lower poverty and its consequences.
5. Discussion
The main purpose of this article was to identify the level of inclusive growth reached by the countries in Central and Eastern Europe. Literature suggests that, in general, despite similarities (especially in common history of political and related economic transformations), CEE countries cannot be treated as a homogenous group and they represent different levels of sustainable development [20,36]. This statement finds confirmation in the authors’ analysis. The discrepancies occur in both years taken into consideration—in 2006 and in 2016.
Noteworthy conclusions can be drawn from the information about variables qualified to be synthetic key factors and formed groups. During both years, the key factors that describe the level of inclusive growth in CEE countries are similar but not identical.
In the case of the first key factor of inclusive growth in 2006, variables are related to conditions for quality of life such as education, access to the Internet, earnings, public trust, or favoritism in decisions made by the government, etc. Ten years later, in the analogous factor, there is no variable connected with e.g., the Internet but there are the other ones—for example: ethics in firms or government integrity. This phenomenon indirectly could confirm the transition of countries to the next stage of economic development. Above all, in this area correlation is visible between variables related to the quality of the public environment and the ethics in institutions (public and private). It can be assumed that these issues have become even more important after the global socio-economic crisis in 2007.
The second key factor of inclusive growth in both years was attributed to social inclusion and the variables were related to broadly understood poverty or the risk of poverty and a share of early leavers from education and training. This shows social inclusion as the essential aspect of inclusive growth. Especially in CEE countries which have experienced rapid changes in their political and economic systems, a dynamic economic growth rate has affected societies both positively (welfare) and negatively with social gaps widening or poverty risk increasing. In their study, the authors observe this situation after comparing the analyzed factor in 2006 and 2016.
The last extracted key factor refers to the labor market. In 2006, this factor included a variable describing the use of the Internet for online banking, which may be explained by the situation in the labor market where employees wanted to meet their financial needs. The lack of this variable in 2016 requires deeper research but perhaps it is related to a higher level of financial inclusion among CEE countries in 2016 [37,38]. Another area identified for further research is a lack of a variable describing a female employment rate in 2016. This is also important information for the right interpretation of the results of the authors’ study.
Analyzing the level of inclusive growth in CEE countries, it can be seen that, in general, two countries represent the lowest level of inclusive growth in both 2006 and 2016. These are Bulgaria and Romania. The authors’ results are confirmed by other analyses and research reports. Despite the improvement of some component factors, these countries clearly stand out from the rest of the analyzed region. Their situation can be partially explained by a lower level of development before their accession to the European Union and afterwards, in 2006, by the impact of the financial crisis [39]. Growth in Romania is constrained by weak commitment to policy implementation, an unfavourable business environment and strong connections between politics and business, which often translates into corrupt behavior [40,41]. A similar problem with the level of corruption exists in Bulgaria [42]. There is also a strong pressure from local interest groups, which is a frequent lack of administrative capacity and a deficit of good governance. Another important factor common to both countries seems to be their geographical location. The location distance from highly developed neighbouring countries is an obstacle for the establishment of companies or factories in these areas. A different situation takes place in the Czech Republic where there are relatively many important factories such as e.g.,: Toyota, Volkswagen, and Peugeot, which manufacture cars for customers worldwide. Moreover, its functioning outside the euro zone assures an additional competitive advantage especially in terms of exports and attracting foreign investment. This contributes to better conditions for reaching a higher level of sustainable development in this country, which is visible especially in the authors’ third key factor (“Labour market situation”) of inclusive growth. Such findings are similar to other analyses based on indicators used in Sustainable Development Goals. For instance, one of the best-positioned country from the entire EU is the Czech Republic in contrast to Bulgaria and Romania, which are countries that show the worst results [43].
While it was not challenging to identify countries with the lowest level of achieved inclusive growth, it is not simple to distinguish leaders. The examples of countries that occupy varied but rather better than average positions among other CEE countries in terms of the key factors of inclusive growth are Estonia and Slovenia [44]. It can be said that Estonia benefited from a window of opportunity with regard to reforming its economy and entered a path of sustainable development [45]. Even though this may result from many determinants, from this study’s perspective, it is worth indicating that the most important are friendly business environment, high labor market participation, high educational attainment, well-educated and flexible labor force, a developed ICT sector, and a good level of stability in public finances [46]. Yet, on the other hand, in comparison to CEE countries (excluding Romania and Bulgaria), Estonia exhibits a high level of the income inequality—the gender pay gap is high and poverty remains elevated. Hence, it can be concluded that Estonia occupies a low position in the analyzed region in the second key factor of inclusive growth (“Social inclusion”). A completely different situation takes place in Slovenia. In this country, the variables describing poverty and inequality are at a low level [47]. What is more, there is a significant improvement if the years 2016 and 2006 are to be compared. In the case of the third key factor of inclusive growth, Slovenia is ranked at an average level even though a deeper analysis of component determinants indicates worse values than the average. Analyzing the first key factor of inclusive growth, it must be stressed that the variables reached quite a high level (in comparison to the rest of CEE countries) and, in some cases, they fell in 2016. But the specific reasons for that situation could be found during further in-depth studies.
It must be highlighted that the correlation levels between the key factors of inclusive growth and key factors of sustainable development were not statistically significant in some cases, but they can be explained by the fact that the indicators used in the analysis were capturing different dimensions of these two concepts. At the same time, some of the correlation coefficients were negative, but this can be explained by the character of the key factors. The assumptions about the significance of correlation and the direction of the relationship based on reports on inclusive growth and sustainable development were confirmed. The most visible examples could be the relation between better state-created conditions for quality of life and the lower prevalence of poverty or the relation between higher social inclusion and lower poverty and its consequences. The above observations confirm that the inclusive growth is the important determinant of sustainable development.
6. Conclusions
There is no doubt that CEE countries followed similar paths in transforming from centrally planned to fully market-based economies. After the collapse of communism, they shared common experience in pursuing the growth model and integration with the EU standards. The pace of long-term growth and joining the European Union were the most important focus areas to bring the standard of living in CEE countries in line with much higher developed Western countries. It means that the main objective of public policy makers in the first years of transformation was to provide conditions for sustainable development and inclusive growth. After the EU accession, the analyzed countries made effort to maintain the high economic growth rate while keeping the principles of sustainability and inclusiveness.
The results, which were obtained based on the completed analyses, compared with studies on economic growth (not including the inclusive growth concept) confirm the assumption that purely economic growth does not automatically lead to sustainable development. By applying an approach based on seven pillars of inclusive growth, one could observe the areas that determined its level and countries where the situation was transformed. The determinants of the “Social inclusion” factor, which were most substantial and clearly visible in the majority of CEE countries, should be a subject for a deeper analysis.
In 2006, differences in terms of inclusive growth among CEE countries were visible. Some studies conclude that country-specific factors were the major determinants of different levels of growth. Analyses prove that specific macroeconomic policies during transformation were less decisive than the level of political stability, the quality of institutional framework, and of informal institutions and the initial level of development [48]. Heterogeneity is shown in this study. However, the authors’ research leads to the extraction of three key factors that determine the level of inclusive growth in each analyzed country. They were called: “State-created conditions for quality of life,” “Social inclusion,” and “Labor market situation and digitalization.” This kind of clustering emphasizes which areas are particularly important from the perspective of the contemporary approach to sustainable development. Thanks to factor analysis, it was also possible to indicate leaders in each area and it showed that, in 2006, there was no country that managed to reach high levels in all three key factors. However, only the comparison of the results with the conclusions drawn from literature studies can explain the reasons for the obtained values. The authors present the examples from this case in the discussion section.
The differences in the level of inclusive growth in all CEE countries existed in 2016. In this case, an improvement of the general situation in most of the countries was observed even though it has not always occurred in each of the key factors. It should be emphasized that, in 2016, inclusive growth variables were grouped into slightly different factors: “Education expenditures, unsatisfactory medical services, and state transparency,” “Social inclusion,” and the “Labor market situation.” Additionally, the differences in both of the analyzed years and among all countries could be explained by three principal groups of determinants: factors related to each country individually, benefits of belonging to the EU, and resilience to the global economic crisis initiated in 2007.
An attempt to find a pattern to the convergence (or divergence) in experiences of CEE countries in the analyzed period would be an area recommended for further research. Undoubtedly, the removal of barriers in the movement of goods, capital, and people (as a result of the accession to the European Union) boosted the pace of development of the new EU member states from CEE. At the same time, the EU subsidy programs created opportunities to modernize the countries’ economic infrastructure. The results of the comparative study between two years of the analysis (based on the literature review) have not offered a clear answer to this question. The authors’ considerations allow us to observe the convergence of the economies of CEE countries to the European Union even though the speed of this process varies. Statistical analyses demonstrate that, [49] considering the rate of changes in GDP growth per capita in CEE, in the period from 2003 until the outbreak of the economic crisis, Romania recorded the highest level of convergence and, in 2010, the highest rate of catching up with the “old” European Union was reported in Lithuania and Latvia (also in 2016). During the same period, one of the greatest progress examples in the mobilization of the EU structural funds from 2014 to 2016 (2014–2020 framework) was reported in Bulgaria. Particularly large delays in the absorption of funds from this framework are being recorded in Romania. This might constitute one of the justifications for the differences between Bulgaria and Romania in 2006 and 2016, which the authors observed in this study. At the same time, it can be noticed that, in all countries (except Latvia, where the variation in the regional income was particularly high), a regional divergence process exists [50].
It is also possible to discern certain relations in the area of convergence or divergence in the comparative analysis among CEE countries. For example, Lithuania and Latvia reveal similar results in terms of inclusive growth in both years (2006 and 2016). This may be explained by comparable reasons for the countries’ rising prosperity. This means above-average economic results arising from the construction of solid economic foundations. On the other hand, these are the countries (within the CEE region), which suffered the deepest recession. When comparing changes in the level of sustainability development reached in 2016, it can be noted that Latvia records better values of the indicators based on which analysis was prepared. One of the reasons for such a state may be the amount of funds received by Latvia from the EU. It is also important to emphasize the significant contribution from the non-governmental sector and public for the implementation of Sustainable Development Goals in Latvia. Contrarily, in 2016, exposure to poverty risk or social exclusion affected 30% of the Lithuanian population, which is similar to other relatively high indicators illustrating the level of poverty. Other cases are the Czech Republic and Slovakia. These countries were at a similar level in 2006 regarding each of the factors identified by the authors and they diverged by 2016. The reason for the predominance of the Czech Republic shaped in 2016 may be the focus on manufacturing and exports supported by increasing labor productivity and having its own currency instead of the euro. In these countries, similar directions of changes can be noticed both in terms of inclusive growth and sustainable development.
Author Contributions
This article is the result of the joint work by both authors. E.C. and E.R.-S. conceived, designed, and carried out the methods selection, analyzed the data, prepared the data visualization, and wrote the paper. Both authors discussed and agreed to submit the manuscript.
Funding
The research for this paper has been conducted in the framework of projects no. KES/BMN18/01/18 and S/WZ/4//2015 financed from the funds of the Ministry of Science and Higher Education of Poland.
Conflicts of Interest
The authors declare no conflict of interest.
References
- Passaris, C.E. The Business of Globalization and the Globalization of Business. J. Comp. Int. Manag. 2006, 9, 3–18. [Google Scholar]
- Diamond, P. How Globalization Is Changing Patterns of Marginalization and Inclusion in the UK; Joseph Rowntree Foundation: York, UK, 2010; Available online: https://www.jrf.org.uk/sites/default/files/jrf/migrated/files/globalisation-marginalisation-inclusion-full.pdf (accessed on 4 July 2018).
- Aşici, A.A. Economic Growth and its Impact on Environment: A Panel Data Analysis. Ecol. Indic. 2013, 24, 324–333. [Google Scholar] [CrossRef]
- Panayotou, T. Economic Growth and the Environment. Econ. Surv. Eur. 2003, 2, 45–72. Available online: https://pdfs.semanticscholar.org/4d7a/fb0f3ed4b3770a68c04dc412086af4b45e97.pdf (accessed on 13 May 2018).
- United Nations General Assembly. Resolution adopted by the General Assembly on 25 September 2015: Transforming Our World: The 2030 Agenda for Sustainable Development. A/RES/70/1. 2015. Available online: http://www.un.org/en/development/desa/population/migration/generalassembly/docs/globalcompact/A_RES_70_1_E.pdf (accessed on 20 May 2018).
- Hedlund-de Witt, A. Rethinking Sustainable Development: Considering How Different Worldviews Envision “Development” and “Quality of Life”. Sustainability 2014, 6, 8310–8328. [Google Scholar] [CrossRef]
- Brundtland Commission. Our Common Future; World Commission on Environment and Development; Oxford University Press: Oxford, UK, 1987; pp. 41–43. Available online: http://www.un-documents.net/our-common-future.pdf (accessed on 10 August 2018).
- Kahn, M.A. Sustainable development: The key concepts, issues and implications. Sustain. Dev. 1995, 3, 63–69. [Google Scholar] [CrossRef]
- Romeiro, A.R. Sustainable development: An ecological economics perspective. Estud. Avançados 2012, 26, 65–92. [Google Scholar] [CrossRef]
- Adams, W.M. The Future of Sustainability: Re-thinking Environment and Development in the Twenty-first Century. In Proceedings of the IUCN Renowned Thinkers Meeting, Bonn, Germany, 29–31 January 2006; Available online: http://cmsdata.iucn.org/downloads/iucn_future_of_sustanability.pdf (accessed on 12 August 2018).
- Sun, C.; Liu, L.; Tang, Y. Measuring the Inclusive Growth of China’s Coastal Regions. Sustainability 2018, 10, 2863. [Google Scholar] [CrossRef]
- Ali, I.; Zhuang, J. Inclusive Growth toward a Prosperous Asia: Policy Implications; ERD Working Paper, No. 97; Asian Development Bank: Manila, Philippines, 2007; Available online: http://gsdrc.org/document-library/inclusive-growth-toward-a-prosperous-asia-policy-implications/ (accessed on 12 August 2018).
- Rauniyar, G.; Kanbur, R. Inclusive growth and inclusive development: A review and synthesis of Asian Development Bank literature. J. Asia Pac. Econ. 2010, 15, 455–469. [Google Scholar] [CrossRef]
- Doyle, M.W.; Stiglitz, J.E. Eliminating Extreme Inequality: A Sustainable Development Goal, 2015–2030. Ethics Int. Aff. 2014, 28, 5–13. [Google Scholar] [CrossRef]
- Cabeza-García, L.; Del Brio, E.B.; Oscanoa-Victorio, M.L. Gender factors and inclusive economic growth: The silent revolution. Sustainability 2018, 10, 121. [Google Scholar] [CrossRef]
- George, G.; McGahan, A.M.; Prabhu, J. Innovation for inclusive growth: Towards a theoretical framework and a research agenda. J. Manag. Stud. 2012, 49, 661–683. [Google Scholar] [CrossRef]
- Ianchovichina, E.; Lundstrom, S. Inclusive Growth Analytics: Framework and Application. The World Bank, 2009. Available online: https://elibrary.worldbank.org/doi/abs/10.1596/1813-9450-4851 (accessed on 10 August 2018).
- McKinley, T. Inclusive Growth Criteria and Indicators: An Inclusive Growth Index for Diagnosis of Country Progress. Available online: https://www.adb.org/sites/default/files/publication/28493/adb-wp14-inclusive-growth-criteria.pdf (accessed on 10 August 2018).
- Radulescu, M.; Fedajev, A.; Sinisi, C.I.; Popescu, C.; Iacob, S.E. Europe 2020 Implementation as driver of economic performance and competitiveness. Panel analysis of CEE countries. Sustainability 2018, 10, 566. [Google Scholar] [CrossRef]
- Grela, M.; Majchrowska, A.; Michałek, T.; Mućk, J.; Stążka-Gawrysiak, A.; Tchorek, G.; Wagner, M. Is Central and Eastern Europe converging towards the EU-15? NBP Working Paper No. 264; Economic Research Department: Warsaw, Poland, 2017. [Google Scholar]
- Paprotny, D. Measuring Central and Eastern Europe’s Socio-Economic Development Using Time Lags. Soc. Indic. Res. 2016, 127, 939–957. [Google Scholar] [CrossRef] [PubMed]
- European Commission. EUROPE 2020: A Strategy for Smart, Sustainable and Inclusive Growth; European Commission: City of Brussels, Brussels, 2010; Available online: https://eur-lex.europa.eu/legal-content/EN/TXT/PDF/?uri=CELEX:52010DC2020&from=EN (accessed on 15 August 2018).
- OECD. Opportunities for All: A Framework for Policy Action on Inclusive Growth; OECD Publishing: Paris, France, 2018; pp. 20–24. Available online: https://read.oecd-ilibrary.org/economics/opportunities-for-all_9789264301665-en#page12 (accessed on 15 August 2018).
- Samans, R.; Blanke, J.; Corrigan, G.; Drzeniek, M. The Inclusive Growth and Development Report 2015; World Economic Forum: Geneva, Switzerland, 2015; Available online: http://www3.weforum.org/docs/WEF_Forum_IncGrwth.pdf (accessed on 15 August 2018).
- Gudanowska, A.E. Modern research trends within technology management in the light of selected publications. Procedia Eng. 2017, 182, 250. [Google Scholar] [CrossRef]
- Siderska, J.; Jadaan, K.S. Cloud manufacturing: A service-oriented manufacturing paradigm. Eng. Manag. Prod. Serv. 2018, 10, 46–55. [Google Scholar] [CrossRef]
- The Inclusive Development Index 2018: Summary and Data Highlights. Available online: http://www3.weforum.org/docs/WEF_Forum_IncGrwth_2018.pdf (accessed on 18 August 2018).
- Myers, J.H.; Mullet, G.M. Managerial Applications of Multivariate Analysis in Marketing; American Marketing Association: Chicago, IL, USA, 2003. [Google Scholar]
- Balicki, A. Statystyczna Analiza Wielowymiarowa i jej Zastosowania Społeczno-Ekonomiczne; Wydawnictwo Uniwersytetu Gdańskiego: Gdańsk, Poland, 2009. [Google Scholar]
- Manly, B.F.J. Multivariate Statistical—A Primer, 3rd ed.; Chapman & Hall/CRC: New York, NY, USA, 2005. [Google Scholar]
- Nunnally, J.C. Psychometric Theory; McGraw-Hill: New York, NY, USA, 1978. [Google Scholar]
- Mathur, G.; Jugdev, K.; Shing Fung, T. Project management assets and project management performance outcomes: Exploratory factor analysis. Manag. Res. Rev. 2013, 36, 112–135. [Google Scholar] [CrossRef]
- Cronbach, L.J. Coefficient alpha and the internal structure of tests. Psychometrika 1951, 16, 297–334. [Google Scholar] [CrossRef]
- Rollnik-Sadowska, E. Labour markets in the central and eastern Europe–comparative analysis. In Proceedings of the 21th International Scientific Conference: Economics and Management 2016 (ICEM’2016), Brno, Czech Republic, 19–22 May 2016. [Google Scholar]
- Dębkowska, K. Wzrost gospodarczy regionów a ich innowacyjność. Ekonomia i Zarządzanie 2012, 4, 18–26. [Google Scholar]
- Hanousek, J.; Kochanova, A. Bribery Environment and Firm Performance: Evidence from Central and Eastern European Countries. Eur. J. Political Econ. 2016, 43, 14–28. Available online: https://www.hhs.se/contentassets/7d17990209d94ae991036a603353014c/anna-kochanova.pdf (accessed on 22 August 2018). [CrossRef]
- Demirguc-Kunt, A.; Klapper, L. Measuring Financial Inclusion: The Global Findex Database; Policy Research Working Paper No 6025; Policy Research: Washington, DC, USA, 2012; Available online: https://openknowledge.worldbank.org/bitstream/handle/10986/6042/WPS6025.pdf?sequence=1&isAllowed=y (accessed on 30 August 2018).
- Demirguc-Kunt, A.; Klapper, L.; Singer, D.; Ansar, S.; Hess, J. Global Findex Database 2017: Measuring Financial Inclusion and the Fintech Revolution; World Bank: Washington, DC, USA, 2018; Available online: https://globalfindex.worldbank.org/sites/globalfindex/files/201804/2017%20Findex%20full%20report_0.pdf (accessed on 30 August 2018).
- Flamm, L. The crisis and Eurosceptism in central and Eastern Europe. L’Europe en Form. 2012, 2, 305–321. [Google Scholar] [CrossRef]
- De Rosa, D.; Kim, Y.S.; Chatzinikolaou, A.; Bulman, D.J.; Hopkins, J.; Dospinescu, A.S.; Karver, J.G.; Meisner, C.M.; Murisic, M.; Pauna, C.; et al. From Uneven Growth to Inclusive Development: Romania’s Path to Shared Prosperity; World Bank Publications: Washington, DC, USA, 2018; Available online: https://openknowledge.worldbank.org/bitstream/handle/10986/29864/9781464813177.pdf?sequence=2&isAllowed=y (accessed on 22 August 2018).
- Fleaca, E.; Fleaca, B.; Maiduc, S. Aligning Strategy with Sustainable Development Goals (SDGs): Process scoping diagram for entrepreneurial higher education institutions (HEIs). Sustainability 2018, 10, 1032. [Google Scholar] [CrossRef]
- Gawthorpe, S. Unstable Membership: Bulgaria, Corruption, and Policy of the European Union. New Voices Pub. Pol. Spring 2010, 4, 2. [Google Scholar] [CrossRef]
- Guijarro, F.; Poyatos, J.A. Designing a sustainable development goal index through a goal programming model: The Case of EU-28 Countries. Sustainability 2018, 10, 3167. [Google Scholar] [CrossRef]
- Lior, N.; Radovanović, M.; Filipović, S. Comparing sustainable development measurement based on different priorities: Sustainable development goals, economics, and human well-being-Southeast Europe case. Sustain. Sci. 2018, 13, 973–1000. [Google Scholar] [CrossRef]
- Mikhaylov, A.S.; Mikhaylova, A.A. National cohesion policies and the influence of interregional divergence gap on innovation sustainability. J. Adv. Res. Law Econ. 2017, 8, 1854–1860. [Google Scholar] [CrossRef]
- OECD. OECD Economic Surveys: Estonia. Overview. Available online: https://www.oecd.org/economy/surveys/Estonia-2017-OECD-economic-survey-overview.pdf (accessed on 22 August 2018).
- OECD. OECD Economic Surveys: Slovenia. Overview. Available online: http://www.oecd.org/eco/surveys/Slovenia-2017-OECD-economic-survey-overview.pdf (accessed on 22 August 2018).
- Rozmahel, P.; Kouba, L.; Grochová, L.; Najman, N. Integration of central and Eastern European Countries: Increasing EU Heterogeneity? Available online: fileadmin/documents/pdf/Workingpapers/WWWforEurope_WPS_no009_MS77.pdf (accessed on 22 August 2018).
- Gatnar, E. Statystyczna analiza konwergencji krajów Europy Środkowej i Wschodniej po 10 latach członkostwa w Unii Europejskiej. Res. Pap. Wrocław Uniwersity Econ. 2015, 384, 93–99. [Google Scholar] [CrossRef]
- Smętkowski, M. Konwergencja gospodarcza i formy dyfuzji rozwoju w krajach Europy Środkowo-Wschodniej. Roczniki Ekonomiczne Kujawsko-Pomorskiej Szkoły Wyższej w Bydgoszczy 2015, 8, 324–338. [Google Scholar]
© 2018 by the authors. Licensee MDPI, Basel, Switzerland. This article is an open access article distributed under the terms and conditions of the Creative Commons Attribution (CC BY) license (http://creativecommons.org/licenses/by/4.0/).