An Investigation of the Effects of Infographics and Green Messages on the Environmental Attitudes of Taiwanese Online Shoppers

1
Graduate School of Design, National Yunlin University of Science and Technology, Douliu City 640, Taiwan
2
Department of Commercial Design, Chienkuo Technology University, Changhua City 500, Taiwan
*
Author to whom correspondence should be addressed.
Sustainability 2018, 10(11), 3993; https://doi.org/10.3390/su10113993
Submission received: 7 September 2018
/
Revised: 20 October 2018
/
Accepted: 30 October 2018
/
Published: 1 November 2018
(This article belongs to the Special Issue Selected Papers from 2nd Eurasian Conference on Educational Innovation 2019)
Abstract
:The rapid growth of e-commerce in Taiwan has increased the use of postal packaging; this contributes to the destruction of our environment, because it cannot be re-used, and may contain toxic substances. To address this understudied issue, we examined the effects of attaching green messages about environmental attitudes in the form of infographics on postal packaging. To improve our understanding of consumer preferences with respect to green messages, first, a questionnaire survey of online shoppers was conducted. Based on a statistical analysis of the results, it was found that green messages require excellent infographics in order to deliver environmental knowledge. Graphical information was considered superior to text-only information in the presentation of green messages and the visualization of green information by online shoppers. This result indicates that infographics have emerged as a better visual approach to deliver green messages. We hope that these findings will serve as a reference in the design of environmentally-friendly postal packaging.
1. Introduction
In recent years, the online shopping market in Taiwan has grown tremendously because of the rise of internet-based business models, which are in turn driven by the rapid advancement of internet technologies. The Market Intelligence and Consulting Institute (MIC) has conducted large-scale surveys on the online purchasing behaviors of Taiwanese consumers, and it was found that the average consumer expenditure on online purchases was NT$27,715 in 2016, which represents a growth of 12% from 2015 [1]. The 2017 survey indicated that 45% of all Taiwanese residents had used online shopping services, and the population of online shoppers in the 26 to 30-year-old age group had increased by 14% over the previous year [2]. Based on statistical data provided by the Ministry of Finance in 2016, the value of e-commerce had grown from NT$110.3 billion in 2011 to NT$146.7 billion in 2015, which represents an annual growth of 7.5%. The consumption of postal packaging and rapid postal services in Taiwan is thus growing at a breakneck pace every year because of the rise of online shopping, but this growth has also led to an increase in new environmental issues, e.g., the CO2 emissions of logistics services and unrecycled packaging materials. Although global consensus has been achieved on the importance of the environment, the environmental problems caused by online shopping packaging materials have been largely overlooked. According to the 2016 World Economic Forum (WEF) report on the plastics economy, 95% of the plastic packaging materials being used around the world are disposed of after a single use, and 30% of these materials flow into the ocean; this results in a minimum of eight million tons of plastic entering the ocean every year, or a rubbish truck full of plastic every minute. There is now so much of it that an area cumulatively the size of France has formed in the Pacific Ocean off the coast of Hawaii. Very few are paying attention to this catastrophe [3]. Based on a report of the Consumer Protection Committee, it was found that the recycling labels of 23 out of 48 detergent packages were not compliant with regulations, and the mislabeling of recycling labels by manufacturers was 67.65% [4]. One then wonders whether improper waste disposal could be caused by the erroneous interpretation of green messages. Green business experts from the United States (U.S.) have also shown that the green messages designed by some companies are not entirely correct [5]. More than 75% of the Standard & Poor’s 500 companies regularly disclose information about their environmental policies and performance on their websites, and approximately 98% of products with environmental claims mislead consumers by committing one of the seven sins of greenwashing, including sin of false labels [6]. Consumers have limited knowledge about packaging sustainability; thus, companies can use inaccurate labels and ambiguous green messages to confuse consumers. [7]. Understanding green messages are important, as consumers’ correct recycling knowledge is key in decreasing the actual environmental burden of packaging. Therefore, companies should have the corporate social responsibility of educating consumers about how to recycle packaging waste; infographics on the packaging are an excellent way to present recycling knowledge and steps. In addition, the green messages designed by companies for the packaging of their products bear some responsibility for the damage wrought on the environment. Therefore, the formulation of government regulations alone is insufficient to solve the packaging disposal problem, as it is necessary for manufacturers, designers, and consumers alike to play an active role in protecting the environment. How might design improve the impact of green messages on environmental attitudes? Card, Mackinlay, and Shneiderman [8] stated that infographics design is the conversion of information into easy-to-understand graphical information, which is presented in an interactive and visual manner that facilitates comprehension.
When a company launches a new type of product packaging and uses green messages to inform users that the packaging is environmentally friendly, there is no way to know whether the message was conveyed successfully. To this end, we constructed a questionnaire based on a review of the literature on infographics design in order to survey the impact of green messages on the environmental attitudes of online shoppers. This study investigates the factors that determine the impact of infographics and green messages on postal packaging users, so as to guide the design of postal packaging in the future and minimize further increases in waste. The primary aims of this study are as follows:
- To investigate the influence of green messages and infographics on environmental attitudes, and provide a reference for green messages using infographic design on postal packaging.
- To examine the factors that affect the influence of green messages and infographics on online shoppers, and examine any effect among these three factors.
- To investigate consumers’ infographic design preferences and provide guidance on the use of infographics in the design of environmentally-friendly postal packaging.
Research Scope
Since the concept of infographics with green messages on postal packaging design is not common in Taiwan, postal packaging sold by logistics companies in Taiwan do not always contain green messages. Green messages are defined as text or graphics placed by companies on the packaging or exterior surfaces of their products to communicate the level of compliance of a product with green product standards [9,10]. For example, postal office packaging is usually made from green materials in Taiwan, but it is not labeled with an environmental message. In contrast, postal packages from the eBay company are labeled with environmental protection-related green messages. In the design of our questionnaire, we chose to use eBay postal packaging as an example of green message intervention (see Figure 1) and show a postal packaging without a green message (see Figure 2), in order to allow the respondents to view the difference between including the green message or not, and thus investigate the effects of green messages on environmental attitudes with respect to postal packaging.
Daily consumables, computer accessories, and group buying food are the most frequently purchased products on the internet, according to a 2017 survey about the type of goods being bought online [11]. Since goods of this type cannot be packaged using cylindrical packaging or envelopes, postal packages were defined as rectangle-like packages in this study. These packages were used as a sample for determining the impacts of green message intervention.
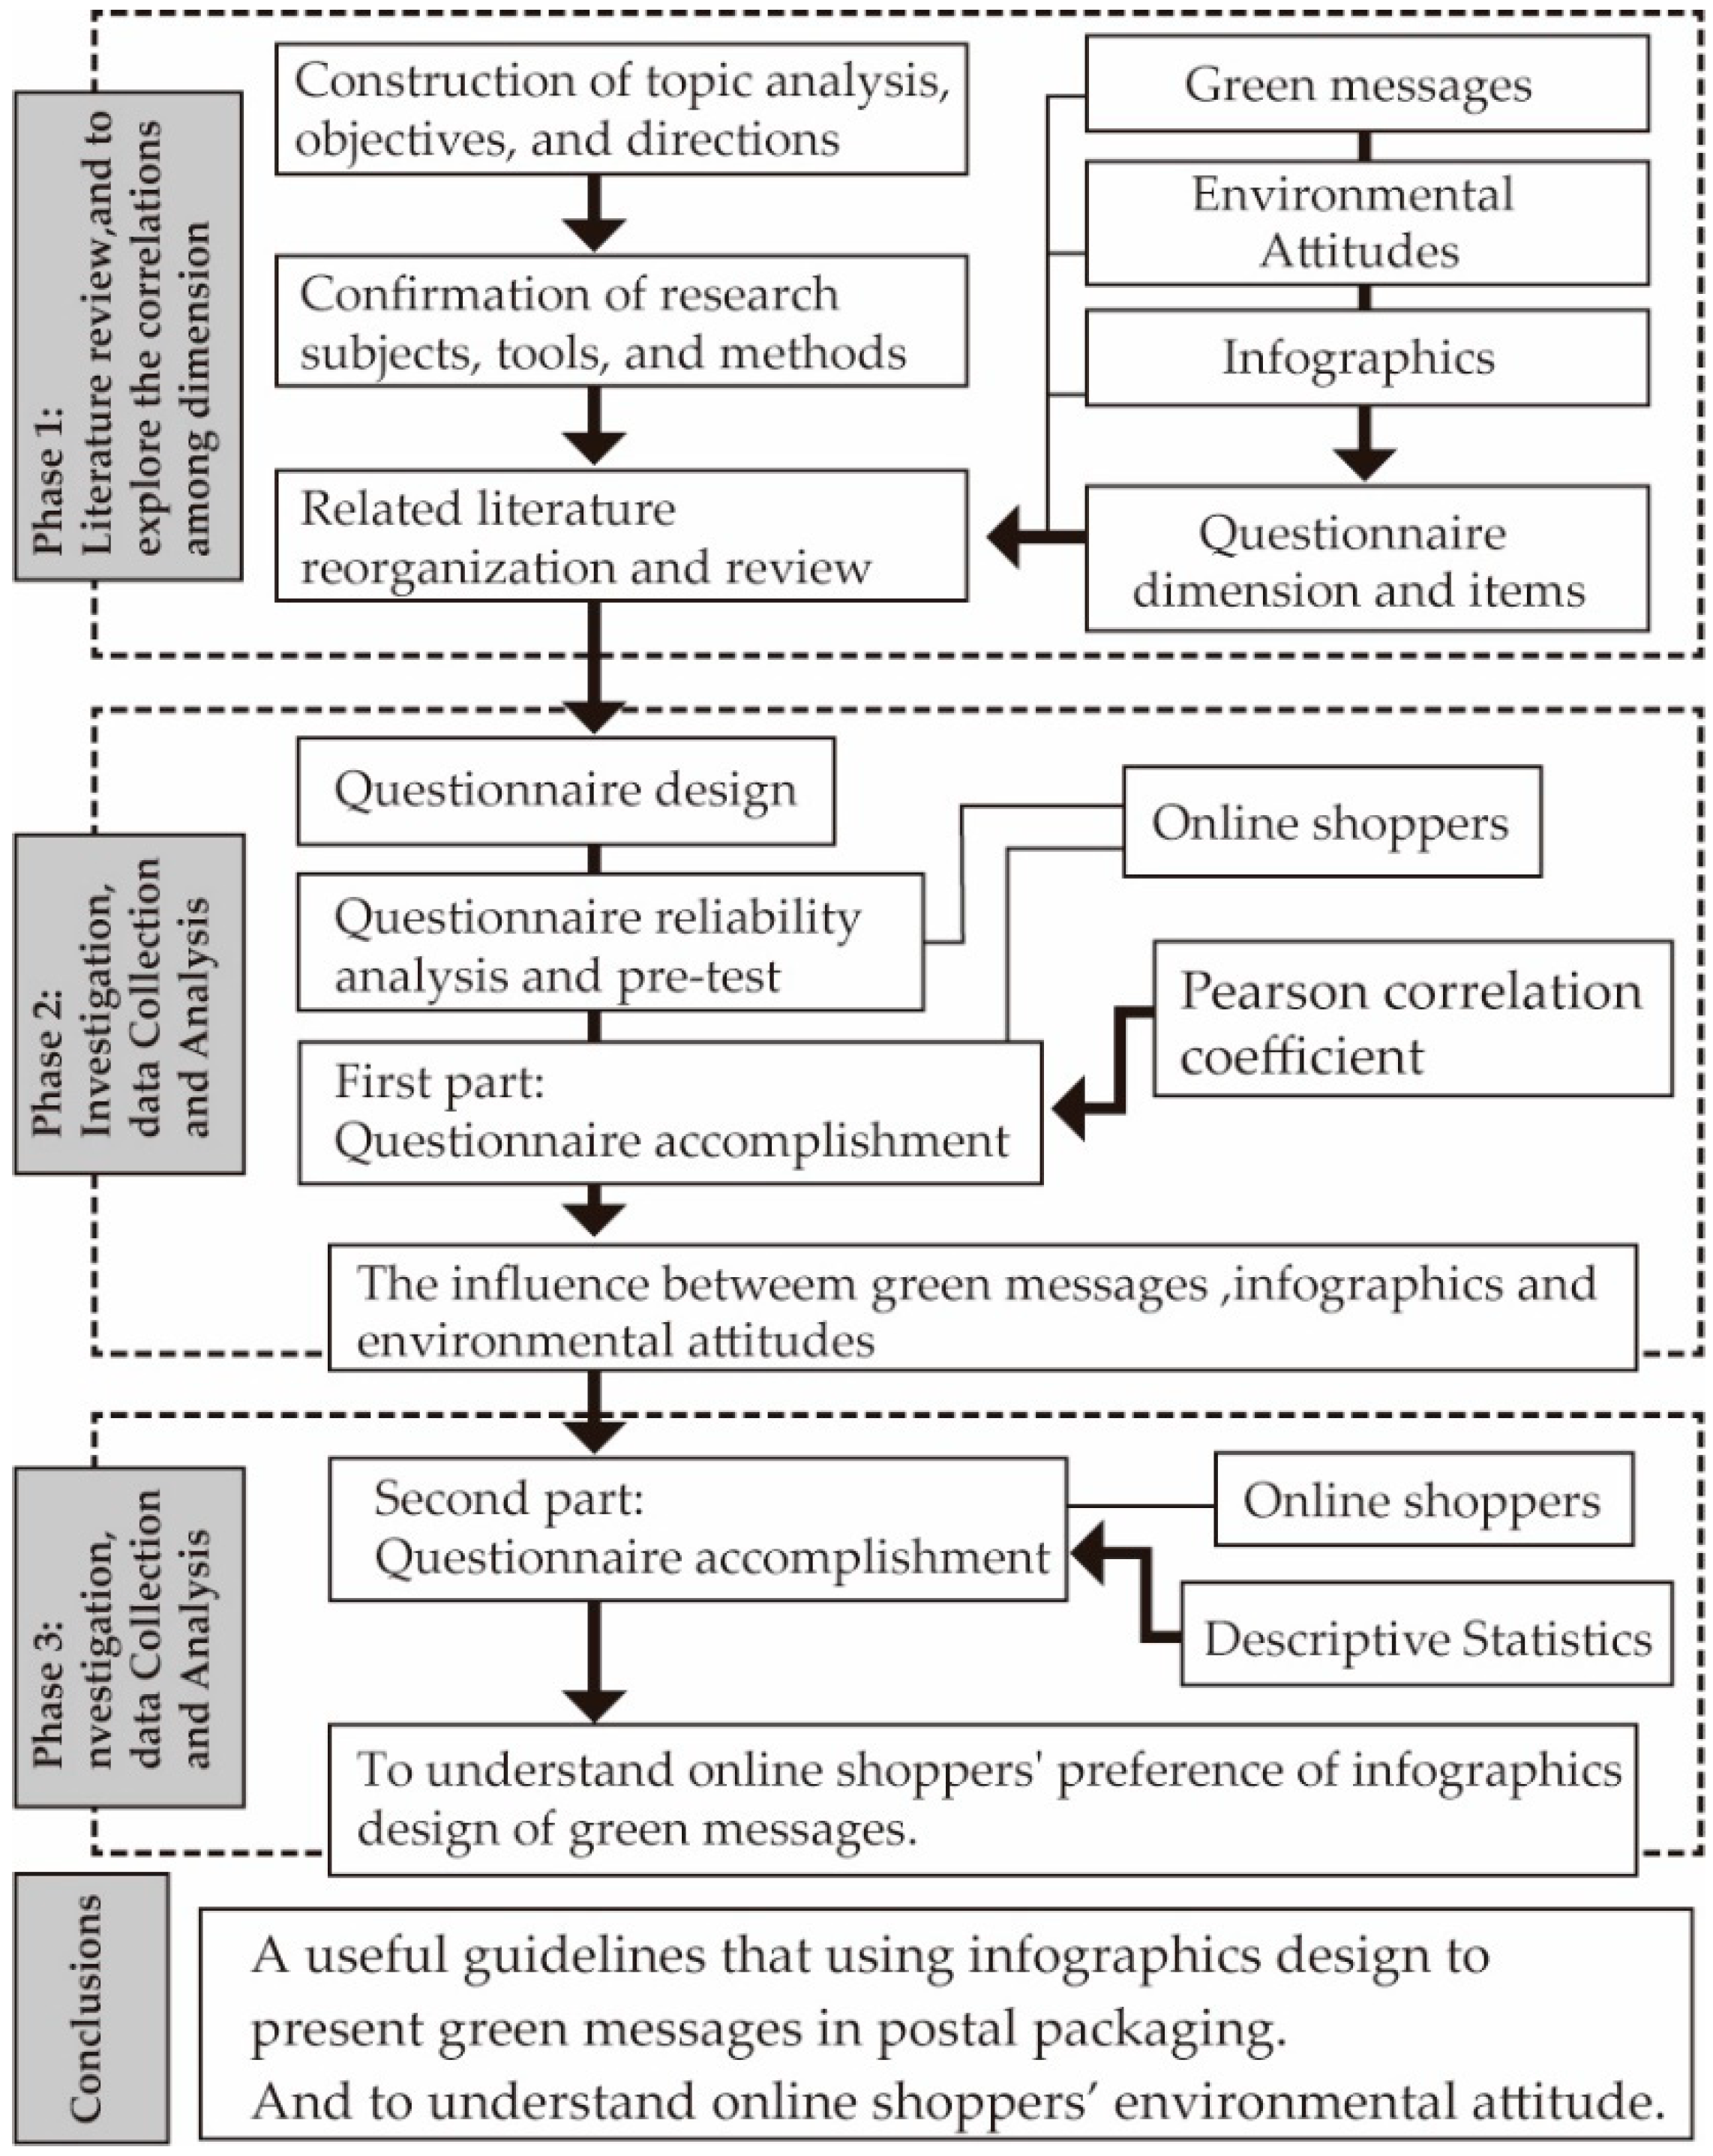
The study summarized some useful guidelines regarding using infographic design to present green messages in postal packaging, as well as understand online shoppers’ environmental attitudes. Figure 3 depicts the research structure.
2. Materials
2.1. Literature on Green Messages and Environmental Attitudes
The concept of green design was first proposed by American design theorist Victor Papanek. In his book, Design for the Real World, he strongly emphasized that design should first and foremost act in the service of the Earth’s environment [12]. Cheng [13] stated that green design is a holistic approach to design, in which it is necessary to account for the environmental impacts of every part of a product’s life cycle (product design, material selection, product structure, function, manufacturing processes, packaging, logistics, product usage, and product disposal). Hence, green design is an approach to design based on pro-environmental perceptions, emotions, and behaviors [14]. Environmental consciousness refers to an awareness of environmental issues and the propensity of individuals to engage in pro-environmental behaviors or, in other words, human values and attitudes concerning the environment [15]. It encompasses psychological factors, moral norms, and the self-efficacy of environmental behaviors, which form the individual’s worldview of environmental matters in the affective dimension [16]. Environmental attitude refers to the individual’s support for pro-environmental investments, and is the psychological manifestation of the individual’s feelings about certain environmental issues. It includes the individual’s beliefs, values, sense of responsibility, approval, preferences, opinions, and inclinations toward the environment [17,18,19,20,21]. Festinger [22] proposed that attitude consists of cognitive, affective, and conative components. According to Eagles and Blackwell [23], attitude refers to perpetual conceptions of value, emotional experiences, and behavioral inclinations toward certain matters or concepts, which may be values or experiences. Based on the aforementioned descriptions of fundamental concepts such as environmental attitude, green design, and cognition, it may be inferred that green messages are interpreted by the general populace in the context of environmental attitudes. The objective of green messages is to convey environmental messages through some form of media, so as to alter the environmental attitudes of their target subjects or act as reminders. In addition, the concept of sustainability seems to be increasingly important to consumers. Biswas [24] concluded that the most important functions of green messages are to increase the willingness of consumers to purchase green products, increase the environmental awareness of society as a whole, and propagate pro-environmental attitudes among the general populace. Therefore, green messages and green products could be a form of visualized communication that have the goal of conveying environment-related and sustainability-related messages (e.g., environmental awareness and environmental friendliness), so as to effect positive changes in the environmental attitudes of their viewers, in terms of perceptions, emotions, and external behavioral manifestations [25]. Environmental attitude has been identified as one of the primary and most important antecedent variables determining the subsequent purchase intentions and behavioral actions of green consumers [26,27,28]. The questionnaire items are mainly based on the literature references, as shown in Table 1.
2.2. Literature on Infographics
Infographics is an approach to content presentation that combines text, graphics, and design with information visualization or graphing. Hiroyuki [32] defined infographics as simplified and easy-to-understand visual representations of complex subjects produced by re-organizing data, information, or knowledge. Smiciklas [33] defined infographics as visualizations of data and ideas that try to convey complex information to an audience in a manner that can be quickly consumed and easily understood. Infographics have become increasingly important over time, and their design has become a subject of research in recent years [34,35]. In studies related to the use of design to convey green messages in postal packaging, Card, Mackinlay, and Shneiderman [8] concluded that infographics-based presentations could strengthen a person’s mental models and thus facilitate understanding and comprehension.
Based on a statistical analysis of survey data, it was found that 36.2% of consumers would prefer the use of clear and legible labels in product packaging [10]; therefore, it is necessary to satisfy user expectations to effectively communicate a message. As infographics are a visualization of data and theoretical concepts, they are often easier to process and comprehend than purely text-based information [36]. When people are trying to make sense of the world, Gestalt psychology suggests that we do not simply focus on every small component. Wang [37] argued that communication is the ability to utilize information in appropriate contexts. The packaging waste problem can only be resolved if manufacturers, designers, and users actively play a role in protecting the environment in conjunction with government regulations and policies. Buljana et al. [38] found that infographics gave people better reading experience; to this end, our goal in this study was to examine how infographics could be used to nurture pro-environmental attitudes, using postal packaging as the vehicle. While there are a number of definitions of infographic design in the domestic and international literature, the infographics dimensions of our questionnaire were based on factors identified by committee members of the Society for News Design (SND) in 2009 [39], which are: (1) attractiveness, (2) clarity, (3) simplicity, (4) flow, and (5) wordlessness. To compensate for the excessive divergence of definitions in the literature, with respect to research scales, we defined text, graphics, colors, and composition as scale dimensions for infographics, based on the studies of Tsai [40] and Ni, Chang, Chiang, and Yang [41], who defined text, graphics, colors, and symbols as visual elements. In order to better understand how human perception works, Gestalt psychologists proposed a number of laws of perceptual organization, including the laws of similarity, proximity, continuity, and closure. In addition, we find our theoretical basis from the design principles. The questionnaire dimension and items are mainly based on the literature references, as shown in Table 2.
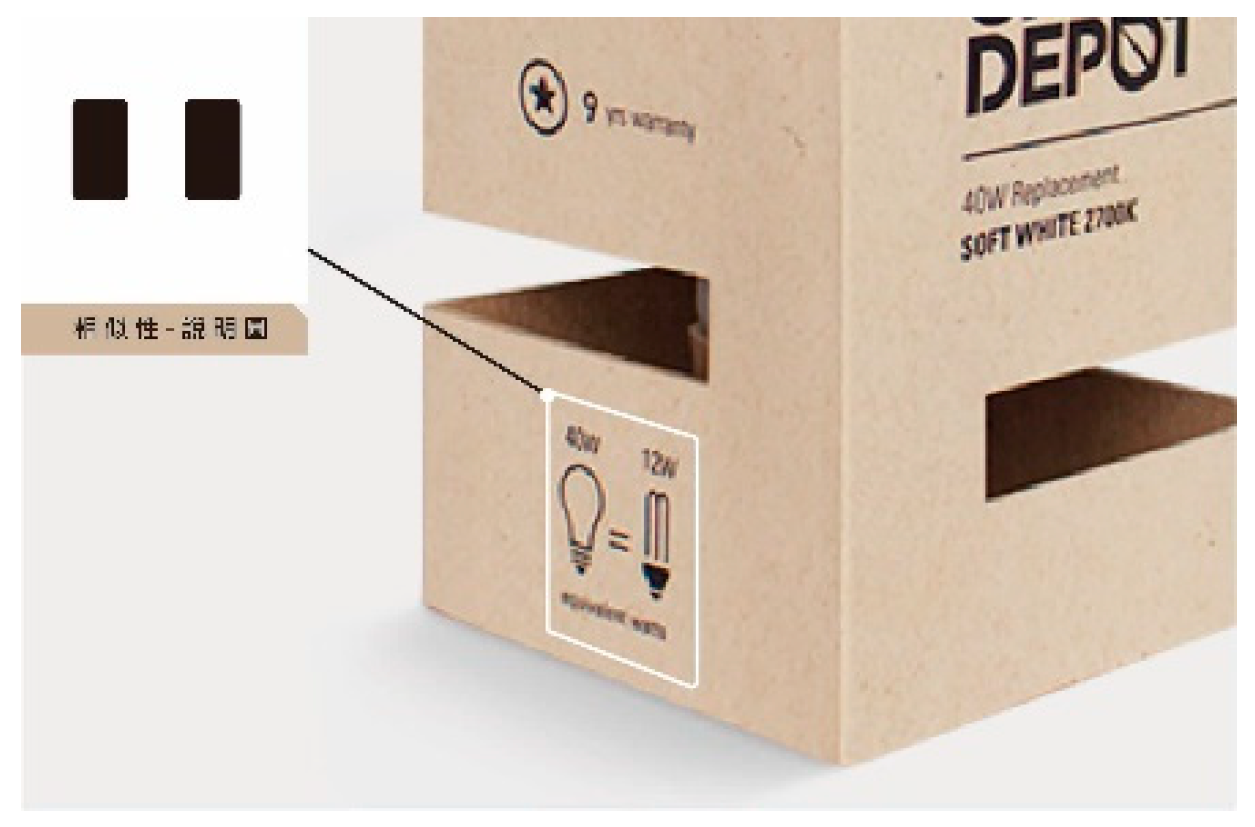
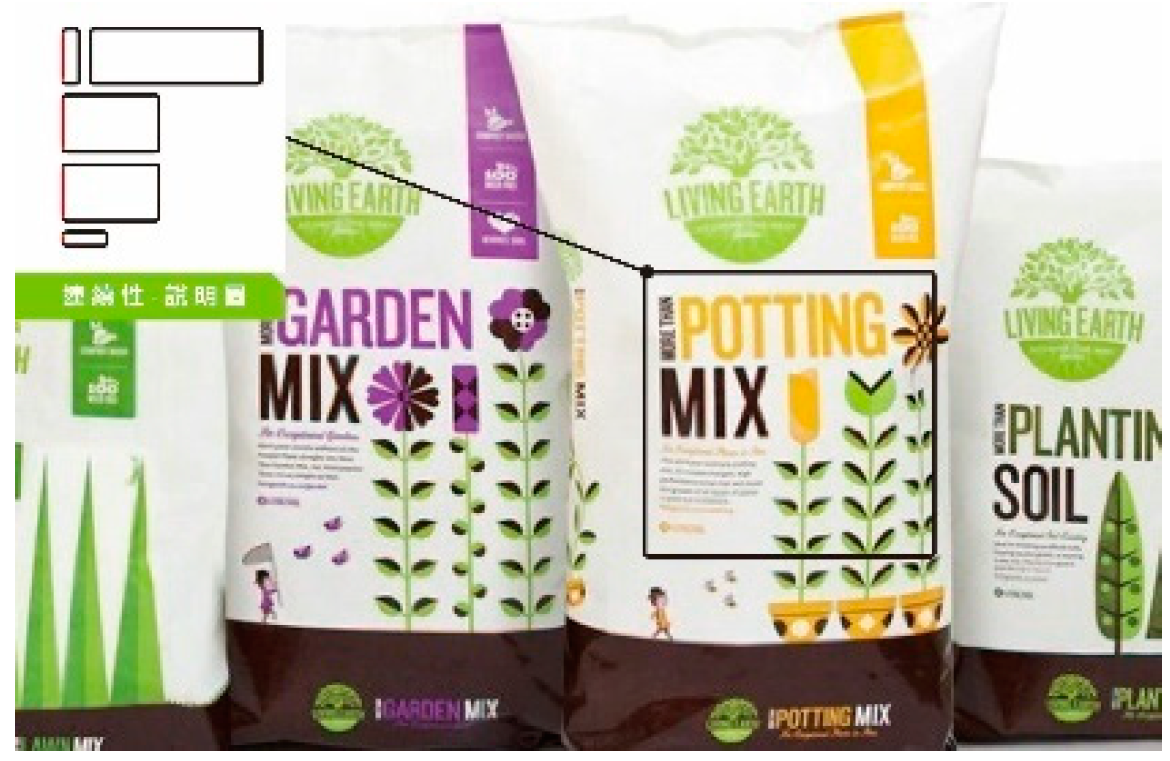
In addition, in order to let the respondents understand the Gestalt psychology items of the questionnaire, this study use the Figure 4, Figure 5 and Figure 6 to explain the laws of proximity, continuity, and closure.
Moreover, the above literature review will be used as a questionnaire design reference. The questionnaire consisted of four sections, the first of which was intended to elicit demographic information on respondents. The second section asked the respondents about their environmental attitudes. Section three focused on the cognition of green messages. Finally, respondents’ preferences for infographics were examined.
3. Methods
To analyze consumer preferences, the primary objectives of this study were to understand how the environmental attitudes of online shoppers are influenced by green messages and infographics, and obtain reference factors for the design of green postal packaging. Therefore, this study was divided into three stages:
Phase 1: Based on the relevant literature and theories, a scale questionnaire was constructed to assess environmental attitudes, green messages, and infographics. Infographics examples were also collected to help the research subjects understand each questionnaire item. The questionnaire employed a five-point Likert scale, and IBM SPSS Statistics version 22 was used to statistically analyze the experimental results. Factor analysis was conducted to examine the validity and reliability of each dimension of the questionnaire, and determine whether the scale was suitable for formal usage.
Furthermore, we have limited the respondents of this study to online shoppers who at least possess a college degree, because the sample that was shown to respondents was in English, as Figure 4, Figure 5 and Figure 6 indicate, and certain segments of the general populace may have lacked foreign language fluency. The questionnaire design items were designed in Chinese.
Phase 2: Through questionnaire design and analysis, we hypothesized some online shoppers’ environmental protection attitudes through hypothetical questions, as shown in Figure 7, and the Pearson’s correlation coefficient was used to investigate correlations in environmental attitude with green messages and infographics. Pearson’s correlation coefficient is the test statistic that measures the statistical relationship, or association, between two continuous variables. It is known as the best method of measuring the association between variables of interest, because it is based on the method of covariance. It gives information about the magnitude of the association, or correlation, as well as the direction of the relationship. Pearson’s correlation coefficient was calculated using Equation (1), and the resulting Pearson’s correlation coefficient table is shown in Table 3.
Phase 3: In this stage, the order of importance of each infographic dimension was obtained from the results of the questionnaires, and then used to extract guidelines for infographic design in postal packaging. In addition, descriptive statistics were used to examine online shoppers’ preference for the infographics design of green messages.
It is hoped that this study will present many recommendations for companies and designers.
4. Analyses and Results
Reliability analysis is required to ascertain whether the scale questionnaire that was constructed in the first stage of this study was suitable for subsequent analysis. A reliability test was performed using SPSS, and a Cronbach’s alpha greater than 0.7 was deemed to indicate a high level of reliability [44,45]. The Cronbach’s alpha of our questionnaire was 0.861, which indicates that the scale had a high level of reliability, and could be utilized in the next stage of the study. The detailed results of this test are shown in Table 4. Taiwan has a population of about 22,704,000 people, and we attempted to understand the preferences of shoppers in the north, central, and south of Taiwan. Therefore, the study uses quota sampling in non-probability sampling. Although this study was expected to issue 200 questionnaires, 255 questionnaires were handed out through the internet, and 221 effective questionnaires (and 34 ineffective questionnaires) were collected from north, central, and south of Taiwan, which amounted to a successful response rate of 86.6%.
4.1. Analysis of Results Related to the Effect of Green Messages and Infographics on Environmental Attitude
4.1.1. Factor Analysis of Infographics, Green Messages, and Environmental Attitude
The purpose of this study was to analyze the effect of infographics and green messages on the environmental attitudes of online shoppers; therefore, targeted correlation analyses were a necessity. The three dimensions of this study were validated via factor analysis, and correlations between the dimensional factors were examined in the rotated component matrix. Finally, the completeness of the questionnaire scale was ascertained. The factor analysis was performed using principal component analysis (PCA), followed by orthogonal varimax rotation, to extract the most important factors; the purpose of the rotation was to simplify the analysis by having a smaller number of factors represent a large number of variables, while retaining most of the information contained by the original variables. The adequacy of the factor analysis was determined by the Kaiser–Meyer–Olkin (KMO) test; the higher the KMO value, the better the sampling adequacy of the factor analysis. Values below 0.5 were deemed to be inadequate. The KMO value of our research scale was 0.835, while the significance of Bartlett’s sphericity test was 0.000. This result demonstrates that our questionnaire was of excellent quality and suitable for factor analysis. The KMO and Bartlett’s test results of each dimension are shown in Table 5.
After these tests, PCA was performed to extract common factors, and the rotated values of these factors were selected as the total variance. Components with a sum of eigenvalues greater than one were selected. The total variance explained was 57.958%, and the smallest component eigenvalue was 2.067, which is in line with the selection criterion. Three principal component factors were selected in the end, as shown in Table 6.
According to the significance criterion for factor loadings proposed by Hair, Tatham, Anderson, and Black [45], a factor loading of 0.4 is acceptable. There were no items in the dimensions of this study that failed to meet this cut-off, as shown in Table 7.
Based on Table 7, three factors were obtained from the rotated PCA. Dimension 1 contains nine items, dimension 2 contains three items, and dimension 3 also contains three items. The objective of the factor analysis was to validate the reliability of the scale. Based on the results of the dimension analysis, it was found that items 4 and 5 in environmental attitude did not belong to the environmental attitude dimension; therefore, these items were removed from this stage to ensure a high degree of reliability in our remaining analyses.
4.1.2. Analysis of Correlations between Infographics, Green Messages, and Environmental Attitude
The Pearson’s correlation coefficient was used to examine correlations between infographics, green messages, and environmental attitude, so as to ascertain whether the dimensions were significantly correlated. As the correlation coefficients are an indicator of relationships between variables, they were used to examine whether the “relationship between green messages and environmental attitude” and the “relationship between infographics and environmental attitude” were correlated. This was used to determine whether increases in the approval of infographics or green messages could affect environmental attitude. From this analysis, it was found that environmental attitude, green messages, and infographics were positively correlated, and the correlation was significant at the 0.01 level (two-tailed). As a whole, all three of these variables were significantly positively correlated and had a significant influence on each other. The analytical data is shown in Table 8.
In the following sections, the individual effects of “green messages” and “infographics” on “environmental attitude” are explained in detail.
4.1.3. The Impact of Green Messages on Environmental Attitude
The correlation coefficients indicate a positive correlation of 0.356 **, which implies that if the respondent is affected by the infographics and the green message, the environmental protection attitude will also increase. As the results of the analysis indicate a significance of <0.001, the correlation between these variables is highly significant. This may show that the respondents generally had environmental protection concepts. This result has indicated that consumers pay attention to the concept of environmental protection.
4.1.4. The Impact of Infographics on Environmental Attitude
The correlation coefficients indicate a positive correlation of 0.332 **. Hence, the environmental attitude of the respondents will increase in proportion with increases in the impact of the infographics; however, the correlation is slightly weaker than that of green messages. The correlation between infographics and environmental attitude is highly significant, as the analysis indicates a significance of <0.001. The causes that are deduced from this result are the same as those mentioned in Section 4.1.3.
4.1.5. The Simultaneous Effects of Infographics and Green Messages on Environmental Attitude
This section examines the combined effects of infographics and green messages on environmental attitude. It was found that infographics and green messages were both positively correlated with environmental attitude, and the correlation is significant at the 0.01 level (two-tailed). Therefore, environmental attitude is simultaneously affected by infographics and green messages. The detailed results of this analysis are shown in Table 9.
The correlation coefficients show a positive correlation of 0.392 **, which indicates that the environmental attitude of the respondents increases in proportion with the degree of impact of infographics and green messages. The correlation is significant at the <0.001 level. Two possible causes may be deduced from this result. (1) The respondents believe that infographics could increase environmental attitude. (2) Scales of this type could help companies understand people’s attitudes. Therefore, it is also necessary to perform a difference analysis to investigate whether the factors that influence this relationship are present.
4.2. Order of Importance of Infographics Factors for Online Shoppers Overall
Based on the importance of each infographic dimension for online shoppers, the “overall mean” was used to perform frequency distribution and cross tabulation analyses on the “clarity”, “simplicity”, “wordlessness”, and “flow” dimensions of infographics.
4.2.1. Order of Factors for “Clarity” of the Infographics
In this section, the factors of the “clarity” dimension were ordered by importance, according to the overall mean of online shoppers. The four most common responses for this dimension were taken, which were: “The meaning of the composition of the graphics and text is clear and concise”, “The graphical presentation makes it easy to understand”, “Graphics combined with colors make it easy to understand”, and “The graphical composition makes it easy to understand”, as shown in Table 10.
4.2.2. Order of Factors for “Simplicity” of the Infographics
The four most common responses for this dimension were selected, which were: “The presentation of the graphics and text makes it instantly comprehensible”, “The graphical presentation makes it instantly comprehensible”, “The graphical composition makes it easy to understand”, and “Graphics combined with colors make it instantly comprehensible”, as shown in Table 11.
4.2.3. Order of Factors for “Flow” of the Infographics
Gestalt psychologists proposed a number of laws of perceptual organization to understand how human perception works. In this section, we discover many principles that fit the Gestalt psychology, such as the ‘law of closure’, ‘law of proximity’, and ‘law of continuity’. Gestalt psychologists believe that the brain tends to perceive forms and figures in their complete appearance, despite the absence of one or more of their parts, which are either hidden or totally absent. This refers to the law of closure. Therefore, the completeness of the composition is an important basis for the reader to understand information. In addition, reading involves higher-level mental processes such as the discovery of rules and order, and the extraction of structured, meaningful information [46]. The six most common responses were selected, which were: “The composition of the graphics and text respects the psychology of reading”, “The composition of the text respects the psychology of reading”, “The composition of the graphics and text respects the ‘law of closure’”, “The graphical composition respects the psychology of reading”, “The composition of the graphics and text respects the ‘law of proximity’”, and “The composition of the graphics and text respects the ‘law of continuity’”, as shown in Table 12.
4.2.4. Order of Factors for “Wordlessness” of the Infographics
The two most common answers were selected, which were “the proportion of information presented on the packaging: text-only information ≤ graphical information”, and “the proportion of information presented on the packaging: only graphical information”, as shown in Table 13.
5. Conclusions, Future Research, and Research Limitations
The purpose of this study was to investigate the effects of infographics and green messages on the environmental attitudes of online shoppers, and the aims of this study have been successfully achieved. An explanation of our results is provided below.
5.1. Explanation in Three Parts
5.1.1. A Survey Response Scale Was Constructed, According to a Review of the Relevant Literature
“Infographics”, “environmental attitude”, and “green messages” are the three academic pillars of this study. The survey scale, indicator dimensions, and assessment items of each dimension were obtained by reviewing the literature. These questionnaire items will provide a reference for the design of green message infographics on postal packaging.
5.1.2. The Correlation of “Infographics” and “Green Messages” with “Environmental Attitude” of Online Shoppers Was Examined
This study provides insights into the use of infographics for understanding green messages. It found that the environmental attitude of a respondent increases in proportion with the impact of “green messages” and “infographics“. This correlation analysis indicates that a good infographics design for green messages would improve the communication of environmental concepts. Companies and designers should learn how to use infographics to present green messages.
5.1.3. The Effects of Green Messages on Online Shoppers Were Investigated
One of the unexpected and interesting results of this study is that ordinary green messages do not have a significant impact on online shoppers. This may be because environmental awareness is a globally accepted norm. If green messages continue to be presented using conventional design, it will be challenging to improve consumer understanding of the proper methods for the recycling or disposal of postal packages, which will subsequently lead to the generation of additional waste. This finding proved that knowledge of infographics and the ability to design them are essential for corporations and design education.
5.2. The Order of Importance of the Factors for Infographics-Based Green Message Presentations
There are many items in the infographics questionnaire; therefore, we analyzed the data to acquire the reference points of each dimension. The presentation of green messages in the form of infographics was investigated in the context of online shoppers. The order of importance of the factors for this form of green message presentation is shown in Table 14.
In this table, the first-ranked factor indicates that online shoppers have a significantly higher level of acceptance of graphical information than purely text-based information. The fourth-ranked factor also emphasizes that graphical presentation is the best way to facilitate the understanding of green messages by online shoppers. These two findings prove that graphical presentation is stronger than text-only presentation. These two findings proved that the infographics to use graphical composition are stronger than text-only composition. Therefore, infographic will be the best way to deliver messages.
The second-ranked factor is, “The meaning of the composition of the graphics and text is clear and concise”, which indicates that the graphics and text must be matched carefully to convey a clear-cut meaning. The third-ranked factor is, “The presentation of the graphics and text makes it instantly comprehensible”; one may deduce that in this busy society, consumers would prefer green messages to be instantly comprehensible. The fifth-ranked factor is, “Graphics combined with colors make it easy to understand”, showing that the use of color is conducive to the conveyance of green messages. Hence, color planning is an important step in visual graphics design. The sixth-ranked factor is, “The composition of the graphics and text respects the ‘psychology of reading’”; based on the psychology of visual perception, humans have directional preferences when reading text, and it is important to consider this factor in the design of infographics. Overall, the respondents prefer graphical information over purely text-based information in the design of green message visual graphics. Therefore, the visualization of green messages should help improve online shoppers’ acceptance of environmental information. It is hoped that the findings of this study will act as useful guidelines for designers of green postal packaging producing infographics-based visual presentations. Furthermore, the findings could also be used by companies in the visual presentation of environmental messages.
These findings referenced many psychology-related research themes, such as Gestalt psychology and psychology reading. Reading is a highly complex skill that is a prerequisite to success in many societies in which a great deal of information is communicated in written form. Since the 1970s, much has been learned about the reading process from research by cognitive psychologists [47]. This study validates the importance of visual psychology, and designers must consider it as a design consideration when considering green message infographics design.
5.3. Research Limitations
Several limitations of the current study and avenues for future research can be identified. First, some limitations of the study design should be noted. The stimuli consisted of images of uncommon foreign postal packaging options, which may have affected the results of the tests.
Second, we chose the factors from among those provided by committee members of the SND, in order to examine how infographics could be used in postal packaging. A successful infographics composition means that one has arranged, distributed, aligned, and compiled the design in such a way as to ensure that it not only looks good, but is also highly functional and effective; there is a need to arrange text, images, graphics, and colors to come together to form one cohesive design. However, in this study, we did not examine such shapes, graphics, colors, or font styles in detail. In future study, these elements of infographics can be examined.
Third, despite the pollution problems caused by online shopping packaging materials, we did not find many packaging designs with green messages about environmental protection and correct recycling knowledge, so we only used the eBay box as a sample for investigation. Thus, we only examined one sample of postal packaging that used infographics, and it is unclear whether the same results would be seen if different samples were used. In the future, we hope to find more excellent samples to examine.
5.4. Future Research
The objective of this study was to address the increasing generation of waste due to postal packaging. Through our investigation of online shoppers, we discovered interesting findings and references for the presentation of green messages. It is hoped that these findings will help reduce the environmental impact of postal packaging waste and provide guidelines for the design of green messages in the future. Although this study has been revised several times, there are still a few problems that could not be overcome. For example, the study of green message interventions was limited to rectangular postal packages; therefore, it is necessary to perform follow-up studies on postal packages of different shapes. In addition, this research was limited to Taiwanese consumers, and we suggest that the inclusion of consumers of different nationalities could be beneficial for this line of research. This would also facilitate comparisons between online shoppers from Taiwan and other countries, thus providing a greater variety of references for the design of green message infographics.
Infographics are an important means of delivering messages to consumers. This research is only a preliminary analysis to attempt to understand consumers’ viewing preferences with respect to green messages using infographics on packaging. In the future, we expect to use more sophisticated methods of analysis in related research.
Moreover, much online shopping is through social media platforms, and for the future research, big data from social media platforms could be used for related research.
Author Contributions
J.-C.T.; Y.-W.T. and T.-R.W. made equal contributions to the development and writing of this paper.
Acknowledgments
The authors would like to thank the anonymous reviewers for their suggestions regarding the improvement of this paper. They would also like to thank the editor of the Special Edition Editors.
Conflicts of Interest
The authors declare no conflict of interest.
References
- Ho, P.S. What Taiwanese Loves to Buy from On-Line Shop? Business Next. Available online: https://www.bnext.com.tw/article/43575/taiwan-ec-survey-from-mic (accessed on 15 March 2017).
- Market Intelligence & Consulting Institute. 2017 Fourth Quarter Online Shopping Survey Series One. Available online: https://mic.iii.org.tw/IndustryObservations_PressRelease02.aspx?sqno=488 (accessed on 22 December 2017).
- Consumers’ Foundation, Chinese Taipei. The Results of the Plastic Bag Test Are Open! Consumer Report, 32–39. Available online: https://www.consumers.org.tw/contents/events_ct?id=247 (accessed on 28 December 2016).
- Jiang, P. Taiwan Consumer Protection Committee Press Release. Available online: https://www.cardu.com.tw/news/detail.php?nt_pk=6&ns_pk=6290 (accessed on 20 March 2009).
- Makower, J. Strategies for the Green Economy: Opportunities and Challenges in the New World of Business; McGraw-Hill: New York, NY, USA, 2008. [Google Scholar]
- Choice, T. The Sins of Greenwashing: Home and Family Edition; TerraChoice Group, Inc.: Ottawa, ON, Canada, 2010. [Google Scholar]
- Lindh, H.; Olsson, A.; Williams, H. Consumer perceptions of food packaging: Contributing to or counteracting environmentally sustainable development? Packag. Technol. Sci. 2016, 29, 3–23. [Google Scholar] [CrossRef]
- Card, S.K.; Mackinlay, J.; Shneiderman, B. Readings in Information Visualization: Using Vision to Think (Interactive Technologies), 1st ed.; Morgan Kaufmann: Burlington, MA, USA, 1999. [Google Scholar]
- Lidwell, W.; Holden, K.; Butler, J. Universal Principles of Design, 2nd ed.; Rockport: Beverly, MA, USA, 2010; ISBN 9781592535873. [Google Scholar]
- Lin, C.T. The Study of Consumers Purchasing Behavior for Green Products and Green Packaging—A Case Study of Greater Taipei Area. Master’s Thesis, Graduate School of Technology Management, Chung Hua University, Hsinchu, Taiwan, 2012. [Google Scholar]
- Pollster Market Survey. Domestic Home Delivery User Experience Survey Report. Available online: http://www.pollster.com.tw/Aboutlook/lookview_item.aspx?ms_sn=2632 (accessed on 27 November 2014).
- Papanek, P. Design for the Real World: Human Ecology and Social Change, 2nd ed.; Chicago Review: Chicago, IL, USA, 2005. [Google Scholar]
- Cheng, Y.C. Green Design; Taiwan External Trade Development Council: Taipei, Taiwan, 1996. [Google Scholar]
- Sanchez, M.J.; Lafuente, R. Defining and measuring environmental consciousness. Revista International de Sociologia (RIS) 2010, 68, 731–755. [Google Scholar] [CrossRef] [Green Version]
- Caron, J.A. Environmental perspectives of Blacks: Acceptance of the “New Environmental Paradigm” scale: A reexamination. J. Environ. Educ. 1989, 20, 21–26. [Google Scholar] [CrossRef]
- Peattie, K. Towards Sustainability: The Third Age of Green Marketing. Mark. Rev. 2001, 2, 129–146. [Google Scholar] [CrossRef]
- Green Sky Video, EPA. The Power of Recycling. 2015. Available online: https://www.youtube.com/watch?v=Gv9i93CNzsg (accessed on 1 January 2010).
- SSU-MA T. Investigating the Effect of Green Message on Green Purchasing Behavior. Master’s Thesis, Graduate School of International Business, Feng Chia University, Taichung, Taiwan, 2011. [Google Scholar]
- Thomas, A.; Heberlein, J.; Stanley, B. Cognitive Consistency and Environmental Action. Environ. Behav. 1981, 13, 717–734. [Google Scholar]
- Hines, J.M.; Hungerford, H.R.; Tomera, A.N. Analysis and synthesis of research on responsible environmental behavior: A meta-analysis. J. Environ. Educ. 1986, 18, 1–8. [Google Scholar] [CrossRef]
- Widegren, O. The new environmental paradigm and personal norms. Environ. Behav. 1998, 30, 75–100. [Google Scholar] [CrossRef]
- Festinger, L. A Theory of Cognitive Dissonance; Stanford University Press: Redwood, CA, USA, 1957. [Google Scholar]
- Eagles, J.F.; Blackwell, R.D. Consumer Behavior; Dryden Press: Chicago, IL, USA, 1995. [Google Scholar]
- Biswas, A. A Study of Consumers’ Willingness to Pay for Green Products. J. Adv. Manag. Sci. 2016, 4, 211–215. [Google Scholar] [CrossRef]
- Peattie, K. Environmental Marketing Management: Meeting the Green Challenges; Pitman: London, UK, 1995. [Google Scholar]
- Chen, M.; Tung, P. Developing an extended Theory of Planned Behavior model to predict consumers’ intention to visit green hotels. Int. J. Hosp. Manag. 2014, 36, 221–230. [Google Scholar] [CrossRef]
- Perrea, T.; Grunert, K.G.; Krystallis, A.; Zhou, Y.; Huang, G.; Hue, Y. Testing and validation of a hierarchical value-attitudes model in the context of green food in China. Asia Pac. J. Mark. Logist. 2014, 26, 296–314. [Google Scholar] [CrossRef]
- Robert, J.A.; Bacon, D.R. Exploring the Subtle Relationships between Environmental Concern and Ecologically Conscious Consumer Behavior. J. Bus. Res. 1997, 40, 79–89. [Google Scholar] [CrossRef]
- Hsu, S.J.; Roth, R.E. An assessment of environmental knowledge and attitudes held by community leaders in the Hualien area of Taiwan. J. Environ. Educ. 1996, 28, 24–31. [Google Scholar] [CrossRef]
- Huang, W.H.; Chen, Y.K. Study on the Effect of Cultural Elements in Advertising—Taking the Elements of Taiwan Aboriginal Culture as an Example. Bus. Manag. Rev. 2009, 8, 1–23. [Google Scholar]
- Lin, H.T.; Lo, H.H. The impact of webpage messages on viewers’ recall and consumer willingness—To explore the interference effects involved. Web J. Chin. Manag. Rev. 2009, 12, 15–17. [Google Scholar]
- Hiroyuki, K. INFOGRAPHICS; Flag Technology: Taipei, Taiwan, 2010. [Google Scholar]
- Smiciklas, M. The Power of Infographics: Using Pictures to Communicate and Connect with Your Audience; Quebec Publishers: Indianapolis, IN, USA, 2012. [Google Scholar]
- Martin, L.J.; Turnquist, A.; Groot, B.; Huang, S.Y.M.; Kok, E.; Thoma, B.; Merriënboer, J.J.G. Exploring the Role of Infographics for Summarizing Medical Literature. Health Prof. Educ. 2018. [Google Scholar] [CrossRef]
- Ware, C. Information Visualization, 2nd ed.; Morgan Kaufmann: Burlington, MA, USA, 2004. [Google Scholar]
- Hsu, P.; Wang, C.M. Infographics Research of Smart Life Technology—Taking the interactive design product “Serenity” as an example. J. Des. Res. 2013, 9, 119–127. [Google Scholar]
- Wang, S.L. Interpersonal Relationship and Communication; San Min Book: Taipei, Taiwan, 2000. [Google Scholar]
- Buljana, I.; Malički, M.; Wager, E.; Puljak, L.; Hren, D.; Kellie, F.; West, H.; Alfirević, Ž.; Marušić, A. No difference in knowledge obtained from infographic or plain language summary of a Cochrane systematic review: Three randomized controlled trials. J. Clin. Epidemiol. 2018, 97, 86–94. [Google Scholar] [CrossRef] [PubMed]
- Hsieh, K.C.; Li, T.Y.; Shen, C.Y.; Chen, C.P. Green Advertising Appeal: The Impact of Time Frame, Message Characteristics and Personal Characteristics on Consumers’ Green Product Attitudes. Sun Yat-Sen Manag. Rev. 2014, 22, 623–652. [Google Scholar]
- Tsai, C.J. Symbol Analysis and Metaphorical Research on Environmental Protection Posters. J. Perform. Vis. Arts Stud. 2010, 3, 61–89. [Google Scholar]
- Ni, M.; Chang, C.W.; Chiang, Y.C.; Yang, H.J. Analysis of excellent poster design elements. J. Graph. Commun. Arts 2008, 225–236. [Google Scholar]
- Chun, T.H.; Yang, T.M. Introduction to Visual Communication Design, 3rd ed.; Chuan Hwa: Taipei, Taiwan, 2014; ISBN 9789572192498. [Google Scholar]
- White, A.W. The Elements of Graphic Design, 2nd ed.; Allworth Press: New York, NY, USA, 2011; ISBN 9781581157628. [Google Scholar]
- Gilford, J.P. Psychometric Methods, 2nd ed.; McGraw-Hill: New York, NY, USA, 1957. [Google Scholar]
- Hair, J.F.; Tatham, R.L.; Anderson, R.E.; Black, W. Multivariate Data Analysis, 5th ed.; Prentice Hall: Upper Saddle River, NJ, USA, 1998. [Google Scholar]
- Gibson, E.J.; Levin, H. The Psychology of Reading; The MIT Press: London, UK, 1978; ISBN 9780262570527. [Google Scholar]
- Rayner, K.; Pollatsek, A.; Ashby, J.; Clifton, C. Psychology of Reading, 2nd ed.; Psychology Press: London, UK, 2011; ISBN 9781848729759. [Google Scholar]
Figure 1.
eBay postal packaging.

Figure 2.
Postal packaging without green message infographics.

Figure 3.
Research framework.

Figure 4.
Reference diagram of the “law of proximity”.

Figure 5.
Reference diagram of the “law of closure”.

Figure 6.
Reference diagram of the “law of continuity”.

Figure 7.
Investigating environmental protection attitudes with infographics and green messages.


Table 1.
The items of environmental attitude and green messages dimension.
| Dimension | Aims | Items | Literature Source |
|---|---|---|---|
| Environmental Attitude | Environmental impact survey | I will read the label before purchasing the product and see if it is a recyclable, low-pollution, environmentally-friendly product. | Hsu; Roth [29] |
| I will do the garbage classification | |||
| I will prepare my own shopping bag. | |||
| I will buy products made by environmentally-conscious manufacturers. | |||
| Green Messages | The impact of green messages on environmental attitudes | I will read the green message on the postal parcel. | Huang; Chen [30]. Lin; Lo [31] |
| I understand the environmental meaning of green messaging clearly. | |||
| The green messages on the postal packaging can make me interested in environmental protection. |
Table 2.
The items of infographics.
| Dimension | Aims | Items | Literature Source |
|---|---|---|---|
| Attractive | Attracting attention | Accord with the trend of the times. | Chun; Yang [42] |
| Impress people. | |||
| Color application. | |||
| Composition. | |||
| Copywriting. | |||
| Text-only composition. | |||
| Graphical composition. | |||
| Clarity | Communicate clearly | The meaning of the composition of the graphics and text is clear and concise. | Chun; Yang [42]; White [43] |
| The graphical presentation makes it easy to understand. | |||
| Graphics combined with colors make it easy to understand. | |||
| The graphical composition makes it easy to understand. | |||
| The text-only composition makes it easy to understand. | |||
| Text combined with colors makes it easy to understand. | |||
| The grammatical structure of the text is correct. | |||
| The font style of the text makes it easy to understand. | |||
| The font size of the text makes it easy to understand. | |||
| Simplicity | Easy to understand | The presentation of the graphics and text makes it instantly comprehensible. | Chun; Yang. |
| The graphical presentation makes it instantly comprehensible. | |||
| The graphical composition makes it easy to understand. | |||
| Graphics combined with colors make it instantly comprehensible. | |||
| The text composition makes it instantly comprehensible. | |||
| The grammatical structure of the copywriting makes it instantly comprehensible. | |||
| Text combined with colors makes it instantly comprehensible. | |||
| The font size of the text makes it instantly comprehensible. | |||
| The font style of the text makes it instantly comprehensible. | |||
| Flow | Conform to psychology of reading | The composition of the graphics and text respects the “psychology of reading”. | White [43]. Lidwell; Holden; Butler [9]. |
| The composition of the text respects the “psychology of reading”. | |||
| The composition of the graphics and text respects the “law of closure”. | |||
| The graphical composition respects the “psychology of reading”. | |||
| The composition of the graphics and text respects the “law of proximity”. | |||
| The composition of the graphics and text respects the “law of continuity”. | |||
| The graphical composition respects the “law of closure”. | |||
| The graphical composition respects the “law of proximity”. | |||
| The text-only composition respects the “law of proximity”. | |||
| The text-only composition respects the “law of continuity”. | |||
| The graphical layout respects the “law of continuity”. | |||
| The text-only layout respects the “law of closure”. | |||
| Wordlessness | To understand the visual psychology | Proportion of information presented on the packaging: text-only information ≤ graphical information | Chun; Yang [42] |
| Proportion of information presented on the packaging: only graphical information | |||
| Proportion of information presented on the packaging: text-only information ≥ graphical information | |||
| Proportion of information presented on the packaging: text-only information |
Table 3.
The Pearson’s correlation coefficient table.
| Absolute Value of the Correlation Coefficient (r) | Degree of Correlation |
|---|---|
| Approximately 1 | Perfect correlated |
| 0.7–0.99 | Highly correlated |
| 0.4–0.69 | Moderately correlated |
| 0.1–0.39 | Modestly correlated |
| 0.01–0.09 | Weakly correlated |
| Approximately 0 | No correlation |
* p < 0.05; ** p < 0.01; *** p < 0.001.
Table 4.
Reliability test.
| Item | Cronbach’s Alpha | Number of Items | Number of Respondents |
|---|---|---|---|
| Environmental attitude | 0.720 | 5 | 221 |
| Green messages | 0.713 | 3 | 221 |
| Infographics | 0.876 | 7 | 221 |
| Total reliability | 0.861 | 15 | 221 |
Table 5.
Results of the Kaiser–Meyer–Olkin (KMO) test and Bartlett’s test on each dimension.
| Target Dimension | Contents of Test | Test Result | |
|---|---|---|---|
| Environmental Attitude | Kaiser–Meyer–Olkin measure of sampling adequacy | 0.725 | |
| Bartlett’s sphericity test | Approximate chi-square distribution | 228.819 | |
| degree of freedom | 10 | ||
| Significance | 0.000 | ||
| Green Messages | Kaiser–Meyer–Olkin measure of sampling adequacy | 0.642 | |
| Bartlett’s sphericity test | Approximate chi-square distribution | 137.478 | |
| degree of freedom | 3 | ||
| Significance | 0.000 | ||
| Infographics | Kaiser–Meyer–Olkin measure of sampling adequacy | 0.871 | |
| Bartlett’s sphericity test | Approximate chi-square distribution | 760.555 | |
| degree of freedom | 21 | ||
| Significance | 0.000 | ||
| Sum | Kaiser–Meyer–Olkin measure of sampling adequacy | 0.835 | |
| Bartlett’s sphericity test | Approximate chi-square distribution | 1362.699 | |
| degree of freedom | 105 | ||
| Significance | 0.000 | ||
Table 6.
Total variance explained by the eigenvalues of each dimension factor.
| Rotated Sum of Squared Loadings | ||
|---|---|---|
| Total | % of Variance | Cumulative % |
| 3.964 | 26.427 | 26.427 |
| 2.662 | 17.750 | 44.177 |
| 2.067 | 13.781 | 57.958 |
Table 7.
Component matrix formed by rotating the principal component analysis (PCA) of each dimension.
Table 7.
Component matrix formed by rotating the principal component analysis (PCA) of each dimension.
| The Items of Each Dimension | Component | |||
|---|---|---|---|---|
| 1 | 2 | 3 | ||
| Infographics dimension | Infographics 4: Composition. | 0.824 | 0.179 | 0.059 |
| Infographics 2: Impress people. | 0.792 | 0.202 | −0.034 | |
| Infographics 3: Color application. | 0.772 | 0.282 | 0.100 | |
| Infographics 7: Graphical composition. | 0.770 | 0.205 | 0.003 | |
| Infographics 6: Text-only composition. | 0.750 | 0.124 | 0.199 | |
| Infographics 5: Copywriting. | 0.660 | 0.027 | 0.342 | |
| Infographics 1: Accord with the trend of the times. | 0.531 | 0.277 | 0.191 | |
| Green Messages dimension | Green Messages 3: Postal packaging with green messages can cause environmental attitude. | 0.270 | 0.634 | 0.056 |
| Green Messages 1: I will read the green message on the postal parcel. | 0.191 | 0.692 | 0.172 | |
| Green Messages 2: I understand the environmental meaning of green messaging clearly. | 0.174 | 0.817 | −0.093 | |
| Environmental Attitude dimension | Environmental Attitude 2: I will do the garbage classification. | 0.157 | −0.017 | 0.721 |
| Environmental Attitude 1: I will read the label before purchasing the product and see if it is a recyclable, low-pollution, environmentally-friendly product. | 0.131 | 0.469 | 0.519 | |
| Environmental Attitude 5: I will buy products made by environmentally-conscious manufacturers. | 0.068 | 0.556 | 0.477 | |
| Environmental Attitude 4: I will prepare my own shopping bag. | 0.061 | 0.543 | 0.535 | |
| Environmental Attitude 3: I will use the paper adequately. | 0.007 | 0.037 | 0.718 | |
Table 8.
Correlations between infographics/green messages and environmental attitude.
| Study Variable | Environmental Attitude | Green Messages | Infographics | |
|---|---|---|---|---|
| Environmental Attitude | Pearson correlation | 1 | ||
| significance (two-tailed) | ||||
| number | 221 | |||
| Green Messages | Pearson correlation | 0.356 ** | 1 | |
| significance (two-tailed) | 0.000 | |||
| number | 221 | 221 | ||
| Infographics | Pearson correlation | 0.332 ** | 0.466 ** | 1 |
| significance (two-tailed) | 0.000 | 0.000 | ||
| number | 221 | 221 | 221 | |
** Correlation is significant at the 0.01 level (2-tailed).
Table 9.
Correlation analysis on the simultaneous effects of infographics and green messages on environmental attitude.
Table 9.
Correlation analysis on the simultaneous effects of infographics and green messages on environmental attitude.
| Study Variable | Infographics and Green Messages | Environmental Attitude | |
|---|---|---|---|
| Infographics and Green Messages | Pearson correlation | 1 | 0.392 ** |
| significance (two-tailed) | 0.000 | ||
| number | 221 | 221 | |
| Environmental Attitude | Pearson correlation | 0.392 ** | 1 |
| significance (two-tailed) | 0.000 | ||
| number | 221 | 221 | |
** Correlation is significant at the 0.01 level (2-tailed).
Table 10.
Order of importance of the factors for “clarity”.
| Factors for “Clarity” | Response Value | |
|---|---|---|
| Number | Percentage | |
| The meaning of the composition of the graphics and text is clear and concise. | 180 | 21.8% |
| The graphical presentation makes it easy to understand. | 136 | 16.5% |
| Graphics combined with colors make it easy to understand. | 132 | 16.0% |
| The graphical composition makes it easy to understand. | 100 | 12.1% |
| The text-only composition makes it easy to understand. | 81 | 9.8% |
| Text combined with colors makes it easy to understand. | 80 | 9.7% |
| The grammatical structure of the text is correct. | 46 | 5.6% |
| The font style of the text makes it easy to understand. | 39 | 4.7% |
| The font size of the text makes it easy to understand. | 31 | 3.8% |
Table 11.
Order of importance of the factors for “simplicity”.
| Factors for “Simplicity” | Response Value | |
|---|---|---|
| Number | Percentage | |
| The presentation of the graphics and text makes it instantly comprehensible. | 175 | 22.8% |
| The graphical presentation makes it instantly comprehensible. | 129 | 16.8% |
| The graphical composition makes it easy to understand. | 111 | 14.5% |
| Graphics combined with colors make it instantly comprehensible. | 109 | 14.2% |
| The text composition makes it instantly comprehensible. | 72 | 9.4% |
| The grammatical structure of the copywriting makes it instantly comprehensible. | 53 | 6.9% |
| Text combined with colors makes it instantly comprehensible. | 44 | 5.7% |
| The font size of the text makes it instantly comprehensible. | 42 | 5.5% |
| The font style of the text makes it instantly comprehensible. | 32 | 4.2% |
Table 12.
Order of importance of the factors for “flow”.
| Factors for “Flow” | Response Value | |
|---|---|---|
| Number | Percentage | |
| The composition of the graphics and text respects the “psychology of reading”. | 121 | 14.6% |
| The composition of the text respects the “psychology of reading”. | 86 | 10.4% |
| The composition of the graphics and text respects the “law of closure”. | 84 | 10.2% |
| The graphical composition respects the “psychology of reading”. | 81 | 9.8% |
| The composition of the graphics and text respects the “law of proximity”. | 78 | 9.4% |
| The composition of the graphics and text respects the “law of continuity”. | 72 | 8.7% |
| The graphical composition respects the “law of closure”. | 64 | 7.7% |
| The graphical composition respects the “law of proximity”. | 59 | 7.1% |
| The text-only composition respects the “law of proximity”. | 51 | 6.2% |
| The text-only composition respects the “law of continuity”. | 49 | 5.9% |
| The graphical layout respects the “law of continuity”. | 47 | 5.7% |
| The text-only layout respects the “law of closure”. | 34 | 4.1% |
Table 13.
Order of importance of the factors for “wordlessness”.
| Factors for “Wordlessness” | Response Value | |
|---|---|---|
| Number | Percentage | |
| Proportion of information presented on the packaging: text-only information ≤ graphical information | 189 | 66.3% |
| Proportion of information presented on the packaging: only graphical information | 66 | 23.2% |
| Proportion of information presented on the packaging: text-only information ≥ graphical information | 27 | 9.5% |
| Proportion of information presented on the packaging: text-only information | 3 | 1.1% |
Table 14.
Order of importance of the factors for infographics-based green message presentations.
| Clarity | Number | Percentage | Ranking |
| The meaning of the composition of the graphics and text is clear and concise. | 180 | 21.8% | 2 |
| The graphical presentation makes it easy to understand. | 136 | 16.5% | 4 |
| Graphics combined with colors make it easy to understand. | 132 | 16.0% | 5 |
| The graphical composition makes it easy to understand. | 100 | 12.1% | |
| Simplicity | Number | Percentage | Ranking |
| The presentation of the graphics and text makes it instantly comprehensible. | 175 | 22.8% | 3 |
| The graphical presentation makes it instantly comprehensible. | 129 | 16.8% | |
| The graphical composition makes it easy to understand. | 111 | 14.5% | |
| Graphics combined with colors make it instantly comprehensible. | 109 | 14.2% | |
| Flow | Number | Percentage | Ranking |
| The composition of the graphics and text respects the “psychology of reading”. | 121 | 14.6% | 6 |
| The composition of the text respects the “psychology of reading”. | 86 | 10.4% | |
| The composition of the graphics and text respects the “law of closure”. | 84 | 10.2% | |
| The graphical composition respects the “psychology of reading”. | 81 | 9.8% | |
| The composition of the graphics and text respects the “law of proximity”. | 78 | 9.4% | |
| The composition of the graphics and text respects the “law of symmetry”. | 72 | 8.7% | |
| Wordlessness | Number | Percentage | Ranking |
| Proportion of information presented on the packaging: Text-only information ≤ graphical information | 189 | 66.3% | 1 |
| Proportion of information presented on the packaging: only graphical information | 66 | 23.2% |
© 2018 by the authors. Licensee MDPI, Basel, Switzerland. This article is an open access article distributed under the terms and conditions of the Creative Commons Attribution (CC BY) license (http://creativecommons.org/licenses/by/4.0/).
Share and Cite
MDPI and ACS Style
Tu, J.-C.; Tu, Y.-W.; Wang, T.-R. An Investigation of the Effects of Infographics and Green Messages on the Environmental Attitudes of Taiwanese Online Shoppers. Sustainability 2018, 10, 3993. https://doi.org/10.3390/su10113993
AMA Style
Tu J-C, Tu Y-W, Wang T-R. An Investigation of the Effects of Infographics and Green Messages on the Environmental Attitudes of Taiwanese Online Shoppers. Sustainability. 2018; 10(11):3993. https://doi.org/10.3390/su10113993
Chicago/Turabian StyleTu, Jui-Che, Ya-Wen Tu, and Tai-Ran Wang. 2018. "An Investigation of the Effects of Infographics and Green Messages on the Environmental Attitudes of Taiwanese Online Shoppers" Sustainability 10, no. 11: 3993. https://doi.org/10.3390/su10113993
Note that from the first issue of 2016, this journal uses article numbers instead of page numbers. See further details here.