Age Factor and Pedestrian Speed on Sidewalks


Department of Civil Engineering, Environmental and Architecture DICAAR, University of Cagliari, 09124 Cagliari CA, Italy
*
Author to whom correspondence should be addressed.
Sustainability 2018, 10(11), 4084; https://doi.org/10.3390/su10114084
Submission received: 17 July 2018
/
Revised: 31 October 2018
/
Accepted: 5 November 2018
/
Published: 7 November 2018
(This article belongs to the Special Issue Walkable living environments)
Abstract
:Pedestrian infrastructures feature the spaces where every user accesses all the mobility forms: in fact, every movement begins and finishes with a walking section. For this reason, it is very important to pay more attention towards what is said “last mile”, that must be designed and constructed to be easily used from the major part of users, with a special attention to more disadvantage citizens. Among all pedestrian characteristics, the least considered is speed, and when it is considered, the reference is the mean speed, that is the speed of the most likely common user. There are numerous and simultaneous factors that influence pedestrian behavior. The age factor mainly determines the psycho-physical characteristics and therefore the behavior. In the present study, it has been observed the behavior on sidewalks with reference to age. The study is based on a survey carried out in the downtown of Oristano, with a total pedestrian flow of 14,182 users. The purpose is, first, to understand how pedestrian speed varies with age, and subsequently to assess if a statistical model exists to describe the pedestrian behavior by age. After a general analysis of pedestrian behavior, the paper focused on users walking not alone but within a flow. The research considers pedestrian speed in real conditions and not isolated pedestrian speed because a pedestrian, inevitably, interacts with other pedestrians and this provides a particular condition. For this reason, the main analysis is based on a subdataset formed by the 2794 individual pedestrians. The analysis shows that there is not a linear relationship between speed and age, but it is better to consider a polynomial model between the mean individual pedestrian speed, mean walking speed and age class. Results show that speed of individual pedestrians decreases as age increases; younger pedestrians walk faster than others, with a difference of 19.2% respect to older ones. This decrease can be represented by a statistical model. The model also shows that there is not a linear relationship between speed and age, but it is better to consider a polynomial model between the mean individual pedestrian speed, mean walking speed and age class. It is necessary to underline this aspect because many efforts have been made all over the world to promote sustainable mobility. Walking is one of the most important aspect of sustainability, so we will aspect an increase of the number of new walking citizens. But it is necessary to consider how population is growing, with a growing number of senior citizens. It is for these users that we will have to plan in the future. In conclusion, the paper studied the mean individual pedestrian speed and its relationship with age and mean walking speed, finding statistical models able to interpret pedestrian behavior; the choice of the mean individual pedestrian speed as dependent variable is the novelty of the study because analyzes a real condition. In fact, the most common case is that of a pedestrian walking within a flow, and not alone. This is an element distinguishing this study from many others. For this reason, this study can help to improve research in this area and could be useful to understand how to plan and to design pedestrian infrastructures. It would also be important to apply this method to other cities with similar characteristics to verify the real transferability of the model and, consequently, of the results.
1. Introduction
The concept of “sustainability” is nowadays very common and every intervention on the infrastructural network and on the transportation system is characterized to be “sustainable”, following what designers said.
When we talk about sustainability in the urban transportation system, the reference is often to that set of elements facilitating mobility of people and goods. Among them there are certainly all the technological interventions to obtain a smart mobility, but also cultural, social and training interventions useful to make grow sensibility towards environmentally compatible behaviors and therefore towards more sustainable ways of mobility, above all, in urban areas.
From this point of view, urban pedestrian infrastructures feature the spaces where every user accesses all the mobility forms: in fact, every movement begins and finishes with a walking section. The lack of accessibility or usability of these spaces makes inaccessible any other transportation system, even if it was thought, designed and constructed based on evident and modern principles of sustainability and accessibility.
It is therefore very important to pay more attention towards what is said “last mile”. “Last mile” is a term used in transportation planning to describe the movement of people and goods from a transportation hub (railway stations, bus depots, ferry slips, etc.) to a final destination (home, work, etc.) [1]. Sometimes, when users have difficulty getting from their starting location to a transportation network, the scenario may be known as the “first mile problem” [2]. For this reason, this apparently little movement must be designed and constructed to be easily used from the major part of users, with a special attention to more disadvantage users.
In fact, there are two ways to deal with pedestrian design. On one side, traditional, and now old, urban engineering based on minimum cost and maximum efficiency, where roadways are designed for the most likely common user, a specific design vehicle, design hourly volume, etc. The consequence is that the cost to accommodate all vehicles on all facilities is deemed to be cost-prohibitive.
On the other side, there is the design of accessible rights-of-way, based on the concept that no one should be discriminated or denied access to public facilities or services.
Many Countries developed minimum accessibility standards for certain urban road design features, but there are many other right-of-way design features for which standards currently don’t exist. In this case designers must take decisions about roadway design that directly affect the users. The guiding principle should be that increasing the accessibility for users with disabilities increases the accessibility for all users. From this point of view, age is a disability factor, especially when dealing with elderly people and children and speaking about walkability [1].
In fact, people involved in mobility are all pedestrians. Even if a car is the primary means of transportation, a user is a pedestrian from the moment he/she parks the vehicle to reach his/her destination. This is also true if he/she moves by bus, subway, bicycle and so on.
Every pedestrian devices or facilities are designed and constructed based on a human characteristic, physical, cognitive, psychological and so on (an easy example is ergonomics). When we think about pedestrian mobility it is necessary to use the same approach; this means to design and to construct taking in account the real skills of users, even when these skills are limited by physical, cognitive, psychological problems. This principle is already used for ramps grade, detectable warnings treatment, bench, ischial support, etc., designed for the most disadvantaged users
Among all pedestrian characteristics, the least considered is speed, and when it is considered, the reference is the mean speed of all users, that is the speed of the most likely common user. Yet there are many devices which are based on user speed. One of devices, whose functioning is based on pedestrian speed, is, for example, time cycle of traffic lights intersection and pushbuttons, but there are also other pedestrian facilities where speed plays an important role. If the reference for these devices is the most common user, a large portion of users will face problems and, probably, will decide not to move. An example is reported in paragraph 12.4 Advantages of medians—Medians Allow More Frequent Gaps in Lesson 12 Midblock crossings of Federal Highway Administration University Course on Bicycle and Pedestrian Transportation [3]. Note that even this Course speaks about a “mean pedestrian traveling 1.2 m/s”, despite being appreciable for the attention paid to disadvantage users. But if the traveling user is an elderly person, what does it happen? This problem is nowadays very important; in fact, in many Italian urban areas, there are districts characterized by a high percentage of elderly people.
For the above-mentioned reasons, the target of this paper is to investigate how pedestrians move and which are the characteristics influencing their behavior, using as reference parameter their speed. In fact, even if the design aspect is not the focus of the study, it is important for the design phase to know how people move and what behavior is affected by.
Certainly, walking speed is one of the dimensions of walking activities, but in questions related to the design of pedestrian movement spaces (sidewalks, pedestrian crosswalks, traffic lights, etc.) speed is one of the most representative parameters.
For this reason, the focus of this paper is to examine pedestrian behavior on sidewalks to find relationship between walking speed and age, deepening studies and research already developed by many researchers and by the authors. This relationship is investigated using the mean individual pedestrian speed, caused by interaction among participants and their own skill to walk, relationship which takes in account the pedestrian behavior and the relative factors influencing them. These factors could be related to their physical state, to the characteristics of pedestrian flow or to infrastructure conditions.
The rest of the paper is structures as follows. In Section 2 there is a review of previous researches on pedestrian speed that highlights the great number of studies and the difficulty to take in account all them for the great differences among them. Section 3 presents the specificity of the survey, the data collection and construction and reduction of the set used for the following analysis. Section 4 provides the general analysis of the dataset and the differences with other studies. It is divided in three parts; respectively, in the first individual speed from dataset is studied towards age to understand how speed varies with age (Section 4.1); the second one briefly analyzes speed and age in other studies characterized by the same trend (Section 4.2); the third one emphasizes the differences between the research and other studies. Section 5 presents the method and the statistical analysis. Section 6, starting from a description of the work steps, shows the results of the statistical analysis and the obtained model. Section 7 discuss and summarizes the main findings of the study.
2. State of the Art: A Literature Review
In the past pedestrian mobility was neglected and research efforts were focused on vehicular traffic. The new sensibility towards environment, sustainability ad accessibility highlighted that pedestrians play an important role in the city life and in the urban transport system; in fact, more and more people chose to walk to reach their desired destinations. For this reason, to design pedestrian infrastructure with sustainable devices and facilities is very important to meet the needs of pedestrians.
Pedestrian behavior is influenced by many factors: surrounding environment, path characteristics, pedestrian characteristics, physical factors, moving reasons, weather conditions, and so on [3]. The scientific literature indicates that walking speed is one of the fundamental variables to explain pedestrian behavior. Demonstration of this fact is that over 100 manuscripts are published about pedestrian behavior and most of them use pedestrian speed as main variable to investigate the phenomenon. These papers are different for study area (different population and culture), for variables, for methodology (empirical, statistical, psychological, transportation methodology, etc.), for used tools (regression, microsimulation, interviews, transportation models, etc.), etc. For these reasons it is very complex to analyze all these papers to identify a common finding or what can be useful or now accepted by the scientific community.
However, it is possible to make some considerations about the literature review, trying to divide the studies for general argument. As said before, studies can be distinguished for study areas. This causes many differences in parameters and outcomes. There are many studies regarding developing Country [4,5,6,7,8]. Most of them stated that pedestrian behavior, and so speed, is very different (generally lower [4,5]) from that of European and North American Countries) and for this reason it is no possible to use the values of Highway Capacity Manual [9]. In other studies, some used variables are strictly linked to tradition (for example clothing [5]) and influenced the behavior. The most used variables are age and gender, and it is often highlighted the importance to find values referring to the studied reality.
Some other studies differ for pedestrian facilities and are a comparison among them [10,11,12] or analyze crossing speed [13]. Also, in these, we can find the importance of the location of the study (lower speeds in developing Countries [10]). The main used parameters are age and gender [10,11], but there are many other parameters, some of which transportation ones [10], others linked to user’s behavior [12]. When the number of parameters increase, they are usually analyzed separately.
Other studies are related to different scientific fields or use different populations or variables, e.g., sports medicine [14], social and planning studies [15,16], disabilities [17] or hilly urban areas [18]. Clearly the consequence is different methods, study sampling [14], walking experience [15], “social” interaction forces [16]. Also, for these studies, when the number of parameters increase, they are usually analyzed separately.
The used methodologies are very numerous. There are studied based on mathematical and graphical relationships [19,20], on artificial neural network [21], on questionnaires [22], on laser measurements and video images [23], on automated analysis [24], on comparative approach [25], etc. The statistical approach is very used by researchers. Some of these used the regression analysis to identify models able to understand the examined phenomenon [26,27,28,29,30,31], but other types of statistical analyses are often used [32,33,34,35]. The major part of them is based on video surveys and most of these clearly declare that operators subjectively estimate age of pedestrians. The most used variables are free flow speed (or, in other words, isolated pedestrian speed) as dependent variables and flow rate, density, age, gender, facility type, sidewalks width and group size as independent variables. All researchers, in their models, normally don’t use more than 3/4 variables. When they try to add other variables, the statistical analysis gives worse results and often it is not possible to validate the model.
Finally, it is possible to recognize different analysis tools. First the simulation techniques, based on microscopic approach [36,37,38], on mesoscopic model for large-scale simulation [39], on macroscopic model [40]. Others are based on transportation modeling, such as Free Streamline Theory [41], simulation model [42] and Monte Carlo simulation [43]. Other tools are used, such as fuzzy logic [44], Bayesian modeling [45] and fundamental diagram [46]. Also, for these last works it is possible to make the same previous considerations about the choice and the number of variables; when they are too many, they are separately studied.
However, despite the great differences among the studies, it is possible to summarize some findings.
First, the division in arguments is useful to understand how researcher’s world is moving, but all the references can fit into more topics. Then, there are some aspects in common among several studies. Most of them considers free flow speed as the variable to study because it is useful to symbolize user’s behavior. Many studies start from a video survey to construct the database to analyze and many of them clearly declares that operators subjectively estimate age of pedestrians. Age is one of the most important independent variable, always divided in class and never considered as continuous variable. Other variables change from one study to another, according to the topic and the objective of the study, but when the target is to obtain a behavioral model, only 3 or 4 are used. When variables are more, researchers often study their effects on the phenomenon individually.
Among all the references, there is someone interesting as an example of studies on the argument, and useful to compare results about the relationship between speed and age.
Willis et al. [38] considered many factors, such as age, gender, groups size, time of day, level of mobility, baggage and location, finding that the mean walking speed was 1.47 m/s and the walking speed declined as age increased. Speed of 16–25 years old adults and 26–50 years old adults was 1.55 m/s and 1.47 m/s, significantly higher than that of elderly people: 1.38 m/s and 1.16 m/s for 51–64 years old and for >64. This group is the slowest, while <16 years persons have the highest mean walking speed with 1.53 m/s.
Finnis et al. [8] used field data to estimate influences of mean walking speeds and found that mean walking speeds varied between 1.167–1.583 m/s; the measured mean walking speed was about 1.47 m/s. The comparison among age classes indicated significant differences: 15 to 30 years old persons had 1.46 m/s, 30 to 55 had 1.49 m/s and >55 years had 1.37 m/s.
The Highway Capacity Manual [9] refers that walking speed depends strongly on characteristic of the study population. Moreover, walking speed is influenced by the percentage of elderly (≥65 years) and children pedestrians in the population. A free flow speed (the mean speed of the pedestrian walking alone) is 1.5 m/s. If the number of elderly pedestrians is ≤20% of the population, then the free flow speed recommended is about 1.35 m/s, otherwise if >20%, the free flow speed recommended is about 1.00 m/s. Moreover, if the number of elderly pedestrians grows of an additional 10% or more, the free flow speed is reduced of addition 0.1 m/s. Generally, a travel speed is considered desirable when it is equal to or greater than 1.2 m/s, while a travel speed is not considered desirable if it is equal to or less than 0.6 m/s. A facility travel speed of about 1 m/s is adequate but a higher speed than 1.2 m/s would be more appropriate. The mean free-flow pedestrian speed is necessary to estimate urban street segment performance for a pedestrian; the basic conditions for this speed is that pedestrians do not change their path to avoid other pedestrians, and so there are no conflicts with other pedestrians. Pedestrian age and sidewalk grade affect walking speed.
Rahman et al. [6] found that the free flow walking speed was affected by pedestrian age, gender, baggage and facility walkability. Results showed that as pedestrian age increases, walking skill declines.
Azmi et al. [25] compared walking behavior on urban and rural neighborhood. The comparison of mean walking speeds showed that the fastest age groups were men from 13 to 60 years old with 1.45 m/s for rural neighborhood, and women from 7 to 12 years old with 1.46 m/s for urban neighborhood; the slowest age groups were women from age ≥61 and pre-schooler with 1.11 m/s for rural neighborhood and female primary school children with 1.21 m/s in urban neighborhood. Generally rural neighborhood walked slower than urban neighborhood. In general, speed difference was due to different physical skill for different age groups, to more accessibility standards in local facilities, and, finally, to obstacles on the path and density of people.
Nazir et al. [7] developed relationships among speed, flow, density and pedestrian space. The result suggests that the relationship between pedestrian speed and density was linear, the relationship between pedestrian speed and flow and pedestrian flow and density were quadratic and finally, the relationship between pedestrian speed and space was polynomial. Age and gender were significant on variations of mean walking speed. The mean walking speeds for each age group were 1.03 m/s for children, 1.125 m/s for youngs, 1.12 m/s for adults and 1.05 m/s for elderly people.
Satish et al. [29] founded that the fastest group was <20 years old with 1.24 m/s and slowest group was >50 years old with 0.96 m/s independently of facility type; the group 20–50 years old with 1.20 m/s, had a speed higher than mean walking speed (1.13 m/s). The free flow speed, for different facilities varied between 1.46–1.64 m/s. Moreover, for sidewalks, an exponential relationship was found between speed and density. The same authors already investigated about pedestrian speed and its relationships with facilities characteristics and age. This paper is the development of previous research carried out by the authors [27,28].
The focus of this paper is to examine pedestrian behavior on sidewalks to find relationship between walking speed and age, deepening studies and research already developed by many researchers and by the authors. The deepening concerns the fact not to consider the pedestrian as isolated or alone, but within a pedestrian flow. In fact, in the first case the behavior is related only to the physical and psychological characteristics of the user and to the characteristics of the infrastructure, while in the second case, the interactions between a user and the others are added to the previous ones. Although pedestrians walk by themselves, they are forced to have interactions with other pedestrians and therefore other variables must be also considered. Among these, the choice of the age is not random: in fact, this is the variable that most characterizes pedestrian behavior because the physical factors change and pedestrian skill is mainly associated with the age change. The purpose is to find a pedestrian walking speed, depending on age and interactions, useful for the design of pedestrian spaces, in conviction that pedestrian spaces must be designed to meet the pedestrians needs whatever their age and physical and psychic condition.
3. Data Collection and Database Construction and Reduction
The study was developed in the downtown of Oristano (Sardinia, Italy) in an urban context characterized by activities and services for citizens and the presence of numerous shops. The area shows issues regarding pedestrian infrastructures (inadequate sidewalks width, improper placement of street furniture, inadequate positioning of parking lots, etc.). The result of the general study has also been verified with the Highway Capacity Manual (HCM) method [9], ensuring that all sidewalks have a Level of Service LOS F.
Five roads were identified by pedestrian flow and land use; they were all convergent to the main city square; they are similar for traffic characteristics: one lane and one travel direction, sidewalk on each side, no gradient (flat roads), parking lots arranged on one or both sides according to the road width, without traffic lights. They are also similar for land use: urban context characterized by activities and services for citizens and the presence of numerous shops.
In this study the data come from surveys carried out in another research of the authors [9]; for some sidewalks, surveys were repeated to collect more data and to see if user’s behavior changed.
In conclusion, all the roads are similar for characteristics, land use and population. To confirm this fact, surveys are performed during the shops opening hours of weekend and on days with good weather conditions with concealed camcorders so as not to influence the spontaneous pedestrians’ behaviors.
To determine pedestrians’ speeds, two lines perpendicular to a known distance have been considered for each path. For each path, this distance is the same to compare the measures outcomes. The time taken by each pedestrian to cross this distance was defined through video processing, based on a grid of lines on the basis of the reference signs and considering that one movie frame corresponds to 1/25 of second. In this way it was possible to define the time taken by each pedestrian to cross the sidewalk section. Speed is calculated as the ratio between the known distance and this time. In this way, data are relating to each pedestrian. Table 1 shows the general characteristics of sidewalks and detected pedestrians.
The collected global number was 14,182 pedestrians and their age were determined subjectively by an operator. On these global data, it is necessary a database reduction, useful to obtain the dataset afterwards used for specific analysis. From this point of view, each pedestrian was distinguished according to age in classes and, in addition, individual pedestrians were distinguished from groups. In this way, 2822 individual pedestrians were found. Pedestrians characterized by interference influencing their behavior (disabilities, pushchairs, carried loads, etc.) were excluded from the dataset for their low number. Excluded data refer also to pedestrians with abnormal behavior during the journey, for example people who suddenly stop and then resume walking for many reasons, joggers, runners, etc. In fact, all these behaviors could have adversely affected the statistical analysis, worsening or, even, inhibiting the determination of sound models. So, 28 individual pedestrians were discarded (0.1% of outliers). In this way the dataset is formed by 2794 individual pedestrians. This dataset is used for subsequent analyzes.
To better analyze the dataset, a speed analysis is carried out to verify the distribution of the data, that is the base to develop statistical models. This is very important, and it is a statistical activity normally used to get more information on the data and understand if they need further investigation. The speeds analysis confirmed what the scientific literature reports about speeds, that is they follow a normal trend. This was done with the construction of the histogram of speed frequencies distribution. To be safer it was also carried out the Kolmogorov-Smirnov test that confirmed the normality of speeds. In conclusion, speed analysis shows that pedestrians’ speeds can be approximated by a normal distribution. In fact, the area under the normal distribution graph, for a distance from the mean of ±3σ is 0.9973. Thus, the probability that data fall within this range is 99.73% and only 0.27% of data [47] is excluded.
This is important because the focus of the study is to determine the mean pedestrian behavior: the construction of a normal distribution of pedestrian speeds was made and data outside the range [μ − 3σ; μ + 3σ] were eliminated.
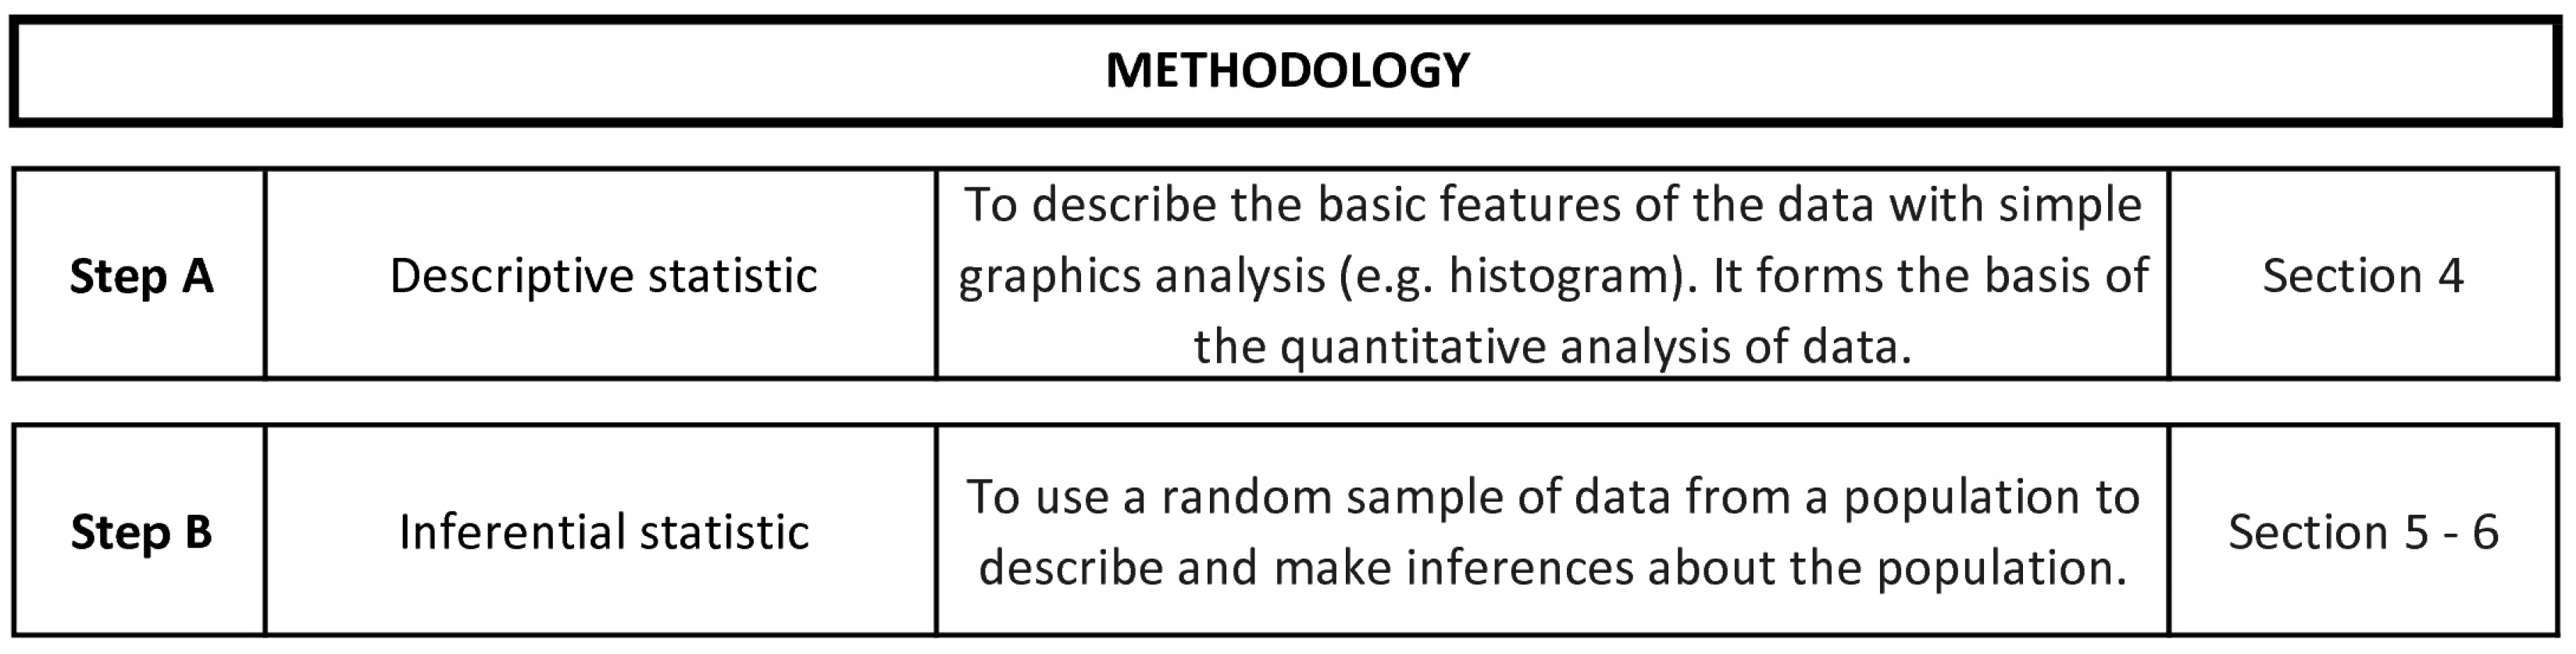
From this point the analysis of dataset begins. It can be divided in two parts, as shown by the following Figure 1.
4. General Analysis of the Dataset
This Section is the first part of the more general analysis of the dataset, based on descriptive statistic. It is divided in three parts. The first one gives the value characterized the dataset, the second one gives the values obtained by other researchers and the third one explains the difference among all the values and its cause, mainly the use of individual pedestrian speed instead of free-flow speed or speed of isolated pedestrians.
4.1. Speed and Age Class in the Dataset
First step is to study the general relationship between speed and age. The reference is the dataset of 2794 individual pedestrians and this is useful to understand how speed varies with age. So, the behavior of 2794 individual pedestrians was considered. The mean individual pedestrian speed was compared and the effect of age was studied.
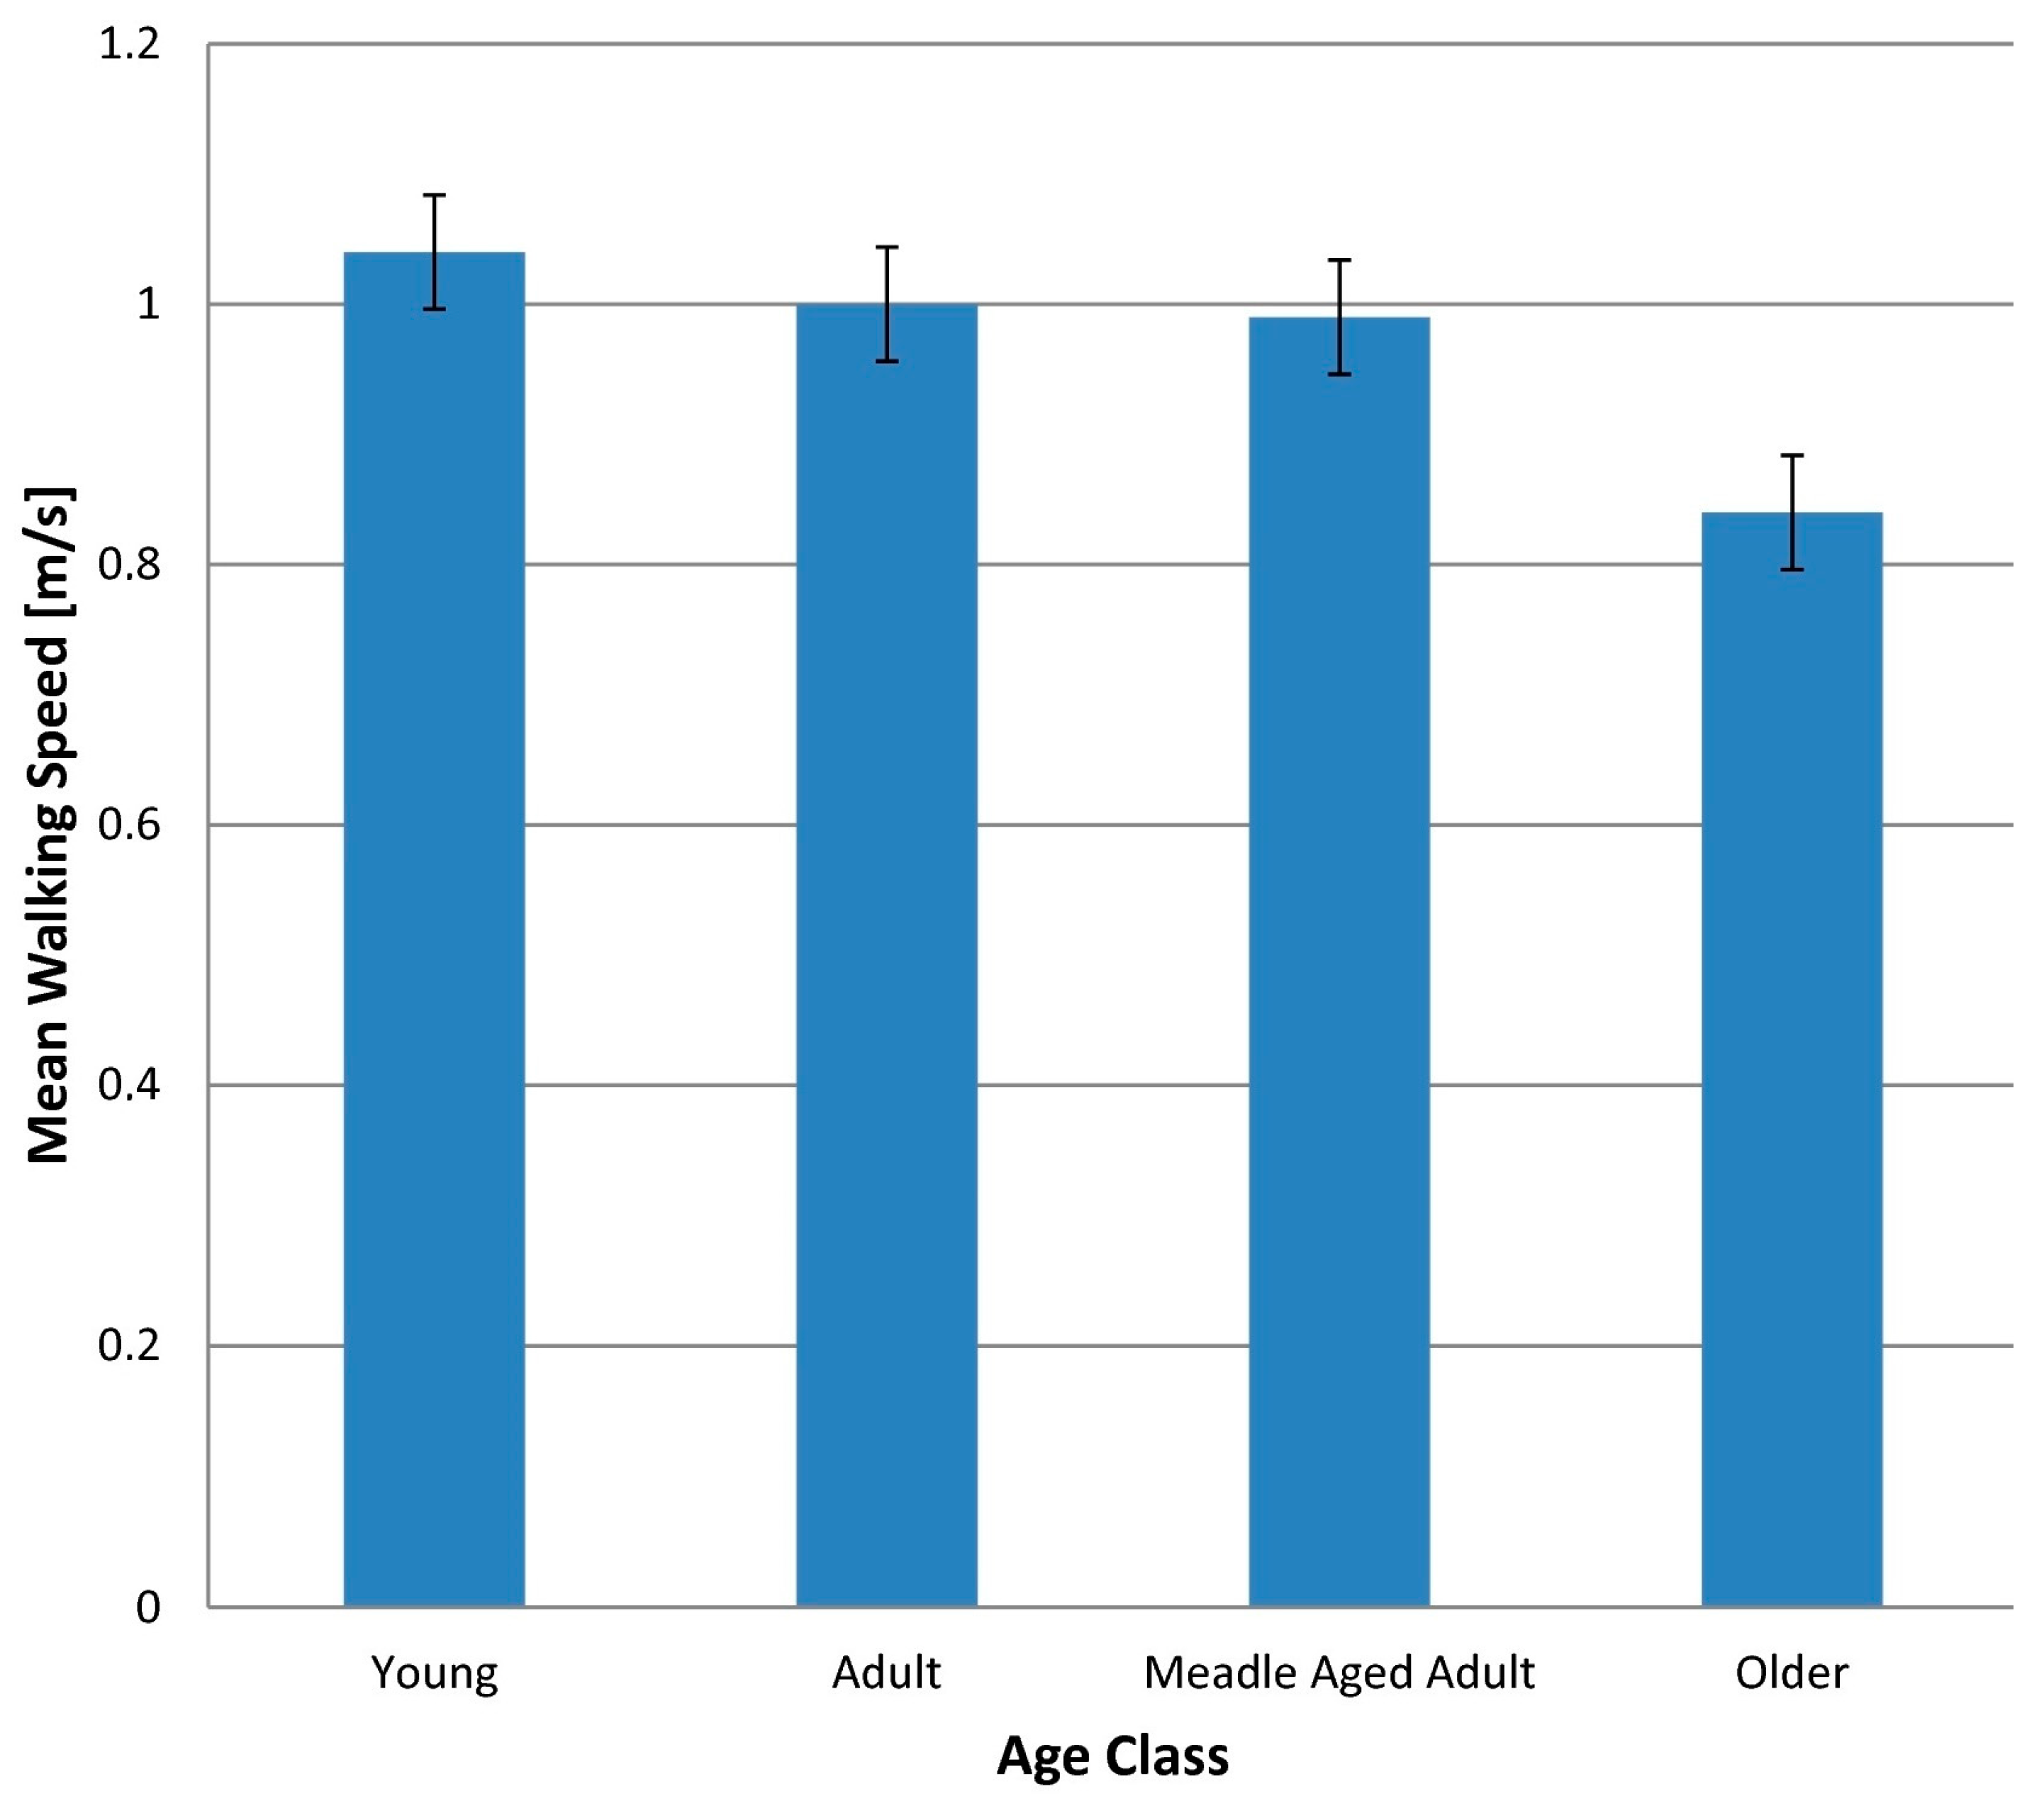
According to other studies, four age classes were considered: Young (from 0 to 18 years old), Adult (from 19 to 40 years old), Middle-Aged Adult (from 41 to 65 years old) and Older (age more than 65 years old).
The base for the analysis is Table 2, where, for each age class and each road, it was calculated the value of speed, Standard Deviation, number of pedestrians, maximum and minimum speed. From these values, the value for all sidewalks are found. For all sidewalks, the total mean individual pedestrian speed is 0.98 m/s with standard deviation of 0.11 m/s for 2794 individual pedestrians with 1.41 and 0.57 m/s of maximum and minimum speed respectively.
The mean speed of individual pedestrians, for each age class, decreases with increase of age class as showed in Table 2 and Figure 1.
Table 2 and Figure 2 show that the fastest age class is Young and then Adult with mean walking speed of 1.04 m/s and 1.00 m/s respectively, with a difference of 3.8%. Moreover, the slowest age class is the Older with a mean walking speed of 0.84 m/s with a difference of 19.2% towards Young. The Middle-Aged Adult class has a mean walking speed of 0.99 m/s with a difference of 4.8% from Young Class and of 15.1% from Older class.
The comparison among classes were investigated. The difference in mean walking speed among age classes was highly significant as showed by one-way ANOVA (F32790 = 213.55; p ≅ 1.1 × 10−124). To better understand, t-tests were performed between age classes and results are summarized in Table 3. This test is useful when it is necessary to compare measured variables (in this case, speed) of which the average was calculated (in this case, mean speed of individual pedestrians) to understand if the difference between the mean values of two samples are significant. This allows to understand if the observed difference is not due to chance, but instead, there is really a difference between the means of the two populations or, in other words, if the two samples belong to different populations regarding the variable considered.
4.2. Speed and Age Class in Other Studies
The walking speed of individual pedestrians has a decreasing trend with increasing age; the same trend is found in other studies.
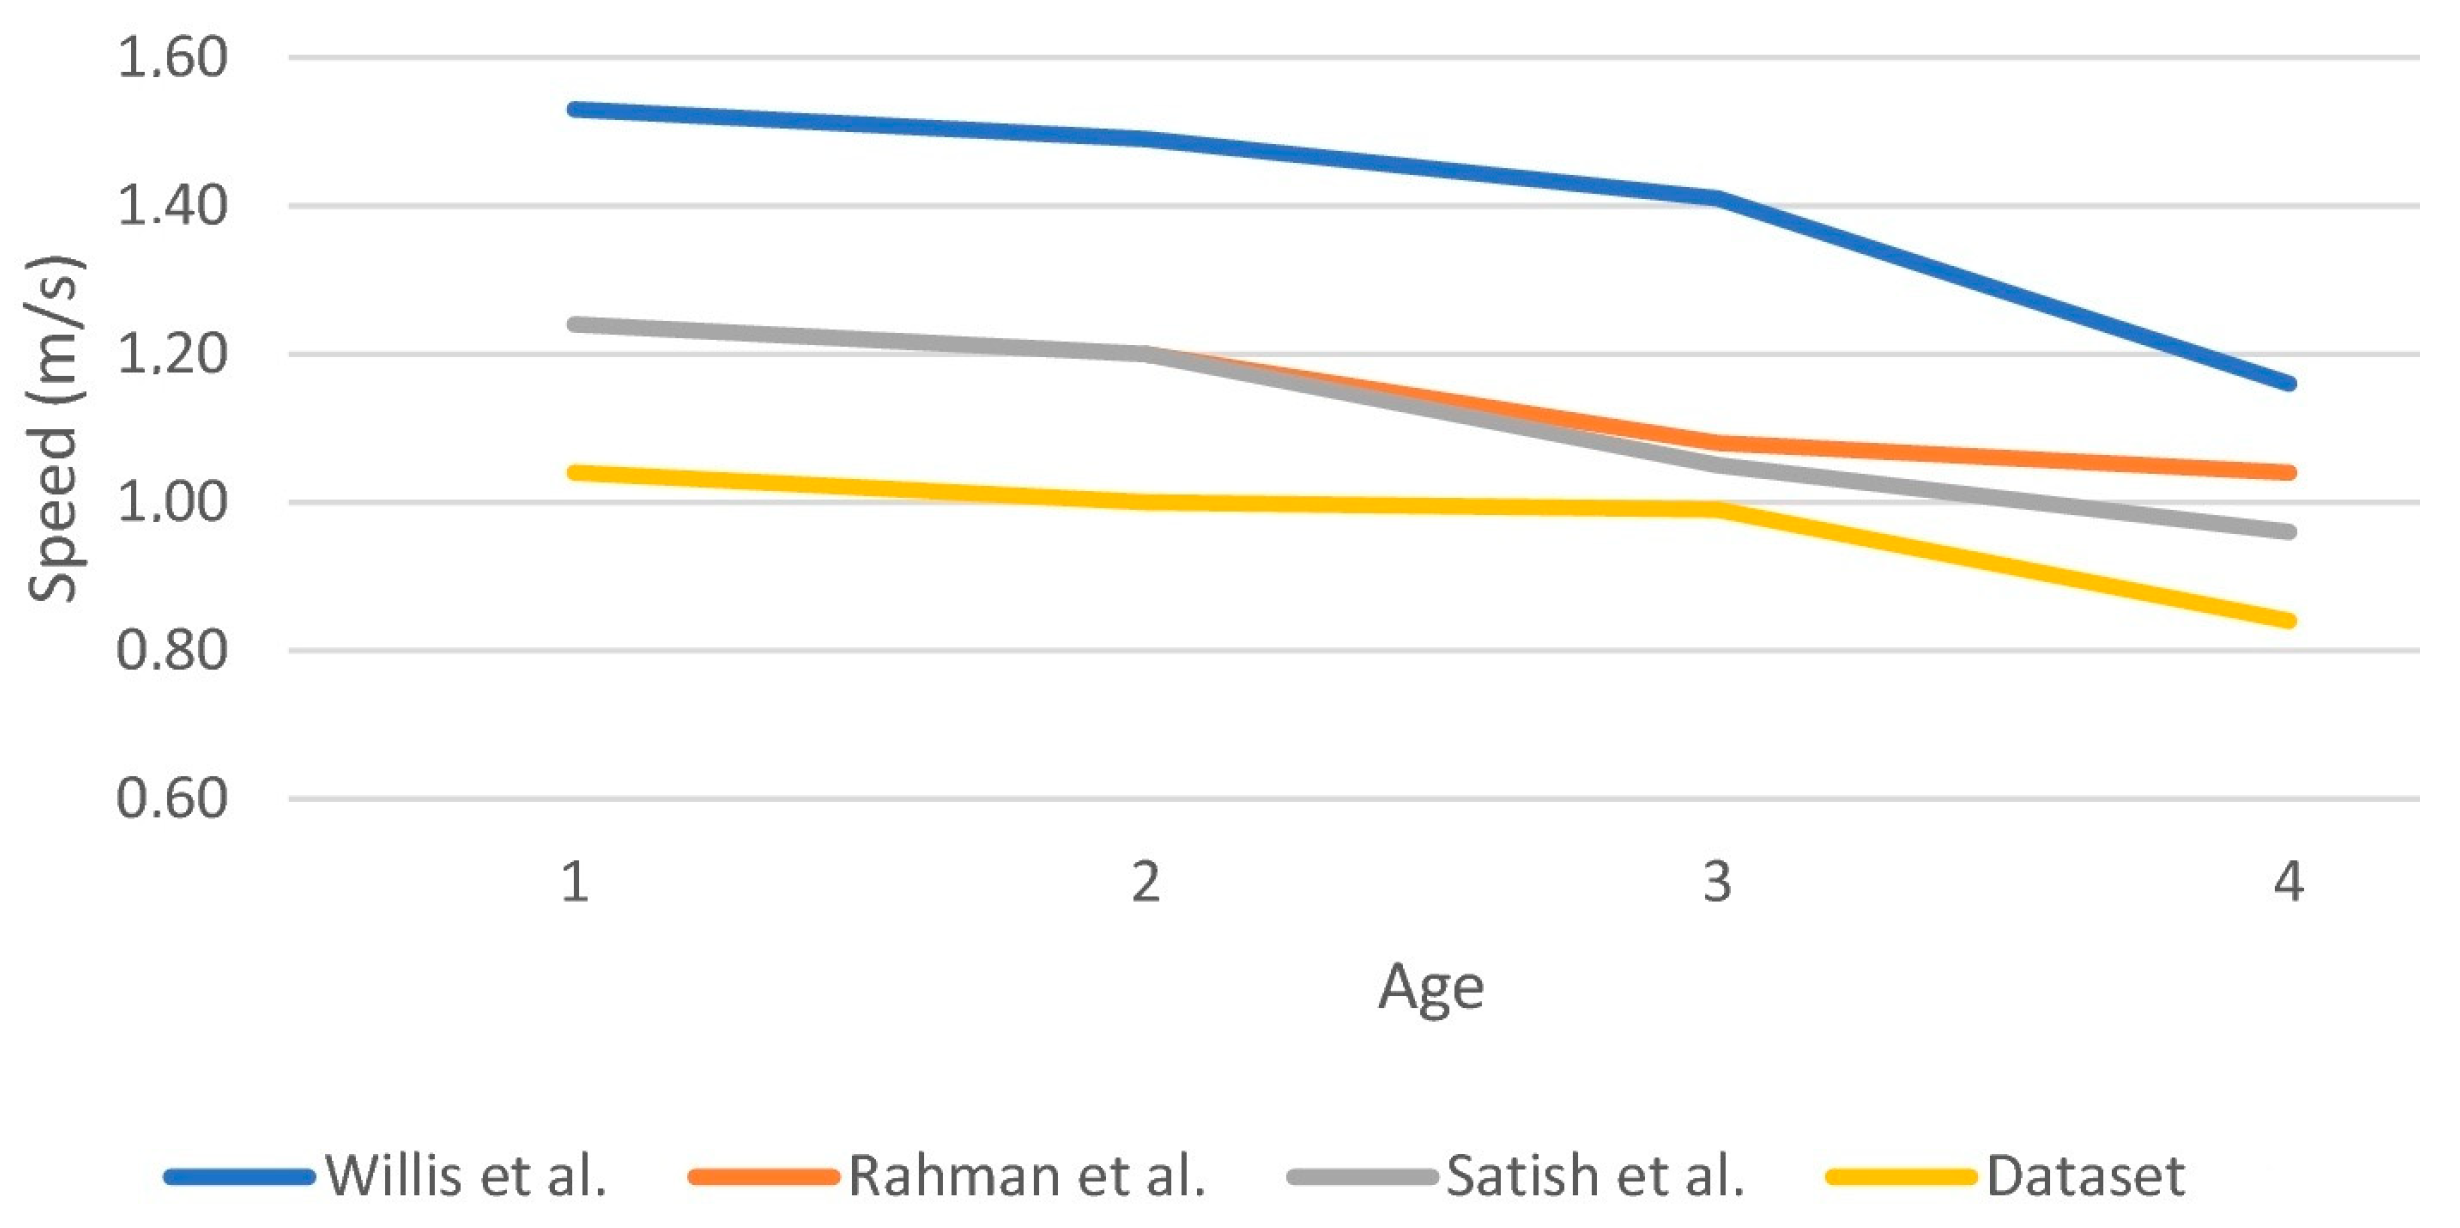
For example, in Willis et al. [38], walking speed variations, according to age classes, showed that the difference between <16 years old class (1.53 m/s) and 16–25 years old (1.55 m/s) was about 1.3%; between 16–25 years old class and 26–50 years old (1.47 m/s) was about 5.2%; between 16–25 years old and 51–64 years old (1.38 m/s) was about 11% and between 16–25 years old and >64 years old (1.16 m/s) was about 25.2%; the total mean walking speed was 1.47 m/s.
In Rahman et al. [6], the difference among age classes was: about 7.9% between 15–30 years old (1.26 m/s) and 30–50 years old (1.16 m/s); about 17.5% between 15–30 years old and >50 years old (1.04 m/s); in general, the total mean walking speed was 1.15 m/s.
In Satish et al. [29] the difference among age classes was: about 3.2% between <20 years old (1.24 m/s) and 20–50 years old (1.20 m/s) and about 22.6% between <20 years old and >50 years old (0.96 m/s); in general, the total mean walking speed was 1.13 m/s.
4.3. Difference between Dataset Value and Other Studies
Comparing the result of the general analysis of the dataset with those of other studies, it is possible to say that the calculated mean walking speed for every class of age is always lower than that of other studies. The following graph (Figure 3) shows this fact. Similar consideration can be also made for the total mean walking speed; in fact, the values in the other studies are 1.47 (Willis et al.), 1.15 (Rahaman et al.) and 1.13 (Satish et al.), while the value obtained from the dataset is 0.98.
The difference is related to the fact that all the above studies, and others, have in common that they refer to free-flow speed or speed of isolated pedestrians, while in this study the pedestrian walks alone but not isolated and for this reason he/she is called “individual pedestrian”.
The isolated pedestrian freely chooses his/her position, direction, walking speed and route; therefore, his/her movement is not affected by the presence of other pedestrians on the path; this condition can be defined as ideal. The individual pedestrian walks alone but within a pedestrian flow, so, his/her movement is affected by the presence of other pedestrians.
So, the difference is due to the individual pedestrian behavior: the mean individual pedestrian speed is lower than the mean pedestrian free-flow speed. A consequence of this is that, in the pedestrian infrastructure design, to use the latter could lead to an overestimation of the real speed. The real behavior is represented by the pedestrian walking that avoidably interacts with the other pedestrians and with the surrounding environment. For this reason, after the general analysis of the dataset, from this point the study was focused to investigate if there is a statistical relationship among mean individual pedestrian speed, age and other influenced factors. The expected outcome is to find statistical models representative of the analyzed phenomenon.
5. Methodology and Variables
The study of pedestrian behavior is complex because there are many reasons and interactions affecting their movements. In fact, in the case of motorized flow, vehicles travel on lanes in specified directions, while the pedestrian behavior is characterized by the choice of a route, also and above all, as a function of interactions with other pedestrians, of the path characteristics and of their own skill to walk.
The above section only shows the speed trend towards age, but, at the moment, nothing can be said about the possible existence of a statistical link between the two variables. So, the main purpose of this section is to investigate the mean individual pedestrian speed, caused by interaction among pedestrians and their own skill to walk.
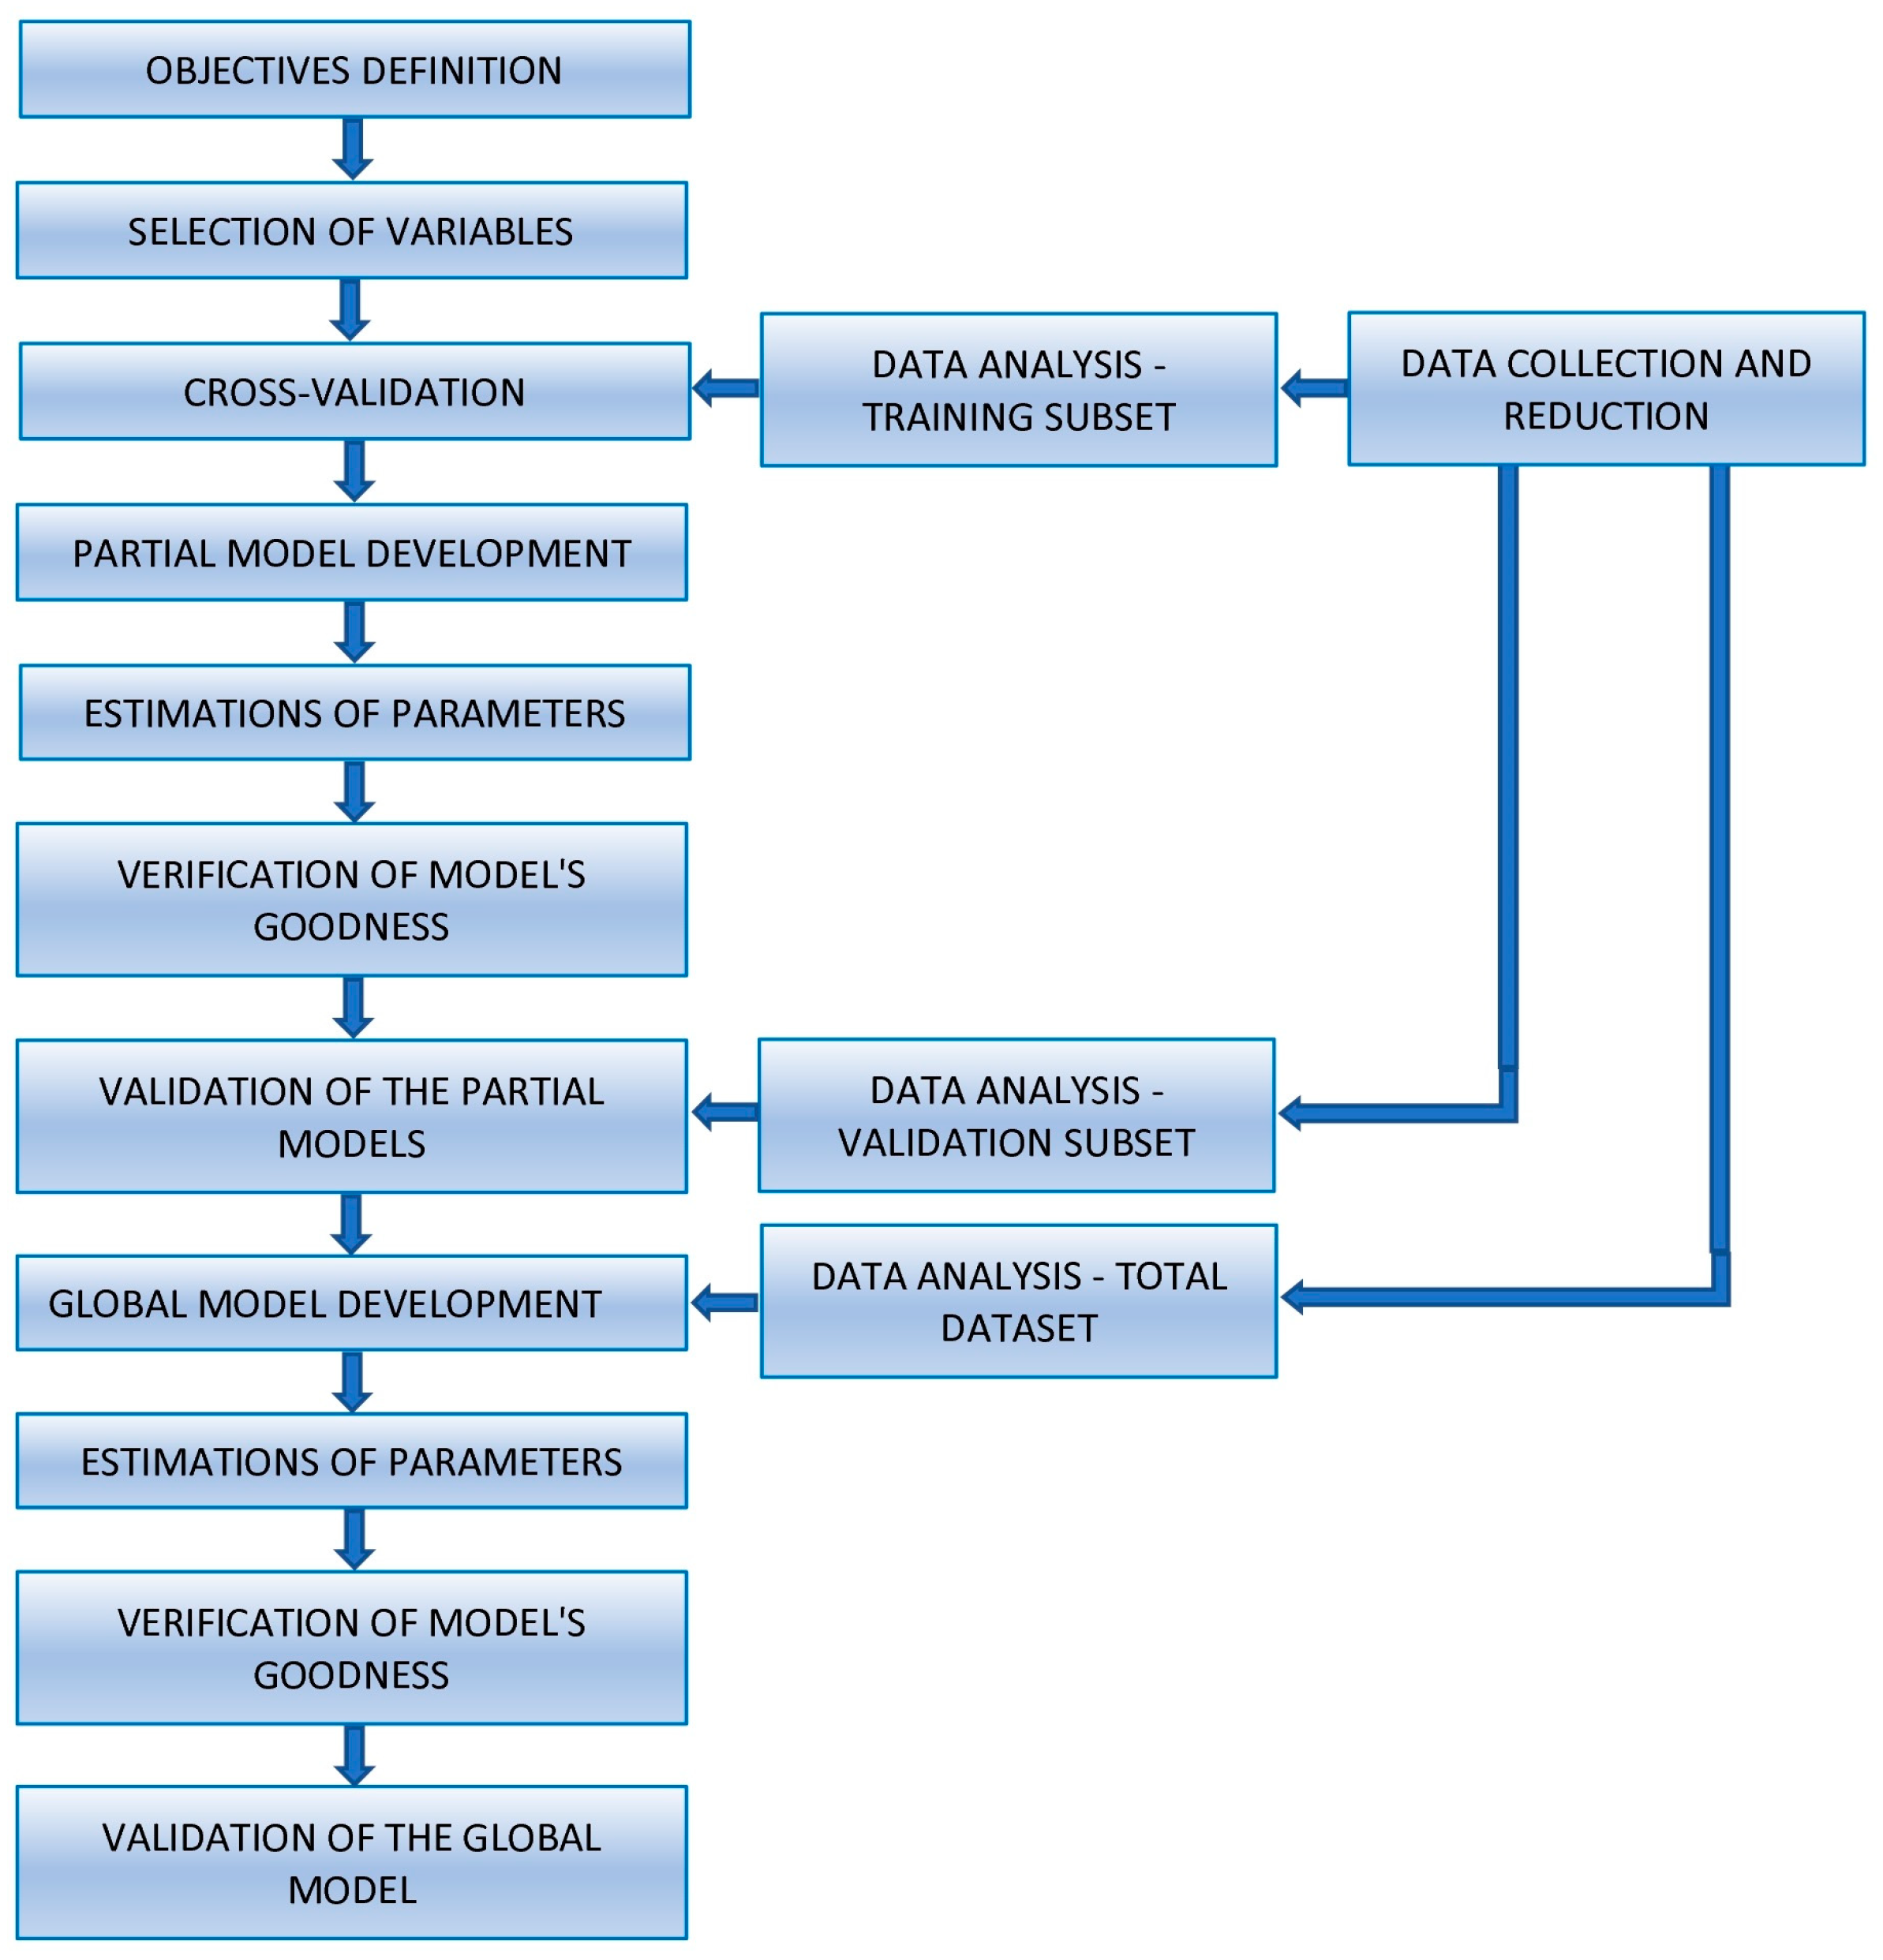
This investigation is carried out through the following steps shown in Figure 4 below.
To identify the behavior, a multiple regression model was used through the described data processing.
Some models are developed using multiple regression in which the dependent variable is related to independent variables by the general equation:
where:
Y = β0 + β1X1 + β2X2 + … + βnXn + ε
- Y is the dependent variable;
- X1, …, Xn are the independent variables;
- β0 is the constant parameter (intercept);
- β1, …, βn are the model parameters (regression coefficients);
- ε is the error component in the model.
The variables were measured and/or calculated based on the dataset and considered for each sidewalk using a survey interval of two hours.
The dependent variable (Yi) is:
- Smip mean individual pedestrian speed for each age class [m/s]: it is the mean speed of individual pedestrians into the flow. For this reason, their speeds depend on the interactions with other pedestrians walking in the same or in the opposite direction. This condition, and consequently the speed, is obviously linked to the sidewalk width and affected by the age. The mean individual pedestrian speed was considered the best indicator of pedestrian behavior, because all pedestrians walk by themselves (both isolated and not isolated) and both travel directions on sidewalk are confined.
The independent variables (Xi) are:
- Smw mean walking speed for each sidewalk [m/s]: it considers all pedestrians in the section of interest and its value is influenced by various factors such as interaction between pedestrians (which will be greater as flow increases), infrastructure characteristics (width, pavement conditions, obstacles on path), etc.
- A age class for each sidewalk: it was considered both in linear form and in quadratic form. The age class of individual pedestrians is the best indicator of the physical characteristics and then of the skill to walk. Age classes are classified as follows:
- from 0 to 18 years old;
- from 19 to 40 years old;
- from 41 to 65 years old;
- over 65 years old.
Also, other variables were investigated:
- PN global number of pedestrian walking on sidewalk [ped];
- PF pedestrian flow rate [ped/s];
- PFW unit flow rate per width unit [ped/m/s];
- PD pedestrian density [ped/m2].
For each independent variable group, construction, verification and validation models were carried out by means the Cross Method.
The methodology used is the Cross-Validation, in which a single sidewalk dataset for time are excluded (named “validation set”); with the remaining data (named “training set”) a behavioral model is constructed (named the partial model); later, with the dataset excluded from the construction phase, each model is validated.
Each partial model is verified using regression statistics and analysis of variance.
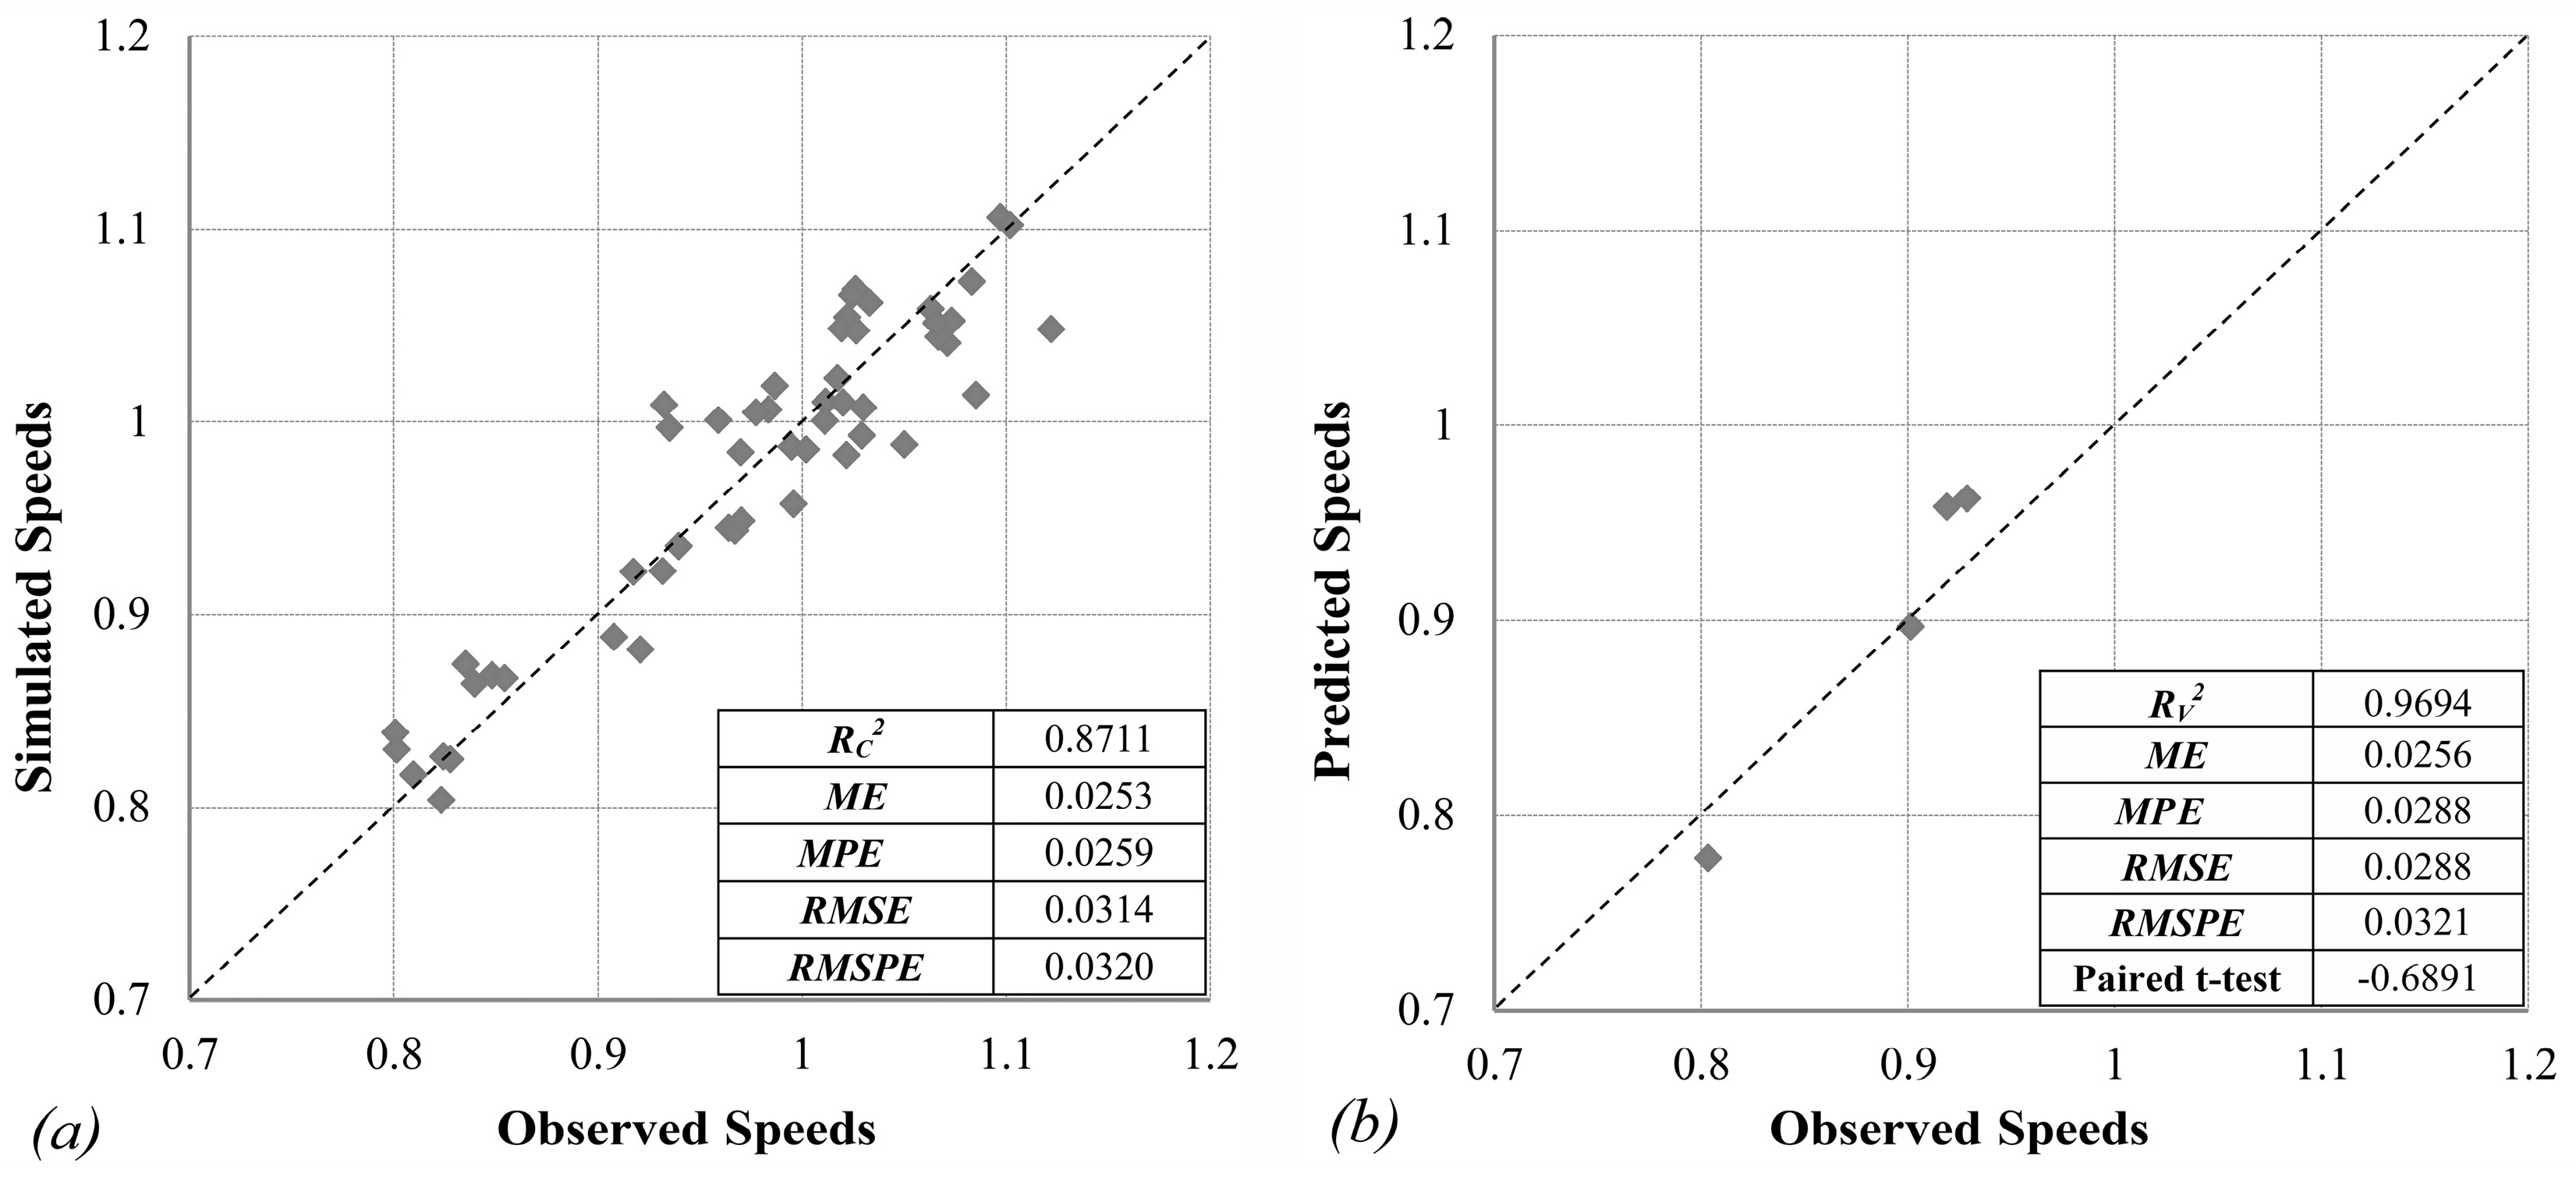
In the verification phase (with data used in construction phase) and in the validation phase (with data not used in construction phase), simulated and predicted speeds, respectively, are plotted against the observed speeds and a comparison was done. Two set of speeds have a good agreement if they lie roughly on a 45 degree line. For both phases, coefficients of determination were calculated using the square of the sample correlation between observed values and simulated and predicted values [48], respectively RC2 and RV2.
The statistical indexes were calculated to show the agreement between observed and simulated data and between observed and predicted data.
In these phases, to evaluate the global performance of models and so to quantify the global error, goodness of fit measures was used: the Mean Error, ME; the Mean Percent Error, MPE; Root Mean Squared Error, RMSE; and the Root Mean Squared Percent Error, RMSPE.
Information about the magnitude of the error relative directly to the mean measurement are provided by percent error measures. With RMSE and RMSPE, large errors at the higher rate relative to small error are penalized; while with ME and MPE, the existence of systematic under- or over- prediction in the simulated measurements are indicated [49].
Moreover, in validation phase, as measure of statistical validation, a paired t-test was performed. This provides confidence in the accuracy of models forecast. According with Dhamaniya and Chandra [50], the paired t-test between observed speeds (not used in construction phase) and predicted speeds was done. The value of t-statistics t0, based on observed speeds, has been calculated. From the table of the standard t-distribution for 5% significance level at 3 degree freedom the critical value, equal to 3.18, has been obtained. So, if the t-statistic t0 is lower than the corresponding critical value, there is not statistically significant difference between observed and predicted data.
The construction and verification phases, in partial models, have always 52 observations while the validation phase have 4 observations at a time. If all these models, provided good results in all phases (construction, verification and validation), then, using all sidewalks, a global model can be estimated using 56 observations; in this case the validation phase is not necessary.
In this way, for each excluded sidewalk, various statistical indexes, parameters and their confidence limits showed the pedestrian behavior while, with the global model, the result is generalized. Analysis of residuals of the global model was performed.
In the case study, for each model, parameters had a level of significance much lower than 0.05 and the test-t suggested that these were very effective on models except for the parameter β0 (intercept).
If the inclusion of the intercept provide uncertainty, some diagnostic tools can help to understand. First, to determine whether the intercept is significant by test the null hypothesis H0:b0 = 0 using the Student’s t statistic (or the p-value) on the regression; second, comparing standard errors of regressions with and without the intercept to decide which of these provides a superior fit [13].
The coefficients of determination, for regressions with and without intercept, may alter adjusted R2 and the F statistic while the standard error of the regression is not altered. So, coefficients of determination RC2 and RV2 provide an interpretable measure of the quality of models; but this does not help in comparing the models with or without intercept [49].
Finally, to detect the multicollinearity, the Variance Inflation Factors, VIFi, for every βi parameters were calculated. VIFi = 1 indicates that variable Xi is uncorrelated with the others, when VIFi > 2 it already indicates a sufficiently level of multicollinearity [51]; various authors maintain that, in practice, a severe multicollinearity problem exists if VIFi > 10 for βi [52]. Other authors are stricter and consider the existence of serious problems with multicollinearity when VIF = 5.
It is obvious that a polynomial form brings with it problems of multicollinearity inherent in the polynomial form; in the study, the variable “age class” is included in models in polynomial form, therefore its VIF will be more than 10, while other variables will be excluded when VIF > 5.
6. Results
The study of the relationship between mean individual pedestrian speed Smip and other independent variables was carried out in successive steps.
- (a)
- Initially Smip was compared with the variable age class A. For this relationship, all the partial models were constructed, obtaining R2 variable between 0.5448 and 0.6117. Best outcomes were found using the same variables but esteeming age class in polynomial form. In fact, all partial models had R2 variable between 0.653 and 0.721.
- (b)
- Then, Smip was compared with the variables global number of pedestrians PN, pedestrian density PD, age class A and square age class A2. Excluding one sidewalk at a time, all partial models provided appreciable results in construction and in verification phase, but in validation phase they did not provide satisfactory outcomes and the paired t-test showed statistically significant difference between the two data sets.
- (c)
- Then, Smip was compared with the variables flow rate per unit width PFW, pedestrian density PD, age class A and square age class A2. Also in this case, validation phase did not provide statistically good outcomes, as in step (b).
- (d)
- For this reason, to describe the condition in which the individual pedestrian walks among others, the mean walking speed for each sidewalk Smw was used. Smip was compared with the variables Smw and square age class A2. In construction phase, all partial models provided appreciable outcomes (0.8312 ≤ R2 ≤ 0.8600), as well as in verification phase (0.7972 ≤ RC2 ≤ 0.8373). In validation phase, not all statistical indexes provided satisfactory outcomes, even if the paired t-test did not show statistically significant difference between the two data sets. To better understand, Table 4 shows the obtained outcomes:
- (e)
- With the same variables, very similar outcomes were obtained with partial models constructed imposing the parameter β0 = 0.
From the analysis of the obtained outcomes of the above steps, it was clear that the best indexes to understand pedestrian behavior were Smw, A and A2.
So, it was decided to construct models with mean individual pedestrian speed Smip as dependent variable and mean walking speed Smw, age class A and square age class A2 as independent variables because all models had stronger predictive power and provided good outcomes in construction, verification and validation phase.
As written before, to consider or not the intercept β0 doesn’t change the outcomes, so it was decided to analyze the two cases.
- (a)
- In all partial models with β0 ≠ 0, the variables parameters had a level of significance much lower than 0.05 and the test-t suggested variables were very effective on the model except for the parameter β0 (intercept) that was not very effective on the global model.In verification and validation phases, the observed and estimated speeds have good agreement; in fact, they roughly lie on a 45 degree line; this agreement is confirmed by coefficients of determination RC2 and RV2; moreover, the others statistical indexes were small. In validation phase, the paired t-test did not show statistically significant difference between two data sets.Similar results are confirmed also for the global model. All parameters of the global model were always within the confidence interval of the corresponding parameters of partial models.
- (b)
- Then it was imposed β0 = 0 and new partial models were constructed excluding one sidewalk at a time to compare standard errors.To better understand, the case of one partial model, obtained by excluding the sidewalk of Via Contini RH, is reported as an example. Table 5 shows the outcomes of the construction phase of the model, reporting the regression statistics and ANOVA. Figure 5a,b report the comparison between the observed and simulated datasets and between observed and predicted dataset in the verification and validation phase.This partial model is:Smip = 1.0164 Smv + 0.0820 A − 0.0287 A2
Similar results were obtained excluding other sidewalks, one at a time and imposing β0 = 0. All partial models with β0 = 0 had standard errors lower than standard errors of correspondent partial models with β0 ≠ 0 even if they had the same trend.
Variables parameters always had a level of significance much lower than 0.05 and the test-t showed that variables were very effective on the model.
The comparison between “Observed Speed−Predicted Speed” and “Observed Speed−Simulated Speed” showed a good agreement; in fact, they roughly lie on a 45 degree line; this fact is also confirmed by coefficients of determination RC2 and RV2.
ME, MPE, RMSE and RMSPE were low both in verification phase and in validation phase, moreover, in validation phase, the paired t-test did not show statistically significant difference between two data sets.
Thus, using all the sidewalk data at the same time, a global model was constructed, imposing β0 = 0, to generalize the behavior pattern:
Smip = 1.0158 Smv + 0.0797 A − 0.0279 A2
Table 6 reports the regression statistics and Anova of the global model (3).
As said before, Variance Inflation Factor (VIF) is calculated to detect multicollinearity. VIF value of mean walking speed is less than 10: these indicates that no collinear variables are present in the model. VIF values for A and A2 are greater than 10, as expected. In fact, a polynomial form brings with it problems of multicollinearity inherent in the polynomial form. Table 7 reports VIFi of the global model (3).
The global model had the same trend of the partial models. The global model with β0 = 0 had the standard error lower than the standard error of the global model with β0 ≠ 0.
Single variables parameters always had a level of significance much lower than 0.05 and so the test-t suggested variables were very effective on the model.
Also in this case, parameters of the global model were always within the confidence interval of the correspondent parameters of models constructed excluding one sidewalk at a time (partial models).
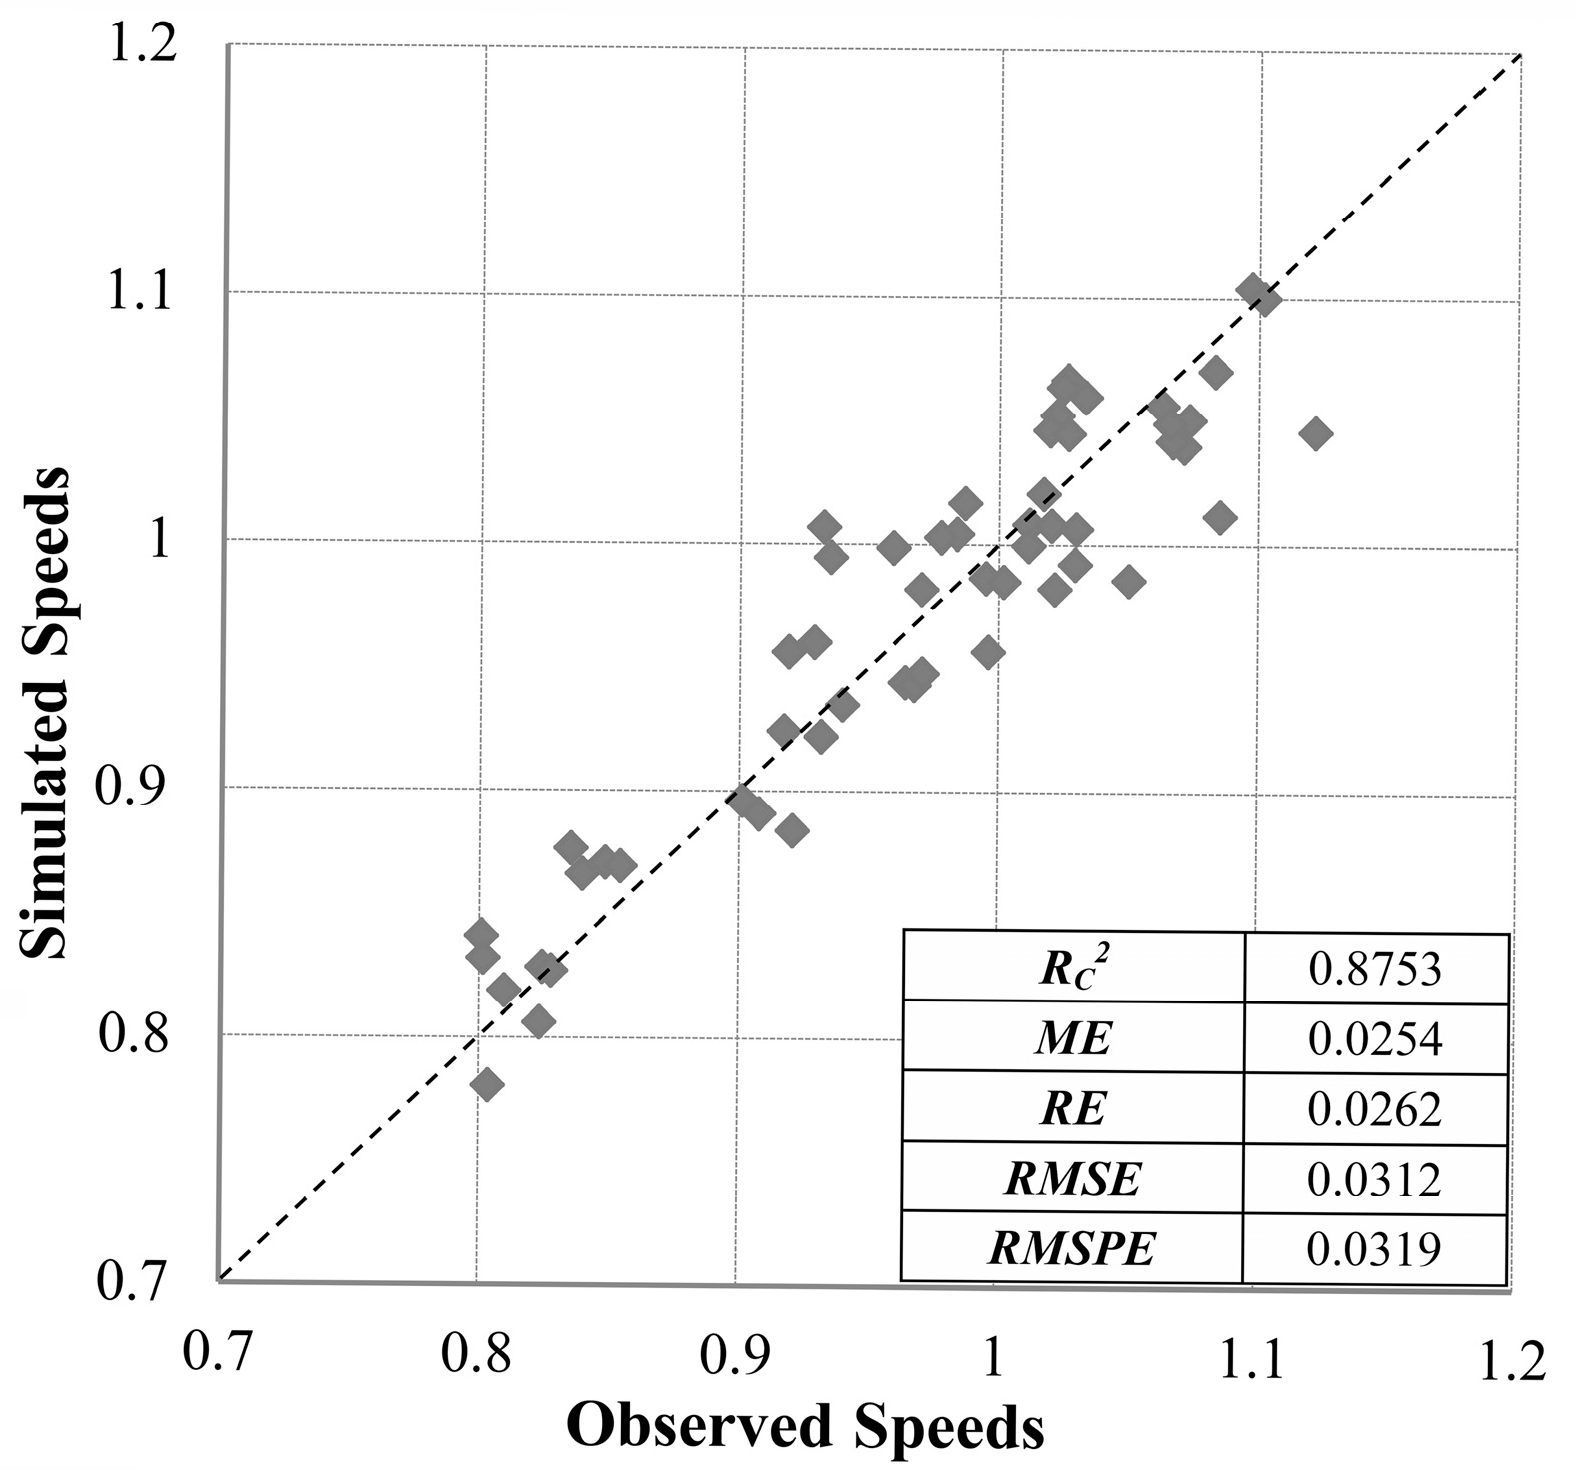
In addition, the observed and simulated values have good agreement; in fact, they roughly lie on a 45 degree line (Figure 6), demonstrating a linear relationship between the observed and simulated space mean speeds.
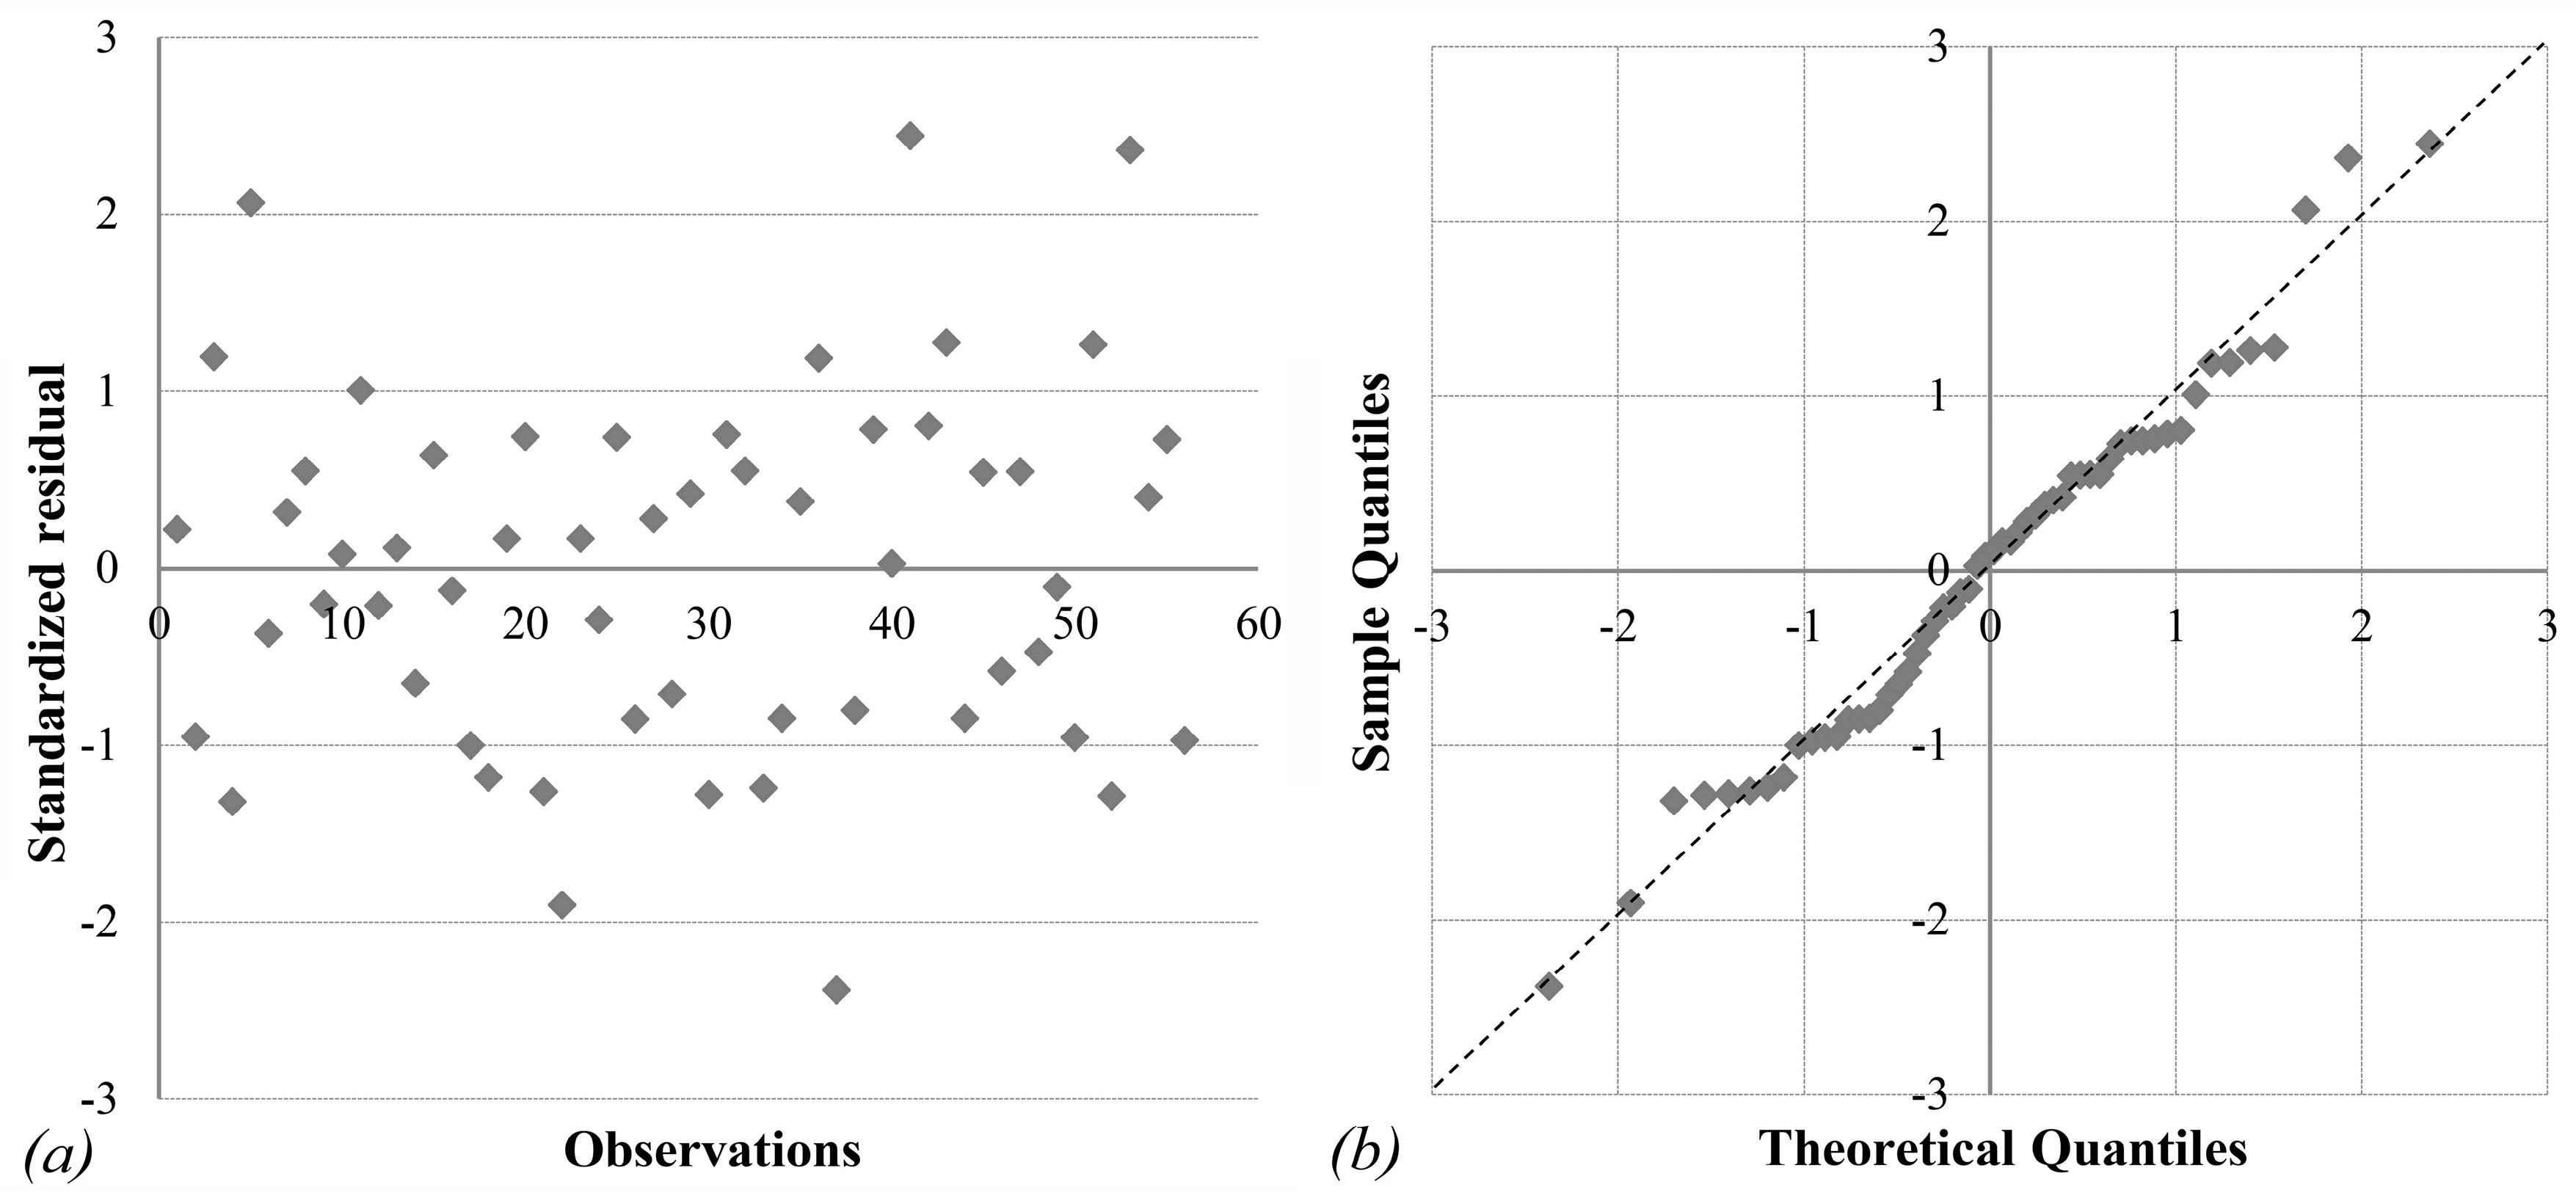
The analysis of the dispersion diagrams of the residues according to both the predicted values and the time confirm that linearity, homoschedasticity and independence are respected since, as shown in Figure 7a, the points are arranged randomly on a homogeneous area.
The last check performed to test the normality of residues is represented by the QQ-plot graph. As it can be seen in Figure 7b, the residual values are arranged along the bisector, therefore it can be deduced that the check of normality is valid.
In conclusion, the model is:
where Smip is the mean individual pedestrian speed; Smv is the mean walking speed; A is the age class.
Smip = 1.0158 Smv + 0.0797 A − 0.0279 A2
7. Conclusions
The general purpose of the authors research is to investigate the pedestrian behavior and the relative factors influencing them. All these factors could be related to their physical state, to the characteristics of pedestrian flow or to infrastructures conditions. When these aspects are not in good conditions, for many people it can be impossible to freely move towards their desired destinations. In fact, as said in the Introduction, every movement begins and finishes with a walking section. The lack of accessibility or usability of these spaces makes inaccessible any other sustainable and accessible transportation system. Therefore, it is possible to speak about city sustainability only if pedestrian space is designed and constructed considering how people move and what are the limiting factors.
The focus of this paper is to examine pedestrian behavior on sidewalks to find relationship between walking speed and age, deepening studies and research already developed by many researchers and by the authors. This relationship is investigated using the mean individual pedestrian speed, caused by interaction among participants, relationship which takes in account the pedestrian behavior and the relative factors influencing them. These factors could be related to their physical state, to the characteristics of pedestrian flow or to infrastructure conditions. In this study it was focalized the attention on parameters linked to the characteristics of pedestrian flow (such as pedestrians speed, number, flow, density); the reference was always the individual pedestrian, a user not walking alone but within a pedestrian flow. The choice of the survey area and roads has ensured similar infrastructure conditions for all users. Certainly, the literature review indicates many other influencing factors (e.g., gender, education, baggage and facility walkability), but authors choice was to focus on the parameters above described. In fact, among those parameters, some were out of the survey type (e.g., education, psycho physical state, detectable only with a questionnaire), others appeared in small numbers to allow their statistical analysis (e.g., baggage, disabilities, pushchairs). The choice of roads and sidewalks allowed to have similar condition for facility walkability and infrastructures. For gender, authors just studied the influence of gender findings also valid models with this variable. Gender is normally used as a dummy variable (variable that takes on value 0 or 1, depending on whether a given condition is satisfied or not), so model is practically for one gender depending on the value given to male and female. Beyond all this depending on a precise choice of authors, another very important factor in statistical analysis must also be considered. Introducing many variables in an analysis could be a serious problem, on a statistical level. In fact, the model becomes too complex and it becomes difficult to interpret the results. Parameter estimates become very unstable and more parameters are inserted, more observations are needed to estimate them. It would then be necessary to understand the relationships between all the variables, excluding variables that are very correlated with each other because if two variables are very correlated, then the information of one is almost completely contained in the other.
For this reason, this paper investigates only a few aspects (as many other studies), to understand pedestrian behavior. To achieve this, fourteen sidewalks in shopping area of Oristano downtown were examined.
The first consideration on this study is that the general analysis of the dataset shows how speed varies with age: as age grows, speed decreases. Significant variations of mean individual pedestrian speed with respect to age were found. About the relationship between speed and age, results show that speed varies from 1.04 m/s of class Young to 0.84 m/s of class Older with a total difference of 19.2%. This result was expected as many other studies found the same. The difference, and therefore the novelty, is the choice of speed. In fact, unlike other studies, instead to define and use the speed of an isolated pedestrians (a user walking alone) or of groups of pedestrians, the speed of an individual pedestrian has been used. An “individual pedestrian” is a user not walking alone but within a pedestrian flow. The founded differences of speed are very important, and the general analysis shows that the mean individual pedestrian speed is always lower than others. This fact is linked to influence that a pedestrian flow exerts on the individual, who is not free to choose how to move.
Starting from this result, we tried to understand if there was a statistical relationship among some parameters.
Literature review and analysis show that there are many factors affecting behavior, but when I consider a user within a pedestrian flow, two variables have proved to be statistically useful to understand the phenomenon: the first is user age and the second is the mean walking speed of the overall flow.
The first part of the statistical analysis shows that pedestrian behavior is complicate to understand because there are many reasons and interactions affecting their moving, that is characterized by many factors, above all, the interactions with other pedestrians, the characteristics of the path and the walk skill. Among all these, factors influencing the interactions were studied. The methodology used is the Cross-Validation, in which a single sidewalk dataset for time were excluded; with the remaining data a behavioral model was constructed (named the partial model); later, with the dataset excluded from the construction phase, each model is verified using regression statistics and analysis of variance and, then, validated. All partial models obtained good outcomes, and, for this reason, it was constructed, verified and validated a global model with all the sidewalks.
Statistical analysis shows the following outcomes.
Initially the mean individual pedestrian speed was compared with the variable age class A. Best outcomes were found using age class in polynomial form.
With age class in polynomial form and the global number of pedestrians, the pedestrian density and the flow rate per unit width, even if often used in other studies (above all density), models were statistically not relevant. In fact, all partial models provided appreciable results in construction and in verification phase, but in validation phase they did not provide satisfactory outcomes and the paired t-test showed statistically significant difference between the two data sets. For this reason, they have been discarded.
Subsequently, the mean individual pedestrian speed was compared with the mean walking speed for each sidewalk and square age class. In construction and verification phase, all partial models provided appreciable outcomes. In validation phase, not all statistical indexes provided satisfactory outcomes, even if the paired t-test did not show statistically significant difference between the two data sets. So, it was decided to construct models with mean individual pedestrian speed as dependent variable and mean walking speed, age class and square age class as independent variables: all partial models had stronger predictive power and provided good outcomes in construction, verification and validation phase. Best outcomes were obtained imposing the intercept β0 = 0. Thus, using all the sidewalk data at the same time, a global model was constructed, imposing β0 = 0, to generalize the behavior pattern. On this model, all the statistical tools of verification and validation were used, with good and positive outcomes.
The mean walking speed proved to be important because it collects several factors such as the interaction between pedestrians (sidewalks more or less crowded) and sidewalk characteristics (width, gradient, etc.). The age class provides information about pedestrian physical characteristics and therefore their skill to walk.
The Cross Method allows to obtain a global model with all the dataset from the survey. The model shows that the mean individual pedestrian speed increases with the mean walking speed while the contribution of age decreases with the increase of the same. The results confirm that, when a citizen walks on the sidewalk surrounded by other pedestrians, his/her freedom to choose route and speed is very influenced by their presence in his/her immediate proximity.
Furthermore, the analysis of the whole dataset allowed to highlight another aspect. From the survey campaign and the subsequent analyzes, it has been obtained that, in the case of the city of Oristano, the mean walking speed varies between 0.89 and 1.03 m/s; these values are probably related to inadequate sidewalks design. The mean isolated pedestrian walking speed for adults varies between 0.92 and 1.10 m/s, while that for older pedestrians varies between 0.80 and 0.92 m/s; it is important to underline that these speeds are certainly lower than the free flow speed indicated by HCM 2010 [4] for the same age classes (1.5 m/s for adults and 1.00 or 1.35 m/s for elderly people). Free-flow speed is defined as the speed that occurs when density and flow are zero. In this condition, it overlaps with the mean isolated pedestrian walking speed.
All tests carried out during the model construction phase have shown that age has a great influence on pedestrian behavior, but its relevance is greater if we use age class in polynomial form providing more encouraging results.
There are limitations in the present study. The study was conducted in a restricted area (city downtown) and only during the week end. The authors are conscious that the independent variable, mean walking speed, involves a combination of factors influencing observations but also noted that mean walking speed have good agreement with interactions both between pedestrians and pedestrians-environment. On the other hand, the use of other variables in the model or their substitution with others did not give good results during the validation phase.
The study treats pedestrian speed and a certain number of factors influencing it. Psychological and physical characteristics of users (gender, health status, walking skills, tiredness) are not objects of study, as well as the characteristics of environmental (built environmental factors such as accessibility, land use and activities in streets, quality of pavements which, however, is average). On the other hand, it is recalled that introducing many variables in a statistical analysis could be a serious problem because the model becomes too complex and it becomes difficult to interpret the results and parameter estimates become very unstable.
The research, deliberately, does not consider pedestrian speed in free flow. In fact, this can be considered an ideal condition, above all where pedestrian flow is numerically important. A pedestrian inevitably interacts with other pedestrians (hardly in a shopping area a pedestrian does not interact with others), and this provides a particular condition of real behavior.
In conclusion, the paper studied the mean individual pedestrian speed and its relationship with age and mean walking speed, finding statistical models able to interpret pedestrian behavior; the choice of the mean individual pedestrian speed as dependent variable is the novelty of the study because analyzes a real condition. In fact, the most common case is that of a pedestrian walking within a flow, and not alone. This is an element distinguishing this study from many others.
It is necessary to underline this aspect because many efforts have been made all over the world to promote sustainable mobility. Walking is one of the most important aspect of sustainability, so we will aspect an increase of the number of new walking citizens. But it is necessary to consider how population is growing, with a growing number of senior citizens. It is for these users that we will have to plan in the future.
Results of this study will help to improve research in this area and future results could be useful to plan and to design pedestrian infrastructures and could also be applied to other cities with similar characteristics to verify the real transferability of the model.
Author Contributions
R.M. organized and realized the survey. He also built and analyzed the dataset. F.P. conceived the research idea, the method application, the development of the case study and the statistical modeling work. All authors wrote the paper.
Funding
This research received no external funding.
Conflicts of Interest
The authors declare no conflict of interest.
References
- Goodman, R.W. Whatever You Call it, Just Don’t Think of Last Mile Logistics, Last. Glob. Logist. Supply Chain Strateg. 2005, 9, 84–86. [Google Scholar]
- Mineta Transportation Institute. Using Bicycles for the First and Last Mile of a Commute; MTI Report #S-09-02; Mineta Transportation Institute: San Jose, CA, USA, 2009. [Google Scholar]
- Federal Highway Administration. Lesson 8: Pedestrian Characteristics; University Course on Bicycle and Pedestrian Transportation, Publication No. FHWA-HRT-05-133; Research, Development, and Technology Turner-Fairbank Highway Research Center: McLean, VA, USA, 2006.
- Al-Masaeid, H.R.; Al-Suleiman, T.I.; Nelson, D.C. Pedestrian Speed Flow Relationship for Central Business Areas in Developing Countries. Transp. Res. Rec. 1993, 1396, 69–74. [Google Scholar]
- Sarsam, S.; Abdulameer, M. Evaluation of pedestrians walking speeds in Baghdad city. J. Eng. 2014, 20, 1–9. [Google Scholar]
- Rahman, K.; Ghani, N.A.; Kamil, A.A.; Mustafa, A. Analysis of pedestrian free flow walking speed in a least developing country: A factorial design study. Res. J. Appl. Sci. Eng. Technol. 2012, 4, 4299–4304. [Google Scholar]
- Nazir, M.I.; Al Razi KM, A.; Hossain, Q.S.; Adhikary, S.K. Pedestrian flow characteristics at walkways in Rajshahi Metropolitan City of Bangladesh. In Proceedings of the 2nd International Conference on Civil Engineering for sustainable Development (ICCESD-2014), Khulna, Bangladesh, 14–16 February 2014; ISBN 978-984-33-6373-2. [Google Scholar]
- Finnis, K.K.; Walton, D. Field observations of factors influencing walking speed. In Proceedings of the 2nd International Conference Proceedings on Sustainability Engineering and Science, Auckland, New Zealand, 21–23 February 2007; Available online: http://www.thesustainabilitysociety.org.nz/conference/2007/papers/FINNIS-Factors%20influencing%20walking%20speeds.pdf (accessed on 10 February 2015).
- Transportation Research Board of the National Academies. TRB HCM 2010, Highway Capacity Manual; 500 Fifth Street: Washington, DC, USA, 2010; ISBN 978-0-309-160773. [Google Scholar]
- Banerjee, A.A.K.; Maurya, L.G. A review of pedestrian flow characteristics and level of service over different pedestrian facilities. Collect. Dyn. 2018. [Google Scholar] [CrossRef]
- Montufar, J.; Arango, J.; Porter, M.; Nakagawa, S. Pedestrians’ normal walking speed and speed when crossing a street. Transp. Res. Rec. J. Transp. Res. Board 2007, 90–97. [Google Scholar] [CrossRef]
- Rastogi, R.; Ilango, T.; Chandra, S. Design implications of walking speed for pedestrian facilities. J. Transp. Eng. 2010, 137, 687–696. [Google Scholar] [CrossRef]
- Alhajyaseen, W. Pedestrian Speed at Signalized Crosswalks; Analysis and Influencing Factors. Int. J. Eng. Manag. Econ. 2015, 5, 258–272. [Google Scholar] [CrossRef]
- Himann, J.E.; Cunningham, D.A.; Rechnitzer, P.A.; Paterson, D.H. Age-related changes in speed of walking. Med. Sci. Sports Exerc. 1988, 20, 161–166. [Google Scholar] [CrossRef]
- Zakaria, J.; Ujang, N. Comfort of walking in the city center of Kuala Lumpur. Procedia Soc. Behav. Sci. 2015, 170, 642–652. [Google Scholar] [CrossRef]
- Corbetta, A.; Meeusen, J.; Lee, C.; Benzi, R.; Toschi, F. Physics-based modeling and data representation of pedestrian pairwise interactions. arXiv, 2018; arXiv:1808.02466. [Google Scholar]
- Sharifi, M.S.; Stuart, D.; Christensen, K.; Chen, A. Exploring traffic flow characteristics and walking speeds of heterogeneous pedestrian stream involving individuals with disabilities in different walking environments. In Proceedings of the Annaul Meeting of the Transportation Research Board, Washington, DC, USA, 11–15 January 2015. [Google Scholar]
- Rungta, A.; Sharma, S. Effects of various parameters on pedestrian characteristics in hilly urban area. J. Adv. Res. Civ. Environ. Eng. 2016, 3, 7–23. [Google Scholar]
- Kotkar, K.; Rastogi, R.; Chandra, S. Pedestrian flow characteristics in mixed flow conditions. J. Urban Plan. Dev. ASCE 2010, 136, 23–33. [Google Scholar] [CrossRef]
- Fitzpatrick, K.; Brewer, M.; Turner, S. Another look at pedestrian walking speed. Transp. Res. Rec. 2006, 1982, 21–29. [Google Scholar] [CrossRef]
- Das, P.; Parida, M.; Katiyar, V. Analysis of interrelationship between pedestrian flow parameters using Artificial Neural Network. J. Mod. Transp. 2015, 23, 298–309. [Google Scholar] [CrossRef]
- Arshad, A.K.; Bahari, N.I.; Hashim, W.; Halim, A.A. Gender differences in pedestrian perception and satisfaction on the walkability of Kuala Lumpur city center. In Proceedings of the 3rd International Conference on Civil and Environmental Engineering for Sustainable (IConCEES), Melaka, Malaysia, 1–2 December 2015; Volume 47. [Google Scholar] [CrossRef]
- Caputcu, M.; Sengoz, B.; Ozuysal, M.; Tanyel, S.; Kaplan, S.; Karabayir, A. Use of Laser Measurements and Video Images to Investigate Pedestrian Movement Along Non-Uniform Sidewalks. In Proceedings of the World Congress on Civil, Structural, and Environmental Engineering (CSEE’16), Prague, Czech Republic, 30–31 March 2016. [Google Scholar] [CrossRef]
- Zaki, M.H.; Sayed, T. Automated Analysis of Pedestrian Group Behavior in Urban Settings. IEEE Trans. Intell. Transp. Syst. 2018, 19, 1880–1889. [Google Scholar] [CrossRef]
- Azmi, D.I.; Karim, H.A.; Amin, M.Z.M. Comparing the Walking Behaviour between Urban and rural resident. Procedia Soc. Behav. Sci. 2012, 68, 406–416. [Google Scholar] [CrossRef]
- Al-Azzawi, M.; Raeside, R. Modeling pedestrian walking speeds on sidewalks. J. Urban Plan. Dev. 2007, 133, 211–219. [Google Scholar] [CrossRef]
- Murrau, R.; Pinna, F. Pedestrian behavior in urban area. In Proceedings of the Second International Conference on Traffic and Transport Engineering—ICTTE, Belgrade, Serbia, 27–28 November 2014; pp. 772–779, ISBN 978-86-916153-1-4. [Google Scholar]
- Pinna, F.; Murrau, R. Isolated and Single Pedestrians and Pedestrian Groups on Sidewalks. Infrastructure 2017, 2, 21. [Google Scholar] [CrossRef]
- Satish, C.; Rajat, R.; Vivek, R.D.; Ilango, T. Pedestrian behaviour under varied traffic and spatial conditions. Eur. Transp. 2014, 56, 5. [Google Scholar]
- Bargegol, I.; Gilani, V.N.M.; Jamshidpour, F. Modeling pedestrian flow at central business district. J. UMP Soc. Sci. Technol. Manag. 2015, 3, 223–229. [Google Scholar]
- Rastogi, R.; Ilango, T.; Chandra, S. Pedestrian flow characteristics for different pedestrian facilities and situations. Eur. Transp. 2013, 53, 1–21. [Google Scholar]
- Tarawneh, M.S. Evaluation of pedestrian speed in Jordan with investigation of some contributing factors. J. Saf. Res. 2001, 32, 229–236. [Google Scholar] [CrossRef]
- Pachi, A.; Ji, T. Frequency and velocity of people walking. Struct. Eng. 2005, 84, 36–40. [Google Scholar]
- Chandra, S.; Bharti, A.K. Speed distribution curves for pedestrians during walking and crossing. Procedia Soc. Behav. Sci. 2013, 104, 660–667. [Google Scholar] [CrossRef]
- Tahsin Emtenan, A.M. Showkat Ibne Shahid, Pedestrian Flow Characteristics Under Heterogeneous Traffic Conditions. Am. J. Civ. Eng. 2017, 5, 282–292. [Google Scholar] [CrossRef]
- Pritikana Das Parida, M.; Katiyar, V.K. Review of Simulation techniques for microscopic mobility of pedestrian movement. Trends Transp. Eng. Appl. 2014, 1, 27–45. [Google Scholar]
- Torres-Ruiz, M.; Moreno-Ibarra, M.; Alhalabi, W.; Quintero, R.; Guzmán, G. Towards a microscopic model for analyzing the pedestrian mobility in an urban infrastructure. J. Sci. Technol. Policy Manag. 2018, 9, 170–188. [Google Scholar] [CrossRef]
- Willis, A.; Gjersoe, N.; Havard, C.; Kerridge, J.; Kukla, R. Human movement behaviour in urban spaces: Implications for the design and modelling of effective pedestrian environments. Environ. Plan. B Plan. Des. 2004, 31, 805–828. [Google Scholar] [CrossRef]
- Tordeaux, A.; Lammel, G.; Hanseler, S.; Steffen, B. A mesoscopic model for large-scale simulation of pedestrian dynamics. Transp. Res. Part C Emerg. Technol. 2018, 93, 128–147. [Google Scholar] [CrossRef]
- Daamen, W.; Hoogendoorn, S. Experimental Research of Pedestrian Walking Behavior. Transp. Res. Rec. 2003, 1828, 20–30. [Google Scholar] [CrossRef]
- Hughes, R.L. A Continuum Theory for the Flow of Pedestrians. Transp. Res. Part B 2002, 36, 507–535. [Google Scholar] [CrossRef]
- Lam, W.H.; Cheung, C.Y. Pedestrian Speed/Flow Relationships for Walking Facilities in Hong Kong. J. Transp. Eng. ASCE 2000, 126, 343–349. [Google Scholar] [CrossRef]
- Iryo-Asano, M.; Alhajyaseen, W.K.M. Modeling pedestrian crossing speed profiles considering speed change behavior for the safety assessment of signalized intersections. Accid. Anal. Prev. 2017, 108, 332–342. [Google Scholar] [CrossRef] [PubMed]
- Liu, Z.; Wang, X.; Wang, J.Q.; Wang, F.; Liu, Y.; Wang, J.H. Pedestrian movement intention identification model in mixed pedestrian-bicycle sections based on phase-field coupling theory. Adv. Mech. Eng. 2018, 10, 1–14. [Google Scholar] [CrossRef]
- Xie, S.Q.; Wong, S.C.; Lam, W.H.K. A Bayesian modeling approach to bi-directional pedestrian flows in carnival events. Front. Eng. 2017, 4, 483–489. [Google Scholar] [CrossRef]
- Bosina, E.; Ulrich, W. Creating a generic model of the pedestrian fundamental diagram. In Proceedings of the 18th Swiss Transport Research Conference, Ascona, Switzerland, 16–18 May 2018. [Google Scholar] [CrossRef]
- Montgomery, D.C.; Runger, G.C.; Hubele, N.F. Statistica per Ingegneria; EGEA: Milano, Italia, 2012; ISBN 978-88-238-2149-1. [Google Scholar]
- Eisenhauer, J.G. Regression through the Origins. Teach. Stat. 2003, 25, 76–80. [Google Scholar] [CrossRef]
- Toledo, T.; Koutsopoulos, H.N. Statistical Validation of Traffic Simulation Models. Transp. Res. Rec. J. Transp. Res. Board 2004, 1876, 142–150. [Google Scholar] [CrossRef]
- Dhamaniya, A.; Chandra, S. Speed Prediction Models for Urban Arterials under Mixed Traffic Conditions. Procedia Soc. Behav. Sci. 2013, 104, 342–351. [Google Scholar] [CrossRef]
- Borra, S.; Di Ciaccio, A. Statistica, Metodologie Per Le Scienze Economiche e Sociali; McGraw Hill: Milano, Italy, 2004; ISBN 88-386-6162-6. [Google Scholar]
- Mendenhall, W.; Sincich, T. A Second Course in Business Statistics: Regression Analysis, 4th ed.; Dellen: New York, NY, USA; Maxwell Macmillan: Toronto, ON, Canada, 1993; ISBN 0-02-380520-X. [Google Scholar]
Figure 1.
Dataset statistical analysis. Methodology.

Figure 2.
Effect of the age class on mean speed of individual pedestrians.

Figure 3.
Comparison among mean walking speed (1 = young; 2 = adult; 3 = middle-age adult; 4 = older).
Figure 3.
Comparison among mean walking speed (1 = young; 2 = adult; 3 = middle-age adult; 4 = older).

Figure 4.
Flowchart. Methodology steps.

Figure 5.
Partial model excluding sidewalk of via Contini RH with β0 = 0; (a) Verification phase; (b) Validation phase with relative statistical indexes.
Figure 5.
Partial model excluding sidewalk of via Contini RH with β0 = 0; (a) Verification phase; (b) Validation phase with relative statistical indexes.

Figure 6.
Global model with β0 = 0; Comparison between observed and simulated speeds and relative statistical indexes.
Figure 6.
Global model with β0 = 0; Comparison between observed and simulated speeds and relative statistical indexes.

Figure 7.
Global model with β0 = 0. Diagnostic: (a) Standardized residual; (b) Normal Q-Q plot of standardized residuals.
Figure 7.
Global model with β0 = 0. Diagnostic: (a) Standardized residual; (b) Normal Q-Q plot of standardized residuals.


Table 1.
General sidewalk characteristics.
| Sidewalks | Side | Width [m] | Mean Walking Speed [m/s] | Pedestrian Volume | Park |
|---|---|---|---|---|---|
| Via Contini | RH | 0.95 | 0.89 | 556 | No |
| Via Contini | LH | 0.95 | 0.94 | 346 | Yes |
| Via Figoli | RH | 1.10 | 0.98 | 1023 | Yes |
| Via Figoli (II) | RH | 1.10 | 0.92 | 1762 | Yes |
| Via Figoli | LH | 0.80 | 1.03 | 944 | No |
| Via Mazzini | RH | 1.50 | 0.99 | 599 | Yes |
| Via Mazzini | LH | 1.45 | 1.00 | 295 | No |
| Via Mazzini (Large) | LH | 5.90 | 0.98 | 804 | Yes |
| Via Tharros | RH | 1.55 | 0.94 | 719 | No |
| Via Tharros | LH | 1.35 | 0.93 | 1099 | Yes |
| Via Tharros (II) | LH | 1.35 | 0.98 | 1287 | Yes |
| Via Tirso | RH | 1.90 | 0.94 | 1360 | Yes |
| Via Tirso (II) | RH | 1.90 | 0.94 | 2233 | Yes |
| Via Tirso | LH | 1.90 | 0.97 | 1155 | Yes |
Table 2.
Characteristics of individual pedestrians for each field survey after data reduction (S = Speed [m/s]; SD = Standard Deviation; N = Number; M = Maximum speed; m = minimum speed).
Table 2.
Characteristics of individual pedestrians for each field survey after data reduction (S = Speed [m/s]; SD = Standard Deviation; N = Number; M = Maximum speed; m = minimum speed).
| Via Contini RH | Via Contini LH | Via Figoli RH | Via Figoli (II) RH | Via Figoli LH | Via Mazzini RH | Via Mazzini LH | Via Mazzini (L) LH | Via Tharros RH | Via Tharros LH | Via Tharros (II) LH | Via Tirso RH | Via Tirso (II) RH | Via Tirso LH | All Sidewalks | ||
|---|---|---|---|---|---|---|---|---|---|---|---|---|---|---|---|---|
| 0–18 | S | 0.93 | 1.01 | 1.06 | 1.05 | 1.10 | 1.02 | 1.08 | 1.07 | 0.93 | 0.96 | 1.07 | 1.02 | 1.09 | 1.12 | 1.04 |
| SD | 0.08 | 0.11 | 0.13 | 0.06 | 0.02 | 0.06 | 0.12 | 0.08 | 0.08 | 0.09 | 0.07 | 0.15 | 0.07 | 0.13 | 0.11 | |
| N | 16 | 5 | 35 | 28 | 12 | 6 | 2 | 8 | 18 | 18 | 37 | 8 | 29 | 12 | 234 | |
| M | 1.08 | 1.12 | 1.38 | 1.17 | 1.29 | 1.08 | 1.17 | 1.17 | 1.00 | 1.13 | 1.24 | 1.26 | 1.22 | 1.33 | 1.38 | |
| m | 0.80 | 0.82 | 0.88 | 0.92 | 0.92 | 0.93 | 1.00 | 0.90 | 0.65 | 0.79 | 0.92 | 0.86 | 0.92 | 0.92 | 0.65 | |
| 19–40 | S | 0.92 | 0.98 | 1.02 | 0.97 | 1.10 | 1.03 | 1.03 | 1.03 | 0.98 | 0.94 | 1.02 | 0.99 | 1.02 | 1.07 | 1.00 |
| SD | 0.09 | 0.13 | 0.12 | 0.06 | 0.11 | 0.08 | 0.10 | 0.09 | 0.11 | 0.11 | 0.06 | 0.13 | 0.08 | 0.15 | 0.11 | |
| N | 67 | 41 | 34 | 97 | 38 | 40 | 22 | 119 | 38 | 62 | 84 | 50 | 71 | 42 | 805 | |
| M | 1.17 | 1.33 | 1.29 | 1.10 | 1.29 | 1.17 | 1.22 | 1.27 | 1.24 | 1.24 | 1.14 | 1.41 | 1.18 | 1.41 | 1.41 | |
| m | 0.74 | 0.78 | 0.73 | 0.83 | 0.88 | 0.88 | 0.82 | 0.78 | 0.76 | 0.62 | 0.87 | 0.71 | 0.86 | 0.75 | 0.62 | |
| 41–65 | S | 0.90 | 0.96 | 1.03 | 0.93 | 1.07 | 1.01 | 1.03 | 1.00 | 0.97 | 0.94 | 0.99 | 1.00 | 0.97 | 1.02 | 0.99 |
| SD | 0.09 | 0.11 | 0.09 | 0.06 | 0.11 | 0.09 | 0.08 | 0.08 | 0.09 | 0.09 | 0.06 | 0.14 | 0.07 | 0.14 | 0.10 | |
| N | 104 | 79 | 70 | 118 | 87 | 88 | 50 | 247 | 44 | 67 | 149 | 122 | 149 | 93 | 1,467 | |
| M | 1.12 | 1.17 | 1.29 | 1.06 | 1.38 | 1.27 | 1.27 | 1.27 | 1.18 | 1.18 | 1.12 | 1.41 | 1.14 | 1.41 | 1.41 | |
| m | 0.67 | 0.74 | 0.79 | 0.71 | 0.81 | 0.78 | 0.85 | 0.78 | 0.81 | 0.72 | 0.78 | 0.60 | 0.74 | 0.73 | 0.60 | |
| >65 | S | 0.80 | 0.82 | 0.84 | 0.82 | 0.92 | 0.92 | 0.91 | 0.85 | 0.83 | 0.81 | 0.85 | 0.80 | 0.80 | 0.84 | 0.84 |
| SD | 0.07 | 0.10 | 0.11 | 0.06 | 0.13 | 0.1 | 0.1 | 0.07 | 0.08 | 0.12 | 0.06 | 0.11 | 0.07 | 0.09 | 0.10 | |
| N | 25 | 15 | 25 | 23 | 21 | 14 | 7 | 66 | 13 | 15 | 12 | 19 | 19 | 14 | 288 | |
| M | 1.00 | 1 | 1.10 | 0.96 | 1.16 | 1.04 | 1.04 | 1.02 | 0.93 | 1.00 | 0.96 | 1.00 | 0.95 | 0.96 | 1.16 | |
| m | 0.70 | 0.70 | 0.71 | 0.71 | 0.69 | 0.78 | 0.78 | 0.70 | 0.67 | 0.62 | 0.76 | 0.57 | 0.68 | 0.67 | 0.57 | |
Table 3.
Test t-student for two samples (age classes) at a time.
| 19–40 Years Old | 41–65 Years Old | >65 Years Old | ||||
|---|---|---|---|---|---|---|
| Degrees of Freedom | t-Stat | Degrees of Freedom | t-Stat | Degrees of Freedom | t-Stat | |
| P(T ≤ t) Two-Tailed | tcrit Two-Tailed | P(T ≤ t) Two-Tailed | tcrit Two-Tailed | P(T ≤ t) Two-Tailed | tcrit Two-Tailed | |
| 0–18 years old | 1037 | 4.886 | 299 | 6.887 | 463 | 21.61 |
| 2.2 × 10⁻⁶ | 1.962 | 3.37 × 10⁻¹¹ | 1.968 | 4.076 × 10−72 | 1.965 | |
| 19–40 years old | 2270 | 3.171 | 554 | 23.5998 | ||
| 0.00154 | 1.961 | 9.42 × 10−86 | 1.9642 | |||
| 41–65 years old | 1753 | 22.418 | ||||
| 4.4 × 10−98 | 1.9613 | |||||
Table 4.
Indexes values in validation phase.
| Index | Min | Max |
|---|---|---|
| RV2 | 0.5378 | 0.9473 |
| ME | 0.0172 | 0.0505 |
| MPE | 0.0183 | 0.0498 |
| RMSE | 0.0217 | 0.0527 |
| RMSPE | 0.0228 | 0.0563 |
Table 5.
Partial model excluding sidewalk of via Contini RH with β0 = 0; Regression statistics and ANOVA.
Table 5.
Partial model excluding sidewalk of via Contini RH with β0 = 0; Regression statistics and ANOVA.
| Regression Statistics | ||||||
|---|---|---|---|---|---|---|
| Multiple R | 0.9995 | |||||
| R Square | 0.9990 | |||||
| Adjusted R Square | 0.9785 | |||||
| Standard Error | 0.0324 | |||||
| Observation | 52 | |||||
| Analysis of Variance | ||||||
| Variable | df | SQ | MQ | F | Significance F | |
| Regression | 3 | 49.7654 | 16.5885 | 15803.71 | <0.0001 | |
| Residual | 49 | 0.0514 | 0.00105 | |||
| Total | 52 | 49.8168 | ||||
| Coeff. | Standard Error | t-Stat | p-Value | Lower 95% | Upper 95% | |
| Intercept | 0 | N.A. | N.A. | N.A. | N.A. | N.A. |
| Smw mean walking speed | 1.0164 | 0.025402 | 40.0358 | <0.0001 | 0.9654 | 1.0675 |
| A age class | 0.0820 | 0.0225 | 3.6495 | 0.0006 | 0.03686 | 0.1272 |
| A2 age class square | −0.0287 | 0.0044 | −6.4694 | <0.0001 | −0.03760 | −0.01980 |
Table 6.
Global model with β0 = 0; Regression statistics, ANOVA.
| Regression Statistics | ||||||
|---|---|---|---|---|---|---|
| Multiple R | 0.9995 | |||||
| R Square | 0.9990 | |||||
| Adjusted R Square | 0.9801 | |||||
| Standard Error | 0.0321 | |||||
| Observation | 56 | |||||
| Analysis of Variance | ||||||
| Variable | df | SQ | MQ | F | Significance F | |
| Regression | 3 | 52.9272 | 17.6424 | 17,415.00 | <0.0001 | |
| Residual | 53 | 0.0545 | 0.00100 | |||
| Total | 56 | 52.9818 | ||||
| Coeff. | Standard Error | t-Stat | p-Value | Lower 95% | Upper 95% | |
| Intercept | 0 | N.A. | N.A. | N.A. | N.A. | N.A. |
| Smw mean walking speed | 1.0158 | 0.0242 | 41.9138 | <0.0001 | 0.9672 | 1.0645 |
| A age class | 0.0797 | 0.0213 | 3.7337 | 0.0005 | 0.0369 | 0.1225 |
| A2 age class square | −0.0279 | 0.0042 | −6.6282 | <0.0001 | −0.0364 | −0.0195 |
Table 7.
Global model with β0 = 0; VIFi.
| Variable | VIFi |
|---|---|
| Intercept | - |
| Smw mean walking speed | 1 |
| A age class | 32.5 |
| A2 age class square | 32.5 |
© 2018 by the authors. Licensee MDPI, Basel, Switzerland. This article is an open access article distributed under the terms and conditions of the Creative Commons Attribution (CC BY) license (http://creativecommons.org/licenses/by/4.0/).
Share and Cite
MDPI and ACS Style
Pinna, F.; Murrau, R. Age Factor and Pedestrian Speed on Sidewalks. Sustainability 2018, 10, 4084. https://doi.org/10.3390/su10114084
AMA Style
Pinna F, Murrau R. Age Factor and Pedestrian Speed on Sidewalks. Sustainability. 2018; 10(11):4084. https://doi.org/10.3390/su10114084
Chicago/Turabian StylePinna, Francesco, and Roberto Murrau. 2018. "Age Factor and Pedestrian Speed on Sidewalks" Sustainability 10, no. 11: 4084. https://doi.org/10.3390/su10114084
Note that from the first issue of 2016, this journal uses article numbers instead of page numbers. See further details here.