Does the Polycentric Urban Region Contribute to Economic Performance? The Case of Korea


Urban Research Division, Korea Research Institute for Human Settlements, 5 Gukchaekyeonguwon-ro, Sejong 30147, Korea
*
Author to whom correspondence should be addressed.
Sustainability 2018, 10(11), 4157; https://doi.org/10.3390/su10114157
Submission received: 17 October 2018
/
Revised: 1 November 2018
/
Accepted: 6 November 2018
/
Published: 12 November 2018
(This article belongs to the Section Sustainable Urban and Rural Development)
Abstract
:This study aims to explore whether and to what extent two types of polycentricity, morphological and functional, affect the level of urban economic performance. In the analysis, it is found that morphological polycentricity is positively associated with the level of labor productivity whereas functional polycentricity is negatively related to it. In the context of the Korean urban system, characterized by the domination of a few cities and high levels of population density, regions which are more morphologically polycentric and functionally monocentric are likely to have higher labor productivity. These results reflect the processes of agglomeration economies and their impact on urban dynamics. This study contributes to the debates on the impacts of polycentricity on economic performance by examining this relationship in the East Asian context, not in Europe or America, and by distinguishing between effects of two types of polycentricity.
1. Introduction
In the recent years, the concept of the polycentric urban region has been widely used as a tool for enhancing urban competitiveness and reducing regional disparities across the world [1,2,3]. In particular, policy makers and urban planners in Europe have sought to promote the polycentric urban spatial structure as an urban policy agenda in the European Spatial Development Perspective [4]. Nowadays, this concept has attracted attention from East Asian countries, especially China, where several new town projects are being planned as the world-class ‘polycentric regions’ [5,6,7].
However, less is known about the relationship between the polycentric urban form and urban economic performance. This topic is still inconclusive and controversial. Meijers and Burger (2010) [8] focused on the polycentricity and dispersion of US metropolitan statistical areas and showed that the level of polycentricity was positively associated with the level of economic performance, while the concentration–dispersion index was insignificant. In the case of Italian cities, Veneri and Burgalssi (2012) [9] claimed that in Nomenclature of Territorial Units for Statistics (NUTS)-2 level regions, there were no stable correlations between polycentricity and key economic variables, even if functional polycentricity poorly affected the level and growth of labor productivity. Thus, as Parr (2004) [10] argued, a polycentric urban region cannot be treated “as an established concept, but rather as a hypothesis in need of testing”. Such an argument demonstrates the need for comparative studies on the relationship between polycentricity and economy in diverse contexts.
This study examines the relationship between a polycentric urban region and its economic performance in the context of the Korean urban system. In Korea, the national urban system is characterized by the dominance of a few larger cities, among which Seoul and its metropolitan area (including Incheon and Gyeonggi province) have half of the total population. Therefore, it is worth investigating the polycentricity-performance association in this hierarchical urban system. Conclusively, this study presents that morphological polycentricity positively affects labor productivity per capita, while functional polycentricity is negatively associated with the same. The contribution of this study is twofold. First, while there have been several empirical studies on the association between urban spatial structure and economic performance in North American and European urban contexts, only a few [5] have been conducted based on the Asian context, and most of them have been in China. Second, this study considers the differentiation of types of polycentricity. Studies on the linkages between urban form and economic performance have focused mostly on morphological polycentricity. It is an important for policy makers to decide on which type of polycentricity the policy interventions should be concentrated.
The remainder of this study is organized as follows. The next section reviews the empirical literature on whether and to what degree morphological and functional polycentricity affect economic performance in different contexts. The third section describes the data and methodology used in this study. Empirical results are presented and discussed in the fourth section. The contribution and limitations of this study are stated in the final section.
2. Literature Review
As scholars focusing on the conceptual sophistication of polycentricity have argued, this concept is essentially multi-scalar, operating on intra-urban, inter-urban, and regional scales [11,12]. The geographical scale at which the analyses are conducted for polycentric urban development obviously matters because the channels of polycentricity can improve economic performance and thus, the direction of policy implementation can be different [7,13]. At the regional scale, polycentricity can positively affect the level of regional economic performance through a “borrowed size” process. This explains how small and medium-sized cities can borrow urban functions or agglomeration economies from each other, while they do not cost agglomeration diseconomies, such as traffic congestion, noises, and environmental pollution. Thus, the New Economic Geographers have suggested that theoretically, the polycentric urban structure is an effective approach in terms of agglomeration economies.
In addition to the issue of the geographical scale of analyses, the measurements of polycentricity have also been an important issue. Generally, polycentricity has at least two dimensions, morphological polycentricity and functional polycentricity [14,15]. Conceptually, regardless of its dimensions, polycentricity commonly aims at the balanced and even distribution of population or employment and on external flows of people or goods, as shown in Figure 1.
Morphological polycentricity focuses on a more equally size-distributed urban system, such as similarly populated or employed centers. Polycentric urban regions have been created by the integration of historically separated centers with the development of transportation and communication technology [16] or by the expansion of highly populated areas into spatially separated suburban areas which have been mostly newly constructed to mitigate the agglomeration diseconomies [5]. Therefore, as mentioned before, a region with morphologically polycentric regional structure is likely to have a higher level of economic performance as this can reduce the cost of agglomeration economies.
Meanwhile, functional polycentricity emphasizes the actual flows and interactions among cities. It focuses not on the cities’ internal attributes, but on the external relations between cities. As De Goei et al. (2010) [17] have argued based on this, traditional central place theories based on size-distribution should be replaced by a network view that focuses on the actual interdependence among the spatial units, though these are very related to one another [2]. However, a functionally polycentric regional structure featuring the relatively equal distribution of interactions is not necessarily efficient. The process of a functionally monocentric structure is the process of “agglomeration shadows” [18], which is a counterpart phenomenon of borrowed size wherein a larger city absorbs the functions and economies from a nearby smaller one [19], leading to a concentration of interaction flows towards the larger city. This process can generate an agglomeration effect. Thus, the agglomeration economies may not generate enough to share the entire region if flows of people or capital are not gathered enough to reach a certain threshold for hosting a higher level of services or functions. As such, it is needed to empirically examine how these types of polycentricity affect the economic performance of cities and regions.
Although several works have attempted to examine whether and to what extent polycentricity has impacts on economic performance, the results from empirical analyses are still inconclusive. For example, Zhang et al. (2017) [7] explored the relationship between spatial structure and economic performance at the prefecture scale and, focusing on morphological dimension, argued that polycentricity positively affected the level of labor productivity. However, Li and Liu (2018) [5], who assessed the impact of urban form on productivity in the case of 306 Chinese cities, concluded that morphological polycentricity (measured by the consideration of population size and distance from the main center) is positively associated with economic performance only when the cities are highly dense. In addition, morphological and functional polycentricity are not necessarily changing in the same direction [9]. Therefore, further research is required in different contexts to form a consensus on the impact of polycentricity on economic performance.
3. Data and Methods
3.1. Defining the Functional Urban Regions
Before the analysis, it is important to define the regions. Most studies focusing on the European context have used the classification of functional urban regions (FURs) defined by an ESPON report [20], which categorized European countries into several FURs based on population size and commuting flows. Unfortunately, this kind of definition does not exist in the Korean context. Thus, it is necessary to delineate the urban regions from functional interdependence among cities.
A network community detection method is employed to delineate the FURs in Korea. Recently, some research employed the community detection method to find latent regional structures [21,22]. The reason why the network community detection approach is used to identify FURs is that there is no assumption of an arbitrarily cut-off threshold to determine which region a city belongs to. For example, a travel-to-work area approach generally utilizes 15% of commuting flows to the center as a threshold. Rather, in the community detection method, groups of cities can be automatically classified based on network structures.
Among several detection algorithms, this study utilizes the network partitioning method Infomap to find the best partitioning of the network consisting of N nodes and M modules towards minimizing the description length of a random walker in the network [23]. Compared to the modularity method initially suggested by Newman, this has higher accuracy and efficiency when the network has below 1000 nodes [24]. To find the partitions that minimize the quantity of information required to describe a random walk, the map equation (Equation (1)) is used as follows:
where M is the best partition, is the switch probability of modules for a random walker, is the entropy of between-modules, is the entropy of movement within module i, and is the probability of within-module movement. The best M partitions can be found by minimizing the map equation above [23]. To detect FURs in Korea, travel flow data—including commuting, shopping, leisure, etc.—among cities (including districts in the metropolitan cities) and counties is used from the Korea Travel Database (KTDB). This procedure is conducted on the website MapEquation (mapequation.org).
Based on the network partitioning method, the classification of FURs in Korea is represented in Figure 2. As a result, 17 regions are identified. Regions 1–5 have metropolitan cities within them, and thus are metropolitan areas. In particular, Region 1 includes two metropolitan cities, Seoul and Incheon, as well as most cities in Seoul metropolitan area (SMA) including Seoul, Incheon, and all of the cities and counties in Gyeonggi province. The rest of cities in SMA are included in Region 13, which is made up with some cities in Gangwon province. Region 8 includes only the Ulsan metropolitan city. This might be because of its proximity to Busan, the second largest city in Korea.
3.2. Measuring Polycentricity and Other Variables
Following Meijers and Burger (2010) [8], morphological polycentricity is obtained as the reverse of the absolute value of the slope in the rank–size distribution of cities in the region. This transformation is because the slope always has as negative value and, thus is unable to be log-transformed. All cities and counties in each region are used to calculate the value of the slope. The larger the value is, the more polycentric the regional spatial structure is.
The functional polycentricity is measured using a method proposed by Green (2007) [15], indicating how equally distributed the flows among cities are in the region. The equation of generalized functional polycentricity (Equation (2)) is as follows:
where is the generalized functional polycentricity that is the mean of functional polycentricity in special network distributions, is the in-degree centrality distribution, and is the out-degree centrality distribution. In Equation (3), is the standard deviation of in- or out-degree centrality among cities in the same region, and is the theoretically highest standard deviation of in- or out-degree centrality among cities. In Equation (4), is the number of links among cities in the same region and is the theoretically maximum number of links in the network. If the functional polycentricity is close to 1, the distribution of the functional interactions is more balanced, thus more polycentric. To calculate functional polycentricity, the data used to define the regions is also employed. The two types of polycentricity variables are calculated at the regional scale.
3.3. Regression Model and Control Varibles
Following previous literature [5,7,8], the Cobb–Douglas production function is used to derive the specification of labor productivity. The aggregate production function with labor (L), capital (K), and total factor productivity (A) is shown in Equation (6) and is divided by the labor and log-transformed in Equation (7):
where total factor productivity (A) consists of human capital (H), population size (P), morphological polycentricity (MPOLY), and functional polycentricity (FPOLY).
The dependent variable, labor productivity, is measured as the gross regional domestic product divided by the number of jobs in 2015. These data are obtained from the Korea Statistical Information Service (KOSIS). The capital–labor ratio is calculated by the amount of fixed capital per labor unit. The amount of mining and manufacturing fixed capital stocks at the end of the year from the Mining and Manufacturing Survey is used as a proxy of total fixed capital in the region. The percentage of educated people with a bachelor’s degree or above, obtained from KOSIS, represents the level of human capital. Additionally, the population size gathered from KOSIS is used to indicate agglomeration economies, especially urbanization economies. Among administrative units, Sejong and Ongjin are not included due to a lack of confidential information on our variables. All data are gathered at the city level—including districts in metropolitan cities—and the regional scale, as of 2015, and log-transformed. descriptive statistics of variables are presented in Table 1.
For continuous variables, the ordinary least square (OLS) regression is commonly used. However, these kinds of spatial variables may have the possibility of spatial autocorrelation, which makes OLS estimates inefficient and biased. A spatial autoregressive model, in particular a spatial lag model and spatial error model, can be used to address this problem. Following Moran’s I test, a spatial autoregressive model is used if a spatial autocorrelation issue is identified. In addition, given the spatial autocorrelation problems found, robust Lagrange Multiplier (LM) tests are conducted to choose which model, spatial lag or error model, is appropriate [25]. The spatial weights matrix is calculated based on a queen-type contiguity matrix and is row-standardized.
In addition, the estimation models are conducted at both the city and regional level. The reason why the city level is considered in our analyses is because the model at the regional level itself cannot take into account the effect of two types of polycentricity on the individual cities that make up each region. Thus, the influences of morphological and functional polycentricity on the individual cities as well as on the whole region should be accounted for by considering the different geographical scales of the models.
4. Results
Table 2 presents the regression results for the level of labor productivity. Model 1 to 4 is conducted at the city level and Model 5 is at the regional level. As a base model, Model 1 has all control variables that are statistically significant. Model 2 has our interest variables, morphological and functional polycentricity. Model 3 has all control and polycentricity variables. Moran’s I tests indicate that all models estimated by OLS at the city level have spatial autocorrelation problems, so they should be addressed by a spatial autocorrelation model. Results of robust LM lag and error tests on Model 3 show that the spatial error model is more appropriate than the spatial lag model as the value of the LM error test is larger than that of the LM lag test. In addition, the Vector Inflation Factor tests for all variables are lower than 3, confirming that there are no multicollinearity issues in models.
In Models 4 and 5, all variables are statistically significant, except for the level of education in Model 5. The capital–labor ratio is positively associated with the level of labor productivity. This is consistent with other research [5,7,8]. The percentage of people with a bachelor’s degree or above also has a positive impact on productivity at least at the individual city level. Although it was not significant in the work of Meijers and Burger (2010) [8], it is statistically significant at the 0.01 level. Population size in each city negatively affects the level of labor productivity. This is inconsistent with most studies reporting that population size as an explanatory variable for economic performance is positively influencing labor productivity. These results suggest that there exist agglomeration diseconomies over urbanization economies.
Turning to our variables of interest, both morphological polycentricity and functional polycentricity are statistically significant, but the directions of their effects are opposite. Results are the same in Model 4 at the city level and Model 5 at the regional level. Morphological polycentricity positively contributes to the level of labor productivity. As it is log-transformed, it should be interpreted as the elasticity. According to Model 5, this implies that a 1 % increase in morphological polycentricity would lead to a 0.3% increase in labor productivity, all other things be equal. However, functional polycentricity negatively affects the economic performance, showing that a 1% increase in functional polycentricity can result in a 0.6% decrease in labor productivity. The fact that the two types of polycentricity variables have similar effects on the city scale as well as on the regional scale indicates that the morphologically and functionally monocentric spatial structures not only enhance the labor productivity of the whole region, but also create positive effects on the individual cities making up the regions.
For results regarding morphological polycentricity, our research is consistent with previous studies [7,8]. However, it is quite different from Veneri and Burgalassi (2012) [9], who reported that morphological polycentricity is highly negatively related to labor productivity level, whereas functional polycentricity is positively associated with the same. Li and Liu (2018) also [5] found that the Chinese cities with morphologically monocentric urban structures have higher labor productivity when their size is not large. Unlike other countries’ population densities, Korea has 501 inhabitants/km2 and was the highest among OECD countries in 2013 [26]. This means that the city size and density in Korea is large enough to pursue a polycentric urban structure. Also, the policy interventions through which the Korean central government tried to build new sub-centers to mitigate the pressure on metropolitan cities can contribute to polycentric urban structures [27]. The effects of a morphologically polycentric urban structure can be seen in the real world, especially in terms of the travel-to-work time. For example, Ulsan, Region 8 in this study, is the most morphologically polycentric region, and its average commuting time in 2015 of 25.4 min was shorter than Seoul’s of 39.3 min [28]. This shorter travel-to-work time is caused by the morphologically polycentric urban structure of the city. This can be a part of the explanation of the position of the city, as it also has the largest labor productivity.
For functional polycentricity, our results imply that the balanced distribution of flows and degrees is inefficient as a more equal distribution of interaction can somehow lead to an inefficient asset usage. Firms in a smaller city can benefit from a nearby larger city but not from other small cities because of the spillover effects from agglomeration economies in larger cities [29,30]. This can be applied to urban functions. Larger cities have higher or more urban functions than other small cities in a region [18,31]. In this case, it is more advantageous that small cities try to make connections with nearby larger cities than with similar or small cities. This “borrowed size” process can positively contribute to the level of labor productivity, enhancing the functionally imbalanced distribution of connections in the region [32].
5. Conclusions
This study aims to explore whether and to what extent two types of polycentricity, morphological and functional, affect the level of urban economic performance. This study contributes to the debates on the impacts of polycentricity on economic performance by (1) examining the relationship in the East Asian context, not in Europe or America, and (2) distinguishing between the effects of two types of polycentricity. In the analysis, it is found that morphological polycentricity is positively associated with the level of labor productivity, whereas functional polycentricity is negatively related to it. These results reflect the processes of agglomeration economies and their impact on urban dynamics. In the context of the Korean urban system, characterized by the domination of a few cities and high levels of population density, regions which are more morphologically polycentric and functionally monocentric are likely to have higher labor productivity. We find the same results for the city level and the regional level models. These findings about two dimensions of polycentricity imply that policy makers should concentrate their investments and funding on mitigating the cost of agglomeration diseconomies to promote morphologically polycentric urban regions, while enhancing the connectivity between the regional center and other cities.
These results are mainly related to economic sustainability, because improving labor productivity can contribute to the long-term economic growth of a region. In particular, the fact that urban spatial structure affects productivity suggests that designing an efficient urban spatial structure is a very important factor in regional economic sustainability. Based on the results of this study, it can be argued that maximizing the agglomeration economy through morphologically polycentric and functionally monocentric urban design is the most efficient way to improve regional economic sustainability in Korea.
This study has the following limitations, which should be further investigated. First, although this study concentrates on regional levels of polycentricity, polycentricity depends on the geographical scales of analyses, as mentioned above. Therefore, this study needs to be extended to deal with other geographical scales, especially intra-urban scales. Second, this study only conducts cross-sectional analysis, but the effects of polycentricity may change when cities grow and decline. As such, the changing effects of polycentricity should be explored to contribute to the debate on the relationship between urban spatial structure and economic performance. Third, as this study mainly considers economic sustainability, future research is required to include the effect of polycentricity on social or environment sustainability in the context of Korea.
Author Contributions
K.K. designed this study, performed the analyses, and wrote the first draft; M.S. provided core guidance on the idea, improved the theoretical part, and revised the drafts.
Funding
This research was funded by a grant (18AUDP-B077107-05) from the Architecture & Urban development Research Program from the Ministry of Land, Infrastructure and Transport.
Acknowledgments
The authors would like to thank two anonymous reviewers for their valuable suggestions and insights. This research includes a part of the research entitled ‘Strategic Implementation Plan for Urban Regeneration New Deal Policy in Korea’ to be published by the Korea Research Institute for Human Settlements at the end of 2018.
Conflicts of Interest
The author declares no conflict of interest.
Appendix A. Cities and Counties Listed for Each of the Functional Urban Regions

Table A1.
Cities and counties listed for each of the functional urban regions.
| Region No. | Cities and Counties |
|---|---|
| 1 | Seoul (25 districts), Incheon (10 districts), Suwon, Seongnam, Uijeonbu, Anyang, Bucheon, Gwangmyeong, Pyeongtaek, Dongducheon, Ansan, Goyang, Gwacheon, Guri, Namyangju, Osan, Siheung, Gunpo, Uiwang, Hanam, Yongin, Paju, Anseong, Gimpo, Hwaseong, Gwangju 1, Yangju, Pocheon, Yeoncheon, Yangpyeong, Cheolwon |
| 2 | Busan (16 districts), Gimhae, Milyang, Yangsan, Changwon, Uiryeong, Haman, Changnyeong |
| 3 | Daegu (8 districts), Gimcheon, Gumi, Yeongcheon, Gyeongsan, Gunwee, Cheongdo, Goryeong, Seongju, Chilgok, Hapcheon |
| 4 | Gwangju (5 districts), Naju, Damyang, Gokseong, Hwasun, Yeonggwang, Jangseong |
| 5 | Daejeon (5 districts), Okcheon, Yeongdong, Gongju, Nonsan, Gyeryong, Geumsan, Buyeo |
| 6 | Jeonju, Gunsan, Iksan, Jeongeup, Namwon, Gimje, Wanju, Jinan, Muju, Jangsu, Imsil, Sunchang, Buan, Seocheon |
| 7 | Cheonan, Asan, Sejong, Chungju, Jeongju, Boeun, Jincheon, Goesan, Eumsung, Jeungpyeong |
| 8 | Ulsan (5 districts) |
| 9 | Mokpo, Jangheung, Gangjin, Haenam, Yeongyang, Muan, Hampyeong, Wando, Jindo, Sinan |
| 10 | Jecheon, Danyang, Andong, Yeongju, Sangju, Mungyeong, Uisung, Cheongsong, Yecheon, Bonghwa |
| 11 | Gangneung, Donghae, Taebaek, Sokcho, Samcheok, Yeongwol, Pyeongchang, Jeongsun, Goseong, Yangyang |
| 12 | Jinju, Tongyeong, Sacheon, Geoje, Namhae, Hadong, Sancheong, Hamynag, Geochang |
| 13 | Chuncheon, Wonju, Hongcheon, Hoengseong, Hwacheon, Yanggu, Inje, Icheon, Yeoju, Gapyeong |
| 14 | Yeosu, Suncheon, Gwangyang, Gurye, Goheung, Boseong |
| 15 | Boryeong, Seosan, Dangjin, Cheongyang, Hongseon, Yesan, Taean |
| 16 | Pohang, Gyeongju, Yeongduk, Uljin, Ulreung |
| 17 | Jeju, Seguipo |
1 Included in Gyeonggi province.
References
- Vandermotten, C.; Halbert, L.; Roelandts, M.; Cornut, P. European planning and the polycentric consensus: Wishful thinking? Reg. Stud. 2008, 42, 1205–1217. [Google Scholar] [CrossRef] [Green Version]
- Brezzi, M.; Veneri, P. Assessing polycentric urban systems in the oecd: Country, regional and metropolitan perspectives. Eur. Plan. Stud. 2015, 23, 1128–1145. [Google Scholar] [CrossRef]
- Hoyler, M.; Kloosterman, R.C.; Sokol, M. Polycentric puzzles—Emerging mega-city regions seen through the lens of advanced producer services. Reg. Stud. 2008, 42, 1055–1064. [Google Scholar] [CrossRef] [Green Version]
- Davoudi, S. European briefing: Polycentricity in european spatial planning: From an analytical tool to a normative agenda. Eur. Plan. Stud. 2003, 11, 979–999. [Google Scholar] [CrossRef]
- Li, Y.; Liu, X. How did urban polycentricity and dispersion affect economic productivity? A case study of 306 chinese cities. Landsc. Urban. Plan. 2018, 173, 51–59. [Google Scholar] [CrossRef]
- Cheng, H.; Shaw, D. Polycentric development practice in master planning: The case of china. Int. Plan. Stud. 2018, 23, 163–179. [Google Scholar] [CrossRef]
- Zhang, T.; Sun, B.; Li, W. The economic performance of urban structure: From the perspective of polycentricity and monocentricity. Cities 2017, 68, 18–24. [Google Scholar] [CrossRef]
- Meijers, E.; Burger, M.J. Spatial structure and productivity in us metropolitan areas. Environ. Plan. A 2010, 42, 1383–1402. [Google Scholar] [CrossRef]
- Veneri, P.; Burgalassi, D. Questioning polycentric development and its effects. Issues of definition and measurement for the italian nuts-2 regions. Eur. Plan. Stud. 2012, 20, 1017–1037. [Google Scholar] [CrossRef] [Green Version]
- Parr, J. The polycentric urban region: A closer inspection. Reg. Stud. 2004, 38, 231–240. [Google Scholar] [CrossRef]
- Liu, X.; Derudder, B.; Wang, M. Polycentric urban development in china: A multi-scale analysis. Environ. Plan. B: Urban. Anal. City Sci. 2017, 45, 953–972. [Google Scholar] [CrossRef]
- Taylor, P.J.; Evans, D.M.; Pain, K. Application of the interlocking network model to mega-city-regions: Measuring polycentricity within and beyond city-regions. Reg. Stud. 2008, 42, 1079–1093. [Google Scholar] [CrossRef]
- Rauhut, D. Polycentricity—One concept or many? Eur. Plan. Stud. 2017, 25, 332–348. [Google Scholar] [CrossRef]
- Burger, M.J.; Van Der Knaap, B.; Wall, R.S. Polycentricity and the multiplexity of urban networks. Eur. Plan. Stud. 2014, 22, 816–840. [Google Scholar] [CrossRef]
- Green, N. Functional polycentricity: A formal definition in terms of social network analysis. Urban Stud. 2007, 44, 2077–2103. [Google Scholar] [CrossRef]
- Kloosterman, R.C.; Musterd, S. The polycentric urban region: Towards a research agenda. Urban Stud. 2001, 38, 623–633. [Google Scholar] [CrossRef]
- De Goei, B.; Burger, M.J.; Van Oort, F.G.; Kitson, M. Functional polycentrism and urban network development in the greater south east, united kingdom: Evidence from commuting patterns, 1981–2001. Reg. Stud. 2010, 44, 1149–1170. [Google Scholar] [CrossRef]
- Meijers, E.; Burger, M.J. Stretching the concept of ‘borrowed size’. Urban Stud. 2017, 54, 269–291. [Google Scholar] [CrossRef]
- Burger, M.J.; Meijers, E.J.; Hoogerbrugge, M.M.; Tresserra, J.M. Borrowed size, agglomeration shadows and cultural amenities in north-west europe. Eur. Plan. Stud. 2015, 23, 1090–1109. [Google Scholar] [CrossRef]
- ESPON. Potentials for Polycentric Development in Europe; Nordregio Estocolmo: Stockholm, Sweden, 2005. [Google Scholar]
- Zhong, C.; Arisona, S.M.; Huang, X.; Batty, M.; Schmitt, G. Detecting the dynamics of urban structure through spatial network analysis. Int. J. Geogr. Inf. Sci. 2014, 28, 2178–2199. [Google Scholar] [CrossRef]
- Nelson, G.D.; Rae, A. An economic geography of the united states: From commutes to megaregions. PLoS ONE 2016, 11, e0166083. [Google Scholar] [CrossRef] [PubMed]
- Rosvall, M.; Bergstrom, C.T. An information-theoretic framework for resolving community structure in complex networks. Proc. Natl. Acad. Sci. USA 2007, 104, 7327–7331. [Google Scholar] [CrossRef] [PubMed] [Green Version]
- Lancichinetti, A.; Fortunato, S. Community detection algorithms: A comparative analysis. Phys. Rev. E 2009, 80, 056117. [Google Scholar] [CrossRef] [PubMed]
- Anselin, L. Spatial Econometrics: Methods and Models; Springer Science and Business Media: Berlin, Germany, 2013. [Google Scholar]
- OECD. Environment at a Glance 2015: Oecd Indicators; OECD Publishing: Paris, France, 2015. [Google Scholar]
- Lee, Y.-S.; Shin, H. Negotiating the polycentric city-region: Developmental state politics of new town development in the seoul capital region. Urban Stud. 2012, 49, 1333–1355. [Google Scholar] [CrossRef]
- Statistics Korea. 2015 Population and Housing Census Sample Survey Report: Migration, Commuting and Disability; Statistics Korea: Daejeon, Korea, 2017. [Google Scholar]
- Phelps, N.; Fallon, R.; Williams, C. Small firms, borrowed size and the urban-rural shift. Reg. Stud. 2001, 35, 613–624. [Google Scholar] [CrossRef]
- Camagni, R.; Capello, R. Second-rank city dynamics: Theoretical interpretations behind their growth potentials. Eur. Plan. Stud. 2015, 23, 1041–1053. [Google Scholar] [CrossRef]
- Meijers, E.J.; Burger, M.; Hoogerbrugge, M. Borrowing size in networks of cities: City size, network connectivity and metropolitan functions in europe. Pap. Reg. Sci. 2016, 95, 181–198. [Google Scholar] [CrossRef]
- Phelps, N.A. Clusters, dispersion and the spaces in between: For an economic geography of the banal. Urban Stud. 2004, 41, 971–989. [Google Scholar] [CrossRef]
Figure 1.
Conceptual diagram of morphological and functional polycentricity. Source: Burger et al. (2014: 820) [14].
Figure 1.
Conceptual diagram of morphological and functional polycentricity. Source: Burger et al. (2014: 820) [14].
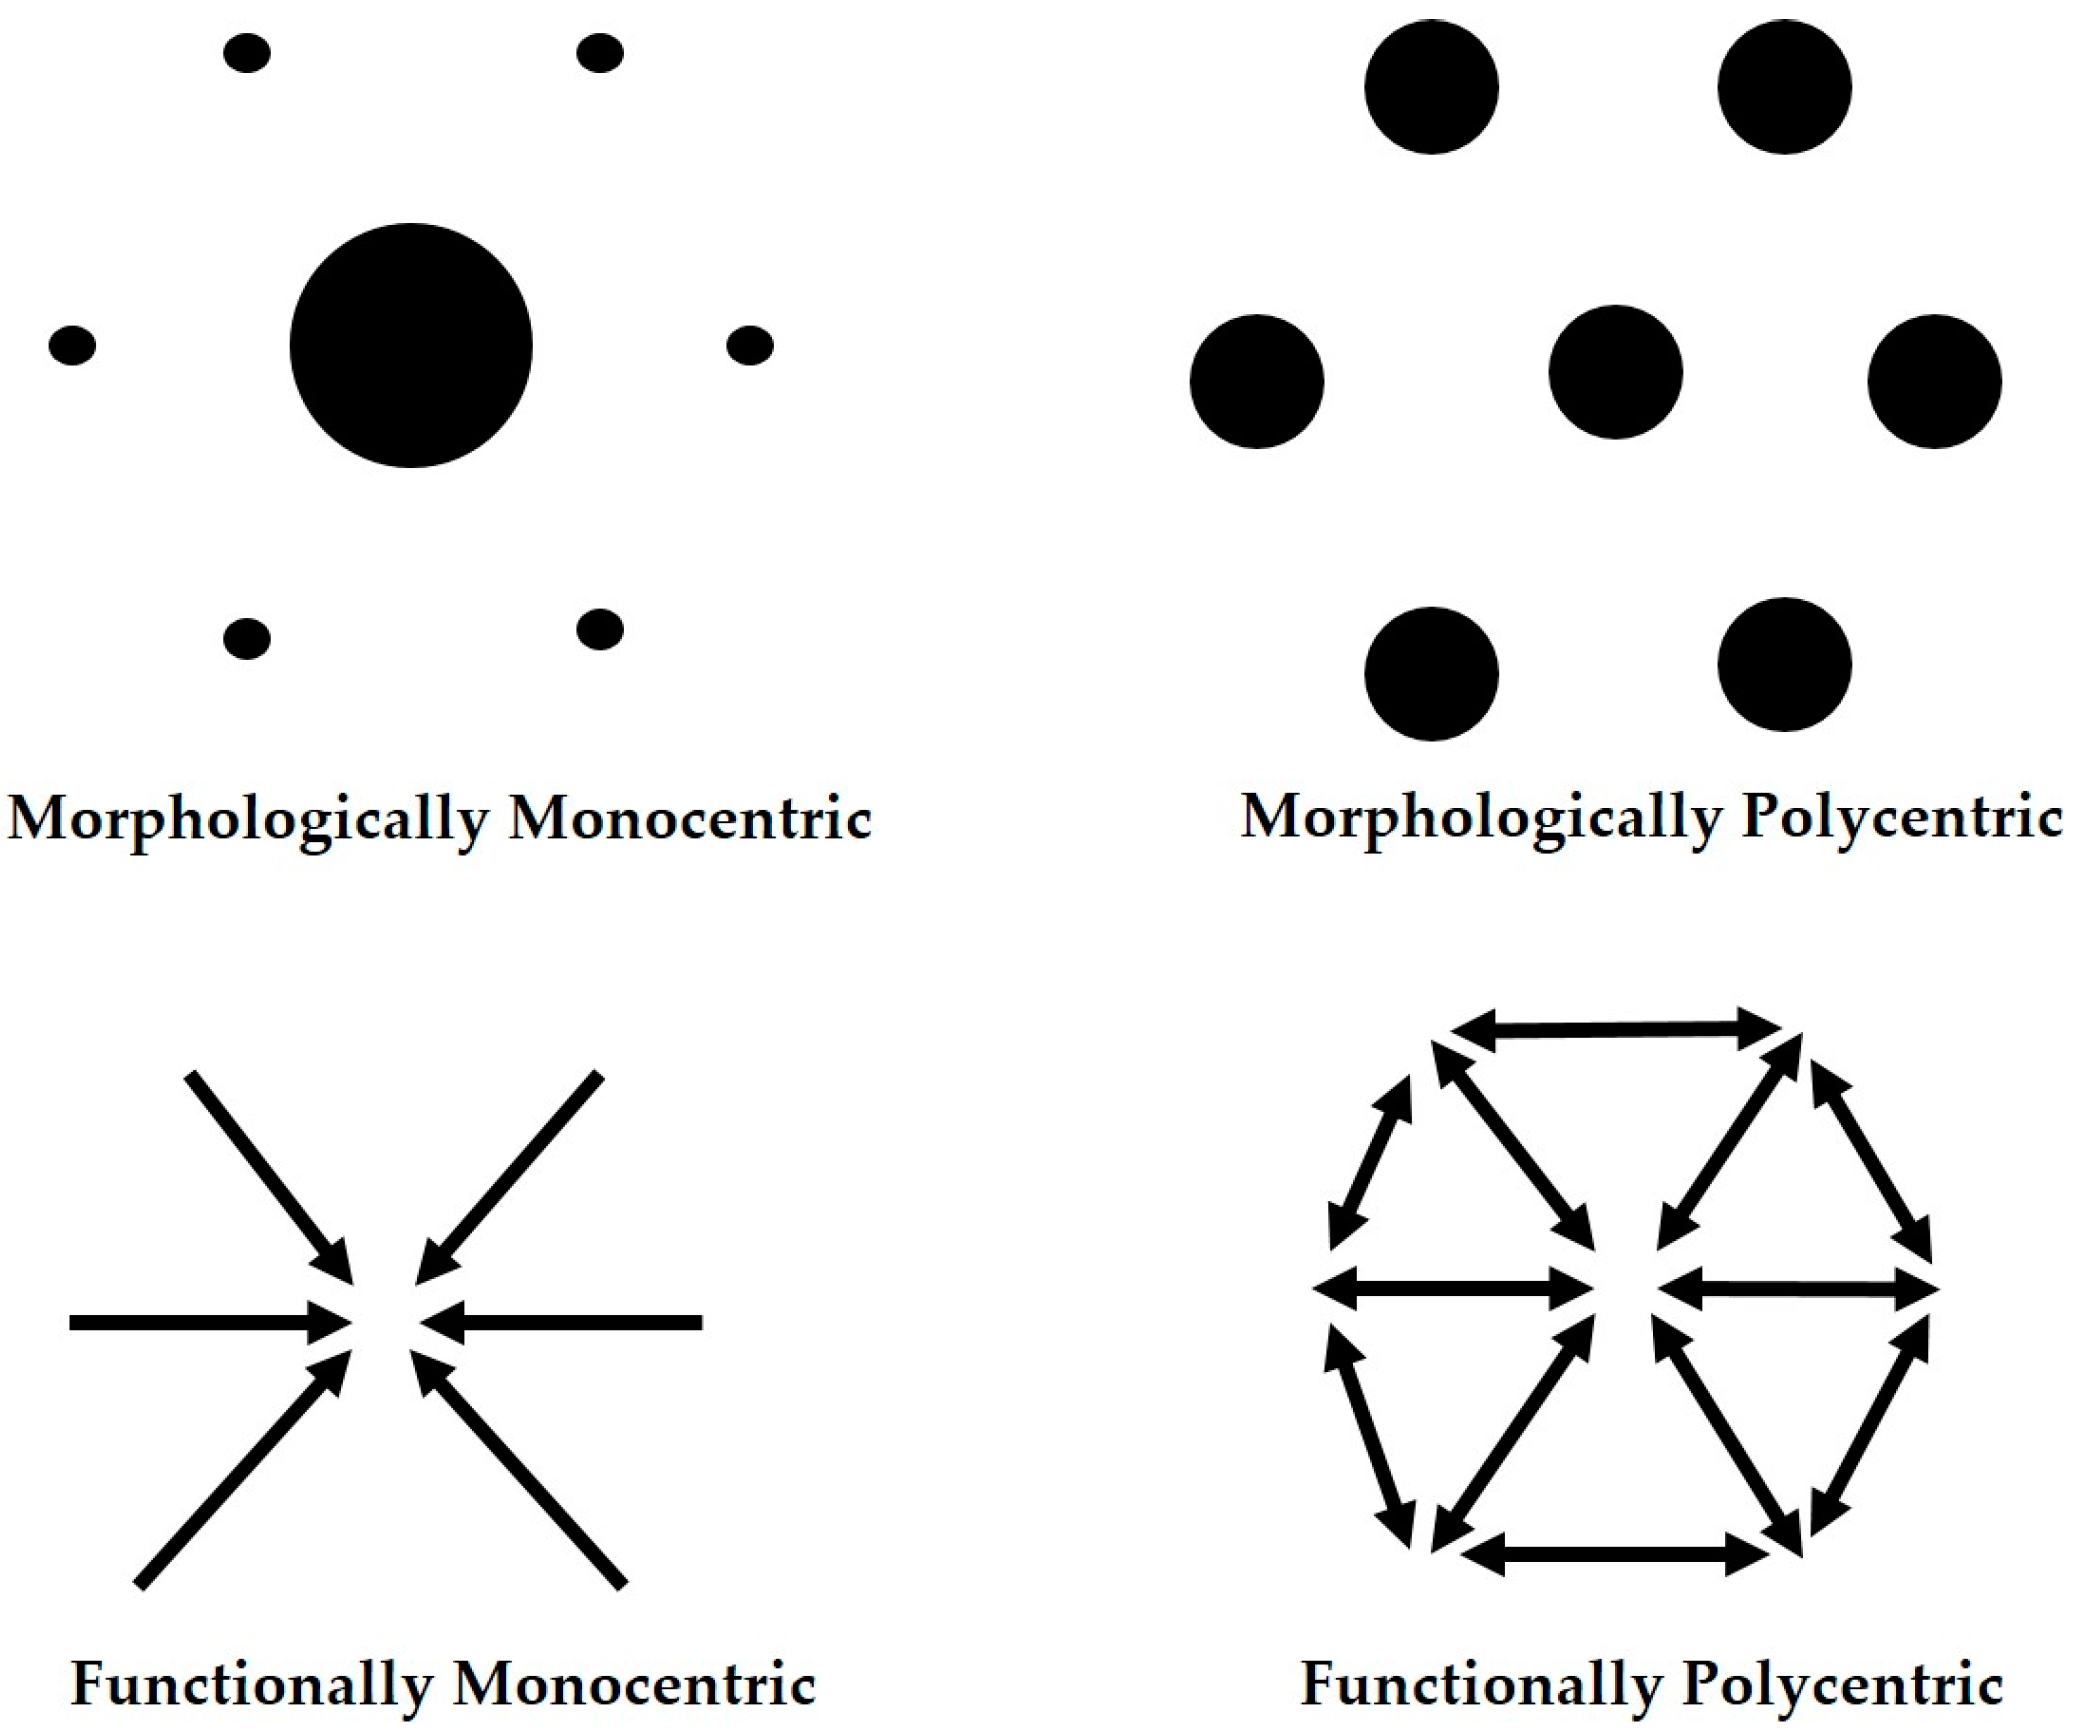
Figure 2.
Functional urban regions in Korea based on the Infomap network partitioning method as of 2015. Bold lines are the boundaries of metropolitan cities, provinces, and special administrative cities. The cities and counties that each region consists of are presented in Appendix A.
Figure 2.
Functional urban regions in Korea based on the Infomap network partitioning method as of 2015. Bold lines are the boundaries of metropolitan cities, provinces, and special administrative cities. The cities and counties that each region consists of are presented in Appendix A.

Table 1.
Descriptive statistics of variables (N = 227).
| Variables | Mean | SD | Min | Max |
|---|---|---|---|---|
| Labor productivity | 4.267 | 0.331 | 3.625 | 5.171 |
| Capital-labor ratio | 2.141 | 1.664 | −2.515 | 5.379 |
| Human capital | −1.128 | 0.312 | −1.859 | −0.423 |
| Population size | 11.762 | 1.064 | 9.035 | 13.934 |
| Morphological polycentricity | 0.023 | 0.307 | −0.888 | 0.872 |
| Functional polycentricity | 0.536 | 0.817 | 0.244 | 0.622 |
All variables are log-transformed.
Table 2.
Regression estimations of labor productivity.
| Variables | Model 1 City | Model 2 City | Model 3 City | Model 4 City | Model 5 Region |
|---|---|---|---|---|---|
| OLS | OLS | OLS | SEM | OLS | |
| Constant | 4.318 (0.371) *** | 3.807 (0.122) *** | 3.912 (0.389) *** | 3.69 (0.418) *** | 2.681 (0.671) *** |
| Capital–labor ratio | 0.104 (0.011) *** | - | 0.106 (0.01) *** | 0.103 (0.011) *** | 0.233 (0.018) *** |
| Level of education | 0.243 (0.098) *** | - | 0.253 (0.095) *** | 0.284 (0.095) *** | −0.309 (0.192) |
| Population size | −0.143 (0.028) *** | - | -0.147 (0.027) *** | −0.146 (0.026) *** | −0.211 (0.037) *** |
| Morphological polycentricity | - | 0.193 (0.103) * | 0.308 (0.083) *** | 0.259 (0.104) ** | 0.37 (0.055) *** |
| Functional polycentricity | - | −0.717 (0.186) *** | −0.598 (0.148) *** | −0.668 (0.197) *** | −0.68 (0.116) *** |
| Lambda | - | - | - | 0.385 (0.083) *** | - |
| Observation | 227 | 227 | 227 | 227 | 17 |
| Adjusted R2 | 0.369 | 0.062 | 0.412 | 0.487 | 0.959 |
| Moran’s I | 5.853 *** | 7.726 *** | 5.029 *** | - | - |
| Robust LM lag | 4.589 *** | 1.815 | 4.302 *** | - | - |
| Robust LM error | 23.971 *** | 44.436 *** | 15.715 *** | - | - |
*** p < 0.01, ** p < 0.05, * p < 0.1, standard errors in parentheses.
© 2018 by the authors. Licensee MDPI, Basel, Switzerland. This article is an open access article distributed under the terms and conditions of the Creative Commons Attribution (CC BY) license (http://creativecommons.org/licenses/by/4.0/).
Share and Cite
MDPI and ACS Style
Kwon, K.; Seo, M. Does the Polycentric Urban Region Contribute to Economic Performance? The Case of Korea. Sustainability 2018, 10, 4157. https://doi.org/10.3390/su10114157
AMA Style
Kwon K, Seo M. Does the Polycentric Urban Region Contribute to Economic Performance? The Case of Korea. Sustainability. 2018; 10(11):4157. https://doi.org/10.3390/su10114157
Chicago/Turabian StyleKwon, Kyusang, and Minho Seo. 2018. "Does the Polycentric Urban Region Contribute to Economic Performance? The Case of Korea" Sustainability 10, no. 11: 4157. https://doi.org/10.3390/su10114157
Note that from the first issue of 2016, this journal uses article numbers instead of page numbers. See further details here.