Regional Aspects of a Climate and Energy Tax Reform in Norway—Exploring Double and Multiple Dividends


1
SINTEF Building and Infrastructure, 7465 Trondheim, Norway
2
Norwegian University of Science and Technology, Industrial Economics and Technology Management, 7491 Trondheim, Norway
3
SINTEF Industry, 7465 Trondheim, Norway
*
Author to whom correspondence should be addressed.
Sustainability 2018, 10(11), 4175; https://doi.org/10.3390/su10114175
Submission received: 11 September 2018
/
Revised: 5 November 2018
/
Accepted: 8 November 2018
/
Published: 13 November 2018
(This article belongs to the Special Issue Economics of Environmental Taxes and Green Tax Reforms)
Abstract
:We investigate the potential for double or even multiple dividends arising from a climate and energy tax reform (CETR), using a regional computable general equilibrium model. Such dividends indicate if government revenues raised from energy-related environmental taxes and recycled back to households or industries through (regional) social security contributions will yield welfare gains larger than gross cost. Building on existing double dividend theory, we broaden the scope by considering both social and regional aspects of a CETR. We explore the use of household transfers and regional payroll taxes as recycling instruments and investigate to what extent wage formation on the labor market has an effect. For Norway, our results indicate that a CETR may conflict with sub-national policy goals under all assessed scenarios. In particular, this holds for income inequality. Although our analysis concerns the social, economic and environmental aims of a Norwegian policy, the approach can be generalized to, e.g., a European context.
1. Introduction
Today, there is a general consensus that carbon and other emissions must be reduced. The COP21 Paris Agreement in 2015 has now been signed by 195 countries, representing a major step towards binding National Determined Contributions to reach the two-degree Celsius target. Important instruments on this way are climate and energy taxes, penalizing the use of polluting materials such as petroleum and gas products. Still, politicians are often hesitant, implementing only minor revisions to existing tax systems. For example, the sum of all energy-related taxes in Norway increased by only 1.9% from 2015–2016 [1]. One explanation for this hesitance may be recession concerns, because a country with more ambitious climate and energy tax reforms (CETRs) than its trading partners may fear for its business competitiveness. As the adoption of climate taxes has yet to occur at a global level, it is likely that firms operating in countries with higher taxes will lose market shares to competitors that do not have to account for high taxes. In contrast to these statements, Ekins and Speck [2] argue that energy-/environmentally-intensive sectors should feel pressured by such tax reforms. However, with a sufficient supporting scheme, there should be no reason why these sectors should not make environmental improvements that will maintain their competitive position. Additionally, several papers refer to an environmental Kuznets curve (EKC) [3,4,5]. Based on empirical data, they experienced that, at a certain threshold level of per capita GDP, further economic development is not associated with a deteriorating environment. On the contrary, it may even be improved. Hence, the claim that economic growth affects the environment only negatively is not necessarily true.
According to Goulder [6], imposing a specific tax on a product group may in certain economic situations have positive climate or environmental (first dividend) and economic effects (second dividend), leading to a double dividend (DD) effect. Hence, theory on double dividends indicates that policy makers should not necessarily be worried about negative macro-economic outcomes of a revenue-neutral CETR, as positive effects may arise elsewhere. For example, double dividend concepts played a significant role in the Norwegian Green Tax Commission’s environmental policy advice [7].
At a sub-national level, implementing a common CETR in all EU countries may affect regions that are already lagging behind more adversely by adding another tax burden. This conflicts with the EU’s cohesion policy [8], aiming at a reduction of economic and social disparities between regions. The effects of a CETR on a regional economy may materialize through several channels. For example, increasing consumption tax on oil fuels and petrol products may have consequences for household income dispersion, regional income distribution and regional industry composition. First, for low-income households, the taxed products may have a larger budget share. Consequently, the tax increase affects households differently, expanding the range of income dispersion. Moreover, different income groups have varying factor endowments (capital, labor skill levels and public transfers), and an adverse impact of the tax on factor prices can also lead to changes in income dispersion [9,10,11,12]. Second, household groups are not distributed evenly across the regions such that a CETR may have negative (regional) distributional effects. Third, industries are likely to depend on taxed products in some regions more than in others, hence carrying a larger tax burden. This affects regional industry composition and, in turn, regional development [11,13].
Similar to the EU’s cohesion policy, Norwegian regional policy seeks to reduce social disparities between regions and to prevent depopulation of rural areas. A national, non-differentiated CETR may counteract these goals, leading to political controversies. The existence of a DD at an aggregated, national level may not allay individual policy makers’ concerns for their region. For example, the 2017 consumption tax increase on oil fuel products was criticized by the rural party Senterpartiet [14]. They claimed that consumers in rural areas, with longer travel distances and less access to public transport, would be disadvantaged. Likewise, an increased CO2 tax is feared to have adverse effects on coastal ship transportation, distorting competition in the transport sector and hampering trade and business in coastal regions [15]. Norwegian policy strives for an egalitarian society: the welfare system aims at reducing income inequality, with progressive income taxes and large welfare payments. Consequently, politicians are also concerned about taxes hitting low-income or rural households disproportionally hard. Meeting such policy mechanisms, a CETR may lead to regional and social differentiation, potentially obstructing a smooth implementation of a common national tax. Our work sets out to explore this hypothesis and how analysis results may guide policy formation. Hence, we take a broader perspective than existing literature on double dividends by also addressing distributional effects from a CETR along two axes: households and regions. These distributional measures are included as dividends D3–D5 in our analysis. Our more comprehensive modeling approach can simultaneously explore consequences for regional, economic, social and environmental policies, contributing to unique insights for politicians in a landscape with policy goal conflicts.
Our paper extends macroeconomic analyses of energy policy scenarios performed in the project SET-Nav(Horizon 2020 EU program), which consider topics such as energy mix and efficiency changes in transport and buildings, diffusion rates for renewable sources and varying fossil fuel prices [16]. While these analyses have a European perspective, we study here national and sub-national issues for a particular policy.
Focusing on computable general equilibrium (CGE) approaches, we review double dividend analyses in Section 2. Then, we present implementation details of the considered CETR and the regional CGE model REMESin Section 3. Section 4 discusses the effects of a CETR on five dividends under four policy scenarios. As the magnitude of the effects may depend on model assumptions, we also include a sensitivity analysis and comments on the limitations of the analysis conducted. In Section 5, we investigate potential policy recommendations based on our findings and conclude the paper.
2. A Literature Review of CGE Modeling Approaches to Double Dividend Analyses
CGE models are the most comprehensive way to take into account the most relevant aspects of an economic system. They are, hence, the preferred methodology in the literature [17], although other methods such as input-output models are also used [18]. As our paper explores dividend effects from various perspectives, we follow the CGE approach.
While numerous analyses have studied first and second dividends, finding mostly positive results for first and more mixed results on second dividends, insights on further dividends are still rare. We explicitly include household and regional equity concerns, forming the third–fifth dividends mentioned in Table 1, and can, thus, study potential differentiated effects of a CETR more comprehensively. The table also summarizes the expected effect for each of the addressed dividends and related references.
Having been introduced by Pearce [19], the DD hypothesis in connection with environmental tax reforms has received much attention. Typically, weak and strong forms of the hypothesis are distinguished [6]. The weak (relative) form is present if, in addition to improved environmental quality, recycling the environmental tax revenues back into the economy by cutting distorting taxes (e.g., payroll tax) achieves cost savings compared to lump-sum transfers. The strong (absolute) form states that, if an environmental tax reform succeeds, then both economic and environmental gains can be expected. According to Goulder [6], the presence of a strong form of the DD is often related to distortions in the existing tax system (capital/labor), the tax burden falling primarily on labor, and a broad base for levying the environmental tax.
Bovenberg and Van der Ploeg [20] claimed that the strong form is rather unrealistic, but showed that it may occur in a small open economy with involuntary unemployment. Fullerton and Heutel [21] found that factor intensities in the taxed sectors and substitutability between capital, labor and the polluting products are important CGE parameters affecting CETR analysis results. For example, if the sector is less able to substitute the polluting products than households and both capital and labor are equally substitutable when manufacturing those products, then the price of capital will always rise more than the price of labor, even if the sector is capital intensive. Wage inflation plays a crucial role in Proost and Van Regemorter [10] for interpreting double dividend effects. Comparing two assumptions on labor market clearing, rigid real wages or flexible wages, they found opposite signs for the second dividend (measured in GDP growth). On the tax reduction side of the reform, most analyses reduce the level of the social security contribution (SSC) [22], because this tax directly affects the cost of labor and, thus, has more potential to contribute to an employment DD. This effect is referred to as the positive revenue recycling effect. On the other hand, higher taxes lead to higher product prices that, in turn, dampen labor supply (consumption is relatively more costly than leisure) [26]. The difference of this tax interaction effect for the positive revenue recycling effect is decisive as to what extent a positive or negative second dividend materializes. However, the occurrence of a purely negative tax interaction effect has been questioned. For example, Williams [24] and Schwartz and Repetto [25] showed that a cleaner environment may lead to increased labor supply, partly or totally offsetting the original negative tax interaction effect.
Bosquet [18] surveyed 56 examples of practical experience and modeling studies involving DDs. The survey concluded that, if environmental tax revenues are used to reduce payroll taxes and wage inflation is limited, then environmental, economic and employment gains are likely in the medium term. However, if wages are directly linked to product price levels (wage-price inflation spiral), environmental taxes may be converted into inflation and wipe out potential employment gains. Obviously, such labor market mechanisms play an important role in whether dividends may materialize or not, and our studies compare both assumptions on wage formation.
Analyses on double dividends using CGE models at the national level have been performed widely; some references are summarized in Table 1. One example, Freire-González and Ho [23], found a double dividend, but it occurred first after three to four years after implementing the tax reform. Furthermore, Freire-Gonzalez [17] reviewed 40 such studies and found the presence of an environmental dividend in all and a double dividend in over half of the studies. Some analyses also incorporate more detailed aspects such as household diversity [9,10,11,27] or regional dispersion [9,11,13]. We see examples of a third dividend in Vandyck and Van Regemorter [11], with regional sector composition an important aspect for explaining how a CETR affects regional output. Similarly, investigating the presence of DDs in two Italian regions, Ciaschini et al. [13] found that a double dividend will not materialize in regions lagging behind with respect to unemployment rates, production levels and value added. Vandyck and Van Regemorter [11] did not compare rural and urban households explicitly, but identified larger consumption growth for households in their most urban region (Brussels) under both transfer and payroll tax reduction schemes. They argued that labor-intensive industrial regions will experience larger growth in real wages and, naturally, consumption. Evidently, the way recycling is implemented affects whether weak or strong forms of the dividends can be found. Our study follows the literature by recycling through SSC, but we add to the research by considering regionally-differentiated payroll taxes, reflecting Norwegian policy. This can reveal if a DD hypothesis also holds when public authorities have a preference for balancing regional growth and income inequality.
The role of distributional effects (discussed here as fourth and fifth dividends; Table 1) was highlighted by Proost and Van Regemorter [10], Rausch et al. [9], Vandyck and Van Regemorter [11] and Van Heerden et al. [12]. The initial idea is that a CETR is regressive in nature, because low-income groups spend a larger share of their budget on energy products. Especially, analyses of energy reforms in developing countries report on such effects. Van Heerden et al. [12], addressing DD and poverty rates in South Africa, argued that a third dividend would arise only when a CETR is met by a reduction in food taxes. On the other hand, for evaluating financial distributional effects, household endowment with factors and how the prices of these are affected may be more important than the budget share of energy products.
3. Methodology and Data
We simulate the effects of a CETR using a regional CGE model for Norway, REMES [28]. This enables regionally-differentiated analyses with respect to, for example, household income groups or the degree of centralization of households and industry. We conduct the analyses under different assumptions on policy aspects highly relevant for Norway, namely two schemes for recycling taxes back into the economy and two labor market clearing mechanisms, forming four scenarios.
3.1. The Policy Reform: Implementation of a CETR with Two Recycling Options
Norway’s National Determined Contributions in the Paris Agreement are to reduce greenhouse gas emissions by at least 40% by 2030, compared to 1990 levels [29]. This target will be developed into an emissions budget covering the period 2021–2030, to be achieved by various policy instruments. We test the effects of a particular instrument, an emissions tax, on the national economy and introduce a consumption tax by doubling net product taxes on the polluting-product group “Coke and refined petroleum products”. Taxes on this group are the most important climate and energy taxes in Norway today, representing about half of all climate- and energy-tax revenue in 2015 [1]. We assume an equal tax increase for industry and households. To test for the weak form of the dividend hypothesis, we assume two options for the government to recycle this income: it can be either transferred back to households as lump-sum transfers (transfer option) or used to reduce initial payroll taxes (payroll tax option).
Norwegian district policy operates with regionally-differentiated payroll taxes, set at the municipal level. For rural regions, lower rates apply. We form regions consisting of municipalities with similar tax levels on the polluting product (before CETR introduction) in a geographical area and characterize those with a lower tax level as rural. This defines eight regions, as indicated in Figure 1. Table 2 shows the initial tax levels in these regions.
3.2. The Model: The Regional CGE Model REMES
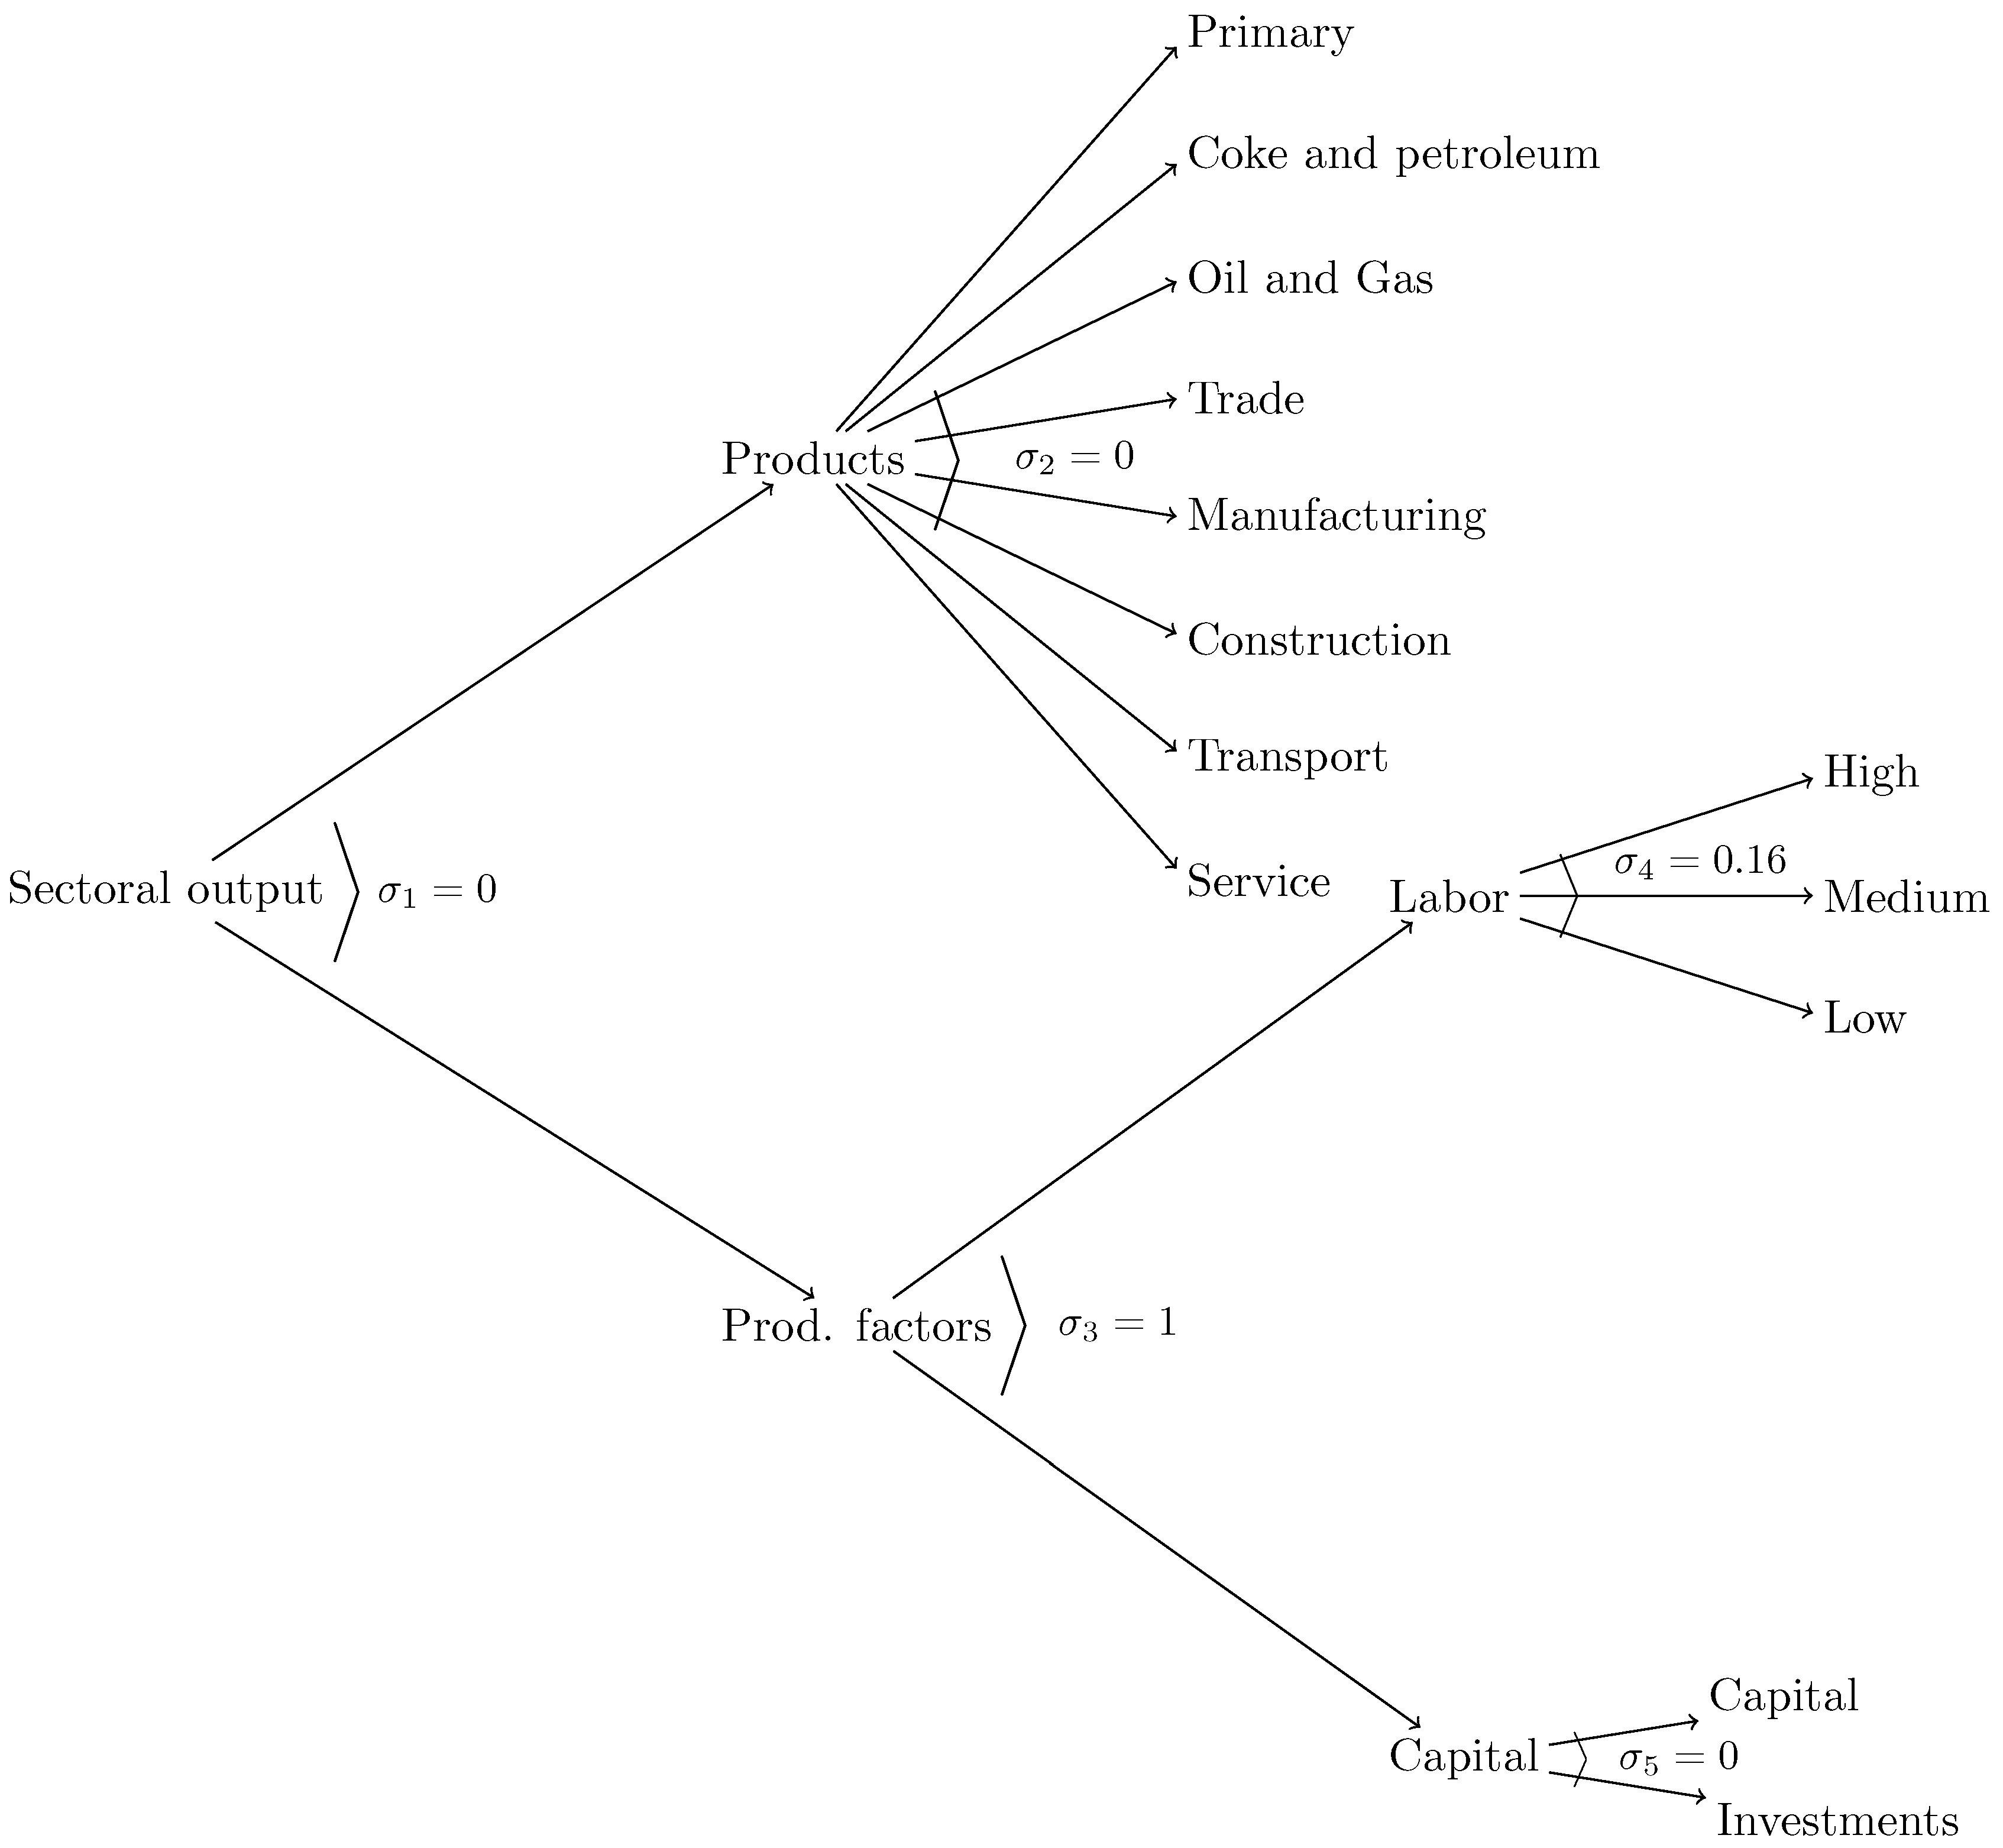
REMES is a regional computable general equilibrium model developed for the Norwegian economy. It belongs to the wider family of Arrow–Debreu models, which model macroeconomic situations with microeconomic assumptions (The model has been developed and is maintained by SINTEF in cooperation with the Norwegian University of Science and Technology (NTNU). Different versions of the model are often developed to suit particular analyses or studies.). A regional CGE model like REMES has two main inputs: a Social Accounting Matrix (SAM), which by listing all money flows from every actor in the economy defines a basis, or calibration, equilibrium for a given period; and a set of Constant Elasticities of Substitution (and transformation), or CESs, which describe the ability/desire of each actor to substitute a product with another. In general, a CES production/cost function for the industrial sectors in each zero-profit constraint in REMES corresponds to, and is almost entirely determined by, a given nesting structure. Figure 2 illustrates the nesting structures and corresponding substitution elasticities used in our analysis. For example, denotes the elasticity of substitution between the three labor types, defined by employees’ skill level, in production.
The national SAM used is based on data from 2014 and further regionalized with regional data from 2010, i.e., each region is balanced and mostly independent of other regions, except for inter-regional and international trade. Regions can send products and services, but not production factors, to other regions, via Armington substitution rules. Producers and consumers have preferences for local, regional and international products, but will accept one or the other in different quantities if needed.
When a change, or shock, impacts the economy at any scale or place, REMES reacts by changing the accounts listed in the SAM as much as the elasticities allow, increasing the consumption of alternative products with lower prices if possible. This has repercussions on generally all prices, activity levels and incomes.
REMES uses four main types of variables and four corresponding main types of conditions:
- Prices (assigned to products, production factors, services) are complementary to market clearing conditions.
- Activity levels of producers (alongside traders and welfare products) are complementary to zero-profit conditions.
- Income balance constraints (for each household, government and investor) are complementary to incomes.
- Auxiliary variables are related to taxes and endowments and complementary to conditions regulating other variables (such as the Price Consumption Index regulating government transfers related to product prices).
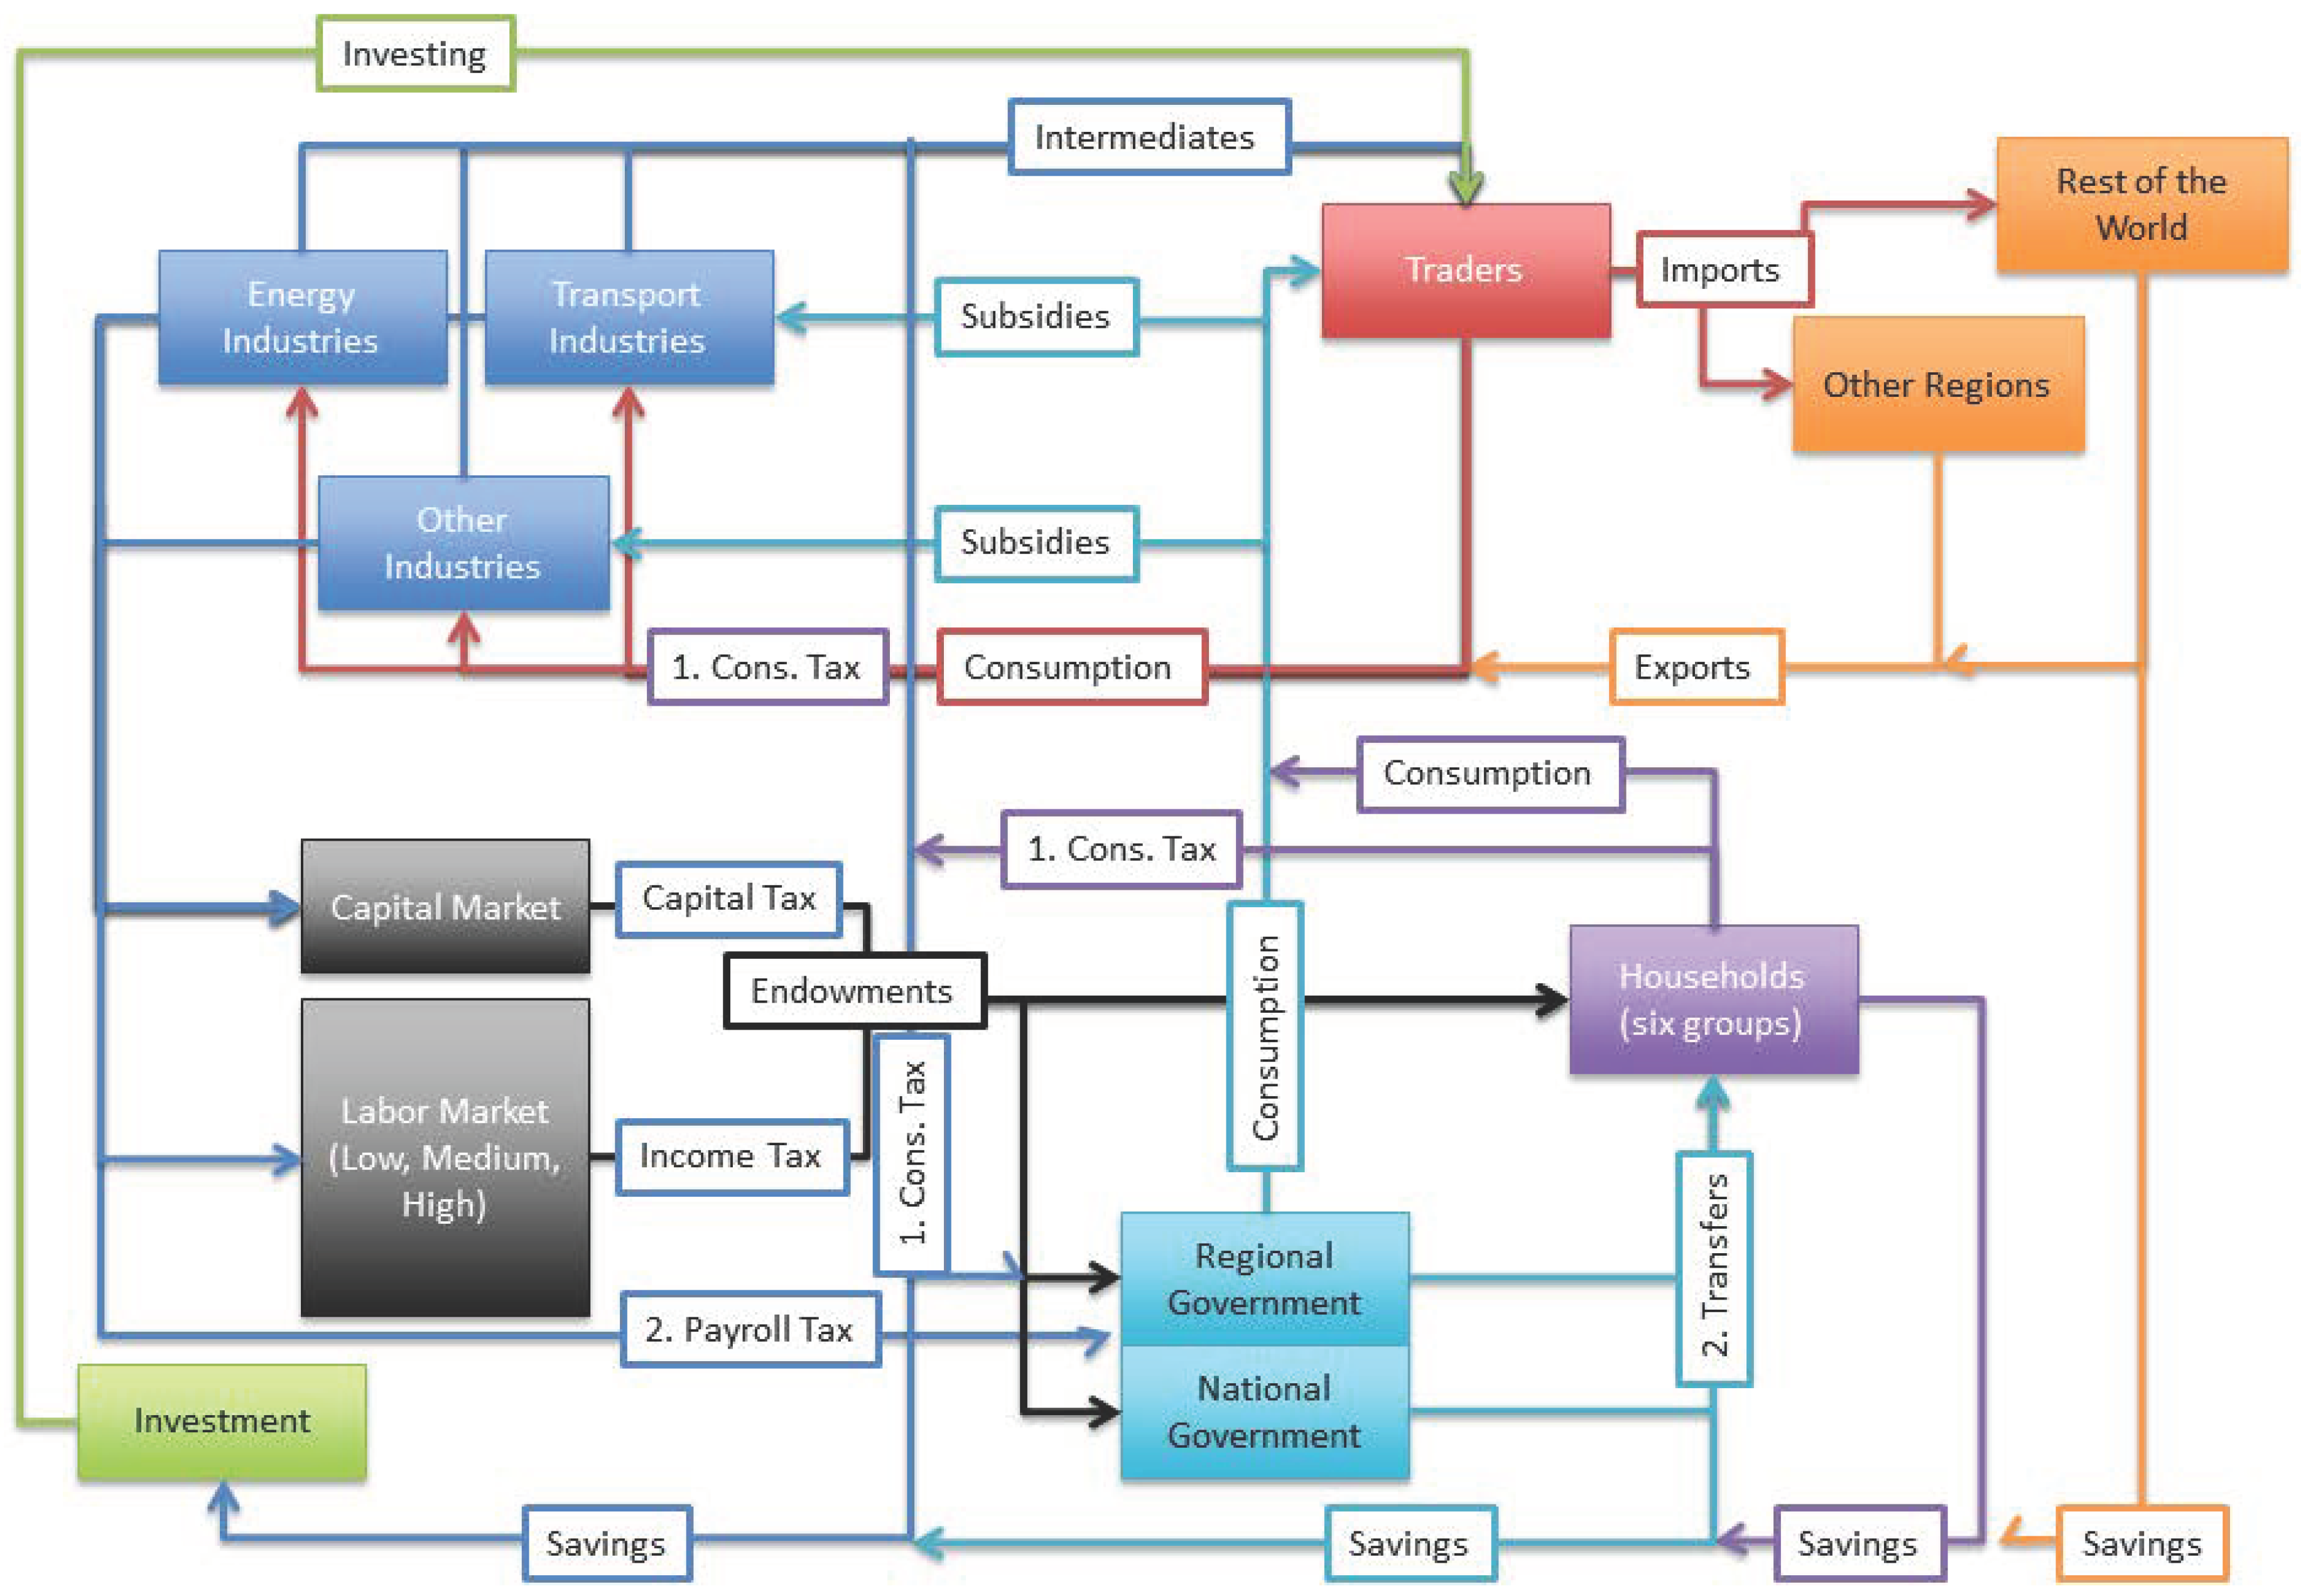
The CETR we implement in REMES is an additional tax paid on the Consumption of the polluting product by industries, households and the government. Figure 3 shows which actors are affected by this tax (“1. Cons. tax”) and how. The figure also shows the relations among the actors in the REMES model and taxes, transfers, trade, etc.
3.3. Data: Household and Labor Market Details
While the regionalized SAMs are the basic datasets for the CGE model, we also need household data to capture their heterogeneity. To represent the various households in each region, we use a micro dataset of all employees in Norway. We divide the households into ten income decile groups, which are then aggregated into six household classes . Table A1 in Appendix A shows taxes, transfers, labor and capital income data used to calibrate these household classes.
We differentiate between several types of labor provided by households and utilized by the industry, according to education or skill level. “Low” denotes workers without a bachelor’s degree, “Medium” those with a bachelor’s degree and “High” those with a graduate degree. Table 3 shows the skill structure for the model’s seven industry sectors and six household classes for two of the eight regions. Evidently, there is a clear difference between rural and urban regions, even for the same industry sector. Furthermore, a highly-educated work force is more present in high-income household classes. We do not take into account that the households’ labor supply may respond to changes in industry demand and assume a fixed mix of the different types based on benchmark data (examples given in Table 3).
Elasticities for demand substitution between labor types in production are based on estimates in [30] (Table 13). For the sake of simplicity, we include all three types at the same nesting level in REMES’s production functions (Figure 2), with the elasticity for all labor types and industry sectors. However, this assumption may be crucial for assessing the presence of fourth and fifth dividends, and Section 4.7 tests the sensitivity of analysis results using high-elasticity values from that table.
Proost and Van Regemorter [10] pointed out that labor market mechanisms may play an important role when examining DDs from a CETR. We follow that line and analyze under two different assumptions about the labor market complete market clearing, with flexible wages and no (involuntary) unemployment, and incomplete market clearing, with rigid wages and involuntary unemployment. Hence, we also need to assess relations between wage formation and unemployment. In Norway, wage-formation processes are highly coordinated such that centralized wage bargaining theory [31] becomes relevant. Based on the work by Blanchflower and Oswald [32], we derived wage-curve elasticities for our three labor types [33] and found that a 1% increase of the regional unemployment rate will reduce low-educated workers’ wages by 7% and medium- and highly-educated workers’ wages by about 4%. For the case of rigid wages, we can, hence, express the relation between wages and unemployment rate for, respectively, Low (L)-, Medium (M)- and Highly (H)-educated workers in region r, as in Equation (1). These parameter estimates are collected from empirical work presented in Johansen [34] and Johansen et al. [33].
3.4. Scenarios: Policy Shock with Scenario Implementation in the REMES Model
To ascertain whether a CETR can lead to double or even multiple dividends, we assess first the situation before the tax is introduced. In this benchmark model run, 67% of “Coke and refined petroleum products” is consumed by industry and the remainder by households. We do not see any consumption by the government. Doubling consumption taxes on this product generates an additional tax income for the government of 30 billion NOK in the benchmark situation. Note that, according to the model, additional effects of this policy also occur.
We follow the analysis framework developed by Goulder [6] and distinguish between weak and strong forms of the dividends. As mentioned in Section 3.1, we investigate two options to recycle the additional tax income of 30 billion NOK back into the economy: lump-sum transfers to all households or regional payroll tax reductions for industry. The latter option means a reduction of the total payroll tax income by 23% (benchmark case). To achieve this, we scale back initial payroll tax levels (Table 2) equally for all industry sectors and regions, by 2.9 percentage points. Notably, in Region R8, the government would then pay industries for hiring employees. The analyses are conducted under different assumptions on the labor market, discussed in Section 3.3: perfect market clearing, leading to flexible wages and no (involuntary) unemployment, and imperfect clearing with rigid wages and unemployment. This defines four scenarios, shown in Table 4.
4. Results: Analyzing Multiple Dividends
4.1. Main Results
After the benchmark results were established, we ran REMES for these four scenarios. Then, we calculated measures for the five dividends D1–D5 as defined in (2)–(6), comparing selected aspects against the corresponding benchmark results. This way, we could gauge the direction and magnitude of the dividends under different situations. Table 5 summarizes these results, marking negative dividends and, thus, situations where the introduction of a CETR counteracts the respective (sub-national) policies. D1 and D2 represent traditional dividends studied in double dividend analysis, while D3–D5 are distributional dividends focusing on households and regions. In the remaining situations, a strong form of the dividend is present with respect to these policy goals. For example, with perfect labor-market clearing (and, hence, flexible wages and no unemployment), a climate tax using recycling via lump-sum transfers to all households reinforces household inequality. On the other hand, it has, clearly, a positive effect on the environment and leverages inequality between rural and urban industry output.
Further, comparing values under Scenario I with values under Scenario II and likewise for Scenarios III and IV, we established whether weak forms of the dividends are present under the different assumptions on labor market clearing.
Table 5 and Equations (2)–(6) refer to dividend values on a national basis, aggregating over all regions. In a similar manner, dividends can be investigated for each of the eight regions separately, allowing for a geographically more detailed analysis. We do not replicate all regional values by way of tables, but illustrate selected results in Figure 4 and Figure 5.
We further define the five dividends and investigate mechanisms to explain them in the subsequent sections.
4.2. The First Dividend D1: Less Use of the Dirty Product
The first dividend D1, defined in Equation (2), measures how much of the taxed product is consumed after introducing the environmental tax, compared to the benchmark situation. This consumption comprises use by the industry as an intermediate product (and, hence, input factor for the production of other products), by households and by the government.
where p is the taxed product (in our case, “Coke and refined petroleum oil”) and denotes our eight regions. The third index refers to the benchmark (0) or the CETR (1) situation.
All four scenarios give a positive first dividend D1, ranging between 5.58% and 6.27%, shown in Table 5. How the tax is implemented with respect to the recycling scheme did not affect the direction and magnitude of D1 significantly, although slightly better values were achieved under lump-sum transfer. This scheme did not compensate the industry for the increased costs of the polluting product, such that the tax increase led to higher production costs and, hence, higher output prices and lower production levels. Households, on the other hand, increased consumption of the product (from domestic production or abroad) due to additional income from higher public transfers. However, as the industry used the largest share of the dirty product (67% in the benchmark situation), the reduction in usage by the industry was not offset by an increased usage by households. The payroll tax scheme, in contrast, compensated the industry by lowering labor taxes, thus dampening production costs more than the effect from the higher product tax. This led to a higher production level and, hence, less reduction of the use of the dirty product compared to the lump-sum transfer scheme.
Dependency on the taxed product varied between industries. For example, the product represents 16% of the total inputs of the transport industry, which experiences the largest output drops after a CETR is implemented. On the other hand, only 4% of the oil and gas industry’s input is “Coke and refined petroleum oil” products. With a Leontief relationship for nesting the industries’ material inputs (Figure 2), the intermediate product mix was locked for each industry. Hence, a drop in intermediate consumption of the taxed product was due to the lower output of industries more dependent on that product rather than an adjustment of the intermediate product mix. For example, outputs in the transport industry decreased sharply, while outputs in the service industry grew. However, in the longer run, an adjustment of the product mix due to price changes of input products may be expected. We test, therefore, the sensitivity of the resulting dividends with respect to input-factor substitution in Section 4.7.
In a regional context, the taxed product accounted for 2.8–3.7% of the total intermediate consumption in the regions. With a CETR, the product’s consumption price increased in all regions. However, this increase was much higher, 25%, in two (rural) regions, R2 and R7, compared to 10–15% elsewhere. These price variations further affected the level of the regional D1. In particular, R2 and R7 had a D1 of 20%, while the other regions had a dividend of between 5% and 10%. This implies that the CETR worked as intended with respect to reducing environmental effects from the taxed product.
4.3. The Second Dividend D2: National Output Change
The second dividend is measured as the change in national industry output,
With respect to the strong form, we found a positive D2 of under Scenario IV with rigid wages and reduced payroll taxes (Table 5). This conforms with the literature [18] stating that a second dividend is only likely if a wage-price inflation spiral is permitted and additional governmental income is recycled through payroll taxes. The presence of a rigid wage structure in Scenario IV prohibits large wage increases. At the same time, the wage curve formulation indicates that economic efficiency gains can be achieved through lower unemployment rates. These effects were in sum positive for the total output level defined in D2. Actually, as Figure 4 shows, wages increased—implying a lower unemployment rate—for all three types of labor in all regions.
Comparing the recycling scenarios, we found that a weak form was present under both assumptions on labor market adjustment: recycling through payroll tax reduction (Scenarios II and IV) yielded always a higher D2 than lump-sum transfers (Scenarios I and IV).
4.4. The Third Dividend D3: Distributional Effects on Industry Output
To assess how the CETR affected the industry in rural compared to urban regions, we calculated a third dividend D3,
where denotes the urban regions (R1, R3, R4, R6) and the rural ones (R2, R5, R7, R8).
In all four scenarios, outputs in rural regions were more positively affected by a CETR than outputs in urban regions such that a positive D3 occurred (Table 5). Two factors may explain the differences across regions and scenarios: a region’s dependency on the taxed product with the current industry structure and to what extent a wage-price inflation spiral was limited in the regions. The latter factor was affected by the former, but it varied between the regions also because of a varying degree of inter-regional trade.
Figure 4 shows how factor prices change with a CETR for the three types of labor and capital, respectively. Evidently, these changes were strongest in the urban region R4. The industry in this region depends also most on the taxed product, which represents of the total inputs in that region. Consequently, output in that region was affected most by a CETR. When the tax revenue was recycled via transfers to households and wage formation was not limited (Scenario I), that region R4 had the lowest regional D2, .
The distribution of labor skills helps to explain why factor prices increased more in urban areas. Since the economy shifted towards industries that use less of the polluting product and, at the same time, relied more on highly skilled labor (for example, the service industry), wages for those workers were pressed upwards. This labor type was more sought after in the economy and more present in urban areas (Table 3) such that the wage-price inflation spiral was higher there.
Overall, the figures indicate that a wage-price inflation spiral was prevented to a larger extent in rural regions than in urban ones, leading to a positive third dividend on the national level in all four scenarios. Interestingly, with limited factor-price changes on the labor market (rigid-wage Scenarios III and IV), differences in wage changes between regions were less pronounced (Figure 4). However, then capital prices varied more, and also, prices in urban regions were higher. Hence, there was still a positive dividend D3, although much lower than in the flexible-wage Scenarios I and II.
For regional industry, effects were more in line with expectations as expressed, e.g., in Becker [15]: the industry structure changed towards less pollution. As also observed by Vandyck and Van Regemorter [11] and Ciaschini et al. [13], the second dividend can vary regionally, and sector composition was mentioned as a major explanation factor. We found similar results, where the region with industry most dependent on the taxed product experienced the largest drop in output. For this part of the analysis, our findings are in line with the literature.
4.5. The Fourth Dividend D4: Distributional Effects on Household Income
Increased factor prices relative to the general price level led to higher household utility. Hence, the effects found for the industry in the form of D3 would have an opposite direction for households. The fourth dividend D4 investigates welfare dispersion among low- and high-income households,
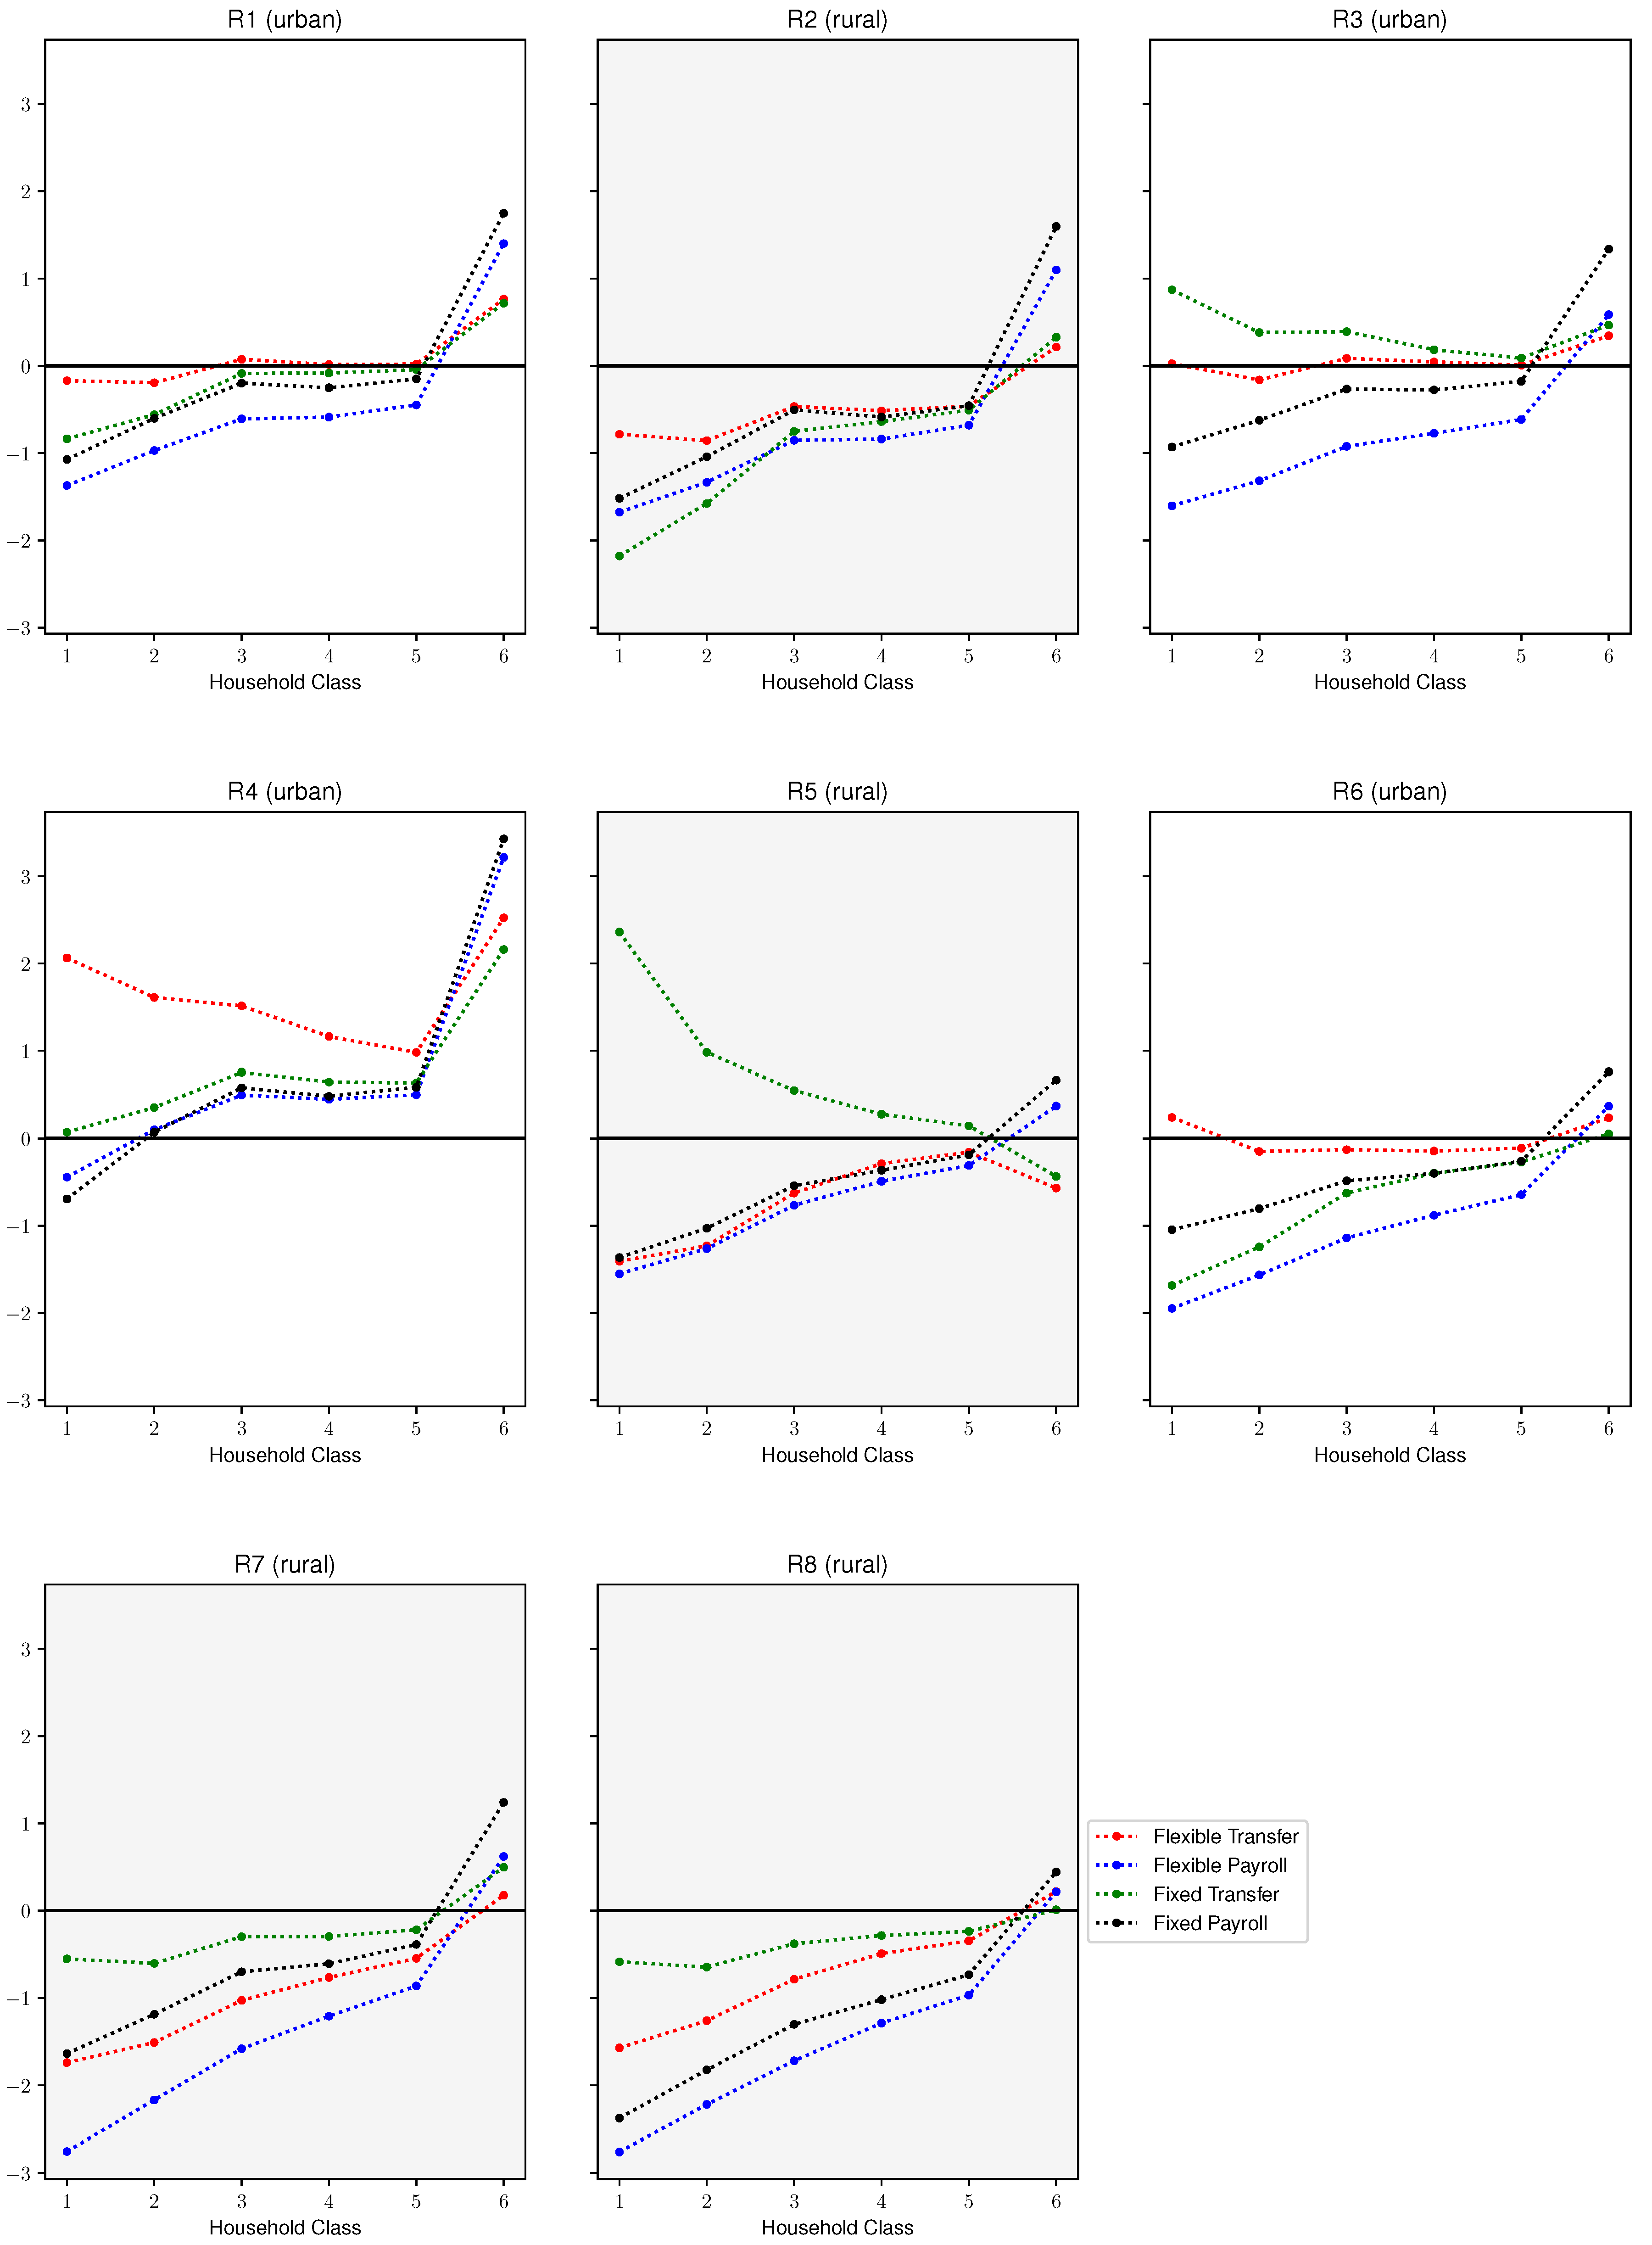
where defines the set of low-income household classes (Classes 1, 2 and 3) and the set of high-income classes (4, 5 and 6). and are the cardinals of these sets. The Equivalent Variation (EV) is a welfare measure to compare the new equilibrium to the benchmark situation, shown in Figure 5. (As households value utility through consumption, consumption level and, consequently, utility level were affected by price changes for both factor and consumption prices. The EV, introduced by Hicks [35], measures if a household’s consumption decreases or increases in the new equilibrium compared to the benchmark situation. Formally, it is defined as , where E is an expenditure function, and utility levels in the benchmark and new equilibrium situations, respectively, and the initial price level. For example, if the EV reports a welfare change of 1%, this represents an equivalent change in income, measured in initial prices.) For many household classes, the EV was negative in all regions, with the clear exception of the urban region R4. This means that a CETR will, in general, affect households negatively.
D4 is an unweighted measure of income dispersion using EV for low-compared to high-income households in all regions. For the scenarios studied here, neither a strong, nor a weak form of the dividend can be ascertained (Table 5), meaning that a CETR increased income inequality on a national scale. However, the transfer scenarios showed a better dividend and so did wage rigidity compared to flexible wages.
Two effects drove the dispersion in opposite directions. A consumption share effect should reduce inequality (decrease dispersion): in the benchmark situation, low-income households (Class 1) used less, about , of their income on the taxed product, while high-income households (Class 6) used about of their income on the product (Table A1 in Appendix A). Higher prices for coke and petroleum products would limit consumption more for high- than for low-income households.
The second effect (increased dispersion), often referred to as the effect on sources side [11], is that factor-price changes favored capital owners and higher-educated labor. Figure 4 shows that, under most scenarios, wage-level changes followed skill level: medium-educated workers’ wages changed more than low-educated workers’ wages, while highly educated workers benefited the most. This may be explained by a decline of industries using much low-educated labor and, vice versa, a growth of industries requiring high skills. The latter is typically more prevalent among high-income household classes such that these households benefited more. One exception is Scenario IV (reduced payroll taxes and rigid wages), where low-educated labor experienced the largest wage growth. In other words, when industry demand for labor increased because of lower input costs (drop in payroll taxes), wages were more upwards rigid for medium- and highly-skilled labor. This wage effect originated from the wage curve formulation, Equation (1). Capital price was more volatile, but changed more than wages in all regions-, except for Region R5 with a low share of high-income households. As high-income household classes have the largest share of capital endowment, differences in wage changes were reinforced. Thus, high-income households benefited most from a CETR. On the other hand, the low-income household Class 1 depended highly on transfers (Table A1). Obviously, the transfer recycling scheme was preferable over payroll tax recycling for these households. Actually, sometimes, transfer scenarios yielded a higher EV for low-income households than for most higher-income classes: for the rigid-wage situation, Scenario I, in Regions R3 and R5, and for the flexible-wage situation, Scenario III, in the urban Regions R4 and R6 (Figure 5). Then, a CETR will decrease household income dispersion in the concerned regions, and a strong version of the fourth dividend can be identified regionally.
Summarizing, changes in factor prices for differently skilled labor and capital were important for the fourth dividend, rather than how consumption shares of the taxed product affected households’ EV. Hence, these factor-price changes appeared to be the main drivers for income inequality effects from a CETR.
4.6. The Fifth Dividend D5: Distributional Effects on Household Welfare
Finally, we measured the fifth dividend D5 by way of the EV for the different household classes along an urban-rural axis,
with and the cardinalities of the sets of rural and urban regions, respectively. While D4 measures income dispersion between low- and high-income households, regardless of their location, D5 is concerned with income dispersion between rural and urban households, regardless of their income class.
This dividend was negative under all scenarios (Table 5), meaning that, at an aggregated level, rural households were affected worse by a CETR than urban ones. In the case of flexible wages, a weak form can be identified, though. This may be explained by two mechanisms: First, the limited wage inflation leading to a positive third dividend (industry in rural regions gaining from the environmental tax) had the opposite effect on rural households. The other way around, urban households would benefit from the tax. For example, for the urban Region R4, a CETR increased wages for all skill levels (Figure 4), resulting in a positive EV for almost all household classes (Figure 5). Second, households in urban regions were better endowed with highly-skilled labor than those in rural regions (Table 3). This led to higher income change and higher EV in general for urban households and, hence, to a negative D5.
4.7. Sensitivity with Respect to Key Elasticities of Substitution and Model Limitations
According to the literature [11,21], dividend results may be sensitive to assumptions on substitution elasticities in the CGE model. We investigated this for elasticities of substitution between product inputs and labor/capital and between labor types in the production process. These elasticities are denoted by and , respectively, in Figure 2.
If industries can substitute more easily between product inputs and labor/capital (e.g., we set ), they can adapt production better to price changes. Then, dividends D1 and D2 will improve. For example, D1 in the flexible transfer Scenario I increased from to , and D2 increased from to . This shows that, under certain conditions, the strong form of the DD was achievable also under Scenario I.
Increased substitution elasticity among labor types (setting to, say, five) led to wage harmonization between low-, medium- and highly-skilled workers. However, as capital is the driving factor for household inequality, price differences between capital and wages still played a significant role. As a consequence, the inequality measure EV was reduced, but to a varying degree, and high-income households would still benefit from the capital-price effect. In sum, this reduced the extent of dividends D4 and D5. For example, in the flexible transfer Scenario I, D4 was dampened from % to % and D5 from % to %. However, the dividends were still negative, with only small differences from the original scenario values.
Although partial equilibrium, macroeconomic, input–output models are used evaluating a CETR, CGE models are the preferred modeling framework in the DD literature [17,18]. Still, a static CGE model as the one we have used has its limitations in capturing all potential economic effects of a CETR. CGE modeling, while useful in large economic analyses of dynamic economic systems, does has its general disadvantages. Being based on microeconomic assumptions, CGE models might overlook or otherwise simplify macroeconomic tendencies in the systems. For this specific case, we can name one drawback for the implementation of the model: the fact that savings, and other similar financial mechanics, are very much simplified to allow for a single-period CGE model to run. Partial equilibrium models would have an easier time modeling the savings-investment-capital formation aspect of the financial systems. The effects on the welfare of the population created by investment policies will not, thus, be captured by a CGE model such as the one we proposed.
The methodology used in this paper is easily replicable with other regional CGE models; however, a generalization of our findings on sensitivity is, to some degree, confined to the situation considered here. We suspect also that some patterns and observations are linked to the REMES model structure. In particular, the following issues may require more attention: (1) Elasticities and nesting structure: With more heterogeneous elasticities capturing regional and industrial variations, the driving (exogenous) forces for the corresponding dividends may be identified in more detail. The sensitivity analysis in this section was a first step in this direction. (2) Aggregation of data for regions, products, industries and households: As mentioned in Section 4.4, calculations for the fourth dividend disregarded the distribution of household classes in each region (Table A1). Including these details may give a more accurate picture, in particular for regions with a disproportionately large presence of some household classes (e.g., R2 and R5). A further refinement in this regard may be a recalculation of these shares based on household income levels in the new equilibrium. (3) Type of policy reform and corresponding recycling: In our setup, the reform was not targeted specifically towards low-income households. The literature shows examples of transfer-recycling schemes aiming at the poorest households [12] and payroll tax schemes directed towards low-skilled workers [36]. With these approaches, the fourth dividend may turn out to be more positive for low-income households. Targeted recycling schemes, but also different types of CETRs, should be addressed in future research. (4) Model closure: It may be worthwhile to investigate the effects due to fixed regional labor supply assumptions. The workforce is rather immobile and will be affected by regional differences in wage changes. Hence, with a model closure reflecting low barriers to migrate among regions in Norway, we expect that wage differences would play a minor role for the fifth dividend.
5. Conclusions with Policy Recommendations for a CETR
We analyzed economic effects of a carbon energy tax reform. In particular, we were interested in policy conflicts that may limit the efficiency of such a tax. In a Norwegian context, this concerns regional dispersion effects conflicting with regional policy aims and income inequality effects conflicting with social distribution policies. Our analysis builds on double dividend theory stating that, in addition to reducing the usage of polluting products by way of consumption taxes, positive side effects may materialize in the economy. To investigate the potential of such side effects, we test two schemes for recycling the additional governmental income back into the economy for two different ways of wage formation, resulting in four policy scenarios. The effects are simulated in a regional CGE model for Norway, REMES.
The taxed product is substituted away from the economy, providing environmental gains. A second dividend—positive side effects on the economy due to increased outputs—is achievable, but only under specific assumptions. Notably, we find a second dividend if the wage-price inflation relation is limited and the additional tax income is used to reduce payroll taxes (Scenario IV).
Verifying more differentiated economic and social side effects (third, fourth and fifth dividends) appears challenging. We were especially interested in effects on rural compared to urban regions with respect to Norwegian regional policy goals and in effects on different household income classes, reflecting social policy goals. Output in rural regions increased more or decreased less than in urban regions after implementing the tax, which concurs with regional policy goals. One reason is weaker wage-price inflation growth and, thus, lower household welfare in rural regions. Income inequality between household classes also worsened due to a demand shift towards products from industries depending on highly-educated labor. A third effect is that the price of capital increases more than wages, leading to increased income dispersion. The transfers scheme counters this to some degree, but cannot fully compensate.
Policy instruments such as a CETR should be evaluated not only with respect to their intended effect, but more comprehensively. Potential side effects may be both positive and negative and vary often between regions, industry sectors or household types, potentially contradicting other national and sub-national policy goals. Our analysis showed conflicting sub-national policy goals under all four scenarios. In particular, with a regionally-differentiated payroll tax to balance the public budget, as in Norway, a CETR increases household inequality. This poses problems with respect to policy goals towards an egalitarian society. To obtain the best possible impact, differentiated taxes or supplements by other instruments may be a solution. However, this is an intricate exercise as improvements with respect to one aspect may lead to new goal conflicts elsewhere. Moreover, in order to be efficient, policy instruments should be easily understandable, as well as broadly applicable and valid in a rapidly changing economic, social and political environment.
Clearly, the situation described in this paper is not unique to Norway. Indeed, there are many similarities between Norwegian regional policy aims and those of the EU’s cohesion policy. Although the availability of sufficiently disaggregated demographic data is crucial, it may be interesting to apply our approach to a broader setting such as nations—or regions—in the EU. We surmise that also there, goals of leveling social and regional disparities together with national economic and environmental improvements cannot simultaneously be fulfilled with a CETR.
An interesting moment to explore further in this context is regionally-varying endowment with polluting and non-polluting energy resources. In countries with a traditionally high share of renewable energy sources, such as Norway, one may expect weaker effects of a CETR. In particular in the short term, it may also be easier in these regions to adapt activities still dependent on polluting energy sources to cleaner forms as know-how and skilled work force may be more available. On the other hand, with high dependency on fossil energy sources, a CETR may trigger more long-term innovation in the affected industry sectors in order to survive.
Concluding, public debate on environmental taxes is often concerned with direct effects on households, for example, through consumer price effects. However, as our analysis underlines, household welfare is primarily affected by factor side effects. For regional industry, the effects are more in line with the political argument: industry structure changes towards less pollution. This is where the emphasis of discussions should lie, triggering technological innovation and restructuring to support trade and business also in more rural regions.
Author Contributions
Software, U.J. and G.A.P.-V.; Data Curation, U.J.; Validation, U.J. and G.A.P.-V.; Visualization, U.J. and G.A.P.-V.; Writing—original draft preparation, U.J., G.A.P.-V. and A.T.W.; Writing—Review and editing, U.J., G.A.P.-V. and A.T.W.
Funding
This research was funded by the Research Council of Norway (Grant No. 218550, project REGMODELL) and the European Commission under the Horizon 2020 program (Grant No. 691843, project SET-Nav).
Acknowledgments
We acknowledge four anonymous referees and the academic editor for their useful comments during the referee process.
Conflicts of Interest
The authors declare no conflict of interest.
Appendix A. Data
Figure A1.
Ten income deciles groups based on micro data from 2013 of all workers in Norway, annual income.
Figure A1.
Ten income deciles groups based on micro data from 2013 of all workers in Norway, annual income.


Table A1.
Data by household class.
| Class 1 | Class 2 | Class 3 | Class 4 | Class 5 | Class 10 | |||
|---|---|---|---|---|---|---|---|---|
| (Decile 1) | (Deciles 2–3) | (Deciles 4–5) | (Deciles 6–7) | (Deciles 8–9) | (Decile 10) | |||
| Distribution of income 1 | ||||||||
| Share of labor income | 1.1% | 9.5% | 16.6% | 21.1% | 27.5% | 24.1% | ||
| Share of transfers | 4.5% | 26.2% | 23.6% | 18.9% | 16.8% | 9.9% | ||
| Share of capital income | 0.0% | 3.5% | 6.9% | 8.8% | 13.6% | 67.2% | ||
| Average taxation rates 1 | ||||||||
| Labor income tax | 17% | 17% | 21% | 24% | 27% | 33% | ||
| Capital income tax | 28% | 28% | 28% | 28% | 28% | 28% | ||
| Distribution of households within regions 1 | ||||||||
| R1 | 8.3% | 18.8% | 20.4% | 20.6% | 20.9% | 11.1% | ||
| R2 | 10.7% | 23.1% | 22.5% | 20.5% | 17.8% | 5.4% | ||
| R3 | 8.7% | 20.1% | 18.5% | 19.3% | 21.0% | 12.5% | ||
| R4 | 8.8% | 20.8% | 21.2% | 20.2% | 19.9% | 9.0% | ||
| R5 | 11.3% | 24.6% | 25.4% | 19.7% | 15.1% | 4.0% | ||
| R6 | 8.8% | 20.2% | 21.1% | 21.5% | 19.9% | 8.4% | ||
| R7 | 9.7% | 20.4% | 22.1% | 22.5% | 19.5% | 5.8% | ||
| R8 | 9.9% | 20.4% | 22.2% | 22.1% | 20.0% | 5.3% | ||
| Consumption product basket 2 | ||||||||
| Coke and refined petroleum oil | 1.54% | 3.03% | 2.58% | 3.27% | 3.28% | 3.05% | ||
| Primary | 15.16% | 12.87% | 13.50% | 14.82% | 14.25% | 12.17% | ||
| Other oil and gas products | 0.03% | 0.02% | 0.01% | 0.01% | 0.01% | 0.01% | ||
| Trade | 5.66% | 3.76% | 4.51% | 5.20% | 6.14% | 6.88% | ||
| Manufacturing | 29.09% | 28.17% | 28.30% | 25.38% | 23.50% | 23.51% | ||
| Construction | 0.76% | 1.75% | 3.24% | 2.78% | 2.65% | 4.41% | ||
| Transport | 5.78% | 15.20% | 14.34% | 15.70% | 17.53% | 17.90% | ||
| Service | 41.98% | 35.21% | 33.51% | 32.83% | 32.64% | 32.08% | ||
| Total consumption | 100% | 100% | 100% | 100% | 100% | 100% | ||
1 Source: Micro data on income and SSB.no (Table 07751) for transfers and capital income and for tax rates; 2 national expenditure shares by consumption categories and six income deciles. Source: SSB.no (Table 10444).
References
- SSB. Statistics Norway. Available online: http://www.ssb.no/befolkning/artikler-og-publikasjoner/_attachment/253560?_ts=152b138ba58 (accessed on 11 November 2018).
- Ekins, P.; Speck, S. Competitiveness and Exemptions From Environmental Taxes in Europe. Environ. Resour. Econ. 1999, 13, 369–396. [Google Scholar] [CrossRef]
- Morley, B. Empirical evidence on the effectiveness of environmental taxes. Appl. Econ. Lett. 2012, 19, 1817–1820. [Google Scholar] [CrossRef] [Green Version]
- Lapinskienė, G.; Peleckis, K.; Nedelko, Z. Testing environmental Kuznets curve hypothesis: The role of enterprise’s sustainability and other factors on GHG in European countries. J. Bus. Econ. Manag. 2017, 18, 54–67. [Google Scholar] [CrossRef]
- Grossman, G.M.; Krueger, A.B. Economic Growth and the Environment*. Q. J. Econ. 1995, 110, 353–377. [Google Scholar] [CrossRef]
- Goulder, L.H. Environmental Taxation and the “Double Dividend”: A Reader’s Guide. In Public Economics and the Environment in an Imperfect World; Bovenberg, L., Cnossen, S., Eds.; Springer: New York, NY, USA, 1995; pp. 277–313. [Google Scholar]
- Norwegian Ministry of Finance. Sett Pris på Miljøet—Rapport Fra Grønn Skattekommisjon; Report NOU 2015:15; Departementenes sikkerhets- og serviceorganisasjon. Informasjonsforvaltning: Oslo, Norway, 2015. (In Norwegian)
- European Commission. My Region, My Europe, Our Future. Seventh Report on Economic, Social and Territorial Cohesion. Available online: http://ec.europa.eu/regional_policy/en/information/cohesion-report/ (accessed on 10 June 2018).
- Rausch, S.; Metcalf, G.E.; Reilly, J.M. Distributional impacts of carbon pricing: A general equilibrium approach with micro-data for households. Energy Econ. 2011, 33 (Suppl. 1), S20–S33. [Google Scholar] [CrossRef] [Green Version]
- Proost, S.; Van Regemorter, D. The double dividend and the role of inequality aversion and macroeconomic regimes. Int. Tax Public Financ. 1995, 2, 207–219. [Google Scholar] [CrossRef]
- Vandyck, T.; Van Regemorter, D. Distributional and regional economic impact of energy taxes in Belgium. Energy Policy 2014, 72, 190–203. [Google Scholar] [CrossRef]
- Van Heerden, J.; Gerlagh, R.; Blignaut, J.; Horridge, M.; Hess, S.; Mabugu, R.; Mabugu, M. Searching for Triple Dividends in South Africa: Fighting CO2 pollution and poverty while promoting growth. Energy J. 2006, 27, 113–141. [Google Scholar] [CrossRef]
- Ciaschini, M.; Pretaroli, R.; Severini, F.; Socci, C. Regional double dividend from environmental tax reform: An application for the Italian economy. Res. Econ. 2012, 66, 273–283. [Google Scholar] [CrossRef] [Green Version]
- Lorch-Falch, S. Ap-Forslag Godt Mottatt: Sp åpen for Billigere Bensin På Bygda; E24: Oslo, Norway, 2017. (In Norwegian) [Google Scholar]
- Becker, T.I. Økning i CO2-Avgifta Rammer Lokalt Næringsliv; Shortsea Shipping: Oslo, Norway, 2017. (In Norwegian) [Google Scholar]
- SEURECO; M-FIVE; SINTEF; Fraunhofer ISI. Macro-Economic Consequences of Sustainable Energy Sector Innovation; SET-Nav Deliverable D8.2, European Commission H2020 Project Number 691843; European Commission: Brussels, Belgium, 2018; in preparation. [Google Scholar]
- Freire-Gonzalez, J. Environmental taxation and the double dividend hypothesis in CGE modeling literature: A critical review. J. Policy Model. 2017, 40, 194–223. [Google Scholar] [CrossRef]
- Bosquet, B. Environmental tax reform: Does it work? A survey of the empirical evidence. Ecol. Econ. 2000, 34, 19–32. [Google Scholar] [CrossRef]
- Pearce, D. The Role of Carbon Taxes in Adjusting to Global Warming. Econ. J. 1991, 101, 938–948. [Google Scholar] [CrossRef]
- Bovenberg, A.L.; Van der Ploeg, F. Consequences of environmental tax reform for involuntary unemployment and welfare. Environ. Resour. Econ. 1998, 12, 137–150. [Google Scholar] [CrossRef]
- Fullerton, D.; Heutel, G. The general equilibrium incidence of environmental taxes. J. Public Econ. 2007, 91, 571–591. [Google Scholar] [CrossRef]
- Manresa, A.; Sancho, F. Implementing a double dividend: Recycling ecotaxes towards lower labor taxes. Energy Policy 2005, 33, 1577–1585. [Google Scholar] [CrossRef]
- Freire-González, J.; Ho, M.S. Environmental Fiscal Reform and the Double Dividend: Evidence from a Dynamic General Equilibrium Model. Sustainability 2018, 10, 501. [Google Scholar] [CrossRef]
- Williams, R.C. Environmental Tax Interactions when Pollution Affects Health or Productivity. J. Environ. Econ. Manag. 2002, 44, 261–270. [Google Scholar] [CrossRef]
- Schwartz, J.; Repetto, R. Nonseparable Utility and the double dividend debate: Reconsidering the tax-interaction effect. Environ. Resour. Econ. 2000, 15, 149–157. [Google Scholar] [CrossRef]
- Bento, A.M.; Jacobsen, M. Ricardian rents, environmental policy and the ‘double-dividend’ hypothesis. J. Environ. Econ. Manag. 2007, 53, 17–31. [Google Scholar] [CrossRef]
- Boccanfuso, D.; Estache, A.; Savard, L. The Intra-country Distributional Impact of Policies to Fight Climate Change: A Survey. J. Dev. Stud. 2011, 47, 97–117. [Google Scholar] [CrossRef] [Green Version]
- Werner, A.; Johansen, U.; Perez-Valdes, G.A.; Stokka, A. REMES—A Regional Equilibrium Model for Norway with Focus on the Energy System; Report A26705; SINTEF: Trondheim, Norway, 2015. [Google Scholar]
- Norwegian Ministry of Climate and Environment. New Emission Commitment for Norway for 2030—Towards Joint Fulfilment with the EU; Report to the Storting (White Paper), Meld. St. 13 (2014–2015); Departementenes sikkerhets- og serviceorganisasjon. Informasjonsforvaltning: Oslo, Norway, 2015.
- Haraldsen, K.W.; Hammersland, R.; Sparrma, V. Wage Equations and Labour Demand by Education; Report 2015/49; Statistics Norway: Oslo, Norway, 2015. [Google Scholar]
- McDonald, I.M.; Solow, R.M. Wage Bargaining and Employment. Am. Econ. Rev. 1981, 71, 896–908. [Google Scholar]
- Blanchflower, D.G.; Oswald, A.J. The Wage Curve; MIT Press: Cambridge, MA USA, 1994. [Google Scholar]
- Johansen, U.; Egging, R.; Johansen, K. Regional wage responsiveness to unemployment—Rural-urban heterogeneity and policy implications. Labour 2018, submitted. [Google Scholar]
- Johansen, K. Wage Flexibility for Skilled and Unskilled Workers: New Evidence on the Norwegian Wage Curve. Labour 1999, 13, 413–432. [Google Scholar] [CrossRef]
- Hicks, J.R. The foundations of welfare economics. Econ. J. 1939, 49, 696–712. [Google Scholar] [CrossRef]
- Fæhn, T.; Gómez-Plana, A.G.; Kverndokk, S. Can a carbon permit system reduce Spanish unemployment? Energy Econ. 2009, 31, 595–604. [Google Scholar] [CrossRef] [Green Version]
Figure 1.
Rural (gray) and urban (white) regions considered in the dividend analyses.

Figure 2.
Diagram of Constant Elasticities of Substitution (CES) production functions in the regional CGE model.
Figure 2.
Diagram of Constant Elasticities of Substitution (CES) production functions in the regional CGE model.

Figure 3.
A sketch of the money flows in one region of the CGE model REMES. Cons., Consumption.

Figure 4.
Percentage change in wage levels and price of capital across the regions and scenarios.

Figure 5.
Changes in Equivalent Variation (EV) across household classes and regions under the four scenarios (in percent).
Figure 5.
Changes in Equivalent Variation (EV) across household classes and regions under the four scenarios (in percent).

Table 1.
Effects on first–fifth dividends, based on the literature survey.
| Dividends | Effects on | Characteristics of Effect | References |
|---|---|---|---|
| First (D1) | climate/pollution/environment | mainly positive | [6,10,17,18,19,20,21,22,23,24,25] |
| Second (D2) | national output/employment | positive and negative | |
| Third (D3) | rural vs. urban output change | few insights | [9,11,13] |
| Fourth (D4) | household income inequality | few insights; positive and negative | [9,10,11,12] |
| Fifth (D5) | rural vs. urban household inequality | no insights found | – |
Table 2.
Initial payroll taxes in the seven industry sectors and eight regions.
| Regions | Primary | Oil and Gas | Manufacturing | Construction | Trade | Transport | Service |
|---|---|---|---|---|---|---|---|
| R1 (urban) | 13.8% | 14.1% | 14.1% | 14.1% | 14.1% | 14.1% | 14.1% |
| R3 (urban) | 13.4% | 14.1% | 14.1% | 14.1% | 14.1% | 14.1% | 14.1% |
| R4 (urban) | 13.1% | 14.1% | 13.8% | 13.8% | 13.9% | 13.9% | 13.9% |
| R6 (urban) | 13.2% | 14.1% | 14.1% | 14.1% | 14.1% | 14.1% | 14.1% |
| R2 (rural) | 10.2% | 11.6% | 10.9% | 10.7% | 11.0% | 11.3% | 11.0% |
| R5 (rural) | 6.9% | 7.7% | 7.7% | 7.3% | 7.4% | 6.9% | 7.4% |
| R7 (rural) | 5.3% | 5.3% | 5.8% | 5.9% | 6.1% | 6.1% | 6.1% |
| R8 (rural) | 0.0% | 0.0% | 0.0% | 0.0% | 0.0% | 0.0% | 0.0% |
Table 3.
Labor skill types: industry requirements and household endowment. Example data for Regions R1 and R8.
Table 3.
Labor skill types: industry requirements and household endowment. Example data for Regions R1 and R8.
| R1 (Urban) | R8 (Rural) | |||||
|---|---|---|---|---|---|---|
| Low | Medium | High | Low | Medium | High | |
| Industries | ||||||
| Primary | 75.5% | 14.5% | 10.0% | 83.9% | 11.3% | 4.9% |
| Oil and gas | 43.3% | 21.9% | 34.8% | 71.5% | 17.8% | 10.8% |
| Trade | 72.4% | 22.1% | 5.5% | 87.1% | 10.8% | 2.1% |
| Manufacturing | 60.9% | 22.6% | 16.5% | 80.1% | 15.8% | 4.1% |
| Construction | 82.1% | 12.8% | 5.1% | 91.4% | 7.2% | 1.4% |
| Transport | 74.1% | 19.5% | 6.4% | 87.6% | 11.3% | 1.0% |
| Service | 36.9% | 40.2% | 22.8% | 45.7% | 42.4% | 11.9% |
| Households | ||||||
| Class 1 | 76.5% | 20.2% | 3.3% | 85.4% | 13.4% | 1.2% |
| Class 2 | 74.1% | 21.2% | 4.7% | 79.9% | 16.9% | 3.2% |
| Class 3 | 70.9% | 24.4% | 4.7% | 75.5% | 21.5% | 2.9% |
| Class 4 | 54.0% | 36.0% | 10.0% | 54.1% | 39.8% | 6.1% |
| Class 5 | 44.5% | 35.2% | 20.2% | 51.6% | 37.0% | 11.4% |
| Class 6 | 28.7% | 36.6% | 34.7% | 47.6% | 28.4% | 24.0% |
Table 4.
Four scenarios for dividend analysis.
| Income Recycling Scheme | |||
|---|---|---|---|
| Lump Sum Transfer to Households | Payroll Tax Reduction | ||
| Labor market clearing | Perfect (flexible wages, no unemployment) | I | II |
| Flexible Transfer | Flexible Payroll | ||
| Imperfect (rigid wages, unemployment) | III | IV | |
| Fixed Transfer | Fixed Payroll | ||
Table 5.
Doubling consumption tax on “Coke and refined petroleum products” and recycling back into the economy, first–fifth dividends on a national basis.
Table 5.
Doubling consumption tax on “Coke and refined petroleum products” and recycling back into the economy, first–fifth dividends on a national basis.
| Dividend | Scenario | |||
|---|---|---|---|---|
| I | II | III | IV | |
| Flexible Transfer | Flexible Payroll | Fixed Transfer | Fixed Payroll | |
| D1. First | % | % | % | % |
| (Climate, pollution, environment) | ||||
| D2. Second | % | % | % | % |
| (National economic output) | ||||
| D3. Third | +0.58% | +0.52% | +0.01% | +0.22% |
| (Rural vs. urban output) | ||||
| D4. Fourth | % | % | % | % |
| (Low vs. high income households) | ||||
| D5. Fifth | % | % | % | % |
| (Rural vs. urban households) | ||||
© 2018 by the authors. Licensee MDPI, Basel, Switzerland. This article is an open access article distributed under the terms and conditions of the Creative Commons Attribution (CC BY) license (http://creativecommons.org/licenses/by/4.0/).
Share and Cite
MDPI and ACS Style
Johansen, U.; Perez-Valdes, G.A.; Werner, A.T. Regional Aspects of a Climate and Energy Tax Reform in Norway—Exploring Double and Multiple Dividends. Sustainability 2018, 10, 4175. https://doi.org/10.3390/su10114175
AMA Style
Johansen U, Perez-Valdes GA, Werner AT. Regional Aspects of a Climate and Energy Tax Reform in Norway—Exploring Double and Multiple Dividends. Sustainability. 2018; 10(11):4175. https://doi.org/10.3390/su10114175
Chicago/Turabian StyleJohansen, Ulf, Gerardo A. Perez-Valdes, and Adrian Tobias Werner. 2018. "Regional Aspects of a Climate and Energy Tax Reform in Norway—Exploring Double and Multiple Dividends" Sustainability 10, no. 11: 4175. https://doi.org/10.3390/su10114175
Note that from the first issue of 2016, this journal uses article numbers instead of page numbers. See further details here.