Cooperation between Two Micro-Grids Considering Power Exchange: An Optimal Sizing Approach Based on Collaborative Operation

1
School of Economics and Management, North China Electric Power University, Beijing 102206, China
2
State Grid Jibei Electric Power Company Engineering Management Company, Beijing 100070, China
*
Author to whom correspondence should be addressed.
Sustainability 2018, 10(11), 4198; https://doi.org/10.3390/su10114198
Submission received: 25 September 2018
/
Revised: 3 November 2018
/
Accepted: 5 November 2018
/
Published: 14 November 2018
(This article belongs to the Special Issue Sustainable Microgrids for Remote, Isolated and Emerging Areas: Current Trends and Perspectives in Policies, Practices and Technologies)
Abstract
:Optimal sizing of single micro-grid faces problems such as high life cycle cost, low self-consumption of power generated by renewable energy, and disturbances of intermittent renewable energy. Interconnecting single micro-grids as a cooperative system to reach a proper size of renewable energy generations and batteries is a credible method to promote performance in reliability and economy. However, to guarantee the optimal collaborative sizing of two micro-grids is a challenging task, particularly with power exchange. In this paper, the optimal sizing of economic and collaborative for two micro-grids and the tie line is modelled as a unit commitment problem to express the influence of power exchange between micro-grids on each life cycle cost, meanwhile guaranteeing certain degree of power supply reliability, which is calculated by Loss of Power Supply Probability in the simulation. A specified collaborative operation of power exchange between two micro-grids is constructed as the scheduling scheme to optimize the life cycle cost of two micro-grids using genetic algorithm. The case study verifies the validity of the method proposed and reveal the advantages of power exchange in the two micro-grids system. The results demonstrate that the proposed optimal sizing means based on collaborative operation can minimize the life cycle cost of two micro-grids respectively considering different renewable energy sources. Compared to the sizing of single micro-grid, the suggested method can not only improve the economic performance for each micro-grid but also form a strong support between interconnected micro-grids. In addition, a proper price of power exchanges will balance the cost saving between micro-grids, making the corresponding stake-holders prefer to be interconnected.
1. Introduction
Distributed renewable energy generations and storage systems are equipped in micro-grids (MGs) to support load efficaciously and minimize the environmental disruption [1]. Recently, as the research of PV and Wind turbine (WT) develops, the generalization of residential MGs grows in popularity [2]. Multiple adjacent MGs located within a certain range are tend to be connected to form a multiple micro-grid (MMG) system to reach a better performance to supply load [3]. Distinct from sizing a single micro-grid, for a two micro-grids system, power can be exchanged between MGs, which makes the sizing process of two micro-grids system more uncertain. Furthermore, most existing sizing means are focused on a single micro-grid without power exchange, which is hard to adapt to multiple micro-grids system. Collaborative operation mechanism makes sizing of photovoltaic-wind turbine-battery system for a two micro-grids system more uncertain. Therefore, in order to improve economy performance of neighbouring MGs and ensure the reliability at the same time, it is meaningful to study cooperative sizing of two micro-grids considering different local renewable energy resources, which may lay the foundation for further cooperative sizing of MMG system.
1.1. Literature Review
Recently, the sizing of renewable energy systems has attracted the attention of many scholars worldwide. Economically, the total annual cost of the system should be minimized by means of optimizing the combination of wind turbines, PV panels and the batteries system [4]. That is to say, the aim of obtaining the right amount optimized of wind turbines, photovoltaic panels, and storage is to minimize the annual value of total cost for the entire system under certain constraints. Many scholars have studied in optimizing sizing of hybrid wind and photovoltaic systems. For example, on the base of a simple graphical construction, the optimal combination of a hybrid PV-wind system was investigated without taking account of the actual scale of the battery in [5]. Taking the per-unit cost of the power produced and the total system cost into consideration, a method was present to optimize a hybrid wind/PV system in [6]. The load considered in the optimization was constant. Ref. [7] proposed a novel method to study the optimal sizing of stand-alone wind and photovoltaic systems using GA. Ref. [8] discussed a general concept for search the optimal combination of hybrid wind and photovoltaic systems to implement with grid and without grid. An algorithm was applied in [9] to find the the optimal combination of wind and photovoltaic systems without loss of power supply probabilities using load, solar insolation, and hourly mean of wind speed. Based on either integer or binary variables, mixed integer linear programming was used in [10] to search the optimal plan of hybrid wind-PV system in rural area. The authors in [11] used a multi-objective evolutionary and genetic algorithm to find the optimum design of hybrid systems minimizing three targets including the total cost of the service life of the installation, the unmet power demand and pollution. The technic-economic estimation of a stand-alone hybrid PV-wind system equipped with battery storage was studied considering cost of energy and system net present cost in [12]. The analysis for the influence of wind turbines, photovoltaic panels, and battery storage sizing on the system’s economic performance were studied as well. Power generation and consumption missions of mixed energy systems were optimized simultaneously using a discrete-time MILP method to maximize the total profit in [13]. The Hybrid Optimization Model for Electric Renewable (HOMER) software have been applied to simulation, modeling, optimum sizing, and economic analysis of renewable energy systems for micro-grid (e.g., [14,15,16,17,18]). For example, in Ref. [18], with grid and without grid, HOMER was used to study the practicability of application of renewable energy generations of a small hotel. The option of stand-alone mode was superior to grid-connected mode to meet the load economically. Ref. [19] investigated methods and computer tools of optimal sizing for renewable energy systems, in which HOMER shows advantages in simulation over other available softwares. Sizing for renewable energy generation system of micro-grid is based on the dispatch of power. Jun Xiao [20] proposed a approach for coordinated sizing of energy storage (ES) and diesel generators in an off-grid micro-grid on base of discrete Fourier transform (DFT). The DFT-based coordinated control method distributes balance energy between the two sections through frequency-time domain transform. In addition, the effectiveness of the suggested method is proved by a practical case. Raji Atia and Noboru Yamada [21] proposed a novel method on base of MILP to find the optimization for a mixed renewable energy system equipped with a battery storage system in residential micro-grids in which the demand response of available controllable appliances is taken into account in the suggested optimization task with decreasing calculation burdens. A methodology to optimize combination of a self-governing mixed photovoltaic and wind system was proposed in [22]. The goal of the proposed method is to achieve the configuration to ensure system reliability and a most optimal value of levelled cost of energy among a set of systems components. A trade-off analysis on the sizing of micro-grid components aiming at autonomous application in remote areas was studied in [23]. The results show that there is a certain front of trade-off between the battery scale and other performance indexes, due to dynamic performance of the battery storage and the variation of photovoltaic output. The authors in [24] carry out a study for a Seawater reverse osmosis desalination (SWRO) system on a small scale, which is powered by photovoltaic. The system uses hydraulic energy recovery on the base of a DC micro-grid idea and combines a short-term electric energy storage with a short-term hydraulic energy storage. The outcome of the experiment reveals that it is available to effectively run the SWRO system powered by photovoltaic. In addition, the SWRO system operates continuously and smoothly, which is to say the feed water pressure changes a little when the solar irradiation intensity varies rapidly and sharply owning to the existence of short-term storage. However, the literatures mentioned above only considered power dispatch within one single MG without considering power exchange with other MGs.
With multiple neighbouring MGs appearing in a local area, single micro-grids can be interconnected as a multiple micro-grid (MMG) system to seek for a better performance of energy [25]. There also have been an increasing number of researches focusing on MMG operation approaches. A method based on memetic algorithm to create a micro-grid cluster for buildings obtaining local share of cooling energy is studied in [26]. The same system was studied in [27], using an augmented multi-objective particle swarm optimization to share thermal energy among micro-grids. The authors in [28] studied optimal scheduling of MMG to make power sharing between MGs possible under interconnected operation mode. The literatures shows that cooperative operation between MGs can be beneficial in improving both economy and operation performance. In [29], the authors used an interactive energy game matrix to investigate operational interaction of networked MGs. Ref. [30] built a centralized control model for cooperative network of smart micro-grids with power exchanges between the neighbors, aiming at maximizing the total profit of all micro-grid operators. In [31] economic operation of a multiple micro-grid system is investigated with a stochastic decision model, considering uncertainties in load and RESs. The authors in [32] modeled the stochastic nature of renewable energy systems, loads, and prices according to their probability density functions to achieve the optimal operation of distribution networks in the notion of MMGs. Kou et al. [33] studied that every MG tried to get the optimal operation cost working with other MGs keeping track of the power reference delivered by distribution network operator. However, it is hard to apply this method because MG operators have no intention to follow the scheduling of distribution network operator. Christos-Spyridon Karavas [34] studied the plan and investigation of a decentralized energy management system for the self-governing polygeneration micro-grid topology to gives the feasibility to manage every unit of the micro-grid separately. Compared with the centralized solution, the decentralized solution presents promotions in economical and operational terms with nearly same technical performance. A multi-agent decentralized energy management system was investigated in [35], in which the energy management problem was modelled using game theory. The Nash equilibrium was used to balance the possible diverging aims of the agents by maximizing their preferences.
1.2. Contributions and Organization
This paper puts forward an optimal sizing approach for photovoltaic-wind turbine-battery system and tie line of two interconnected micro-grids in off-grid area considering power exchange. A specific collaborative operation strategy is built to describe the power exchange relationships between two MGs under interconnected mode. Thus, sizing of the photovoltaic-wind turbine-battery system of the two micro-grids can be optimized collaboratively based on reasonable power exchange between MGs to minimize the two micro-grids life cycle cost. To the best of our knowledge, few comprehensive research has been conducted to investigate optimal sizing for photovoltaic-wind turbine-battery system and tie line in two micro-grids system considering power exchange between micro-grids. The main contributions of this paper can be concluded as follows:
- (1)
- An optimal sizing model of photovoltaic, wind turbine, battery and tie line for two micro-grids based on collaborative operation was established, and the cost comparison for sizing of each micro-grid under independent mode and interconnected mode was analyzed.
- (2)
- The power exchange between two micro-grids under interconnection is analyzed.
- (3)
- A sensitivity analysis is made for the price of power transaction between interconnected micro-grids to find the optimal price which makes the stake-holders prefer to be interconnected.
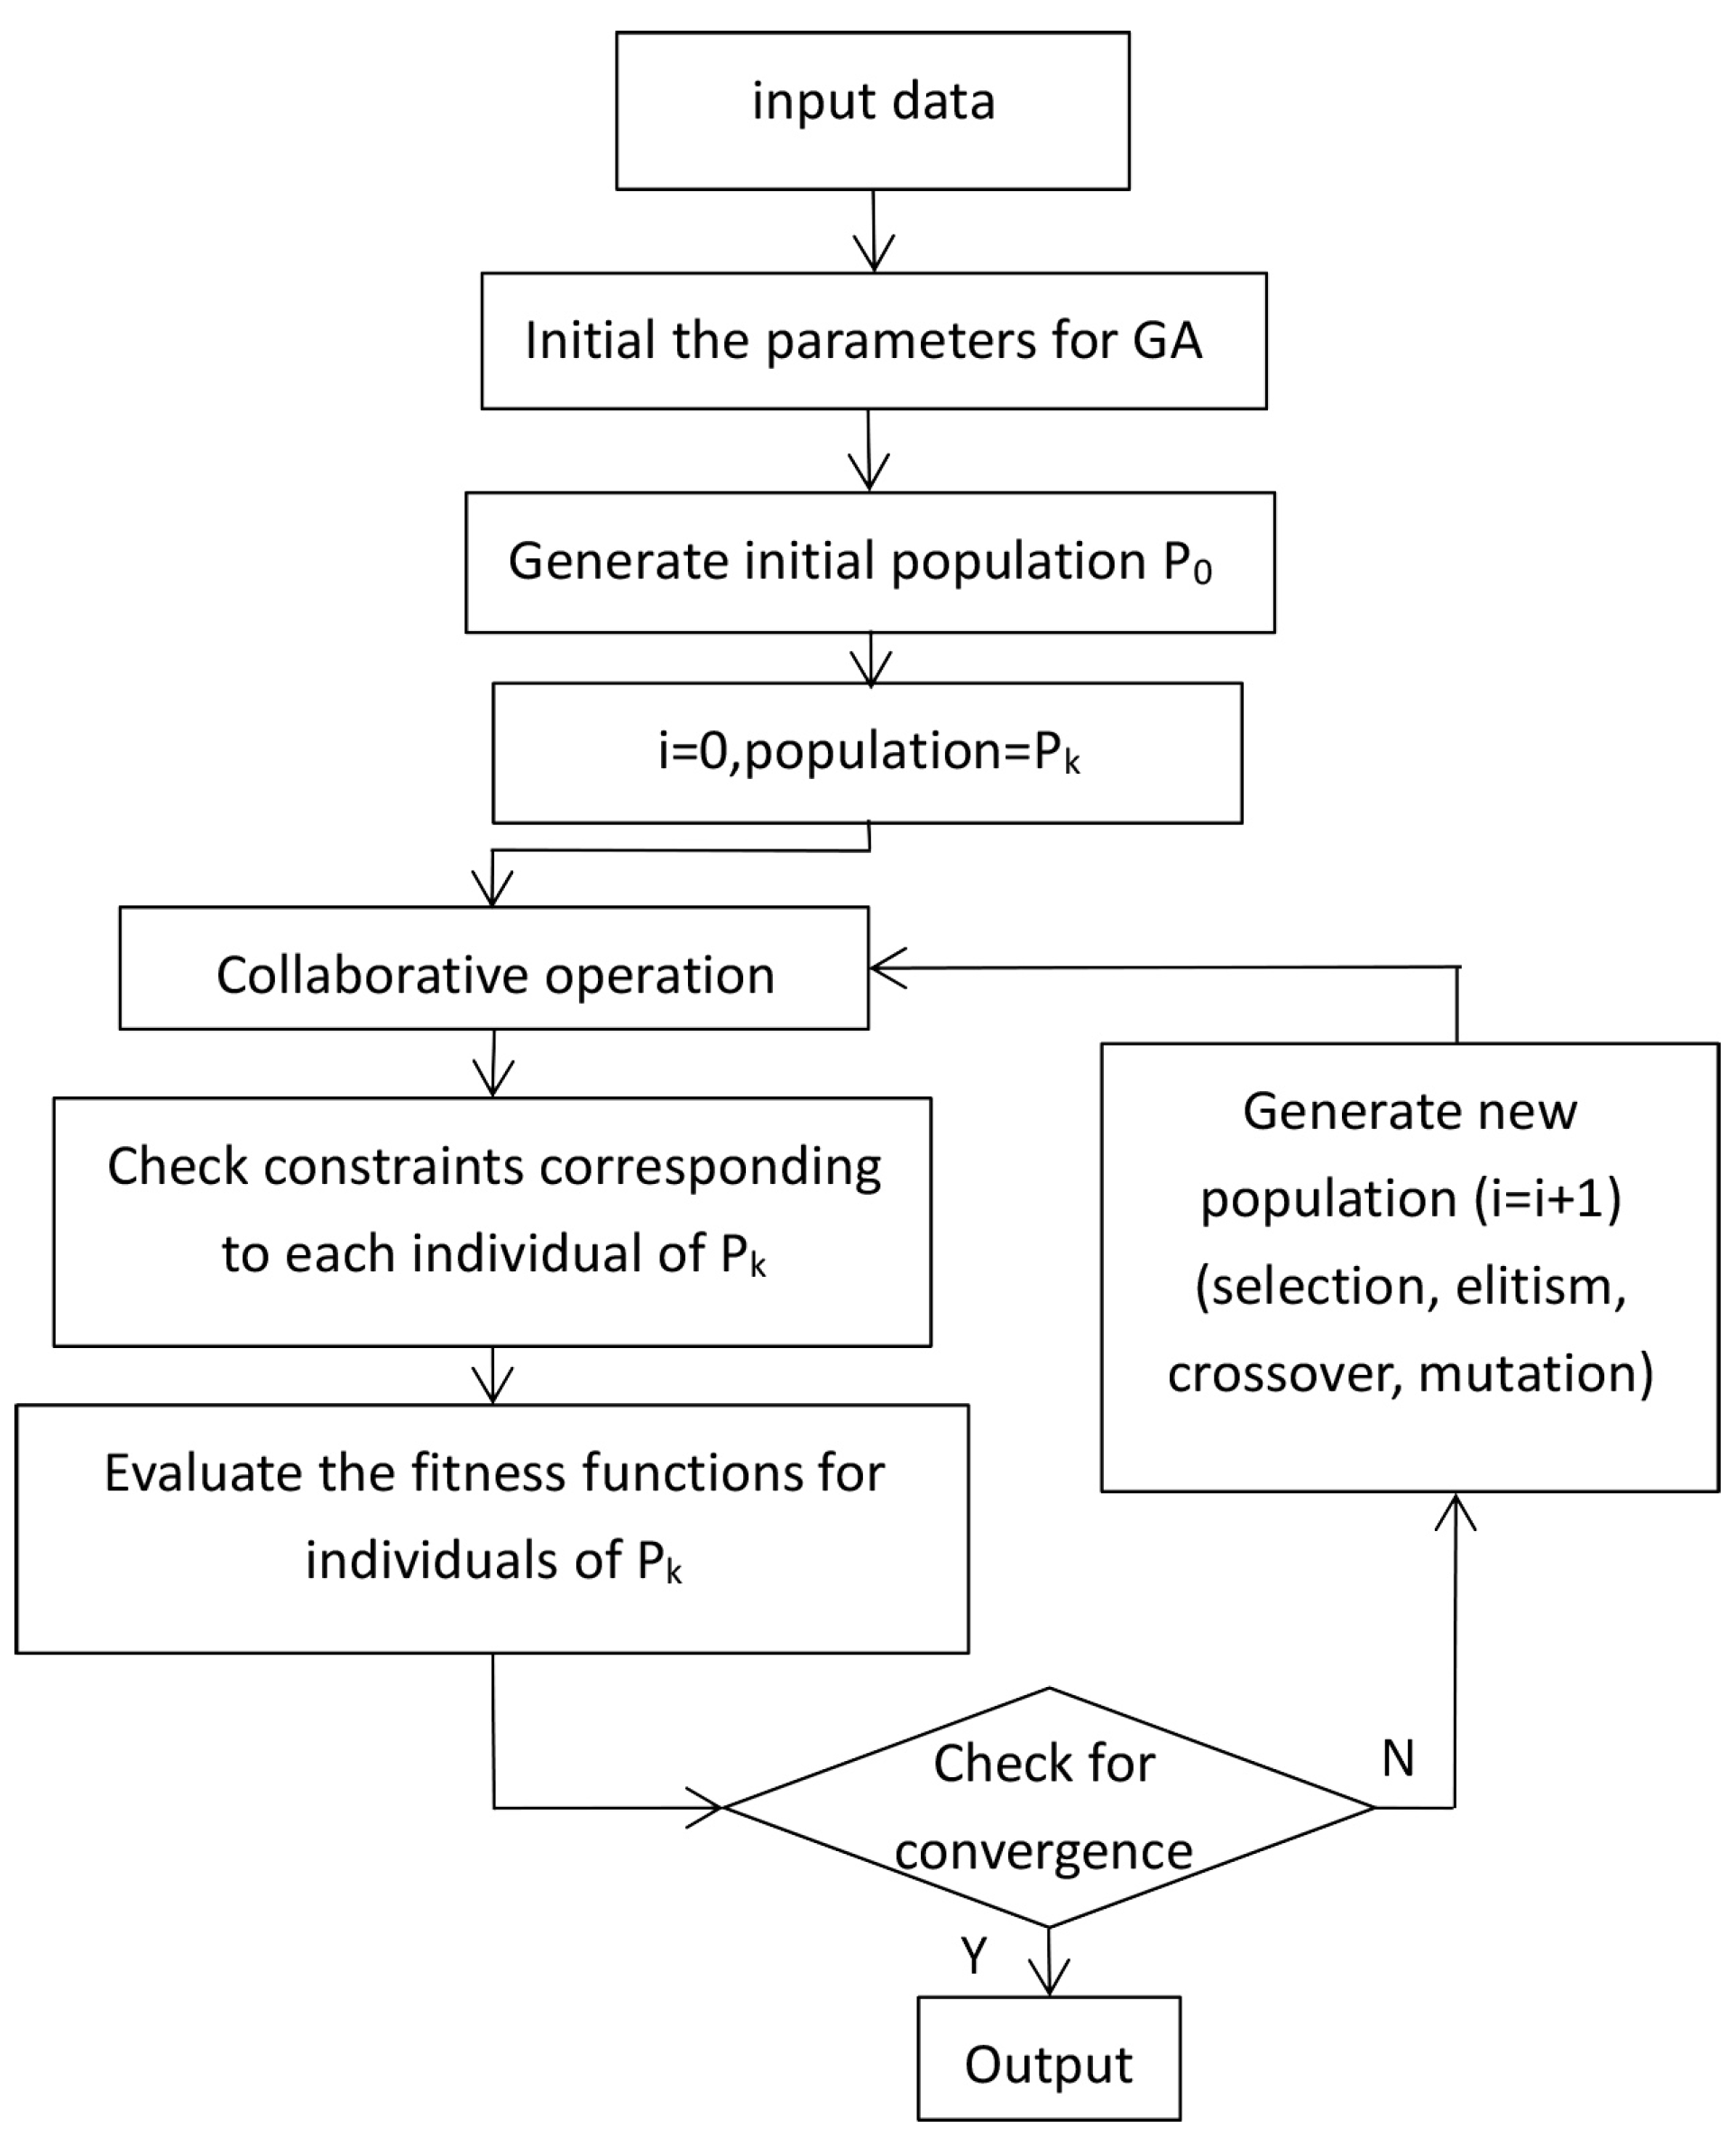
The structure of the paper is set as follows. Configuration of the proposed two micro-grids system is introduced in Section 2. Input data, for example wind speed, solar radiation and power demand are showed in Section 3. The optimal sizing model of the two micro-grids system based on collaborative operation is established in Section 4. Simulation results and case study are described in Section 5. The conclusion is presented in Section 6. The flowchart for the optimal sizing of the two interconnected micro-grids based on collaborative operation is shown in Figure 1.
2. Configuration of the Two Micro-Grids System
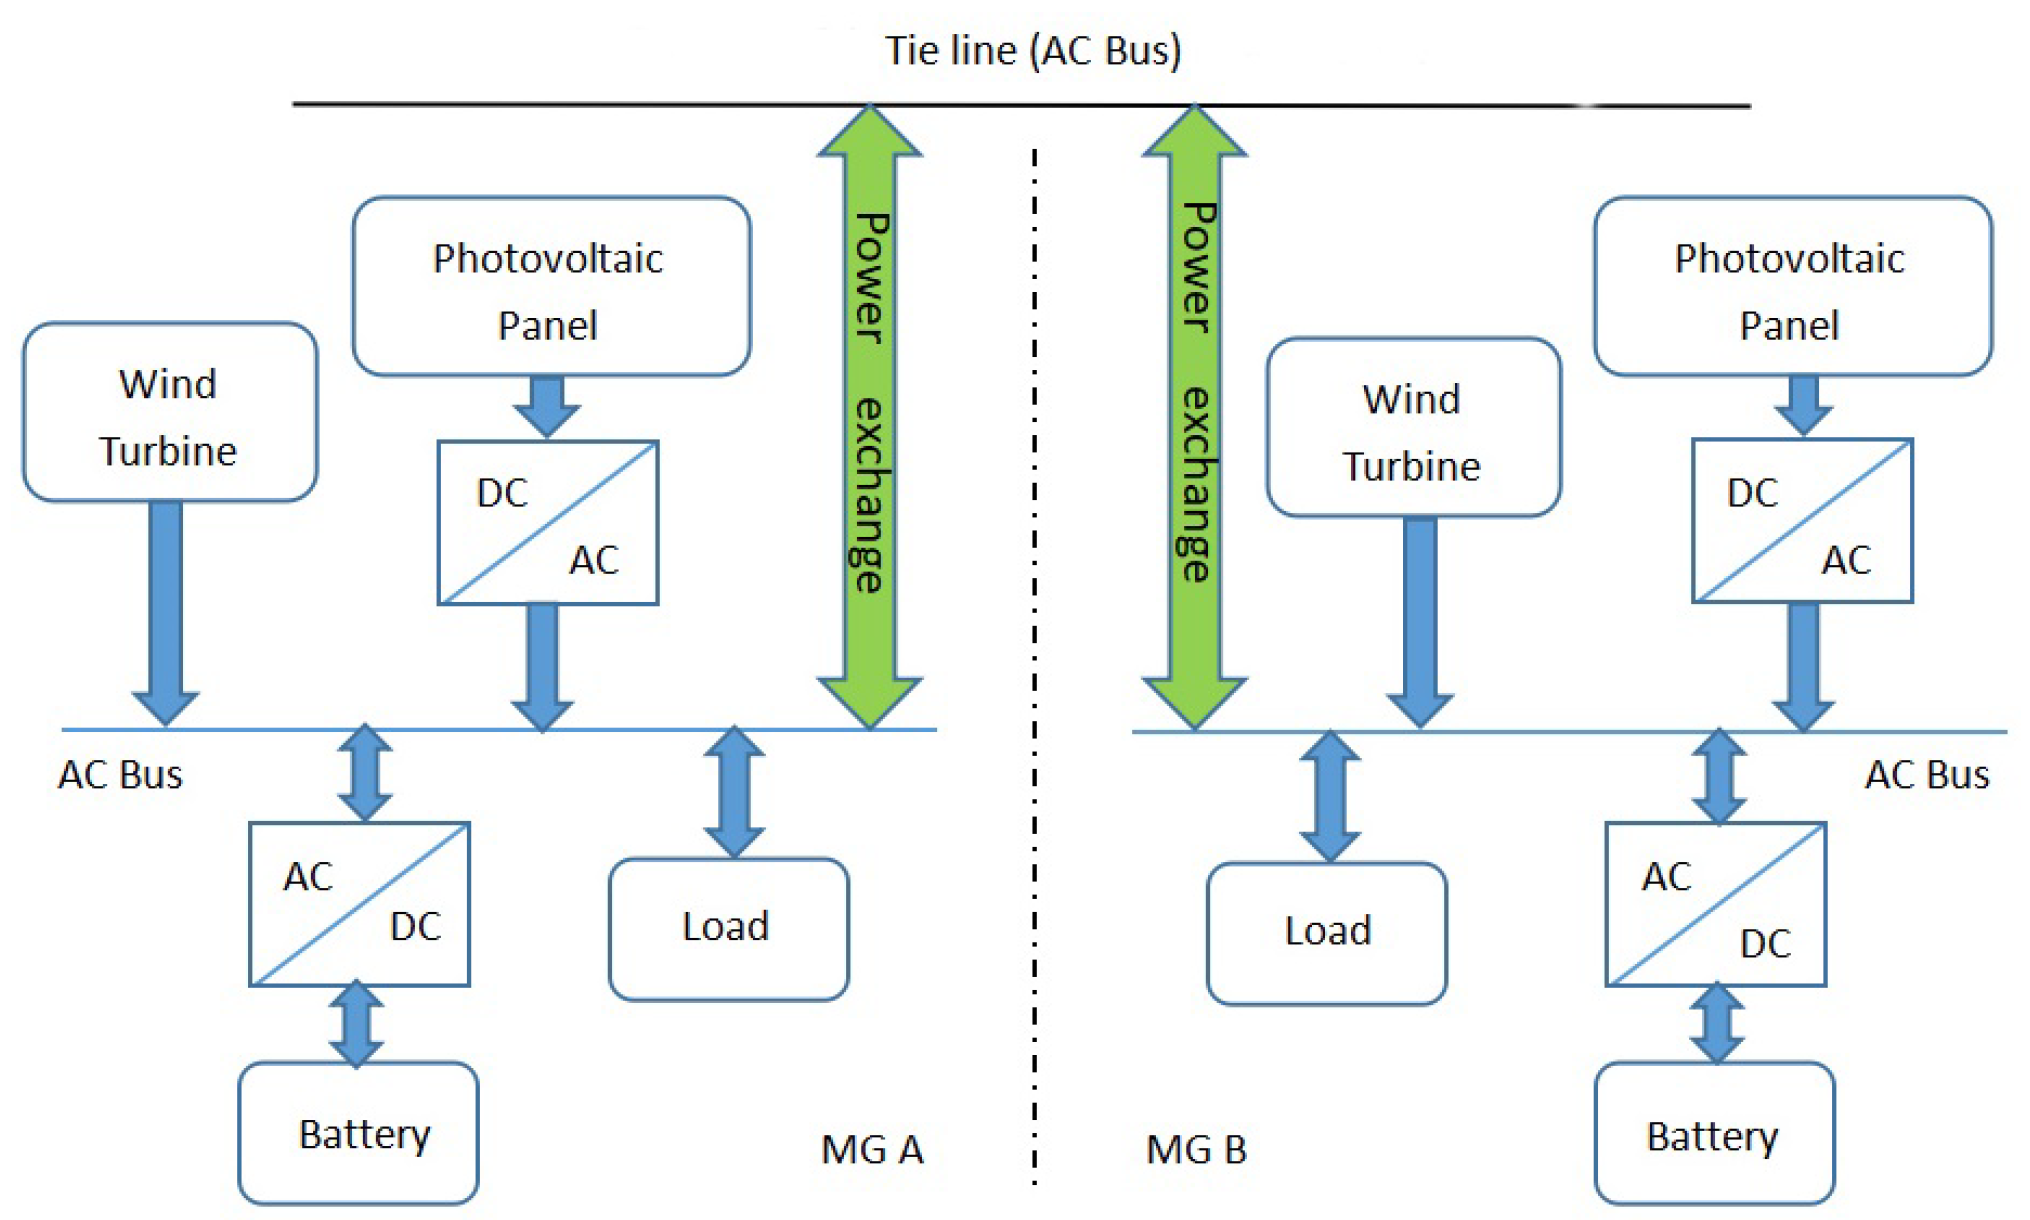
The particular configuration of the proposed two micro-grids system, using PV panels, wind turbines, battery storage, is shown in Figure 2 (MG A and MG B represent micro-grid A and micro-grid B). Tie line is constructed between the interconnected micro-grids to realize power exchange and storage of surplus electricity generated by renewable energy. On one hand, tie line makes the interconnected micro-grids a backup for each other. When the renewable energy generation and battery storage system in one micro-grid are not sufficient to supply the load, the surplus power and stored energy of the interconnected micro-grid can be used to cover the power gap, thus, reducing the system power installed capacity and improving the reliability of power consumption. On the other hand, when the electricity generated by renewable energy in the micro-grid exceeds the load, the excess power is firstly stored in its own battery storage system. If its own battery storage is full, the remaining power will be transferred to the adjacent interconnected micro-grid to store, improving the use efficiency of renewable energy generation. In addition, some wind turbines will stop working to avoid generation of surplus power when both storage batteries are full.
3. Input Data
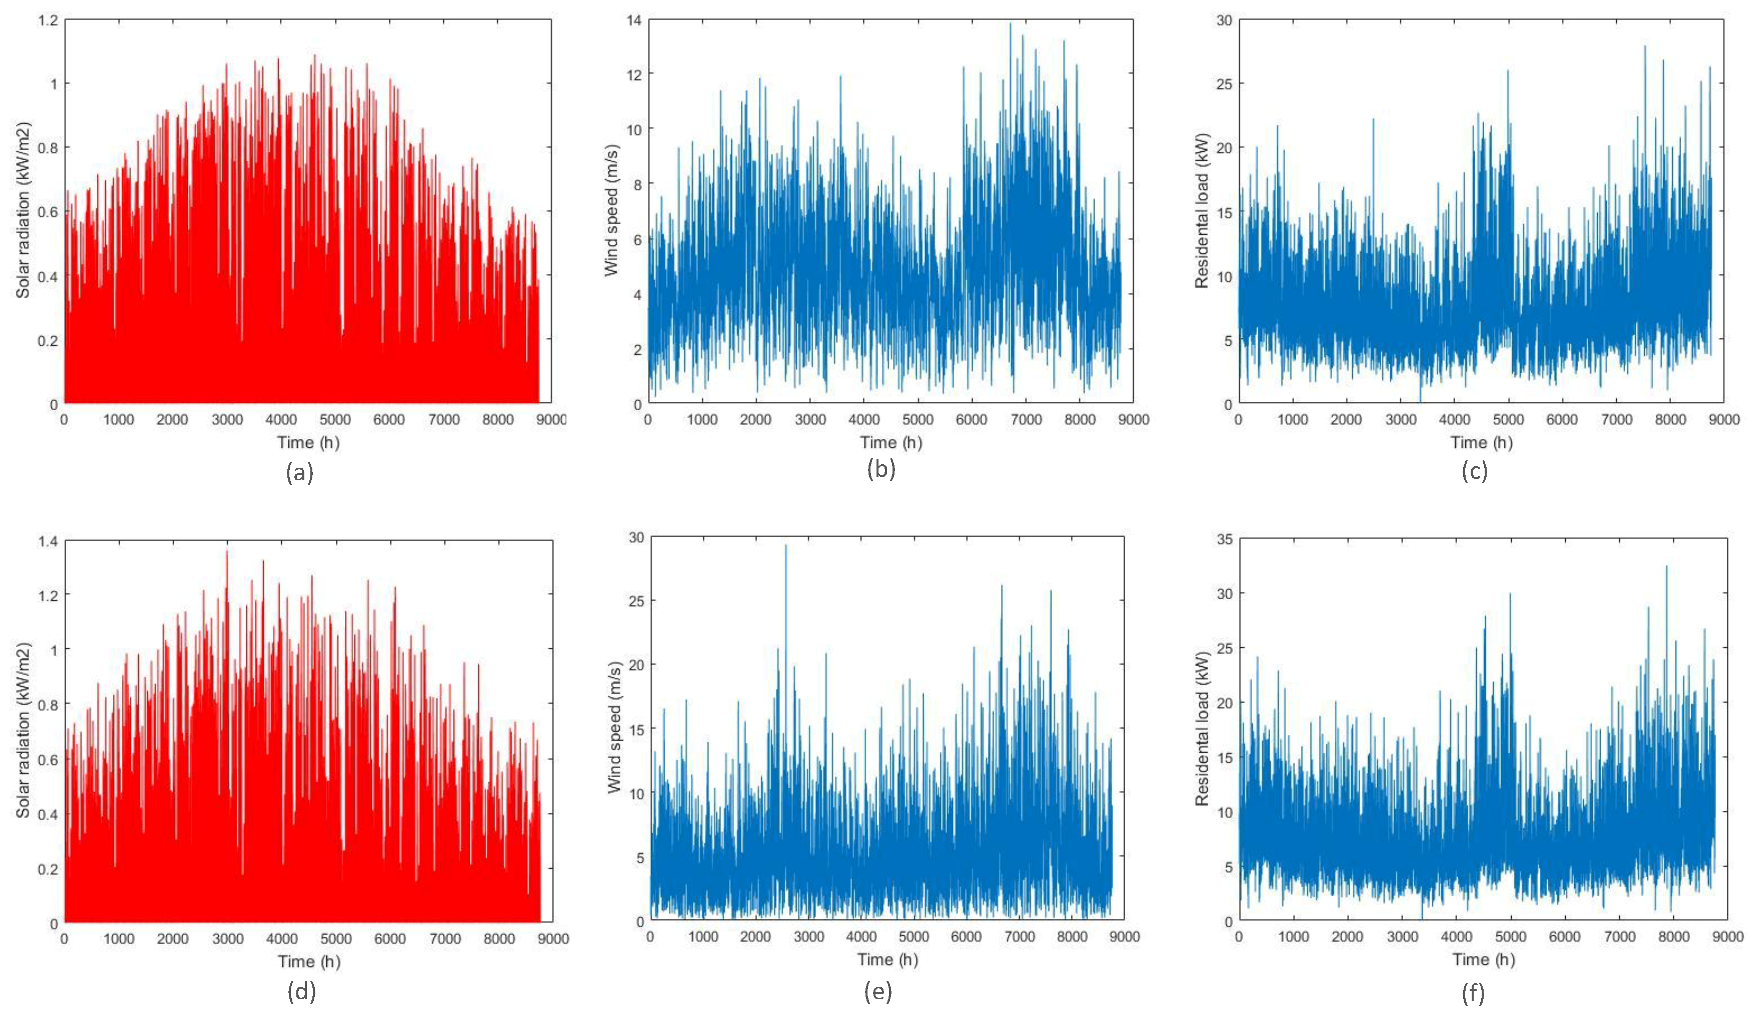
The method proposed here is to find the optimal sizing of PV-WT-BAT and the optimal capacity of tie line for two micro-grids without the connection of grid based on collaborative operation. Thus, the interconnected micro-grids will supply power to two different residential load at different locations in Yinchuan of Ningxia Hui Autonomous Region, China. The model needs hourly data of solar insolation, wind speed and load for a whole year. Moreover, as Ningxia lies in the ecotone between plateau and mountains, its topography is complicated. In addition, near-surface wind speed is affected by climate diversifications and diversifications in land surface features [36]. Therefore, due to the geographical conditions and vast land area of Yinchuan, the wind speeds and solar radiations for the two micro-grids of different places are not always the same even at the same moment. The data of various natural resources are recorded at two different monitoring station with a distance of 5 km. The hourly load demand of the residential areas was acquired from local authorities for the daily consumption of the residential sector of Yinchuan. Figure 3 shows the input data used in the model ((a)–(c) shows the input data for MG A and (d)–(f) for MG B). According to existing data, the average annual wind speed can be calculated as 4.84 m/s and 5.1 m/s respectively, and the average annual solar radiation are 0.187 kW/m2 and 0.188 kW/m2 respectively.
4. Problem Formulation
4.1. Objective Function
It is essential in the optimal sizing of PV-WT-BAT and tie line for the proposed two micro-grids system to determine the proper amount of wind turbines, photovoltaic panels, storage batteries and the capacity of the tie line, so that the interconnected micro-grids system will be able to supply the load demand economically and reliably. Finally, the optimal objective here is to minimize the Annual Cost (AC) of the two interconnected micro-grids, and the tie line , ensuring certain level of reliability.
The total annual cost of the two micro-grids system, which is the objective function to be minimized, is composed of annual cost of MG A, MG B and the tie line. The objective function can be expressed as:
The annual cost of each micro-grid includes three parts: the annual cost of initial investment, the annual cost of operation and maintenance and the annual cost of replacement. The residual value of each component is not considered here. Both and can be expressed as:
where index k indicates MG A or MG B; the index j stands for the component (PV, WT and battery storage, respectively); is the annual cost of initial investment for component j of k; is the annual cost of operation and maintenance for component j of k; is the annual cost of replacement for component j of k; As the cost of inverters are included in the expenses of component j of k, it is not calculated separately.
In addition, the annual cost of tie line is calculated as a function of its capacity, which can be described as follow:
where is the price for unit capacity and unit distance of the tie line. is the capacity for the tie line. is the service life for the tie line.
A constraint that must be indirectly met is to guarantee that the amount of power shortage consistent with the scale of the interconnected system and the climate conditions in Yinchuan. When the solar radiation and wind speed conditions are completely available, the small-scale renewable energy micro-grid will have a lower cost, but the power generation ability will be reduced accordingly. Meanwhile, the ability to charge and support is also weaken, which increase the possibility of power shortage. Conversely, when the renewable energy micro-grid is large in scale, the power generation ability is enhanced. In addition, the ability to charge and support is also strengthened at the same time. In this manner, both the scale and the climate conditions decide the reliability of power supply in a year and can be measured with the simulation of the two micro-grids system under interconnection.
4.2. Economic System Modeling
In this paper, the decision variables that need to be optimized are the installed amount of wind turbines, photovoltaic panels, and storage batteries and the capacity of the tie line between the two micro-grids with regional space constraints. The life cycle cost of the renewable energy generations is converted to the annual value, assuming the discount rate i. As both MG A and MG B have the same generation configuration, and the economic model for each component of the micro-grids may be calculated as explained below.
4.2.1. The Initial Investment Cost
The annual cost of the initial investment for the two micro-grids system consists of the annual cost of WT, PV and battery storage. The annual cost of the initial investment for each micro-grid is:
where, and are the unit initial investment cost and installed number for each component of k respectively. is the lifetime for each component of k. The lifetime of batteries depends on its usage in the dispatch of collaborative operation. In order to get the exact lifetime for the batteries, Rain Flow method is introduced in this paper. Firstly, The depth of discharge (DOD) at each cycle is obtained with state of charge of battery using the Rain Flow method. Then the lifetime of the batteries are calculated according to the procedures mentioned in [37] as follow:
where is the cycle for each DOD. is the aging rate for battery.
4.2.2. The Operation and Maintenance Cost
Since the battery storage does not require maintenance, the operation and maintenance cost of the battery storage is not calculated here. The annual cost of the operation and maintenance for each micro-grid is:
where is the annual value of operation and maintenance costs required by each component of k. is the annual growth rate of operation and maintenance costs for each component of k.
4.2.3. The Replacement Cost
The lifetime of the component is usually less than that of system. Thus, additional investment is needed for replacement before the service life of the project is reached. The replacement cost for each micro-grid is:
where is the unit replacement cost for each component of k.
4.3. Physical System Modeling
As mentioned above, the decisive variables of the optimal objective are the amount of PV panels, wind turbines, storage batteries and the capacity for the tie line between two micro-grids, limiting power shortage. The Loss of Power Supply Probability(LPSP) is a essential index for the performance of power shortage, which as mentioned before, depends directly on the system’s scale and natural resource conditions.
The determination of the feasible space by which the decisive variables are bounded must ensure that the system complies with certain reliability. Simulation was conducted to achieve the lowest annual cost of the two micro-grids with reasonable LPSP. The simulation of proposed micro-grids under interconnection models the performance of PV panels, wind turbine generators and storage batteries effectively, subject to the local meteorological conditions.
4.3.1. PV System
Mathematically, the power supplied by each PV panel in one instant of time can be expressed as [38]:
where is the solar insolation of time t in kW/m2, and is the rated power of panel. is the photovoltaic module efficiency. Power is measured in kW. G is perpendicular radiation at array’s surface (W/m2). The amount of power generated in a hourly interval is , in kWh.
4.3.2. Wind Turbine (WT)
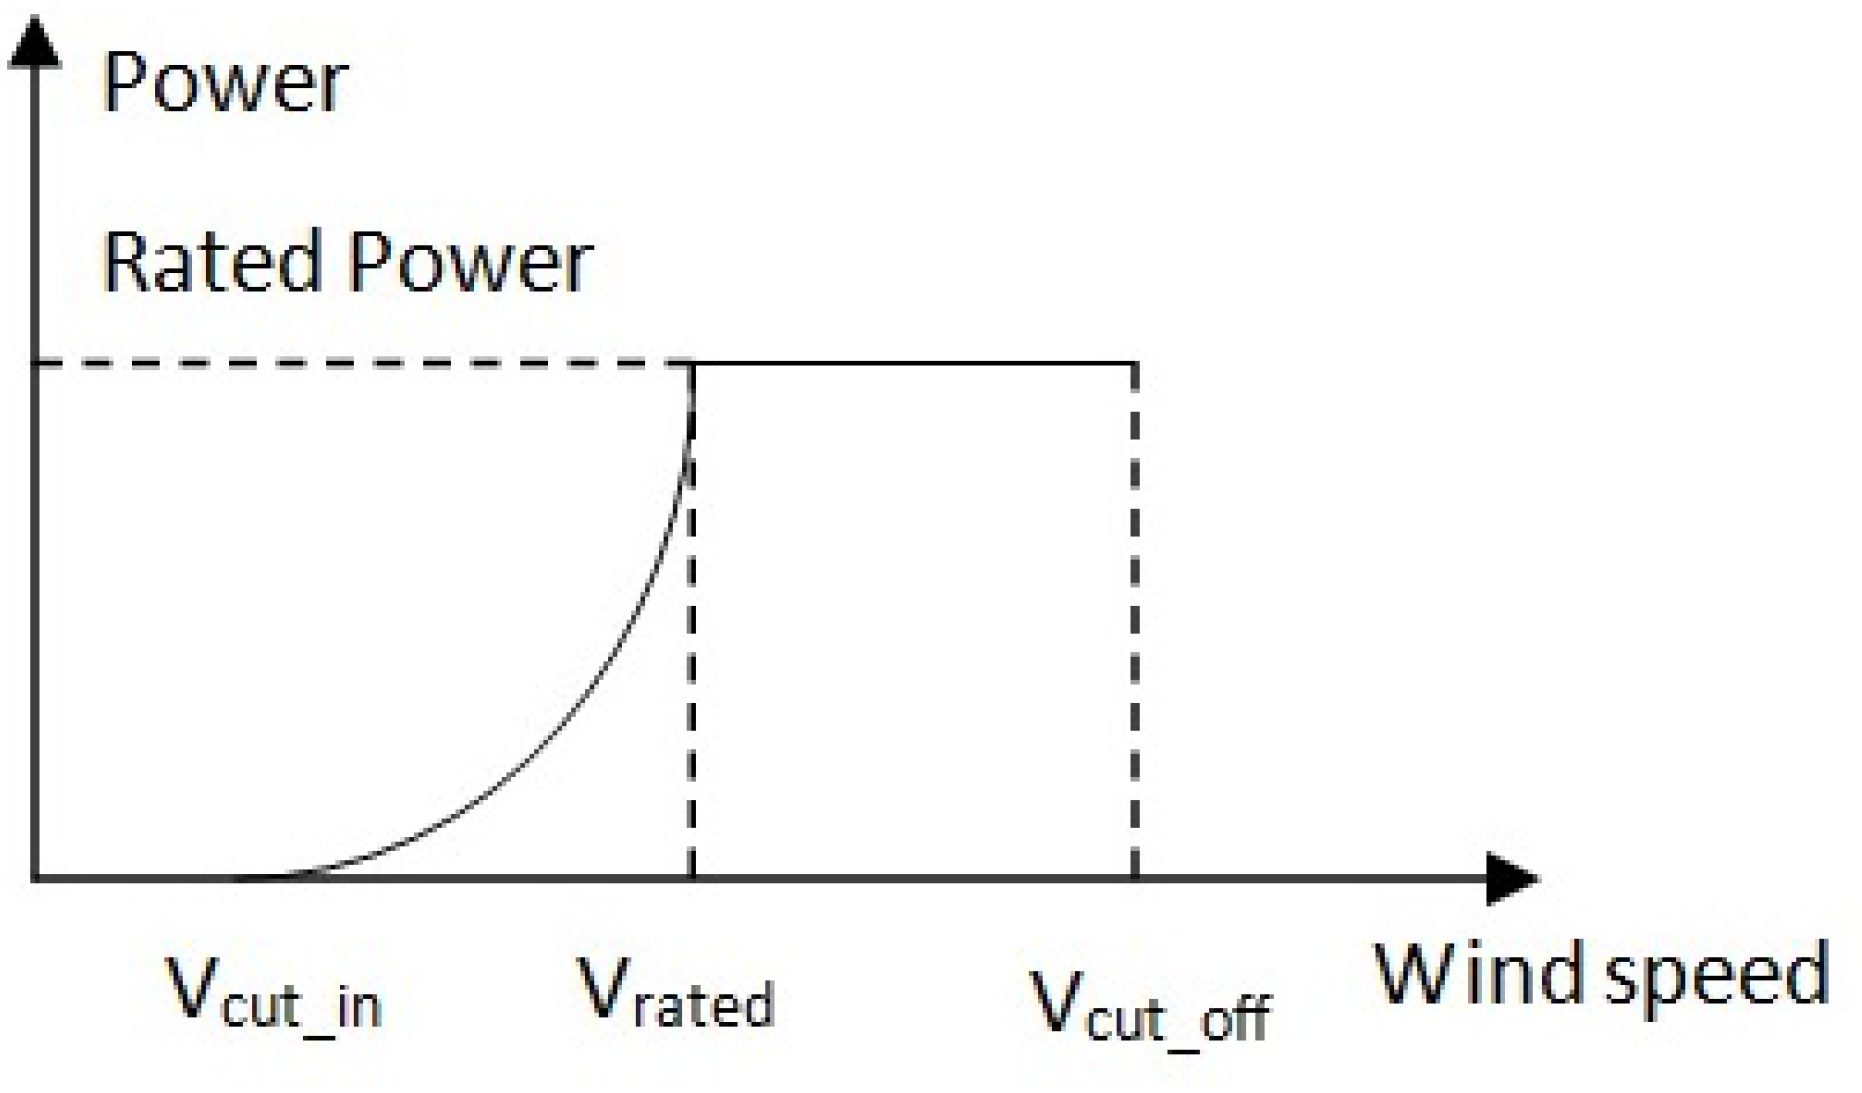
A simple model that describes the power generation of a wind turbine is shown in Figure 4. is the cut-in speed which starts generating power. When wind speeds get higher, the output power increases until reaching a point of maximum yield at (rated speed). Finally, When the wind speeds reach above (cut-off speed), the wind generator simply stops its operation to protect its mechanism.
Mathematically, this behavior of WT is modeled as [39,40]:
where , and are determined by the type of wind turbine generator, all in m/s. is the wind speed at the instant time t in m/s and is the rated power of the wind turbine generator in kW. The amount of energy generated hourly is given by: , in kWh.
4.3.3. Battery Storage
The battery storage is widely used for mixed energy systems to store surplus electricity and to meet power demand in case of deficiency of wind turbine and/or PV panel. The existence of battery storage greatly reduces the instability of renewable energy generation and promotes the use of renewable energy. The energy stored by the battery storage is a function of time. State of charge (SOC) of the battery is showed as follows [41]:
Charge:
Discharge:
and are the state of charge of battery at instant time t and , respectively. is the rated capacity of battery. is the power generated by renewable energy in each micro-grid. is load demand in each micro-grid at time t. and are the efficiency of inverter and battery, respectively.
4.4. Collaborative Operation Strategy and Simulation
It is assumed here that load and power are divided according to hours of a whole year (8760 h, h). In addition, the output of wind turbines, photovoltaic panels, batteries and load demands are constant in unit time. For a known system scale, the amount of unbalanced power of interconnected micro-grid at hour t, , may be expressed as:
where and are the total power generated by wind and solar of each micro-grid at hour t, respectively. is the load demand of the local residents for each micro-grid.
If and are both positive, then there exists sufficient power generated by renewable energy in the micro-grids to supply the load. After the load is met, the remaining power will be stored in its own battery storage. If its own battery storage has reached the energy storage limit, then the battery storage of interconnected micro-grid is charged through tie line between the micro-grids until full. Finally, the surplus power will be dumped.
If and are both negative, then there does not exist sufficient power generated by renewable energy in the micro-grids to supply the load. The power shortage in one micro-grid is firstly supplied by its own battery. If the power shortage still exists and the there is still power left in the battery of the interconnected micro-grid after supplying its own load, then the battery of the interconnected micro-grid will be used to cover the vacancy. Power shortages will happen, if the batteries of the two micro-grids have both reached the discharge limit. In addition, LPSP is introduced here to measure the degree of power shortage of interconnected micro-grids.
If one of and is positive and the other negative, then it means that power generated by one of micro-grids is sufficient to meet its own load, while the other is not. Tie line between interconnected micro-grids is used to transmit power from the surplus power generating micro-grid to the one with power shortage. If there is still a surplus of power after supplying load for the micro-grid with power shortage, the remaining power is firstly stored in the battery of the micro-grid with surplus power until it is full. After that, the battery of the micro-grid with power shortage is used to store the remaining power. On the contrary, if there is still a power shortage after power exchange, the battery of micro-grid with power shortage was firstly used to supply power. In addition, the battery of interconnected micro-grid is used if the battery of micro-grid with power shortage has reached the discharge limitation. Power shortage occurs if the load demand still cannot be met with all of power supplied by the renewable generations and batteries in the two micro-grids.
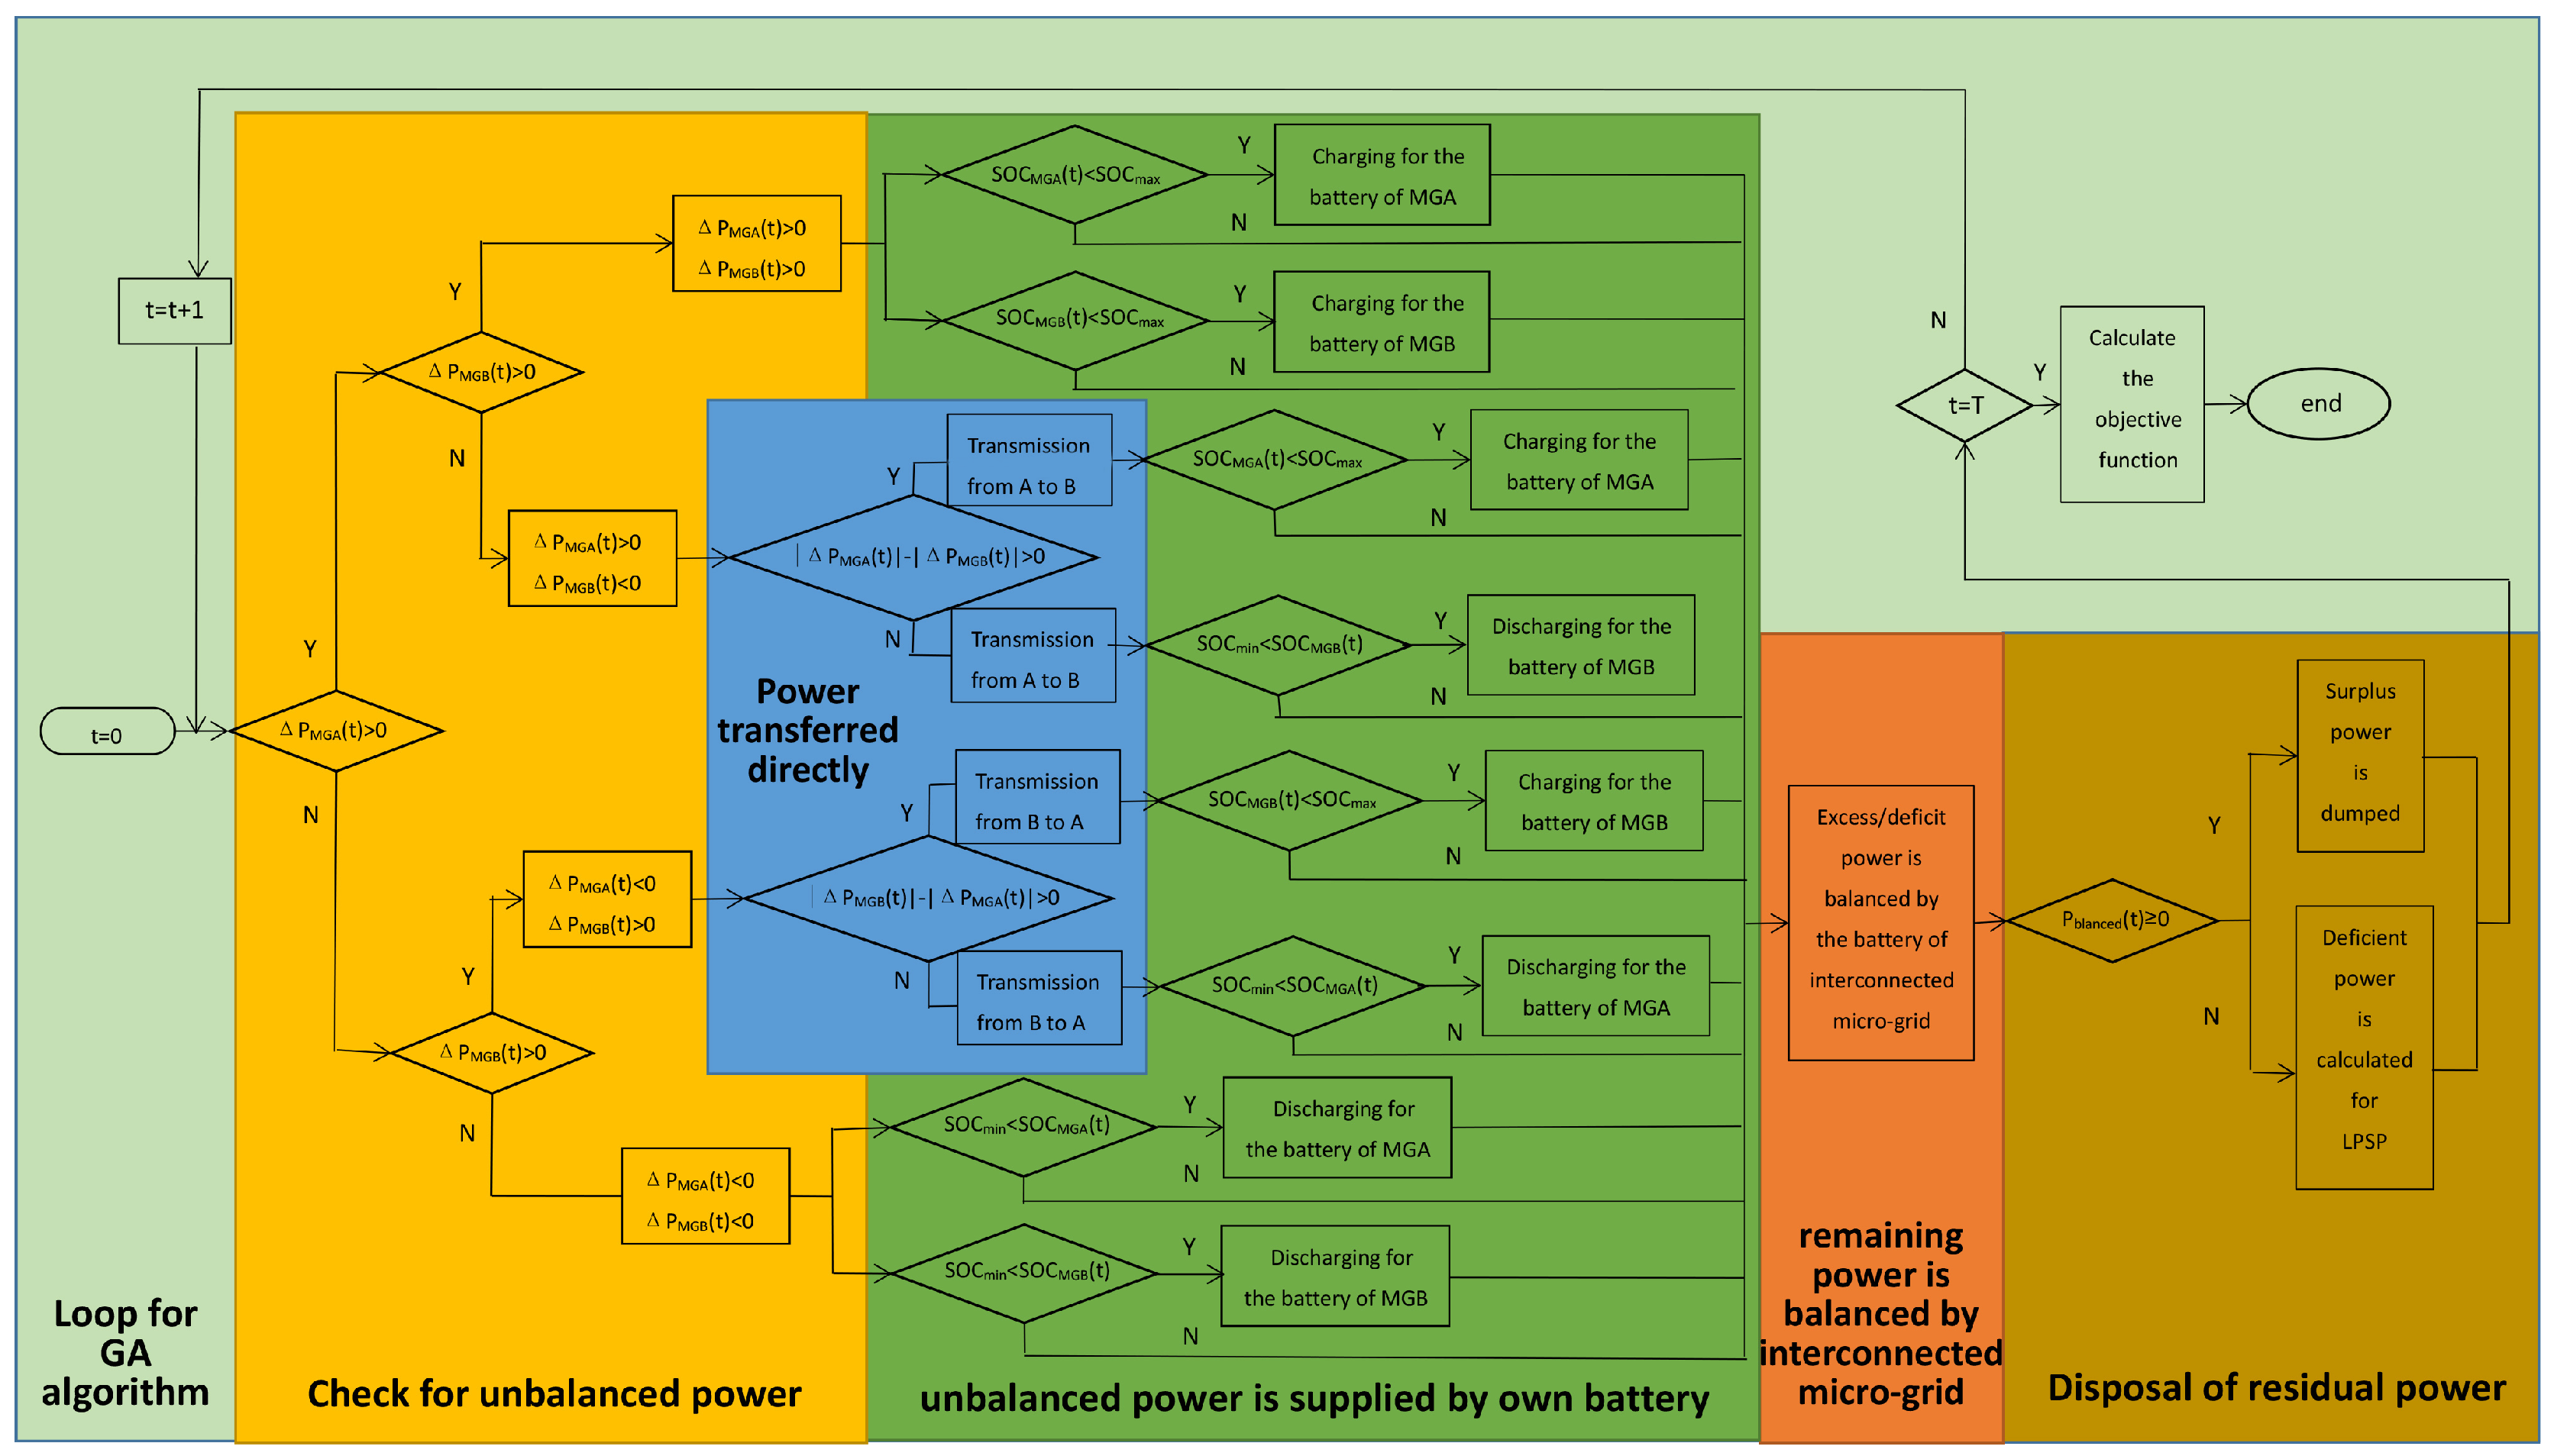
The flow diagram of the proposed collaborative operation strategy for the two micro-grids system is shown in Figure 5. Where stands for the remaining power which is after balanced by the battery of interconnected micro-grid. T represents the maximum iteration number of the algorithm.
4.5. Constraints
Due to the limitation of installation space, certain constraints must be met during the optimization of the objective function, including component constraints, battery state constraints, Loss of power supply probability and the power exchange limitation.
4.5.1. Component Constraints
The component constraint defines the feasible range for the installed amounts of wind turbines, photovoltaic panels, and batteries in the two micro-grids system. Specific constraints can be expressed as:
where , , defines the upper bounds of installation amount for photovoltaic panels, wind turbines and batteries.
4.5.2. Battery Constraints
State of charge (SOC) is used to indicate the percentage of remaining energy in the battery at time t. Constraint for battery can be expressed as:
where and are the lower and upper bounds for SOC of battery, respectively. And and are set to be 20% and 100% of battery capacity, respectively.
4.5.3. Loss of Power Supply Probability (LPSP)
defines the power shortage probability of the micro-grid within a period of time . And its value cannot exceed the preset power shortage limit which is set to be 2%. The constraint for is:
where and indicate power shortage and load demand at time t respectively. is the interval of unit time and , in this paper, is set to be 8760 h of a year.
4.5.4. The Power Exchange Limitation
The power exchanged between the two interconnected micro-grids is limited by the capacity of the tie line between them. Thus the power exchanged at time t is described as follow:
where stands for the power exchanged at time t, and is the corresponding maximum power that can be exchanged according to the capacity of the tie line between the two interconnected micro-grids. As the power flows in both directions, an absolute function is conducted on the .
5. Case Study
To verify the validity of the proposed model in this article, the model is applied to two micro-grids located in different areas with a distance of 5 km between them to supply loads for a whole year. Based on the above meteorological input data, component costs and load curves, some case studies are conducted to obtain the optimal sizing of the renewable energy system, battery and the capacity of tie line for micro-grids under interconnection. The case is optimized by genetic algorithm tool box of Matlab 2015b on a PC with 6 GB RAM and Windows operating system. The genetic algorithm are conducted with generations of 5000 and population size of 100. The other parameters for the genetic algorithm are set as default value by the optimization tool box in Matlab 2015b.
5.1. Parameters
The technical parameters of the photovoltaic panel(DJB-36V300WK), wind turbine(NE-5000G) and battery (LCPA100-1) for the micro-grids in this paper are shown in Table 1. In addition, power loss rate of the tie line is shown in the same table, which is set according to the average power loss rate of power network enterprises of China in 2017. The economic parameters of each component of the micro-grids are listed in Table 2. Moreover, the price for tie line(RVV 300/500 V) between the micro-grids is 3200 yuan/km with a capacity of 13.5 kW, which is provided by the manufacturer. In addition, the cost of the tie line are paid by the two interconnected micro-grids equally.
5.2. Results and Discussion
The independent sizing of MG A and MG B with different power configurations is set as base case with which sizing of MG A and MG B under interconnected mode is compared under the same condition.
5.2.1. Economic Analysis of the Proposed Model
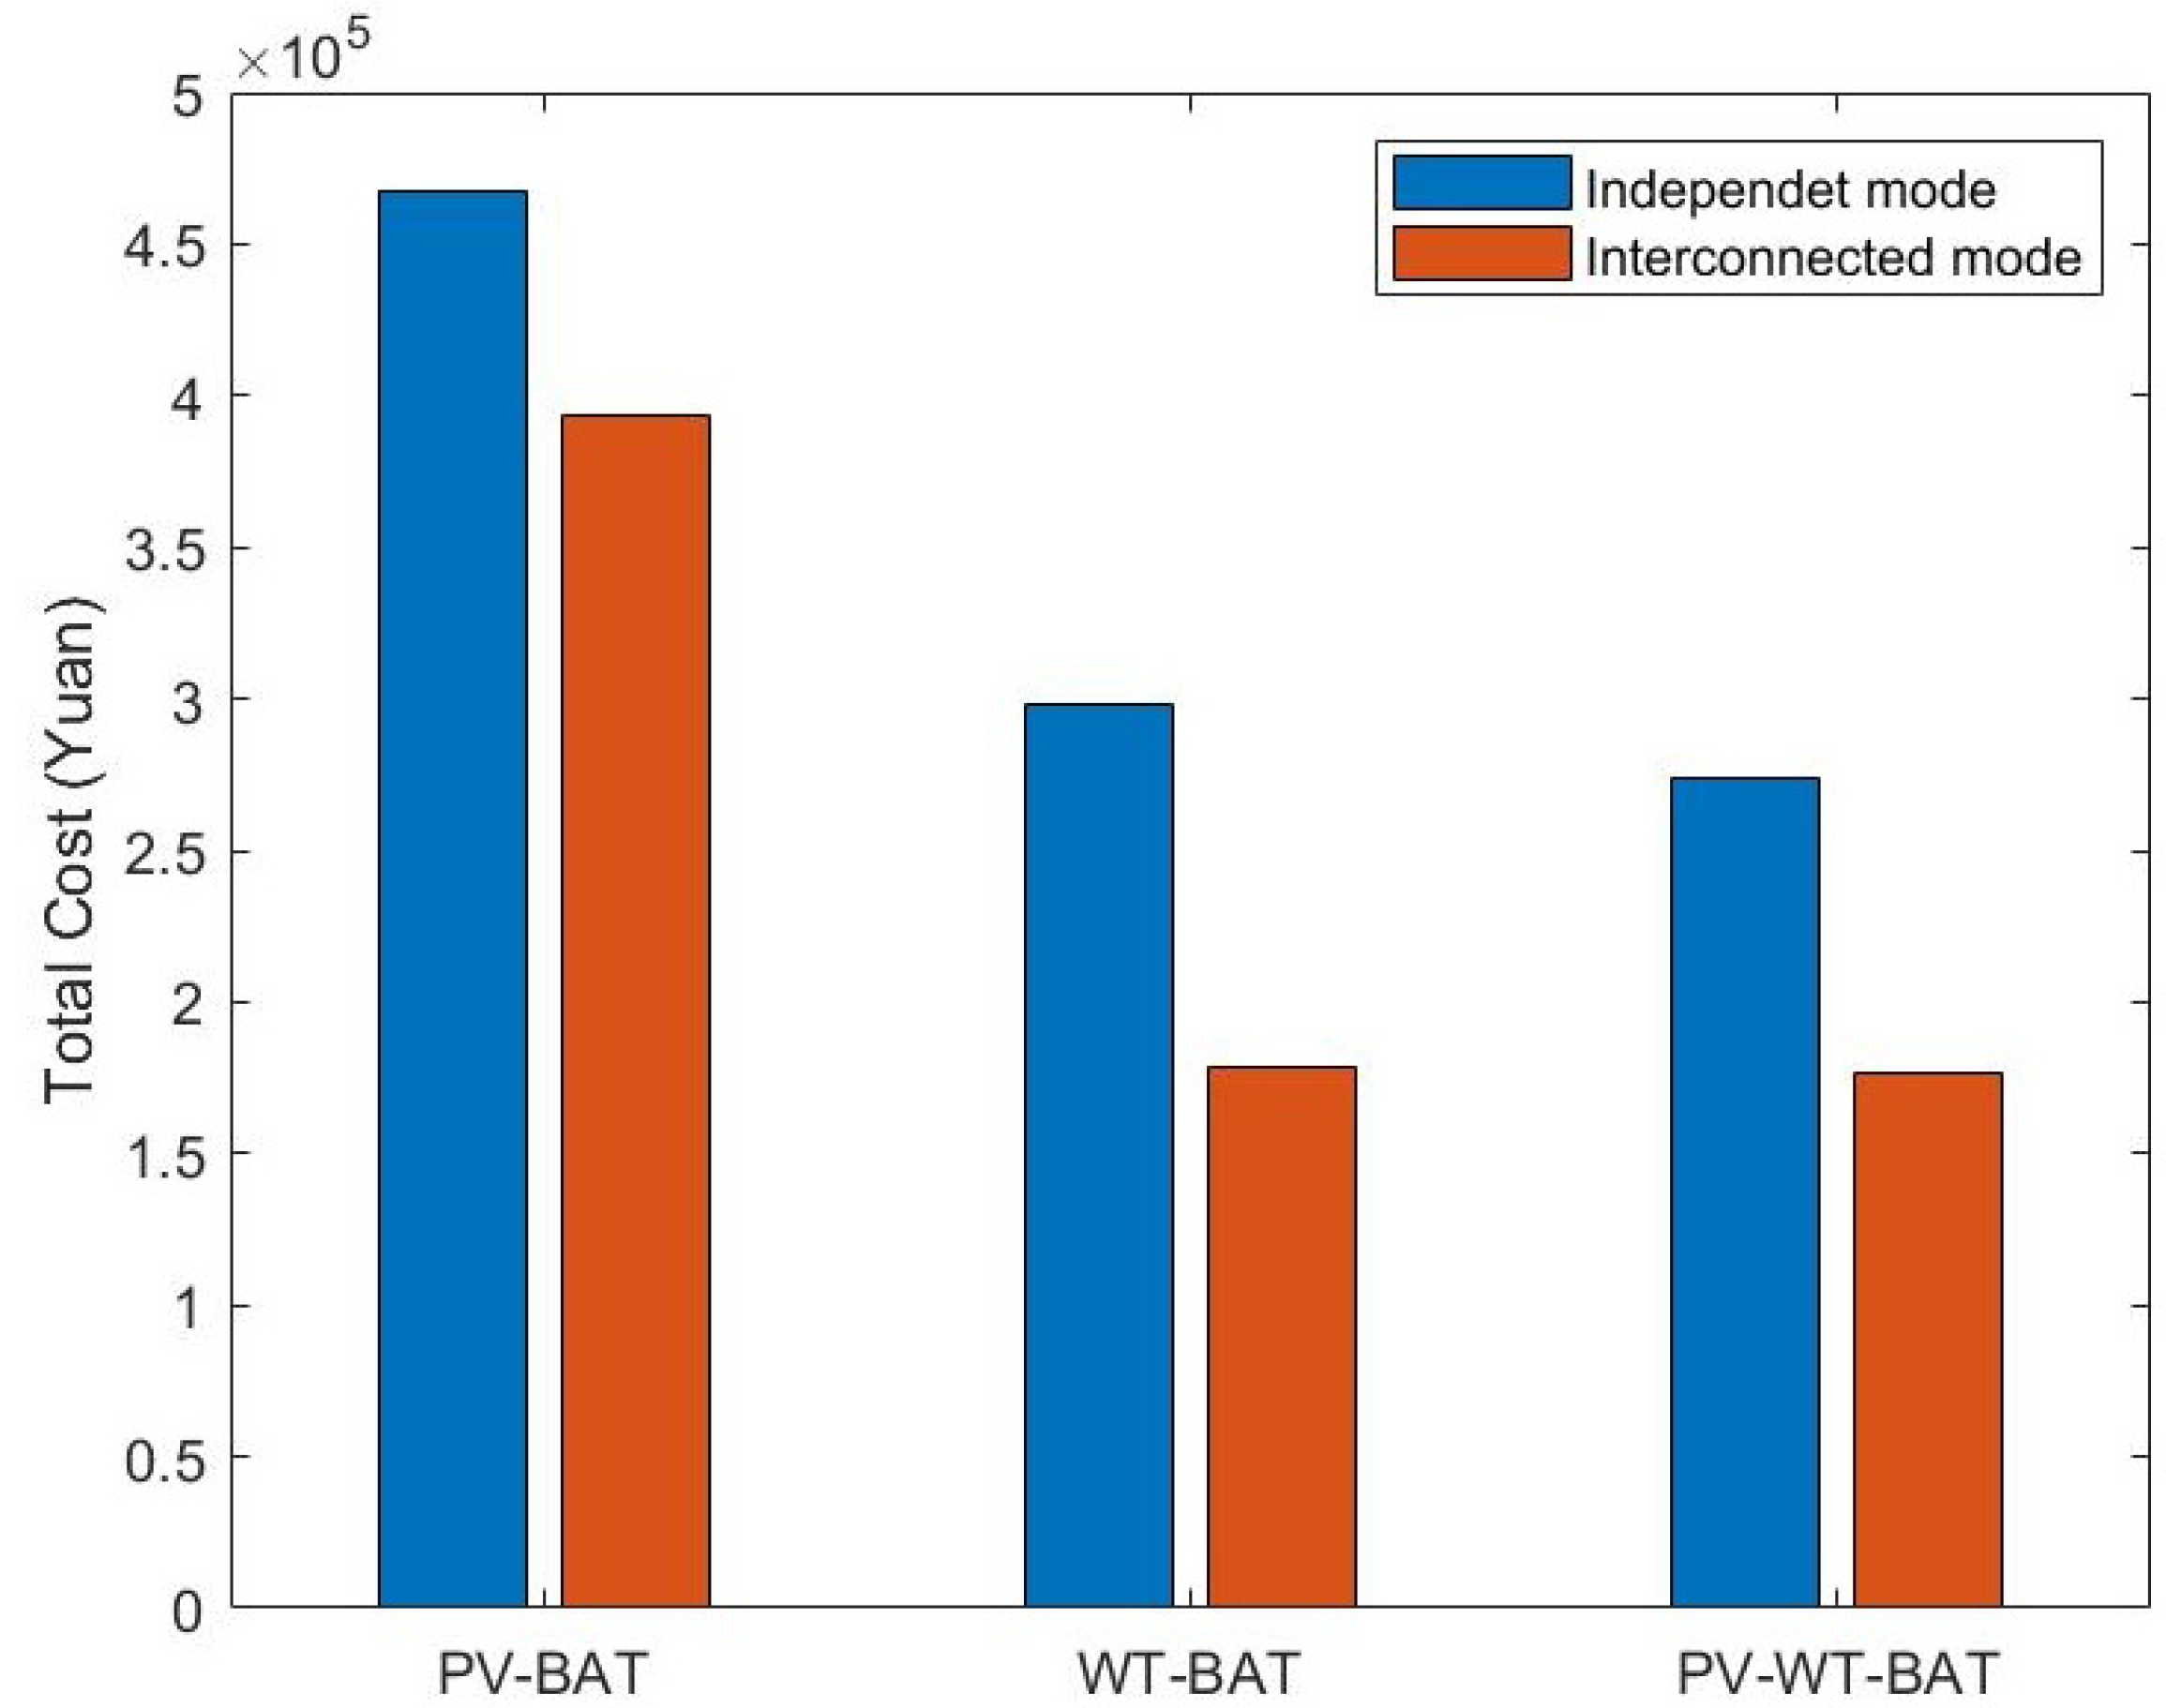
Table 3 shows the total optimal amounts of renewable energy generations, batteries and the capacity of tie line for each micro-grid under independent mode and under interconnected mode. Figure 6 shows the total cost comparison of two micro-grids with optimal capacity under independent mode and under interconnected mode.
As shown in Figure 6, in terms of the two micro-grids as a whole, the total cost for the micro-grids with the configuration of PV-BAT, WT-BAT and PV-WT-BAT under interconnected mode has all shown advantages compared with that under independent mode. At the same time, by further using the complementary of wind and solar energy, the PV-WT-BAT micro-grid has obtained the best economical efficiency while ensuring the reliability of power supply under both modes. The installed power capacity of the traditional off-grid micro-grid is usually designed based on the load curve in order to ensure the reliability of the power supply. This leads to the fact that under the condition of low load and sufficient resources, the electricity generated by excess installed power capacity cannot be fully absorbed, resulting in a waste of resources and high installed investment for renewable energy generation. Through comparison of the total cost of the same type of power generation under both modes, it can be seen that under the interconnected mode, a strong mutual support is formed between the interconnected micro-grids, due to the usage of complementarity of natural resources. Power exchange reduces the installed capacity of renewable energy generations and batteries, thereby reducing the cost of power generation and improving the economy and reliability of the system. Compared with the independent mode, costs of PV-BAT micro-grids, WT-BAT micro-grids and PV-WT-BAT micro-grids are reduced by 15.91%, 40.21% and 35.51% respectively under the interconnected mode, and the overall economy of the system is improved. In addition, the reason why installed capacity and total cost of PV-BAT micro-grids under two modes changes not too much is that the complementarity of solar radiation and load difference between regions is weak relatively.
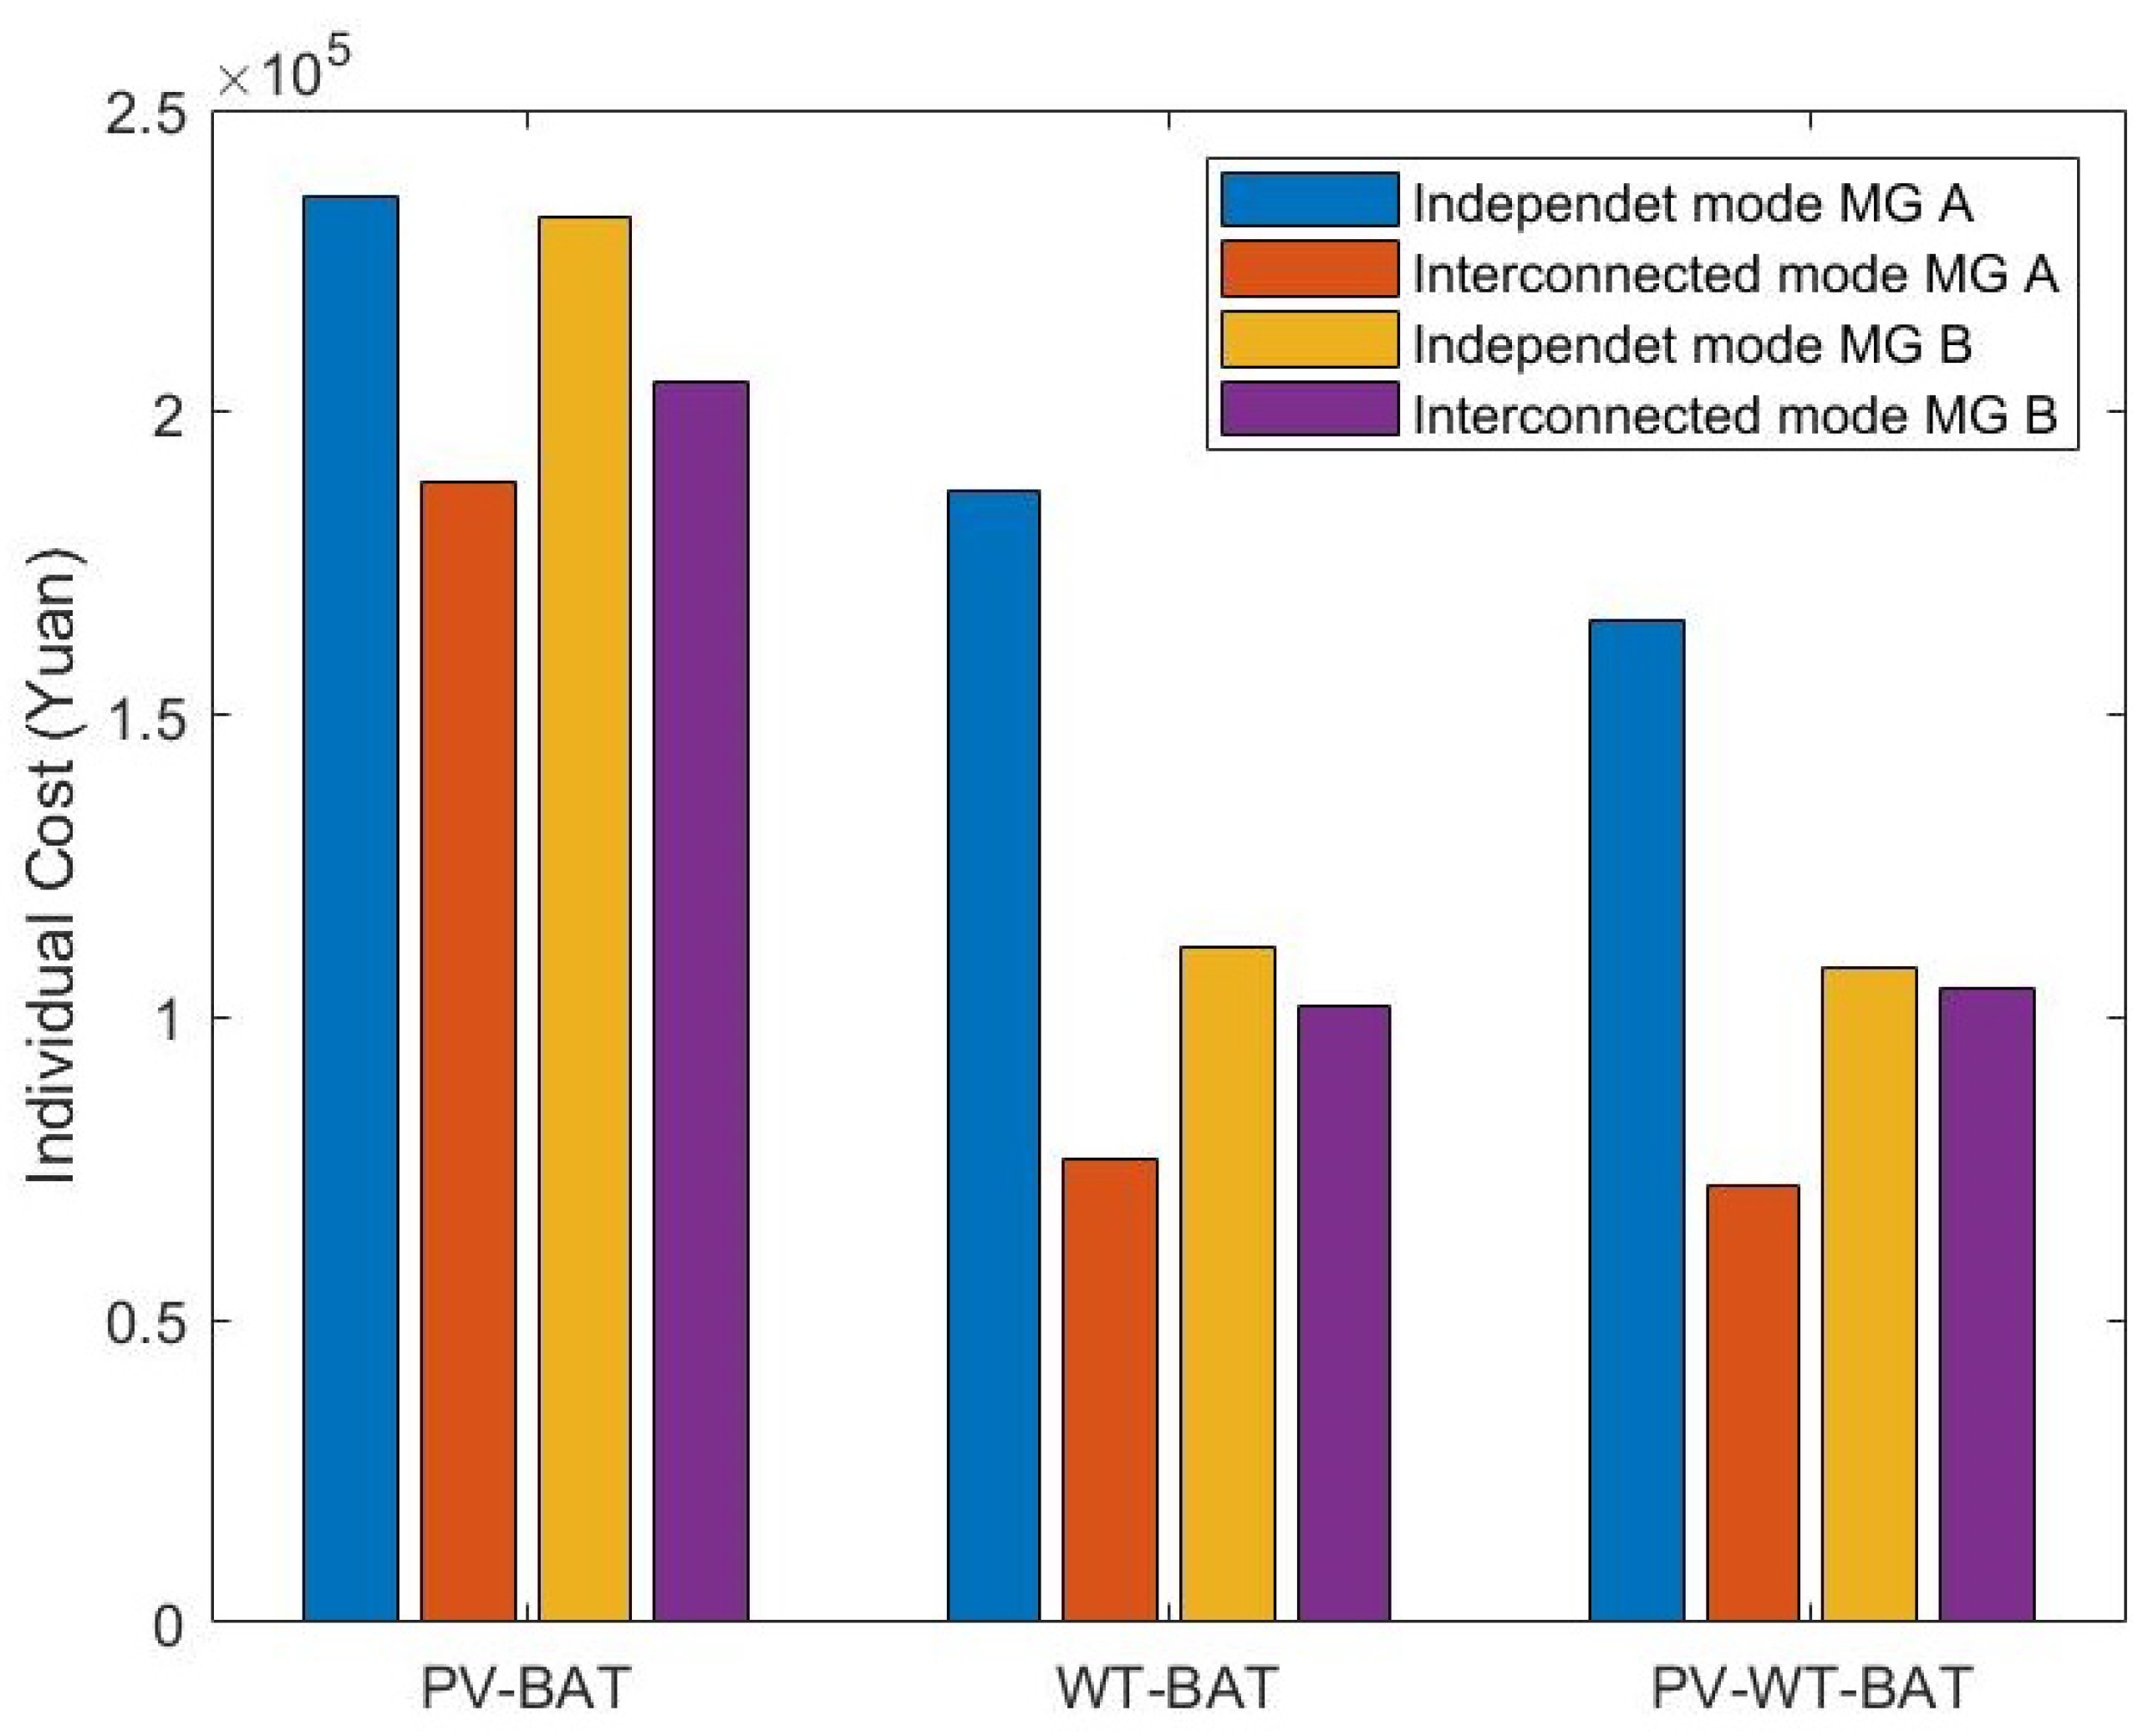
Table 4 shows the respective installed optimal amount configurations of MG A and MG B with different types of power supply under independent mode and under interconnected mode. Figure 7 shows the comparison of respective costs of MG A and MG B under independent mode and under interconnected mode.
Table 4 shows the different renewable generation configurations for each micro-grid under independent mode and interconnected mode. For example, under the configuration of WT-PV-BAT, due to the adoption of the interconnected mode, the complementary advantages of resources have enabled MG A to reduce large installed demand for wind turbines, photovoltaic panels and batteries. By using the complementarity of resources, MG B can provide sufficient power support through tie line when MG A is deficient in power generation. In this way MG B under interconnected mode need to increase the installed capacity of wind turbines and batteries, thus making a good mutual support between interconnected micro-grids, which can be seen in WT-BAT micro-grids under interconnected mode as well. In terms of MG A and MG B, due to the existence of the interconnection, the micro-grids can make use of the complementary advantages of regional resources to support each other as a backup, making the power supply configuration reasonable and reducing unnecessary installed capacity of power generations and storage batteries.
As shown in Figure 7, MG A with the configuration of PV-BAT, WT-BAT and PV-WT-BAT show a large degree of cost reduction under interconnected mode, compared to independent mode, while MG B with the configuration of PV-BAT, WT-BAT and PV-WT-BAT show a little decrease in cost due to extra installed capacities of generation to support load for MG A. That is to say when the MG A has a weak power generation, there is a sufficient power to transmit from MG B to MG A, which makes MG A still achieve satisfactory power supply reliability with small installed power capacity. In addition, the cost savings of MG A under the configurations of PV-BAT, WT-BAT and PV-WT-BAT are 20.01%, 58.97% and 56.58% respectively. In addition, the cost reduction of MG B under the same configurations are 11.75%, 8.80% and 3.26% respectively.
5.2.2. Power Exchange Analysis
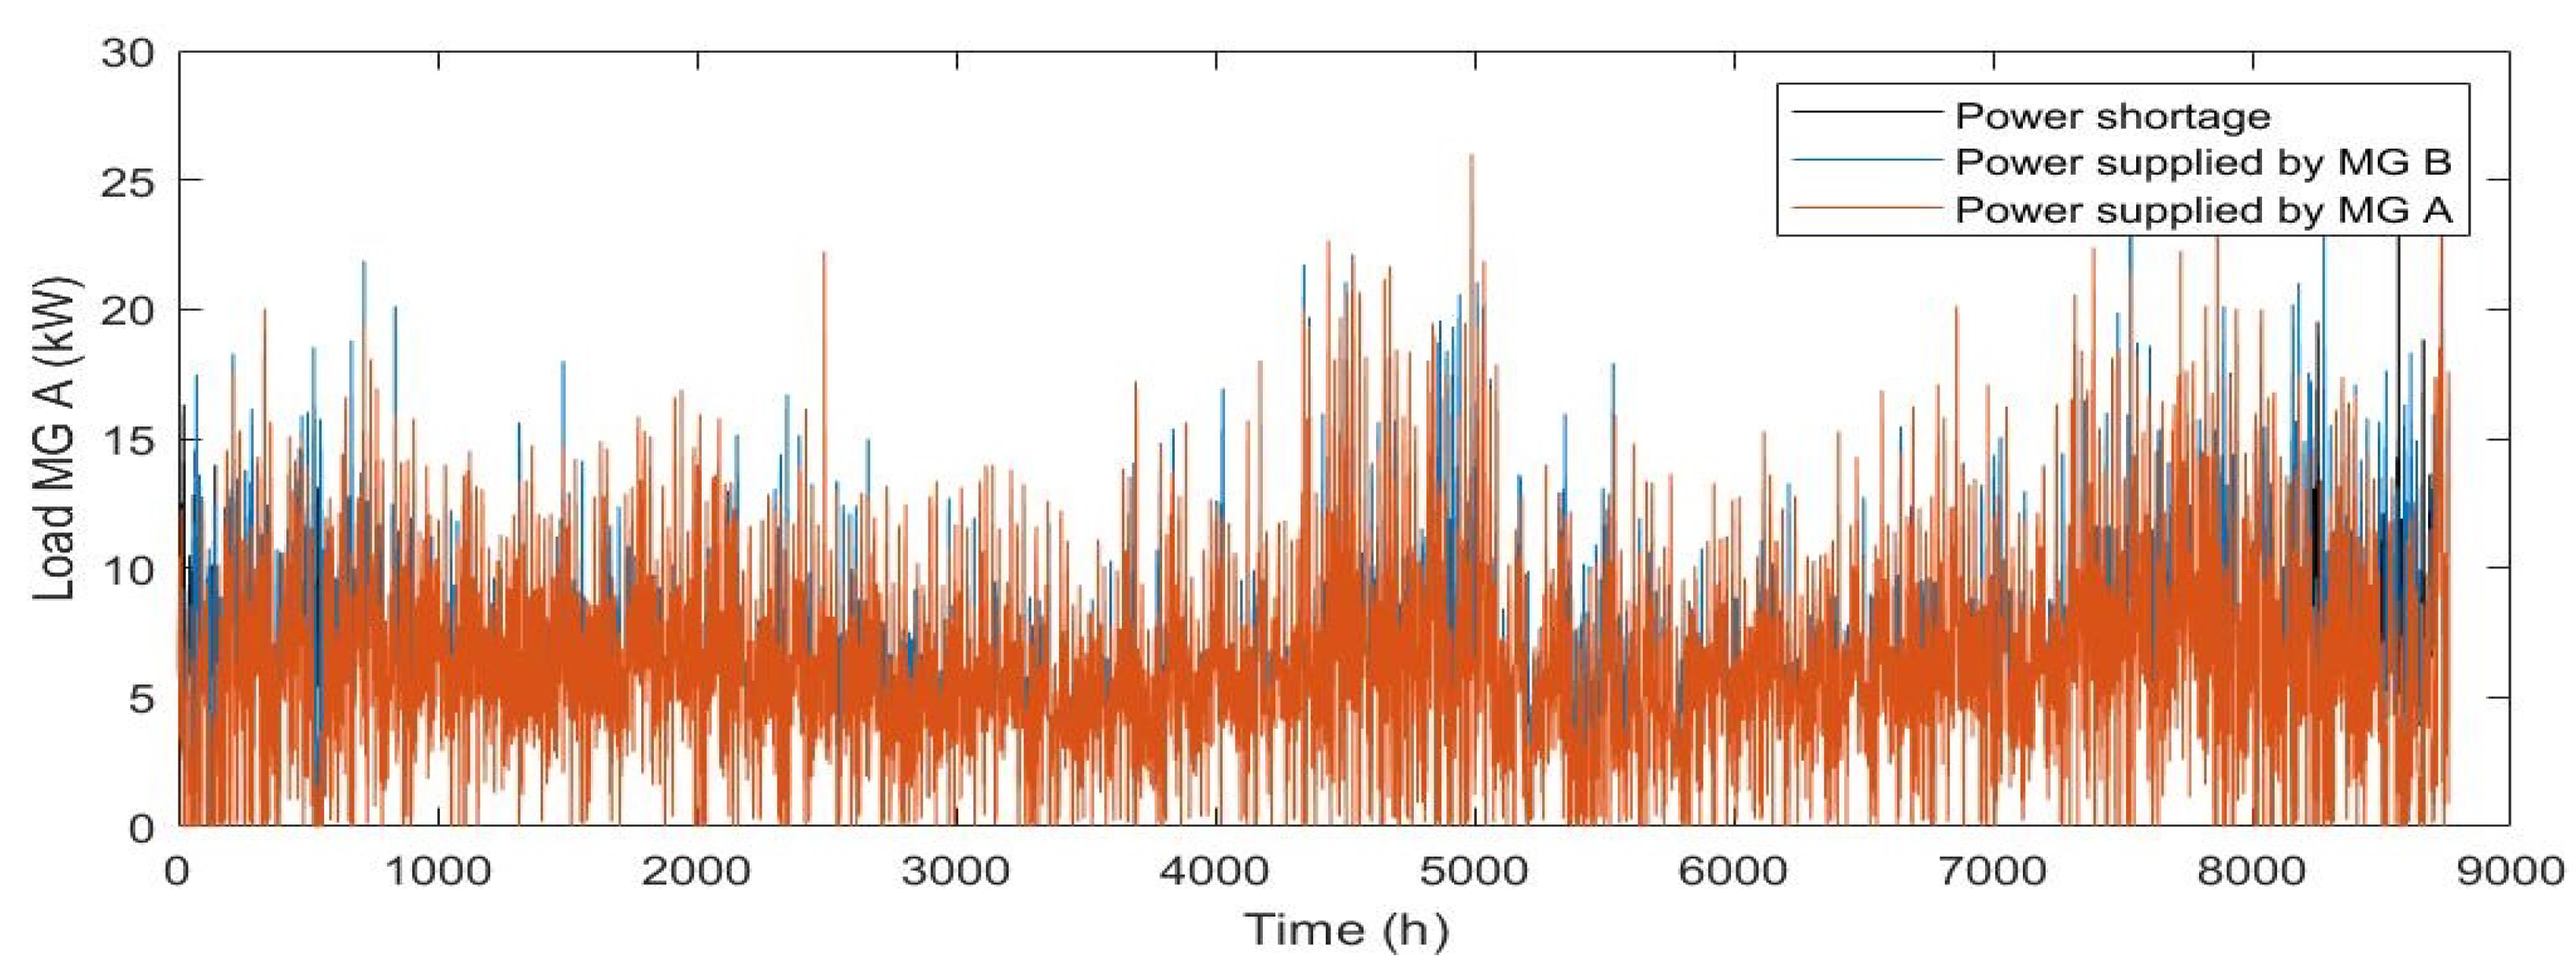
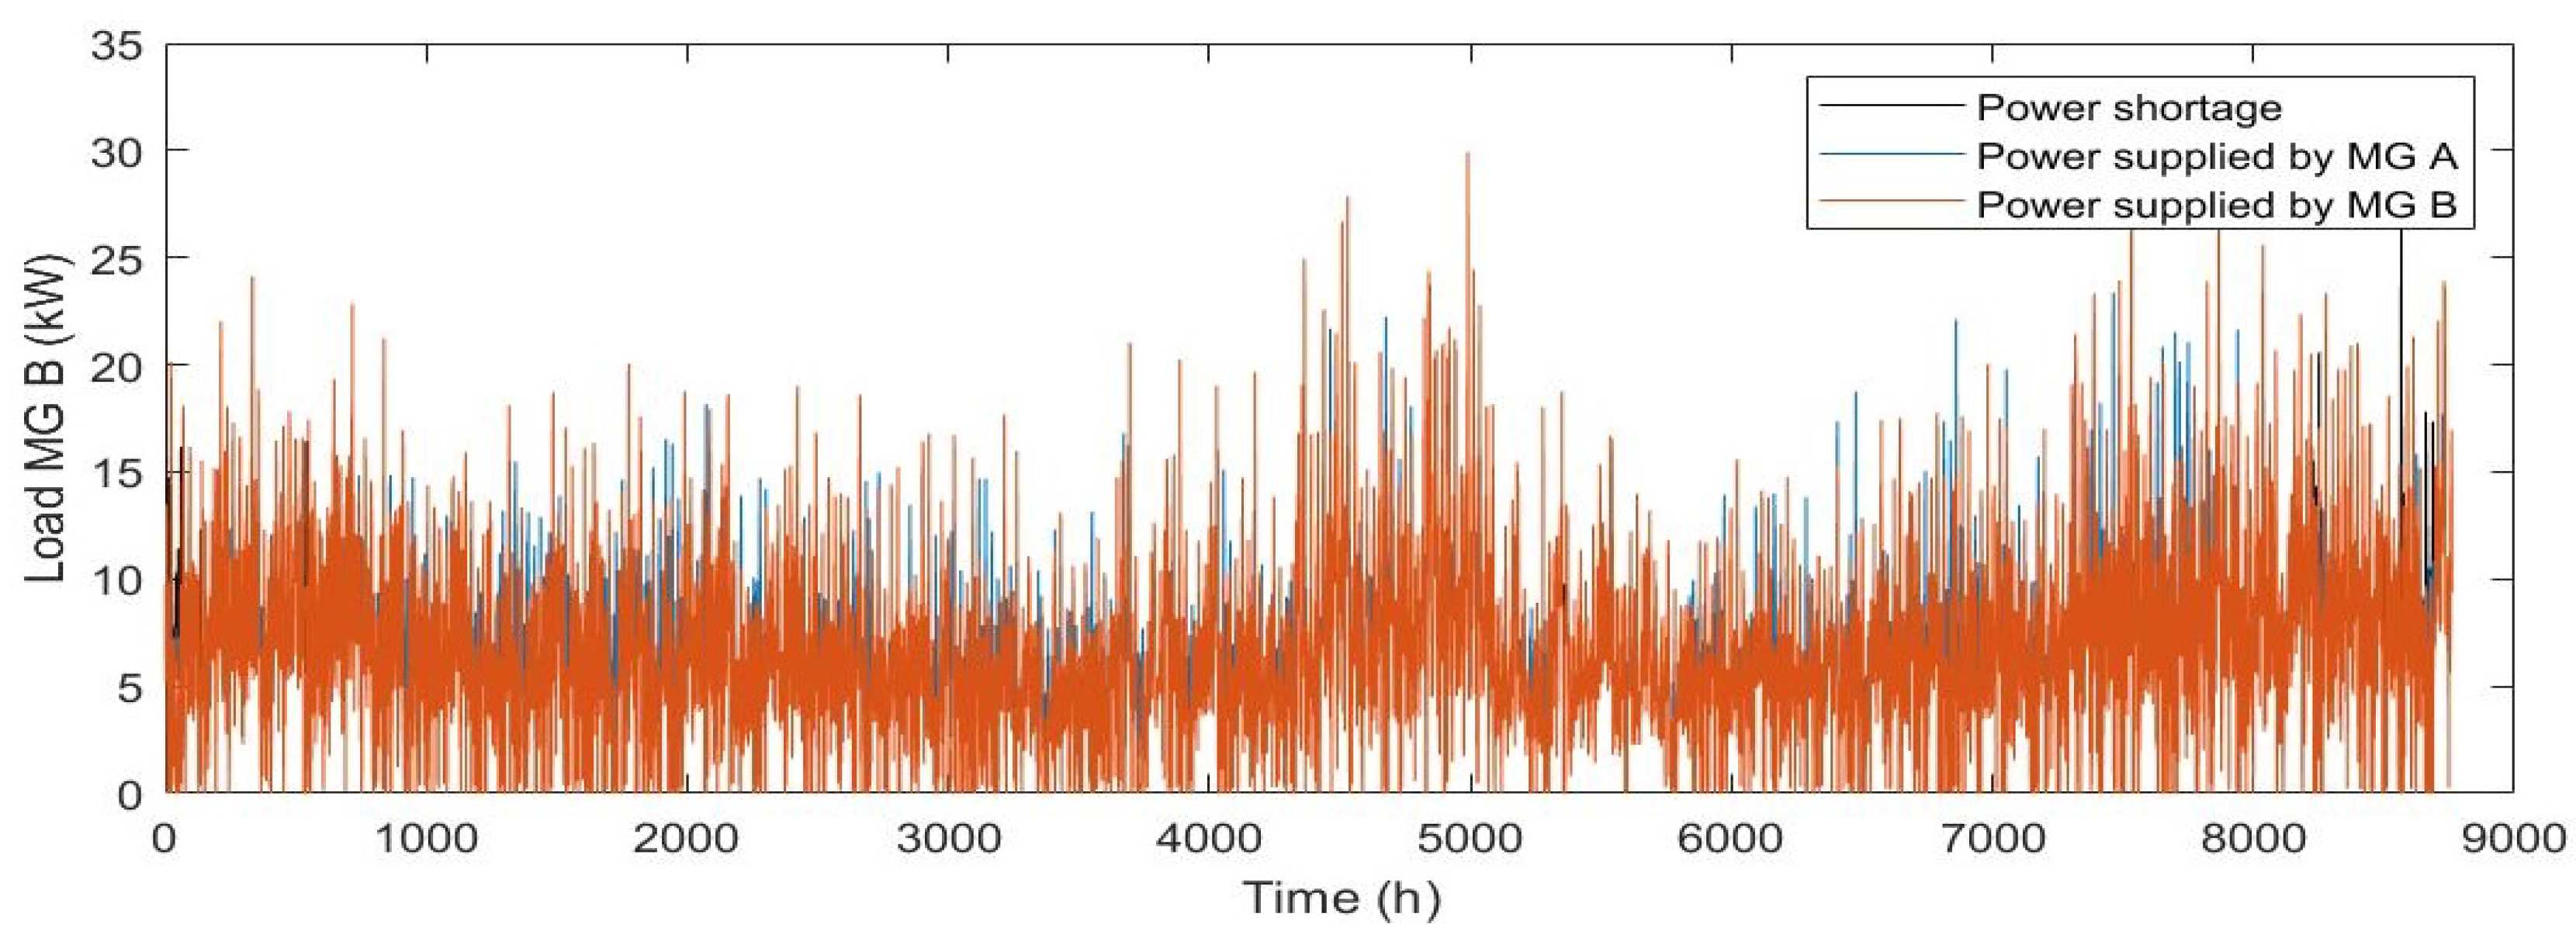
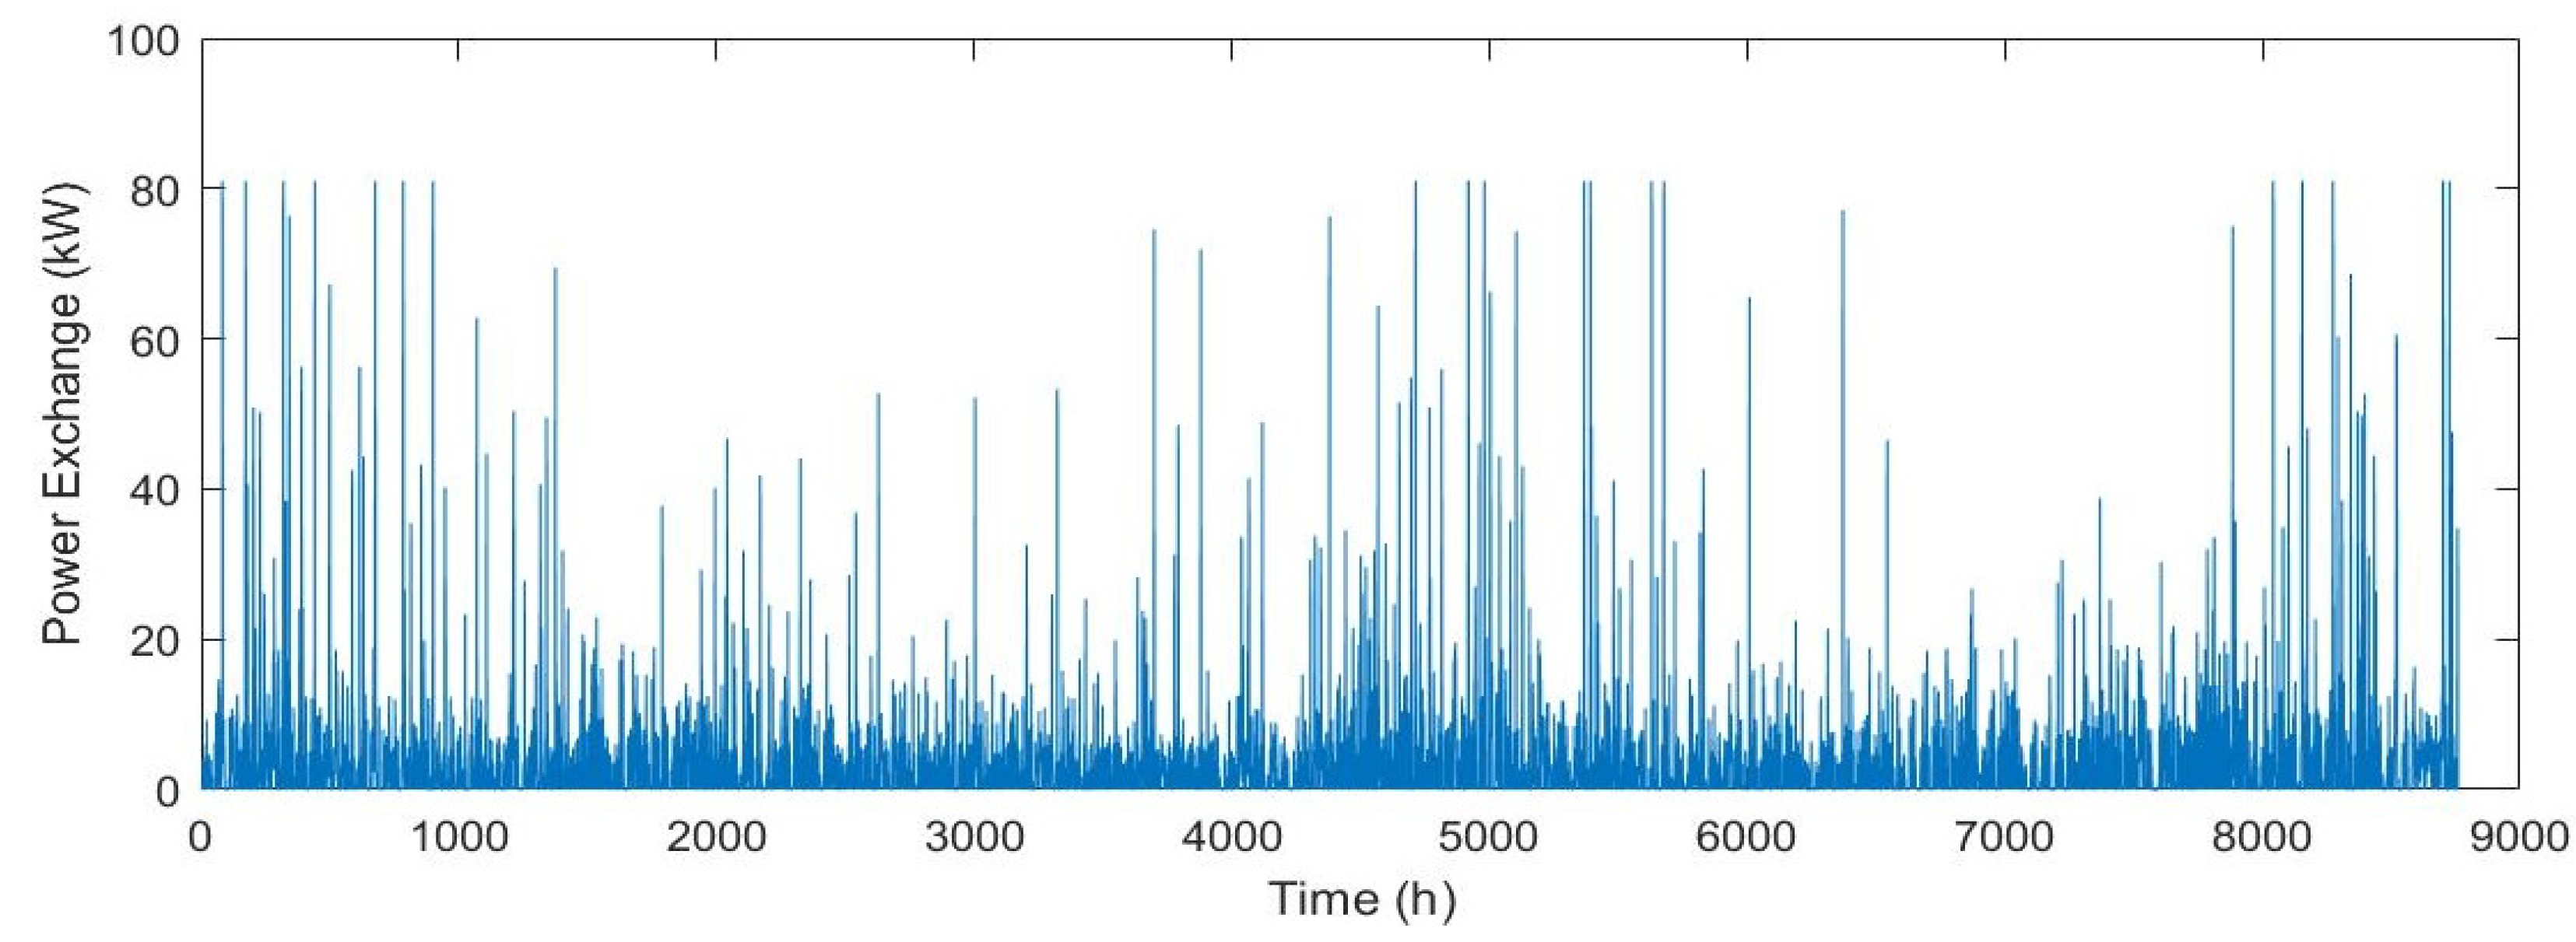
The key for the collaborative operation of two micro-grids is to make use of the diversified characteristics of resources in different locations forming complementary advantages with power exchange. In order to better understand the cost-saving mechanism of the two micro-grids system under interconnection, it is necessary to analyze the power exchange between the interconnected micro-grids. The load curves of MG A and MG B are shown in Figure 8 and Figure 9. In addition, the power exchange between the two interconnected micro-grids throughout the whole year is shown in Figure 10.
From Figure 8 and Figure 9, we can see that the interconnection between the two micro-grids contributes effectively to supporting residential load in each micro-grid, which ensures the reliability for power supply. In addition, Figure 10 shows that when the load is in the peak period of power consumption of a year, such as winter or summer, the power exchange between interconnected micro-grids is the most frequent. The main reason is that the interconnected mode makes positive energy exchange between interconnected micro-grids, thus ensuring reliable power consumption for users with less installed power capacity. During the simulation period, The total power transferred form MG A to MG B for one year is 11,055.72 kWh, which is 16.77% of load for MGB. The total power transferred form MG B to MG A for one year is 20,777.03 kWh, which is 31.56% of load for MG A. The comparison of the installed capacity for PV-WT-BAT under two modes shows a reduction trend in the necessary installed capacity of the photovoltaic panels and batteries. The total power exchange between MG A and MG B is shown by Table 5.
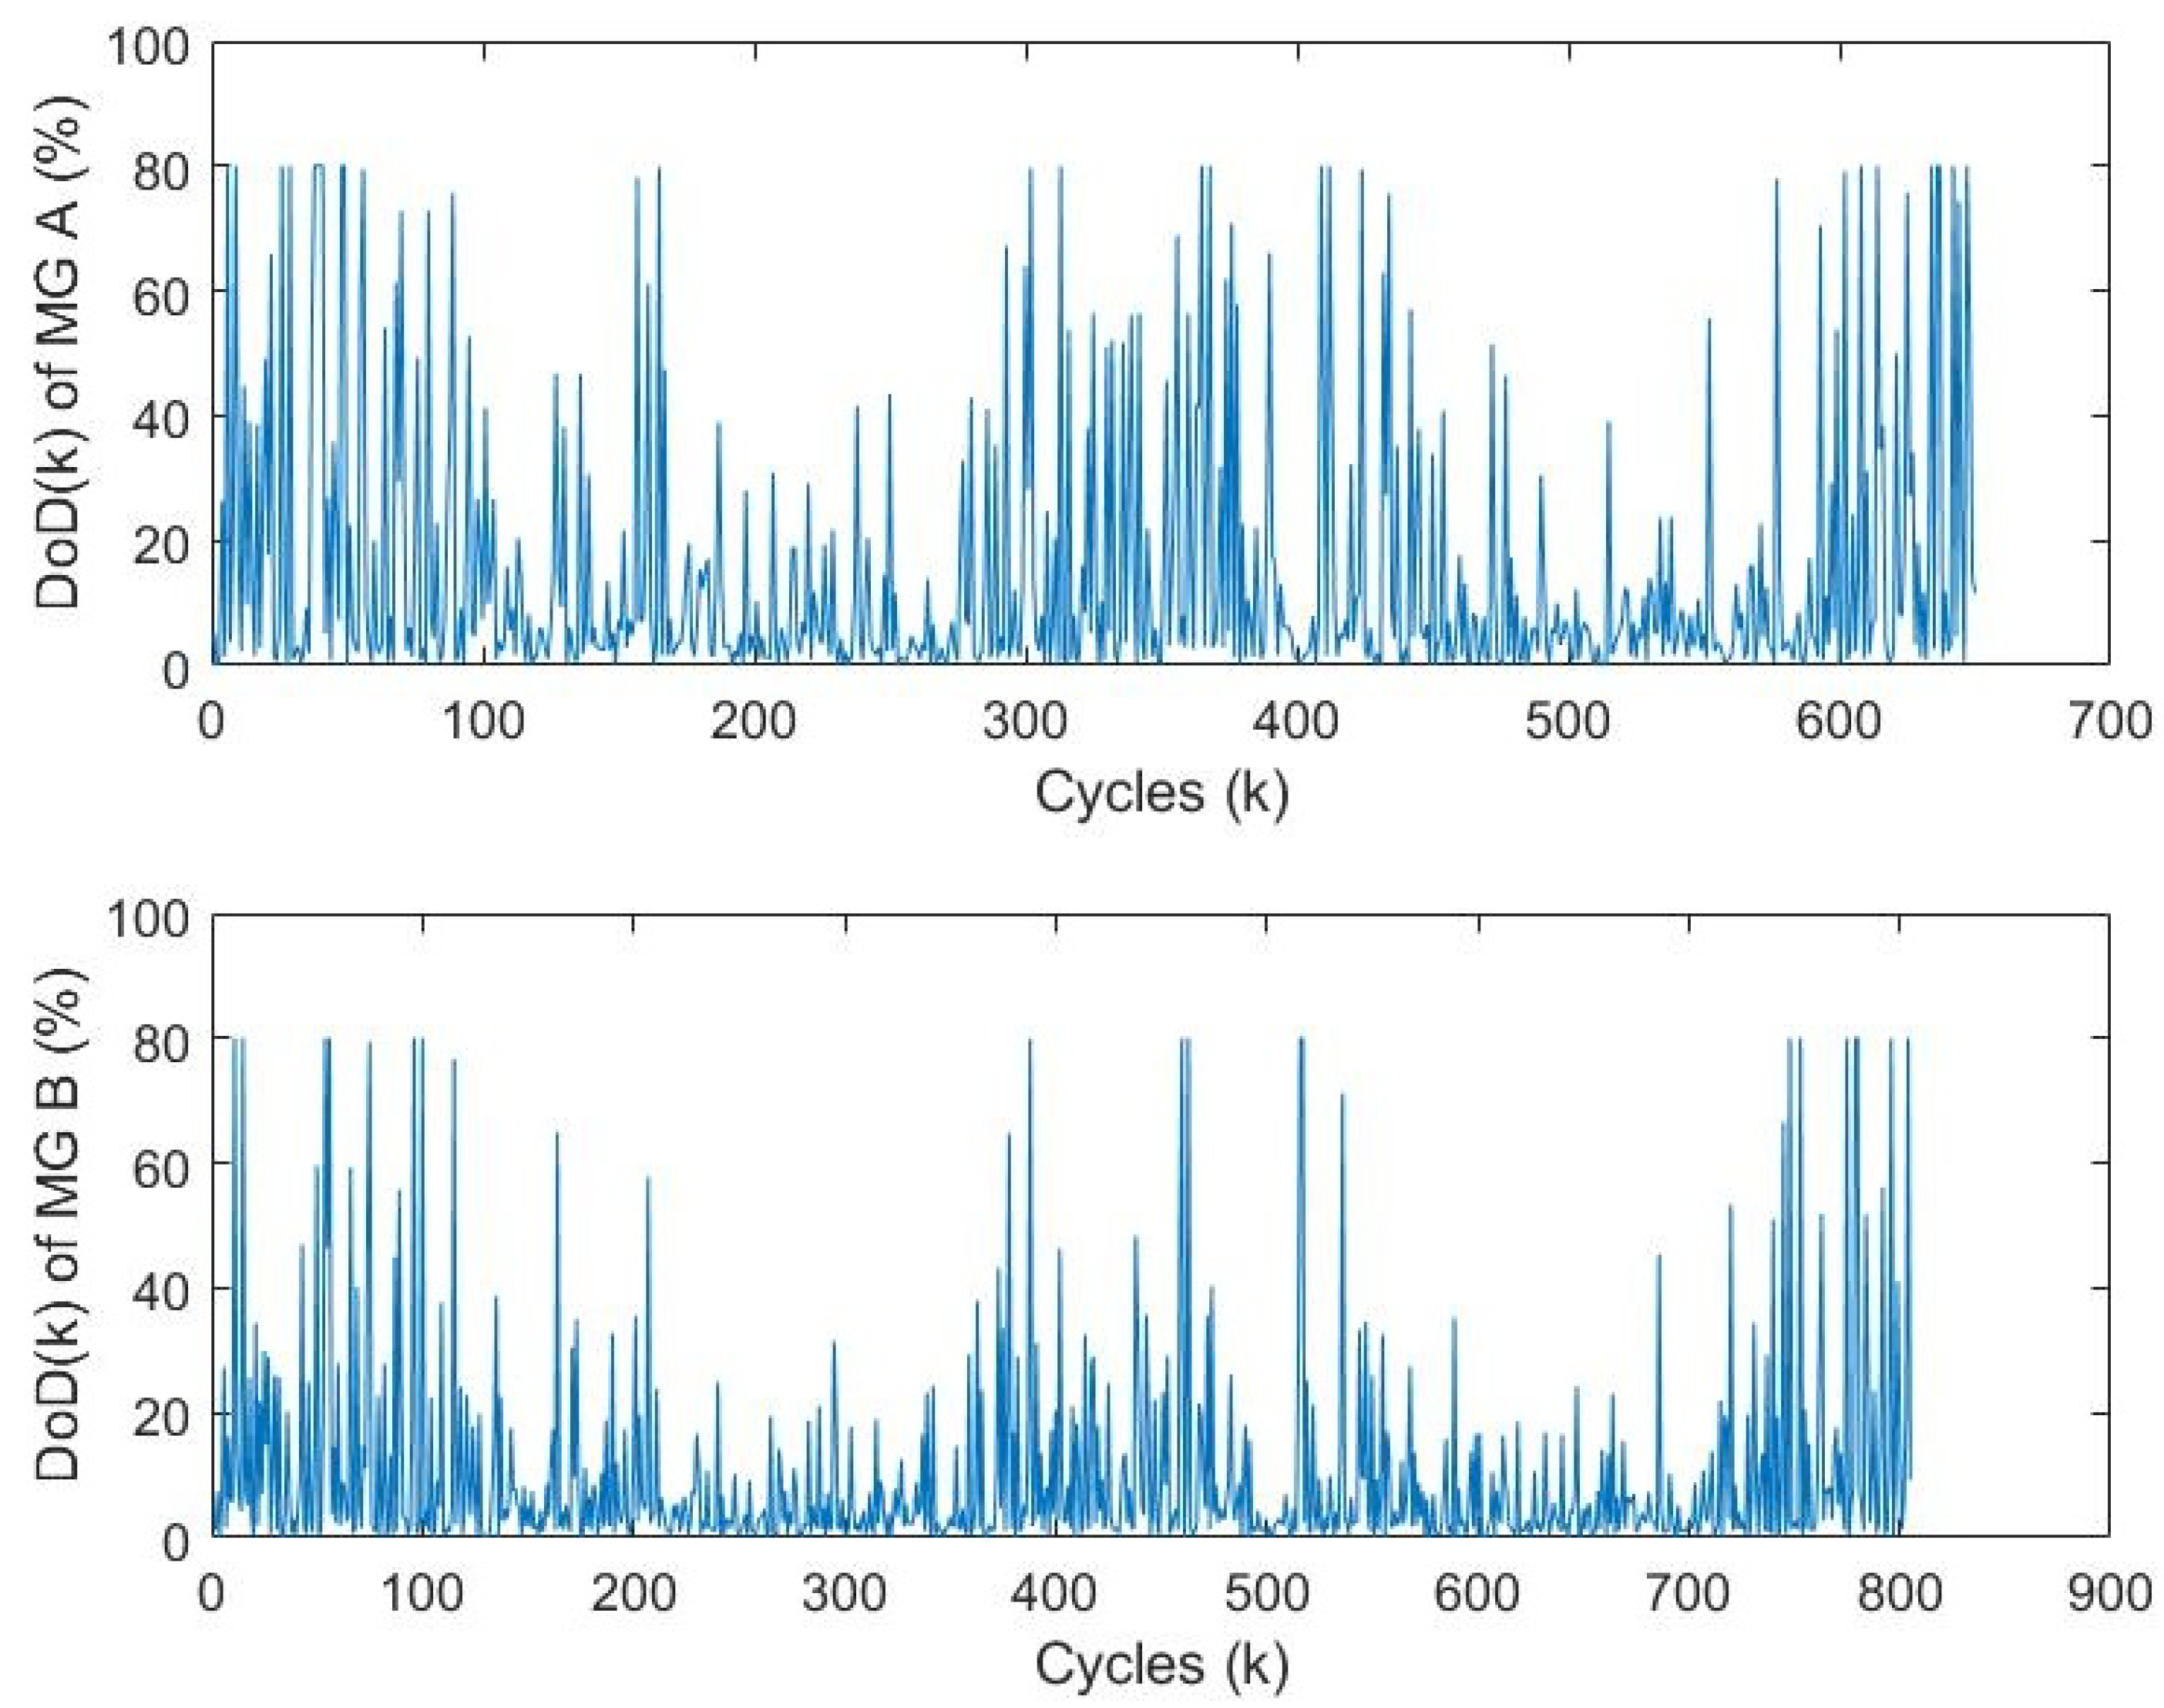
The power exchange between the interconnected micro-grids can be seen from Table 5. The power transmitted from MG B to MG A is more than that from MG A to MG B, which is mainly due to the abundant wind resources in the B area. Unlike the independent mode, the unbalanced power generated by the MG A and MG B at time t is not stored in its own energy storage system, but is firstly consumed directly according to the load of the interconnected micro-grid at the same moment. Due to the interconnection mode, micro-grids can make full use of regional tie line to deliver unbalanced power directly. The depth of discharge (DoD) of MG A and MG B calculated by Rain Flow algorithm are shown in Figure 11. The lifetime calculated according to the dispatch in the collaborative operation for batteries of MG A and MG B are 7.5 years and 8.17 years respectively. In addition, when there is surplus of power or power shortage at either side of the interconnected micro-grids, the unbalanced power can be maximally stored or supplied according to the different states of the terminal’s storage batteries, which improves the reliability of micro-grids system under interconnected mode.
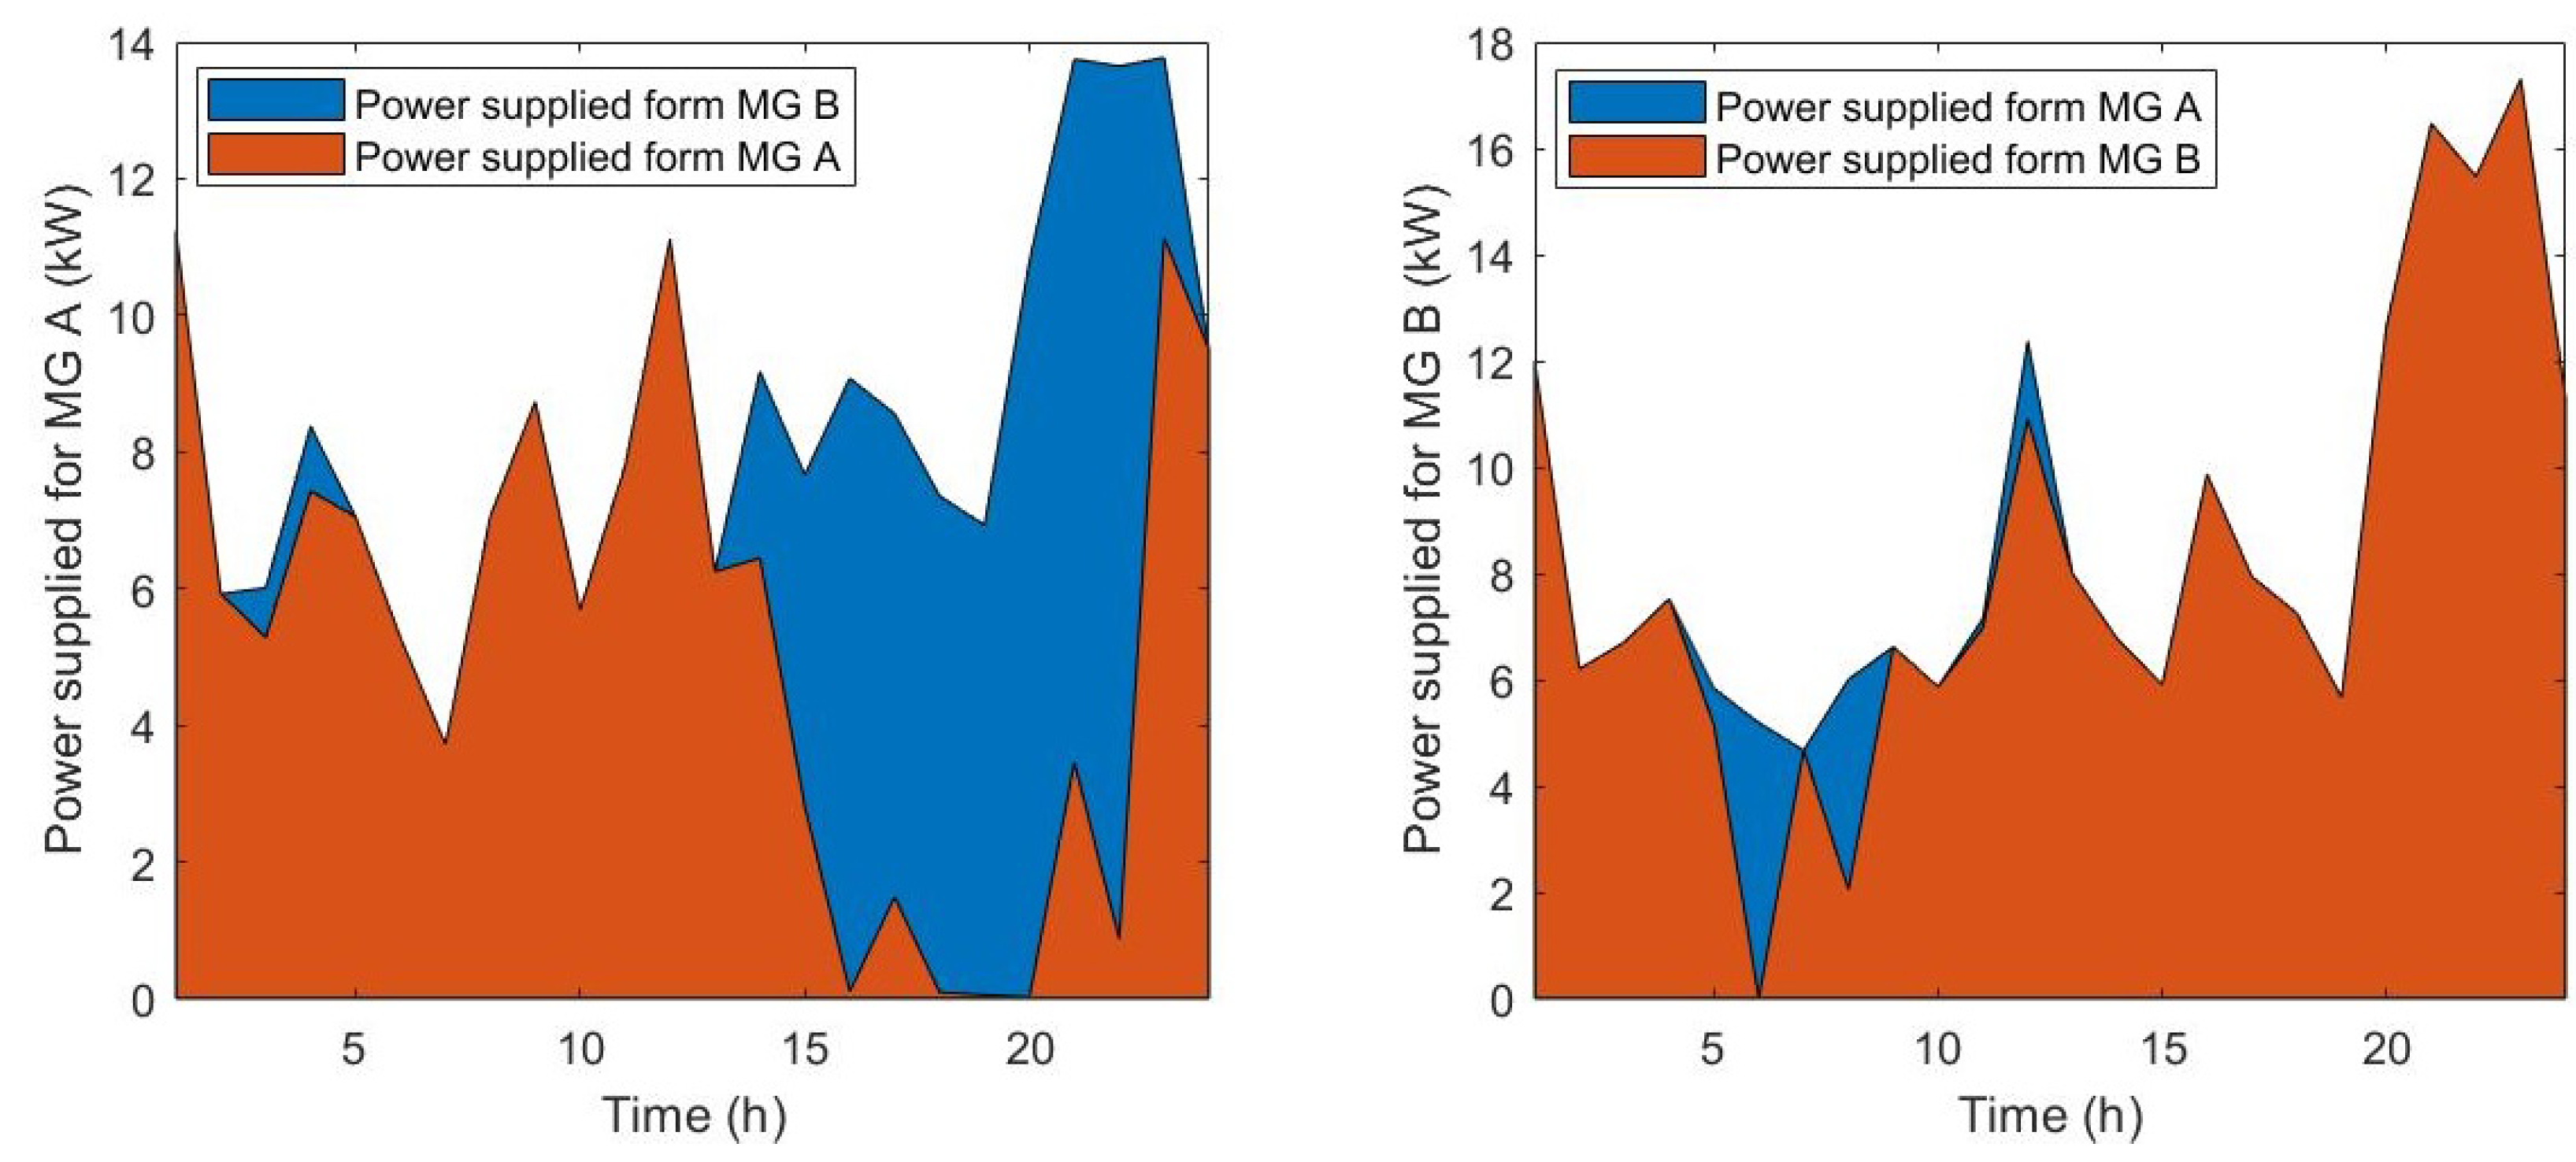
In order to further describe the collaborative operation of the interconnected micro-grids, a typical day is selected in the area where the power exchange is frequent to analyze the power supply of the MG A and the MG B, as shown in Figure 12. From the figure, it can be seen that on the typical day from 2:00 to 5:00 and from 15:00 to 24:00, the MG B has enough energy to generate power, thus has sufficient power to provide support for MG A. During the period of 3:00 to 9:00 and from 10:00 to 13:00, the power generation of MG B is relatively weak, so that MG A provides an effective power supply to MG B to meet its load demand.
5.2.3. Sensitivity Analysis of Power Transaction Price
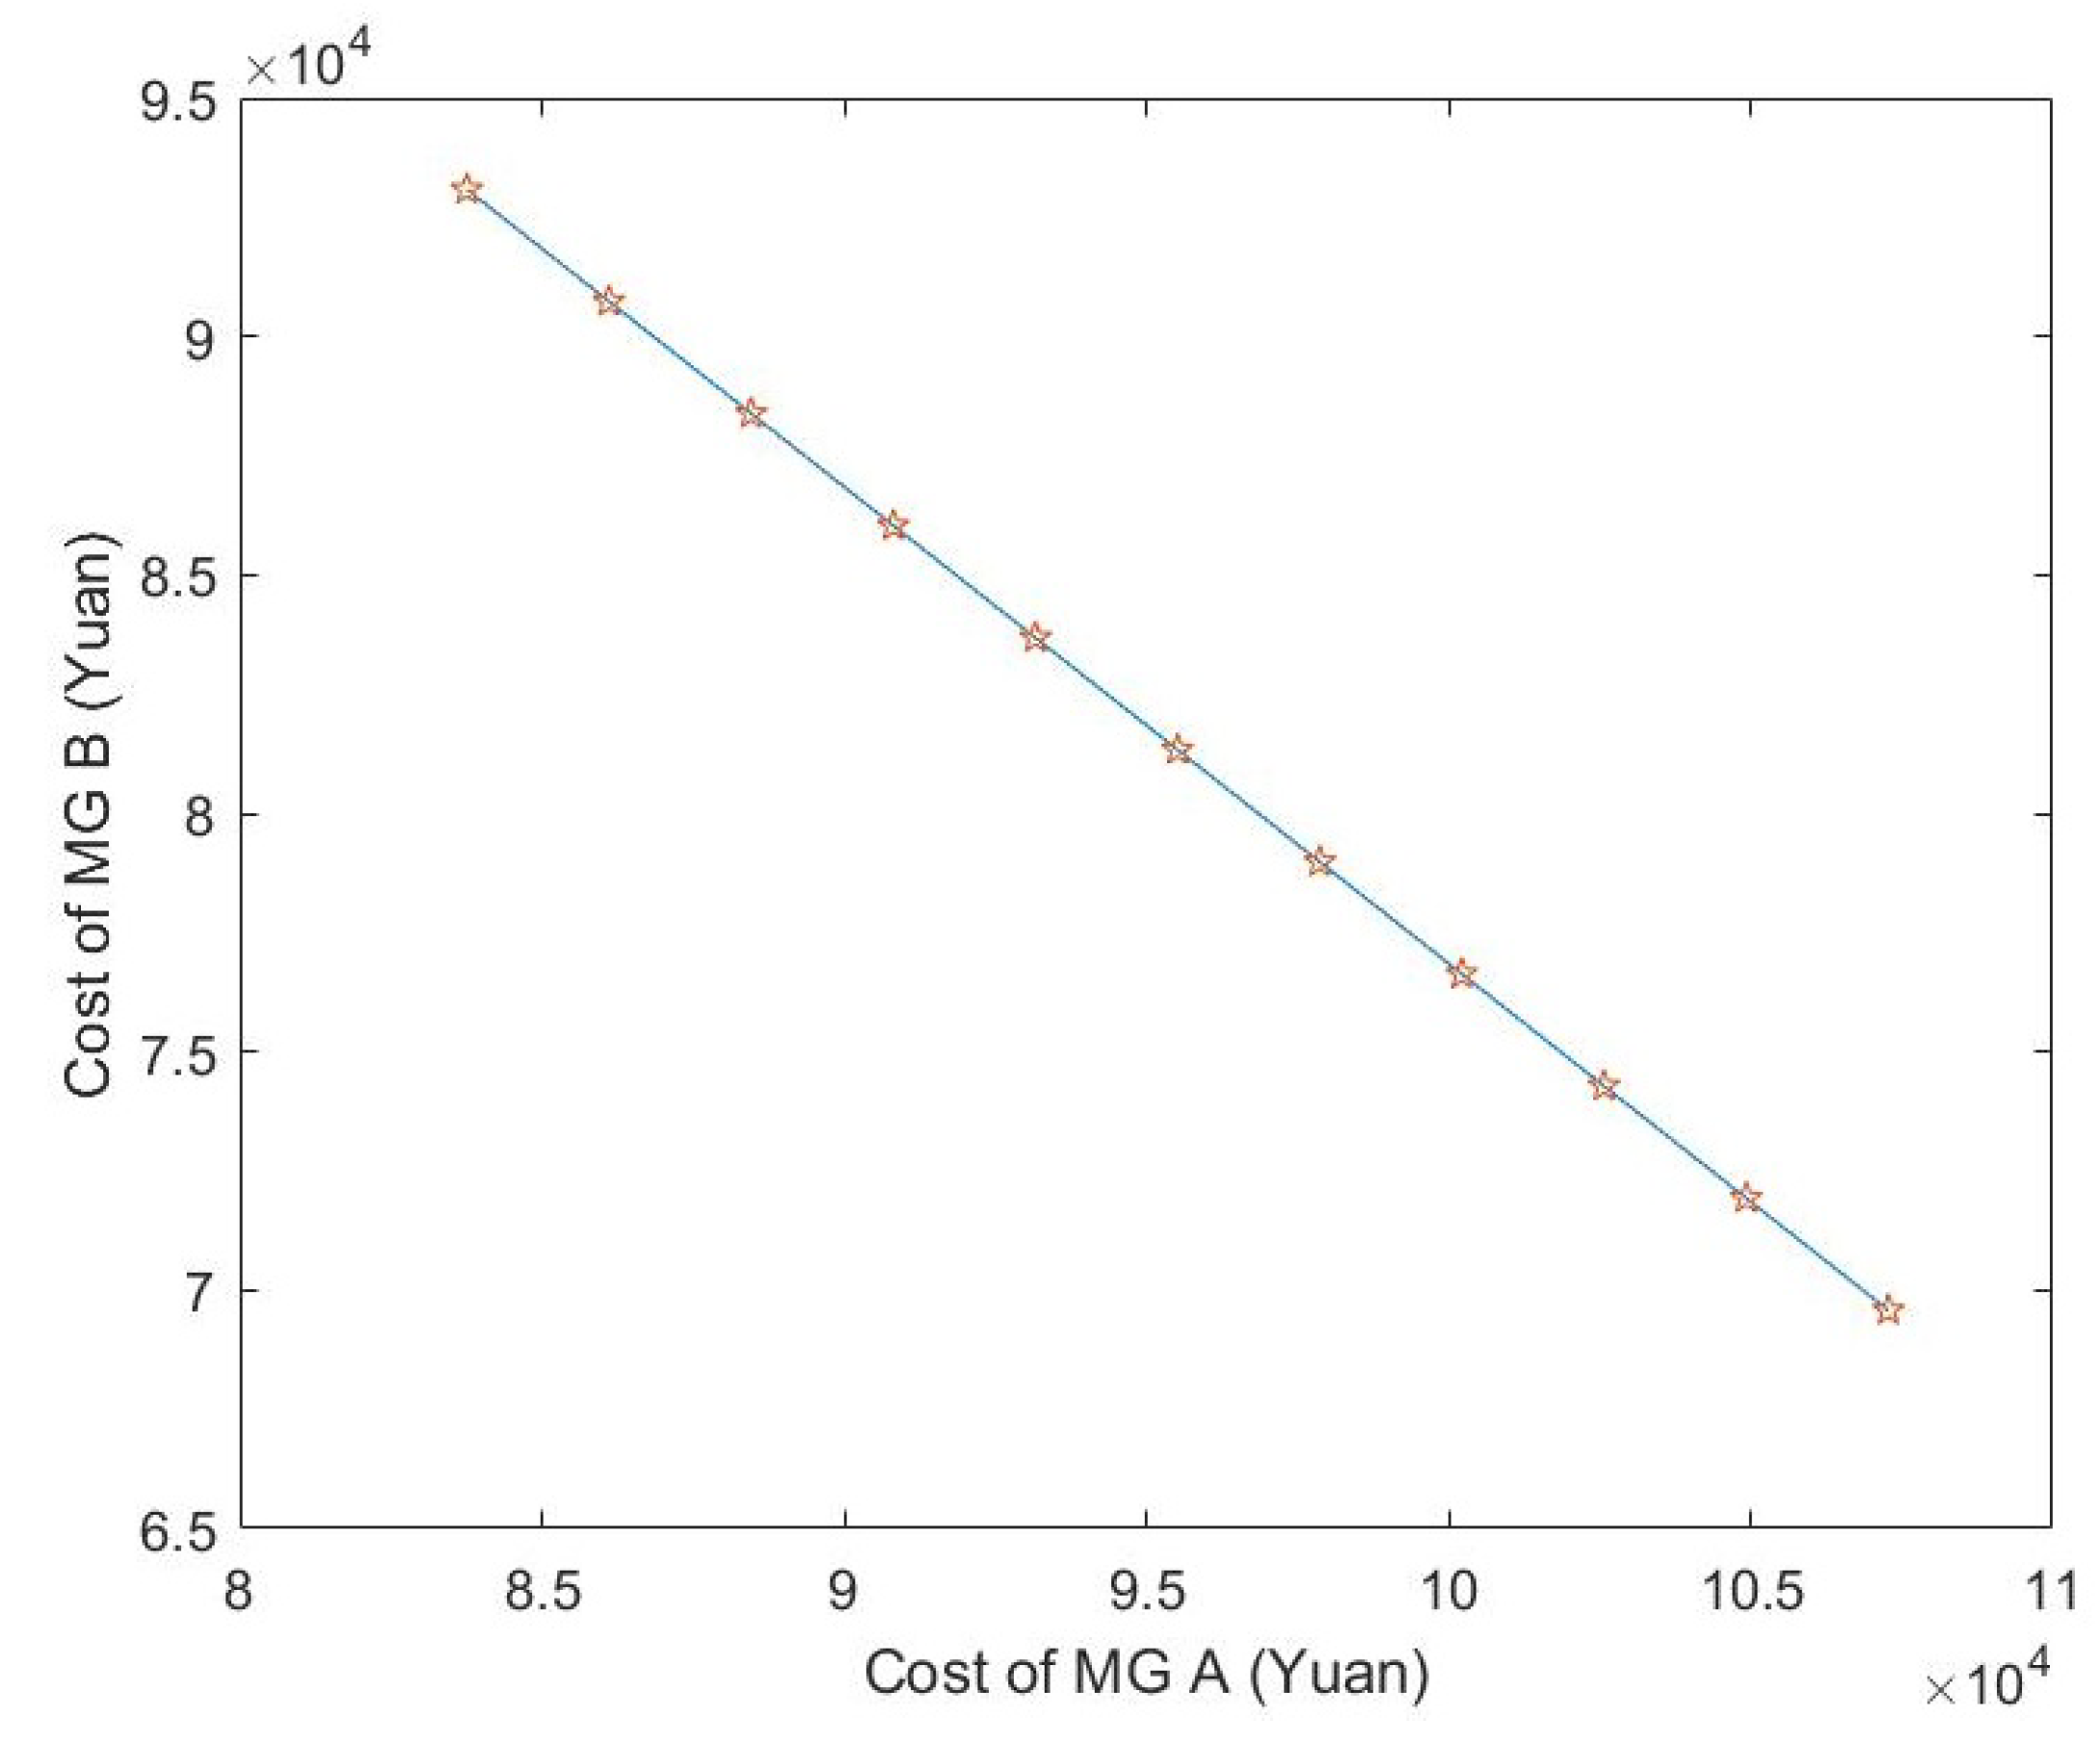
It is clear from the above tables and figures that in the interconnected system composed of two micro-grids, the collaborative operation can be well operated, thus, reducing the total cost of the system. The following part will discuss how the cost savings achieved by the interconnected system as a whole can be reasonably distributed between the two micro-grids so that each stakeholder will prefer to adopt interconnection. The initial unified purchase price for the power exchanged of the two micro-grids is set as 2.42 Yuan/(kW · h), which is the mean of the upper bound and lower bound of acceptable prices. In addition, a proper transaction price set between interconnected micro-grids can also ensure that both stake-holders have a low cost while ensuring the reliability of power, and prefer to be interconnected. When the price of power transaction fluctuates within a certain range, the cost changes of interconnected micro-grids with the power transaction price are shown in Figure 13 and Figure 14.
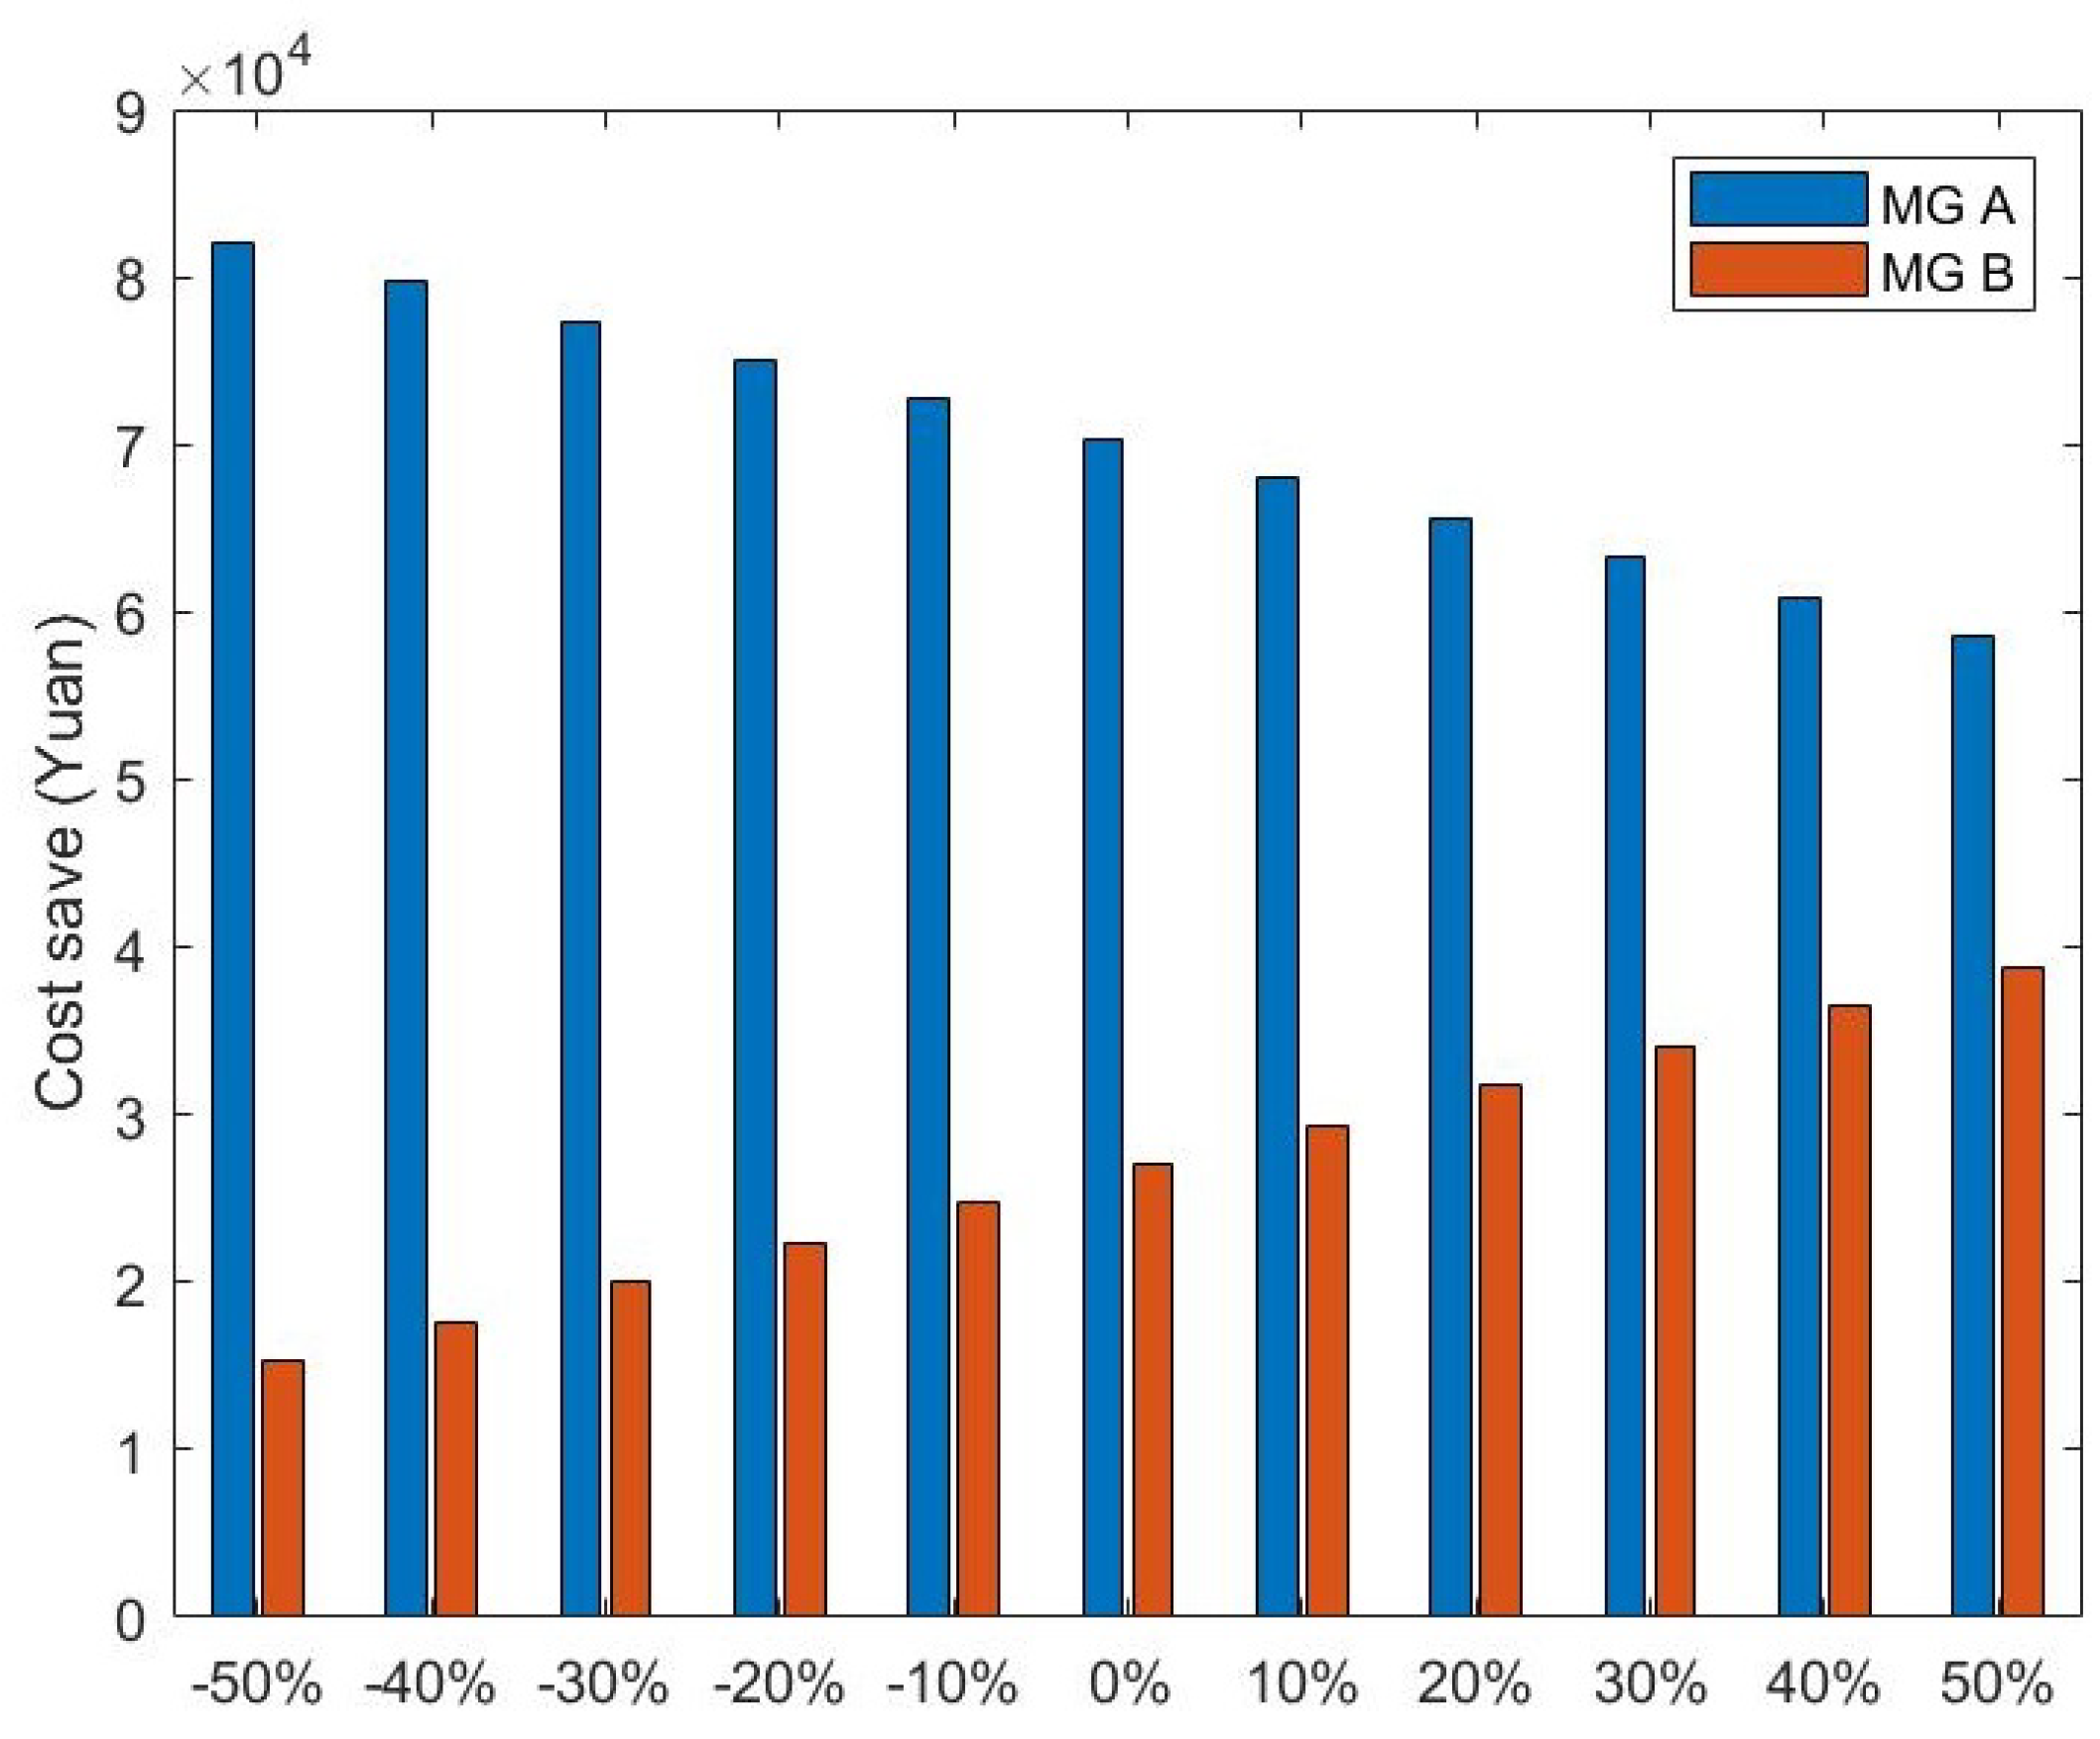
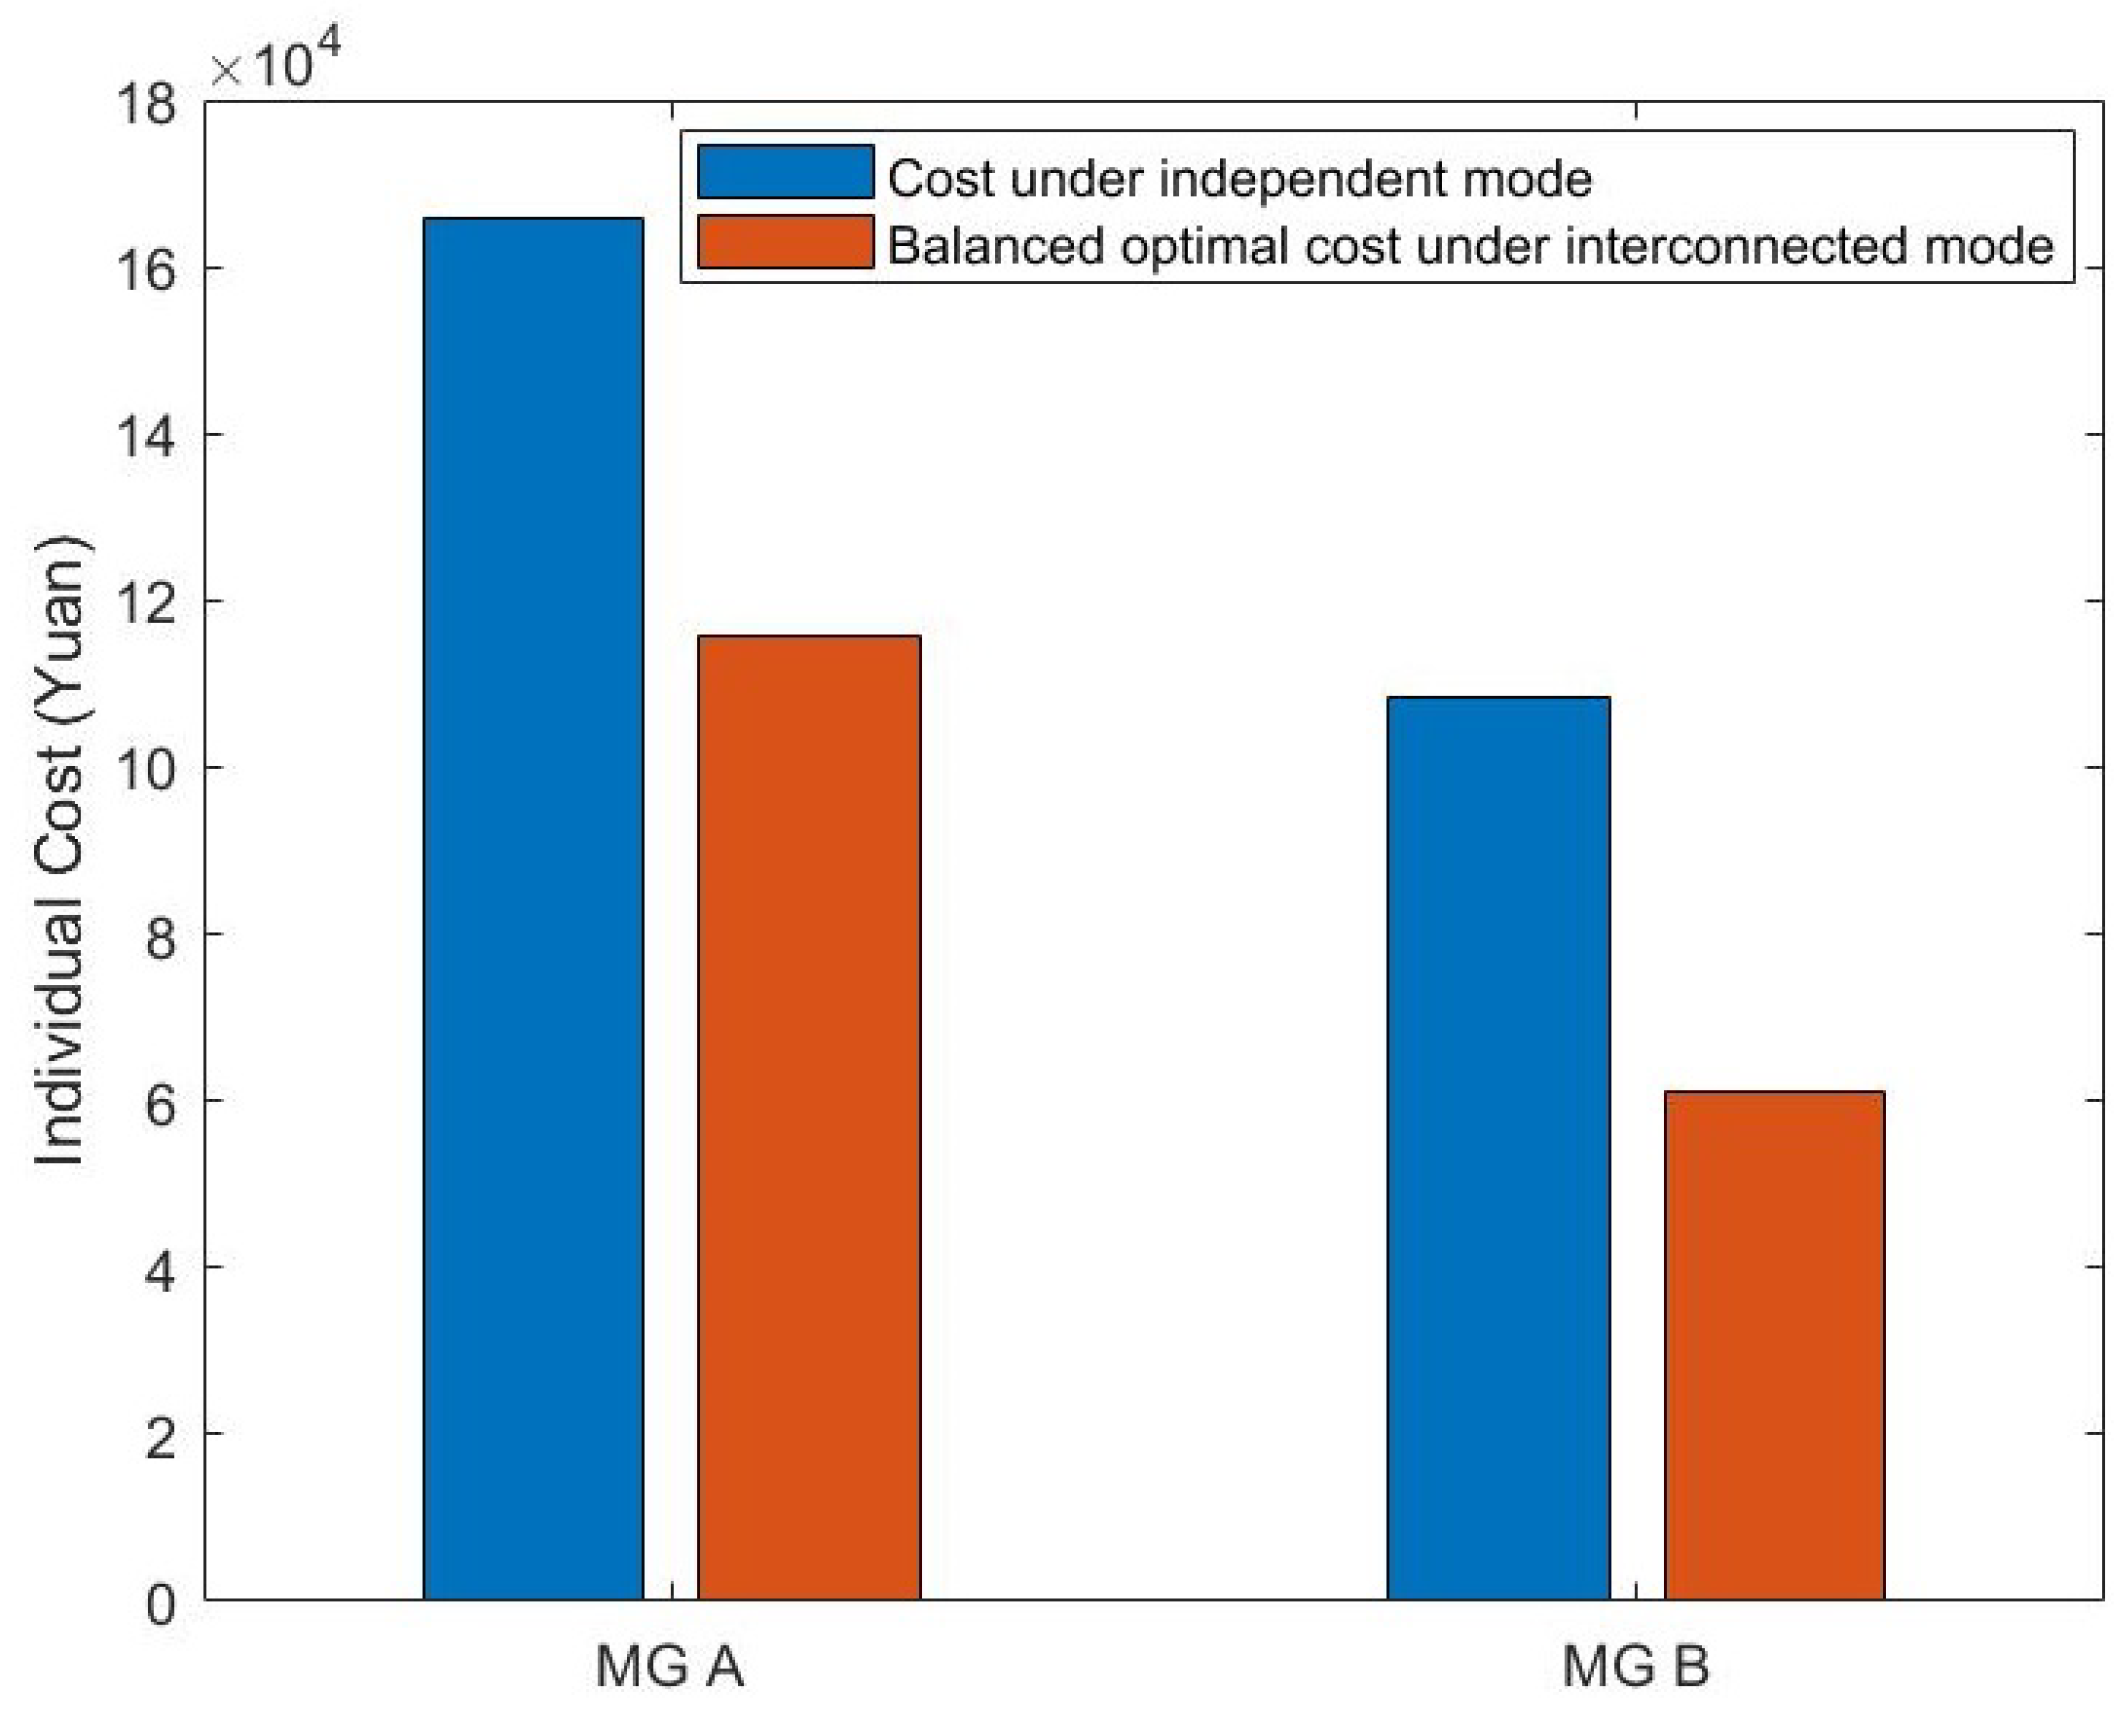
According to the simulation results, when the power transaction price takes 4.5 Yuan/kWh, the cost savings of both MG A and MG B are relatively large, and both of the interconnected micro-grids have a strong willingness to adopt interconnection. Compared with the cost of independent sizing mode, the cost of MG A is 115,770.86 Yuan, reduced by 30.2%, and the cost of MG B is 61,066.88 Yuan, reduced by 43.65%, which is shown in Figure 15.
6. Conclusions
In this paper, the optimal sizing method of WT-PV-BAT and the tie line for two micro-grids on the base of collaborative operation in off-grid area is studied. To explicitly model the power exchange behaviour between the two adjacent MGs from the system-level level, a specific dispatch of power is built. Thus, the optimal sizing of photovoltaic, wind turbine and battery for the two micro-grids system is carried out based on the energy dispatch mentioned above to supply the load demand minimizing the total cost while considering the relevant constraints.
The results demonstrate that the optimal sizing of photovoltaic, wind turbine and battery for the two micro-grids system should consist of 45 wind turbines, 22 photovoltaic panels and 354 batteries with a total installed generation capacity of 231.5 kW (97.19% WT and 2.81% PV). In addition, the optimal capacity for the tie line between the micro-grids is 81 kW. The annual cost of the two micro-grids system with the optimal installed power generation under interconnection mode is 176,837.74 Yuan (25,361.45 Dollars), with a decrease of 35.51% compared to the cost under independent sizing mode. Balanced by a proper transaction price, the cost of MG A is 115,770.86 Yuan (16,603.45 Dollars) with a decrease of 30.2% and the cost of MG B is 61,066.88 Yuan (8758 Dollars) with a decrease of 43.65%, compared to the costs under independent sizing mode respectively. Interconnected micro-grids will have a strong willingness to adopt interconnection with a optimal unified transaction price of 4.5 yuan/kWh (0.65 Dollars/kWh).
The proposed approach is meaningful such that, as a whole, compared with two independent MGs, the interconnected MGs system has a better economic performance. Among them, the PV-WT-BAT micro-grids under regional interconnection had been proved to have the best performance in economy with acceptable reliability, which proved the effectiveness of sizing for the two MGs based on collaborative operation proposed in this paper. In addition, power exchange analysis reveals how the power of the two MGs runs to make the collaborative operation work. Based on the interconnection mode, benefits can be shared between interconnected MGs with a reasonable transaction price, thereby increasing the enthusiasm of the stake-holders to adopt. Therefore, the suggested method could be used for real implementations to help MGs decision maker on optimal sizing of two or even more adjacent MGs in an off-grid area. Furthermore, besides photovoltaic and wind turbine, the method proposed in our work can also be generalized to the optimization problem of two adjacent MGs containing a variety of renewable energy generations with intermittent.
There exists some limitations of this study, which need to be further investigated in our future work. Firstly, the renewable energy data is set to be deterministic in this paper. Considering the uncertainty of renewable energy will make the simulation more realistic. Secondly, the optimal sizing in this paper only considers two adjacent MGs. However, as the scale of the system increases, more MGs with various types of generations are supposed to be studied under interconnection.
Author Contributions
Conceptualization, Y.H. and L.Y.; methodology, Y.H. and L.Y.; software, L.Y. and S.L.; validation, Y.L., S.L. and G.W.; formal analysis, S.L. and G.W.; investigation, L.Y. and G.W.; resources, G.W.; data curation, L.Y.; writing—original draft preparation, L.Y.; writing—review and editing, L.Y. and S.L.; visualization, L.Y.; supervision, Y.H.
Funding
This research was funded by the Fundamental Research Funds for the Central Universities Grant Number 2018QN095.
Conflicts of Interest
The authors declare no conflict of interest.
Abbreviations
The following abbreviations are used in this paper:
| the total annual cost (AC) of the interconnected micro-grids system | price for unit cost of the tie line | ||
| the annual cost of MGA | load demand at time t | ||
| the annual cost of MGA | amount of unbalanced power of interconnected micro-grid at time t | ||
| the annual cost of k | total power generated by WT of k at time t | ||
| capacity for the tie line | total power generated by PV of k at time t | ||
| G | perpendicular radiation at array surface | power shortage at time t | |
| unit initial investment cost for component j of k | power demand at time t | ||
| annual cost of initial investment for component j of k | power exchange at time t | ||
| i | the discount rate | maximum for power exchange | |
| j | photovoltaic panels, wind turbines or battery storage | annual cost of replacement for component j of k | |
| k | MG A or MG B | unit replacement cost for component j of k | |
| maximum for loss of power supply probability | solar insolation in one instant of time t | ||
| installed number for component j of k | power loss rate of tie line | ||
| lifetime for component j of k | aging rate for battery | ||
| upper bound of installation amount for PV | state of charge of battery at time t | ||
| upper bound of installation amount for WT | upper bound for SOC of battery | ||
| upper bound of installation amount for battery | lower bound for SOC of battery | ||
| lifetime for tie line | wind speed at the instant time t | ||
| the cycle for each DOD | cut-in wind speed of WT | ||
| annual cost of operation and maintenance for component j of k | cut-out wind speed of WT | ||
| annual cost of operation and maintenance for component j of k | rated wind speed of WT | ||
| power supplied by each PV at time t | annual growth rate of operation and maintenance cost for component j of k | ||
| rated power of PV panel | photovoltaic module efficiency | ||
| power supplied by each WT at time t | inverter efficiency | ||
| rated power of WT | battery efficiency | ||
| power generated by renewable energy |
References
- Adefarati, T.; Bansal, R.C. Reliability and economic assessment of a microgrid power system with the integration of renewable energy resources. Appl. Energy 2017, 206, 911–933. [Google Scholar] [CrossRef]
- Ahadi, A.; Kang, S.K.; Lee, J.H. A novel approach for optimal combinations of wind, PV, and energy storage system in diesel-free isolated communities. Appl. Energy 2016, 170, 101–115. [Google Scholar] [CrossRef]
- Xu, Z.; Yang, P.; Zheng, C.; Zhang, Y.; Peng, J.; Zeng, Z. Analysis on the organization and Development of multi-microgrids. Renew. Sustain. Energy Rev. 2017, 81. [Google Scholar] [CrossRef]
- Ismail, M.S.; Moghavvemi, M.; Mahlia, T.M.I.; Muttaqi, K.M.; Moghavvemi, S. Effective utilization of excess energy in standalone hybrid renewable energy systems for improving comfort ability and reducing cost of energy: A review and analysis. Renew. Sustain. Energy Rev. 2015, 42, 726–734. [Google Scholar] [CrossRef] [Green Version]
- Markvart, T. Sizing of hybrid photovoltaic-wind energy systems. Sol. Energy 1996, 57, 277–281. [Google Scholar] [CrossRef]
- Celik, A.N. Optimisation and techno-economic analysis of autonomous photovoltaic-wind hybrid energy systems in comparison to single photovoltaic and wind systems. Energy Convers. Manag. 2002, 43, 2453–2468. [Google Scholar] [CrossRef]
- Koutroulis, E.; Kolokotsa, D.; Potirakis, A.; Kalaitzakis, K. Methodology for optimal sizing of stand-alone photovoltaic/wind-generator systems using genetic algorithms. Sol. Energy 2006, 80, 1072–1088. [Google Scholar] [CrossRef]
- Chedid, R.; Rahman, S. Unit sizing and control of hybrid wind-solar power systems. IEEE Trans. Energy Convers. 1997, 12, 79–85. [Google Scholar] [CrossRef]
- Katti, P.K.; Khedkar, M.K. Alternative energy facilities based on site matching and generation unit sizing for remote area power supply. Renew. Energy 2007, 32, 1346–1362. [Google Scholar] [CrossRef]
- Ferrer-Martí, L.; Domenech, B.; García-Villoria, A.; Pastor, R. A MILP model to design hybrid wind-photovoltaic isolated rural electrification projects in developing countries. Eur. J. Oper. Res. 2013, 226, 293–300. [Google Scholar] [CrossRef]
- Zhao, B.; Zhang, X.; Li, P.; Wang, K.; Xue, M.; Wang, C. Optimal sizing, operating strategy and operational experience of a stand-alone microgrid on Dongfushan Island. Appl. Energy 2014, 113, 1656–1666. [Google Scholar] [CrossRef]
- Ma, T.; Yang, H.; Lin, L. A feasibility study of a stand-alone hybrid solar–wind–battery system for a remote island. Appl. Energy 2014, 121, 149–158. [Google Scholar] [CrossRef]
- Silvente, J.; Kopanos, G.M.; Pistikopoulos, E.N.; Espuña, A. A rolling horizon optimization framework for the simultaneous energy supply and demand planning in microgrids. Appl. Energy 2015, 155, 485–501. [Google Scholar] [CrossRef] [Green Version]
- Bekele, G.; Tadesse, G. Feasibility study of small Hydro/PV/Wind hybrid system for off-grid rural electrification in Ethiopia. Appl. Energy 2012, 97, 5–15. [Google Scholar] [CrossRef]
- Bekele, G.; Palm, B. Feasibility study for a standalone solar-wind-based hybrid energy system for application in Ethiopia. Appl. Energy 2010, 87, 487–495. [Google Scholar] [CrossRef]
- Montuori, L.; Alcázar-Ortega, M.; Álvarez Bel, C.; Domijan, A. Integration of renewable energy in microgrids coordinated with demand response resources: Economic evaluation of a biomass gasification plant by Homer Simulator. Appl. Energy 2014, 132, 15–22. [Google Scholar] [CrossRef] [Green Version]
- Hurtado, E.; Peñalvo-López, E.; Ángel, P.-N.; Vargas, C.; Alfonso, D. Optimization of a hybrid renewable system for high feasibility application in non-connected zones. Appl. Energy 2015, 155, 308–314. [Google Scholar] [CrossRef] [Green Version]
- Aagreh, Y.; Al-Ghzawi, A. Feasibility of utilizing renewable energy systems for a small hotel in Ajloun city, Jordan. Appl. Energy 2013, 103, 25–31. [Google Scholar] [CrossRef]
- Luna-Rubio, R.; Trejo-Perea, M.; Vargas-Vázquez, D.; Ríos-Moreno, G.J. Optimal sizing of renewable hybrids energy systems: A review of methodologies. Sol. Energy 2012, 86, 1077–1088. [Google Scholar] [CrossRef]
- Xiao, J.; Bai, L.; Li, F.; Liang, H.; Wang, C. Sizing of Energy Storage and Diesel Generators in an Isolated Microgrid Using Discrete Fourier Transform (DFT). IEEE Trans. Sustain. Energy 2014, 5, 907–916. [Google Scholar] [CrossRef]
- Atia, R.; Yamada, N. Sizing and Analysis of Renewable Energy and Battery Systems in Residential Microgrids. IEEE Trans. Smart Grid 2016, 7, 1204–1213. [Google Scholar] [CrossRef]
- Diaf, S.; Diaf, D.; Belhamel, M.; Haddadi, M.; Louche, A. A methodology for optimal sizing of autonomous hybrid PV/wind system. Energy Policy 2007, 35, 5708–5718. [Google Scholar] [CrossRef]
- Saito, N.; Niimura, T.; Koyanagi, K.; Yokoyama, R. Trade-off analysis of autonomous microgrid sizing with PV, diesel, and battery storage. In Proceedings of the 2009 IEEE Power & Energy Society General Meeting, Calgary, AB, Canada, 26–30 July 2009; pp. 1–6. [Google Scholar]
- Karavas, C.S.; Arvanitis, K.G.; Kyriakarakos, G.; Piromalis, D.D.; Papadakis, G. A novel autonomous PV powered desalination system based on a DC microgrid concept incorporating short-term energy storage. Sol. Energy 2018, 159, 947–961. [Google Scholar] [CrossRef]
- Wang, X.; Wang, C.; Xu, T.; Guo, L.; Li, P.; Yu, L.; Meng, H. Optimal voltage regulation for distribution networks with multi-microgrids. Appl. Energy 2018, 210, 1027–1036. [Google Scholar] [CrossRef]
- Hu, M.; Weir, J.D.; Wua, T. Decentralized operation strategies for an integrated building energy system using a memetic algorithm. Eur. J. Oper. Res. 2012, 217, 185–197. [Google Scholar] [CrossRef]
- Hu, M.; Weir, J.D.; Wu, T. An augmented multi-objective particle swarm optimizer for building cluster operation decisions. Appl. Soft Comput. 2014, 25, 347–359. [Google Scholar] [CrossRef]
- Nikmehr, N.; Najafi-Ravadanegh, S.; Khodaei, A. Probabilistic optimal scheduling of networked microgrids considering time-based demand response programs under uncertainty. Appl. Energy 2017, 198. [Google Scholar] [CrossRef]
- Lv, T.; Qian, A. Interactive energy management of networked microgrids-based active distribution system considering large-scale integration of renewable energy resources. Appl. Energy 2016, 163, 408–422. [Google Scholar] [CrossRef]
- Ouammi, A.; Dagdougui, H.; Dessaint, L.; Sacile, R. Coordinated Model Predictive-Based Power Flows Control in a Cooperative Network of Smart Microgrids. IEEE Trans. Smart Grid 2015, 6, 2233–2244. [Google Scholar] [CrossRef]
- Nikmehr, N.; Ravadanegh, S.N. Optimal Power Dispatch of Multi-Microgrids at Future Smart Distribution Grids. IEEE Trans. Smart Grid 2015, 6, 1648–1657. [Google Scholar] [CrossRef]
- Haddadian, H.; Noroozian, R. Multi-microgrids approach for design and operation of future distribution networks based on novel technical indices. Appl. Energy 2017, 185, 650–663. [Google Scholar] [CrossRef]
- Kou, P.; Liang, D.; Gao, L. Distributed EMPC of multiple microgrids for coordinated stochastic energy management. Appl. Energy 2017, 185, 939–952. [Google Scholar] [CrossRef]
- Karavas, C.S.; Kyriakarakos, G.; Arvanitis, K.G.; Papadakis, G. A multi-agent decentralized energy management system based on distributed intelligence for the design and control of autonomous polygeneration microgrids. Energy Convers. Manag. 2015, 103, 166–179. [Google Scholar] [CrossRef]
- Christos-Spyridon Karavas, K.A.; Papadakis, G. A Game Theory Approach to Multi-Agent Decentralized Energy Management of Autonomous Polygeneration Microgrids. Energies 2017, 11, 1756. [Google Scholar] [CrossRef]
- Zha, J.; Wu, J.; Zhao, D. Changes of probabilities in different wind grades induced by land use and cover change in Eastern China Plain during 1980–2011. Atmos. Sci. Lett. 2016, 17, 264–269. [Google Scholar] [CrossRef]
- Layadi, T.M.; Champenois, G.; Mostefai, M.; Abbes, D. Lifetime estimation tool of lead–acid batteries for hybrid power sources design. Simul. Model. Pract. Theory 2015, 54, 36–48. [Google Scholar] [CrossRef]
- Fathy, A. A reliable methodology based on mine blast optimization algorithm for optimal sizing of hybrid PV-wind-FC system for remote area in Egypt. Renew. Energy 2016, 95, 367–380. [Google Scholar] [CrossRef]
- Borowy, B.S.; Salameh, Z.M. Methodology for optimally sizing the combination of a battery bank and PV array in a Wind/PV hybrid system. IEEE Transa. Energy Convers. 1996, 11, 367–375. [Google Scholar] [CrossRef]
- Nafeh, E.S. Optimal Economical Sizing Of A PV-Wind Hybrid Energy System Using Genetic Algorithm. Int. J. Green Energy 2011, 8, 25–43. [Google Scholar] [CrossRef]
- Ahmadi, S.; Abdi, S. Application of the Hybrid Big Bang–Big Crunch algorithm for optimal sizing of a stand-alone hybrid PV/wind/battery system. Sol. Energy 2016, 134, 366–374. [Google Scholar] [CrossRef]
Figure 1.
Flowchart for the optimal sizing of the two interconnected micro-grids based on collaborative operation.
Figure 1.
Flowchart for the optimal sizing of the two interconnected micro-grids based on collaborative operation.

Figure 2.
Off-grid hybrid PV-WT-BAT micro-grids configuration with tie line.

Figure 3.
The input data for every hour of a year in Yinchuan. (a–c) shows the input data for MG A and (d–f) for MG B.
Figure 3.
The input data for every hour of a year in Yinchuan. (a–c) shows the input data for MG A and (d–f) for MG B.

Figure 4.
Typical wind turbine generator power curve.

Figure 5.
Flowchart of the proposed collaborative operation strategy for the two micro-grids system.
Figure 5.
Flowchart of the proposed collaborative operation strategy for the two micro-grids system.

Figure 6.
Comparison of the total cost obtained under different modes.

Figure 7.
Comparison of the respective cost under different modes.

Figure 8.
Hourly power supplied for MG A.

Figure 9.
Hourly power supplied for MG B.

Figure 10.
The power exchange between interconnected micro-grids.

Figure 11.
Depth of discharge DoD(k) as function of battery cycles.

Figure 12.
Power exchanged between MG A and MG B for a typical day.

Figure 13.
Sensitivity analysis for individual micro-grid cost of various unified electricity trading price.
Figure 13.
Sensitivity analysis for individual micro-grid cost of various unified electricity trading price.

Figure 14.
Cost save for individual micro-grid of various electricity trading price.

Figure 15.
Comparison of cost under independent mode and optimal cost balanced by the transaction price.
Figure 15.
Comparison of cost under independent mode and optimal cost balanced by the transaction price.


Table 1.
Technical data of the components used in proposed model.
| Component | Parameter | Value | Unit |
|---|---|---|---|
| Wind turbine | 5 | kW | |
| 3 | m/s | ||
| 45 | m/s | ||
| 11 | m/s | ||
| 20 | year | ||
| 4.5 | % | ||
| Solar PV | 300 | W | |
| 19 | % | ||
| 20 | year | ||
| 4.5 | % | ||
| Battery | 100 | Ah | |
| 12 | V | ||
| 93/100 | % | ||
| Tie Line | 95 | % | |
| 50 | year | ||
| Others | 100 | % | |
| i | 6 | % | |
| G | 1000 | W/m2 |
Table 2.
The costs related to the components of renewable micro-grids.
| WT | PV | BAT | |
|---|---|---|---|
| (Yuan/unit) | 14,800 | 750 | 650 |
| (Yuan/unit-yr) | 60 | 20 | |
| (Yuan/unit) | 11,500 | 640 | 520 |
Table 3.
Comparison of the total results obtained in different modes.
| LPSP | |||||
|---|---|---|---|---|---|
| Independent mode | |||||
| PV-BAT | 3031 | 544 | 1.8% | ||
| WT-BAT | 81 | 444 | 1.62% | ||
| WT-PV-BAT | 46 | 813 | 311 | 1.61% | |
| Interconnected mode | |||||
| PV-BAT | 2633 | 564 | 94 | 1.66% | |
| WT-BAT | 45 | 388 | 85 | 1.66% | |
| WT-PV-BAT | 45 | 22 | 354 | 81 | 1.76% |
Table 4.
Comparison of the respective installed optimal capacity under different modes.
| LPSP | ||||||
|---|---|---|---|---|---|---|
| Independent mode | ||||||
| PV-BAT | MGA | 1487 | 293 | 1.66% | ||
| MGB | 1544 | 251 | 1.94% | |||
| WT-BAT | MGA | 54 | 245 | 1.53% | ||
| MGB | 27 | 199 | 1.71% | |||
| WT-PV-BAT | MGA | 25 | 633 | 250 | 1.63% | |
| MGB | 21 | 180 | 161 | 1.60% | ||
| Interconnected mode | ||||||
| PV-BAT | MGA | 1612 | 19 | 94 | 1.65% | |
| MGB | 1021 | 545 | 94 | 1.67% | ||
| WT-BAT | MGA | 19 | 183 | 85 | 1.66% | |
| MGB | 26 | 205 | 85 | 1.67% | ||
| WT-PV-BAT | MGA | 19 | 9 | 130 | 81 | 1.74% |
| MGB | 26 | 13 | 224 | 81 | 1.75% |
Table 5.
The power exchanged between MG A and MG B.
| Title 3 | Direct Power Transferred (kW) | Power Stored (kW) | Energy Storage Delivered (kW) |
|---|---|---|---|
| MG A to MG B | 8234.53 | 2779.70 | 41.50 |
| MG B to MG A | 10,895.23 | 8732.39 | 1149.41 |
© 2018 by the authors. Licensee MDPI, Basel, Switzerland. This article is an open access article distributed under the terms and conditions of the Creative Commons Attribution (CC BY) license (http://creativecommons.org/licenses/by/4.0/).
Share and Cite
MDPI and ACS Style
Huang, Y.; Yang, L.; Liu, S.; Wang, G. Cooperation between Two Micro-Grids Considering Power Exchange: An Optimal Sizing Approach Based on Collaborative Operation. Sustainability 2018, 10, 4198. https://doi.org/10.3390/su10114198
AMA Style
Huang Y, Yang L, Liu S, Wang G. Cooperation between Two Micro-Grids Considering Power Exchange: An Optimal Sizing Approach Based on Collaborative Operation. Sustainability. 2018; 10(11):4198. https://doi.org/10.3390/su10114198
Chicago/Turabian StyleHuang, Yuansheng, Lei Yang, Shijian Liu, and Guangli Wang. 2018. "Cooperation between Two Micro-Grids Considering Power Exchange: An Optimal Sizing Approach Based on Collaborative Operation" Sustainability 10, no. 11: 4198. https://doi.org/10.3390/su10114198
Note that from the first issue of 2016, this journal uses article numbers instead of page numbers. See further details here.