Different Ways to Access Knowledge for Sustainability-Oriented Innovation. The Effect of Foreign Direct Investment


Spanish and International Economics Department, Econometrics and History and Economic Institutions, Castilla-La Mancha University (UCLM), 02071 Albacete, Spain
*
Authors to whom correspondence should be addressed.
Sustainability 2018, 10(11), 4206; https://doi.org/10.3390/su10114206
Submission received: 5 October 2018
/
Revised: 7 November 2018
/
Accepted: 8 November 2018
/
Published: 14 November 2018
(This article belongs to the Collection Firm Size and Sustainable Innovation Management)
Abstract
:Sustainability-oriented innovation (SOI), which displays an intention to develop a product or service that contributes to economic, environmental, and social sustainability, has drawn growing institutional and academic attention, due to the general consideration that innovation is an essential part of achieving sustainability. For developments of this nature, it is considered that foreign direct investment (FDI) helps companies to meet the requirements demanded by SOI, however, they show different cooperation patterns, and so it is not known what path they must take to achieve it. In this context, this paper uses comparative analysis to try to shed light on the possible differences in the paths taken to achieve SOI by companies with and without FDI, taking into account their different form of knowledge management. To achieve this objective, it has been necessary to build new sustainability indicators (economic, environmental, and social) that allow the evaluation of the sustainability of these processes, considering the sustainability objectives that guided companies towards innovation. Using a logit model for 5897 Spanish companies during the period 2009–2014, this paper contributes both theoretically and empirically to emerging research into the opening of sustainable innovation. It provides a better understanding of the different channels for accessing knowledge for SOI, and examining these channels through absorptive capacity and cooperation, according to its age and size.
1. Introduction
The literature widely expounds the idea that innovation can be driven by sustainability. However, such innovation has great complexity, due to its increased sophistication in learning and innovation networks [1]. This poses a challenge that companies cannot rise to by themselves, making it imperative they search for knowledge beyond their borders [2].
Sustainability-oriented innovation (SOI) has become an information- and learning-related challenge [3]. This implies that companies with efficient knowledge management processes see these innovations being pushed forward [4], as they have the ability to identify and access the knowledge needed to frame the innovations within the principles of sustainability [5], thanks to their skills, specialist staff, or because they can import specialized knowledge [6].
Current literature, therefore, focuses on understanding how companies expand and exploit their external links in the interest of sustainability, which includes the development of cooperation with external partners [3]. The diversity of the current channels to achieving sustainability creates a need to integrate a large number of actors, but within a sustainable context [7].
Despite this emphasis, the way in which different potential suppliers of knowledge, including providers [8], clients [9], consultants [10], competitors [11], and universities [12], can contribute to SOI, is not clear [13]. In addition, the intrinsic multidimensionality of sustainable goals, as well as their scattered effects on innovation, make assessing innovations, with respect to sustainability, a highly complex task [14]. To gain a full understanding of the complexity of sustainability requires the construction of composite indicators, which enable its evaluation and increase its scope [15].
This paper focuses on understanding how companies expand and exploit their external links in the interest of sustainability, answering the question: are there different ways to access knowledge for SOI? To achieve this goal, we have developed new sustainability indicators (economic, environmental, and social) that enable these processes to be assessed from the perspective of sustainability, considering the sustainability goals that oriented the companies towards innovation, and determining whether or not they influence innovation and whether or not this is enhanced by cooperation with any of the aforementioned knowledge sources.
As has been established, when developing their innovation strategies, companies can rise to the challenge of sustainability, and create a competitive advantage [16]. To do this, they must be capable of meeting a series of requirements demanded by SOI, which include technological and financial capacity, the ability to manage and create alliances and respond to market risk and directional risk, and the absorptive capacity to recognize this as an advantage [17].
In this context, foreign direct investment (FDI) (a company is considered as having FDI, when foreign investment exceeds 10%) can be considered as a driving factor behind sustainable development, through its capacity to influence the wellbeing of societies [18], as it contributes knowledge assets [19], represents a stable and resistant form of financing [20], and leads to benefits in terms of know-how and demand creation [21]. It could also be a good catalyst for domestic investment, complement local resources, and provide confidence [22], which results in an improved image and, in turn, financial intermediation and credit growth [23], generating new employment opportunities and facilitating technology transfer and management capacity [24].
Therefore, having FDI can make these companies more likely to develop this type of innovation [17]. However, companies with FDI differ from their counterparts without it in terms of their capacity to benefit from the different partners in R&D [25]. Given this difference, this paper analyzes how partnerships, in the interest of sustainability, affect these companies differently. With this in mind, this paper attempts to answer the question: how does having FDI affect the pathways for accessing knowledge for SOI?
This comparison is interesting to study, given that there are very few studies that analyze the multiple types of partners for innovation [26]. Furthermore, since the search strategies of companies with FDI are determined by private aims, which orient their activities towards innovation [27], analyzing the influence of multiple partners in SOI means that the lessons learnt from studies on R&D cooperation may need modifying, in order to explain the behavior of both types of company.
This paper hopes to contribute, both theoretically and empirically, to emerging research into sustainable innovation, while also providing a better understanding of the different channels for accessing knowledge for attaining SOI. To do this, we examined these pathways in terms of absorptive capacity and cooperation, according to company age and size, in a comparative analysis between foreign and domestic companies in an intermediate country such as Spain.
The paper is structured as follows, in the next section, corresponding to the second section; the conceptual framework is established through a review of the literature. The third section presents the empirical study. The fourth section shows the results empirically and graphically. The fifth section is a discussion on the main results obtained. The sixth and last section develops the conclusions drawn from the study, as well as future research lines and the paper’s limitations.
2. Theoretical Framework
The belief that companies’ sustainable activities provide profit is increasingly widespread among business managers [28]. However, these activities, as they take into account the environmental and social dimensions, as well as the economic one, entail greater risk [29]. As indicated by Ardito and Dangelico [30], there may be effects of different firm strategic and organizational orientations on several dimensions of sustainable performance. This is why sustainability-oriented innovation must be seen as the direction to follow, and not a final destination [31], thereby inherently leading us to the understanding that a company’s innovative activity should be oriented towards sustainable goals.
Since innovations can be very recent, thereby impeding the assessment of their real impact on sustainable development, we have decided to include, as a key assessment factor, the intention of the company when developing a product or service, which contributes towards environmental and social sustainability. Hence, this paper’s use of the term “sustainability-oriented innovation” or SOI, to refer to new or significantly improved products or services which contribute to economic, environmental, and social sustainability [32].
However, the intrinsic multidimensionality of sustainable goals, as well as their scattered effects on innovation, make assessing innovations, with respect to sustainability, a highly complex task [14]. To gain a full understanding of the complexity of sustainability requires the construction of composite indicators, which enable its evaluation and increase its scope [15].
These sustainable indicators allow us to quantify, analyze, and transmit information in a simple way, optimizing the initial information [33] and informing as to whether this sustainable dimension has been attained. To do this, these indicators must be workable, measurable, relevant, specific and quantitative, and have data availability [34].
The sustainability indicators, constructed in this paper, have been based on a broad literary review classified according to the three impact areas defined by this concept: economic, environmental, and social (see Table 1).
Together with these sustainability indicators, within the evident multidimensionality derived from the concept of sustainable development, learning is key regarding the increase in competition in the sphere of SOI [59]. Learning that fosters sustainability is understood as the application of the value provided by new knowledge and its assimilation [60]. In this regard, there is a recognition of the importance of the involvement of foreign partners, who provide new pathways and knowledge, offering useful learning to successfully establish new foci regarding sustainability.
Along similar lines, diverse studies show a greater propensity to innovate sustainably, thanks to external sources of knowledge and cooperation agreements [61]. The cooperation allows a company to diversify risks, attain costly skills, and reduce development time, even in companies with strong internal R&D activities, and with a high level of human capital [62]. However, there is no consensus on the ideal type of cooperation for achieving each of the dimensions of sustainability (Table 2).
From this literary review, companies with a greater propensity for SOI are those that go beyond their own limits through alliances with stakeholders [68], which implies identifying, exploring, and integrating their viewpoints [2]. Acknowledging that, the companies’ challenge is how to recreate new managerial and organizational capabilities for innovating towards sustainability [69]. However, this requires companies to be in a state of alert [70], and having a high enough absorptive capacity becomes a central skill for SOI [66].
Therefore, internal knowledge will be the source of a company’s absorptive capacity, which will be strengthened by managers through internal R&D and links with external information sources [71]. Consequently, certain studies have involved human capital when it comes to internalizing external knowledge [72], but very few have taken into account the characteristics of this capital empirically [73].
In addition, since absorptive capacity correlates with inputs to the innovative process, the way to isolate its role is by analyzing its moderating function in the impact of external knowledge flows and the results of innovation [65], highlighting it as a complementary factor in the search for this knowledge [74]. Since mere exposure to knowledge is not enough, what is required is to retain, reactivate, and apply it to products and processes [75].
As has been established in the introduction, FDI helps companies to meet the requirements demanded by SOI. In fact, for FDI, the search for economic performance is not the only channel, since environmental and social concerns are also now being addressed [76]. It, therefore, does not only cover investments in physical facilities, but also any activity that is relevant in value creation, such as knowledge attainment [77].
It is considered that FDI seeks out strategies to increase knowledge with the aim of gaining strategic resources for its localization [78]. This means that because of its potential to invest in knowledge [79], its attitude towards cooperation and interest in obtaining external knowledge [80] are technologically different, and also favors an increase in human capital and competition [81].
This strategy leads FDI to search for and develop knowledge assets through diverse channels [82]. However, the extent to which this happens is dependent on the integration of these companies, both internally and externally [83], enabling them to become part of the local innovation system [84].
Thus, the beneficial formation of external links with other companies and institutions in their environment allows companies to be more independent from their corporate group, as well as to be more creative [85]. In this sense, the literature shows that there are different cooperation patterns, in the case of innovation, not oriented by sustainable objectives with respect to national companies, taking into account multinationality, the diversity of partners, the sector, whether it deals with internal or external innovation, the search strategy for external knowledge, and in different settings, such as Spain, Italy, Finland, and the Netherlands (Table 3).
This review shows that the patterns of cooperation differ from one company type to the other as regards innovation, but does not inquire as to whether the intention of companies, when developing innovation, is to contribute or not to economic, environmental, and social sustainability. This intention, to achieve the three sustainable objectives when developing innovation, is what makes the difference between what is considered conventional innovation and sustainability-oriented innovation. To the best of our knowledge, there are no studies that analyze these differences for the case of SOI. We, therefore, believe that a study in this line would be useful, bearing in mind cooperation is affected by the complexity of SOI, since it implies moving away from the current knowledge base [69], and that the cooperation networks are more complex [1].
3. Methodology
3.1. Database and Sample
For the study, data has been used from the Technological Innovation Panel (PITEC), which monitors innovation activities, providing anonymized data for both foreign and national companies located in Spain. The database is managed by Spain’s National Statistics Institute (INE), and responds to the framework of the Community Innovation Survey (CIS), used to find out the level of innovation in the European Union and Norway (for further information on the methodology for producing, see http://www.ine.es/dyngs/INEbase/es/operacion.htm?c=Estadistica_C&cid=1254736176755&menu=resultados&secc=1254736195616&idp=1254735576669).
From the annual data contained in the panel, the period 2009–2014 has been used for this study, which contains constant and standardized information on 5897 companies, i.e., those companies in operation throughout the sample period, and which have consistently either received or not received FDI. To reach this final sample, we undertook an exhaustive transformation and cleansing of data, leaving aside public companies, research associations and institutions [26], and joint enterprises (companies that have alternated years with and without FDI), as well as companies that were not in operation throughout the sample period. The sample companies were, thereby, classified into two groups, companies with foreign investment (FDI) and without it (NFDI).
This database has certain characteristics that are significant for the purposes of this paper. Firstly, contrary to other European experiences with CIS, PITEC is designed as a panel survey, in other words, it collects information annually from a stable sample enabling the possibility of observing a specific company at various points in time [88]. Monitoring information on the same companies over time is essential for a moderation analysis. Given that a properly defined mediation model establishes causal relationships between variables, the temporal precedence of causal factors is required [91]. Secondly, being a panel survey, the dataset enabled us to control possible endogeneity issues arising from the omission of non-observable characteristics specific to the company [62]. Thirdly, it allowed us to obtain information on R&D cooperation agreements in which companies participated during the period between t − 2 and t, that is, between the reference year of the survey and the previous two [91]. Lastly, the fact that the survey was not conducted specifically to gather information on sustainability issues avoids the potential bias of companies looking to improve their social image [62].
Finally, the study has been focused on Spain, due to various factors which make it, empirically speaking, the ideal stage for this research. The first is that Spain is one of the countries where R&D investment by foreign companies is especially high [27], revealing a high degree of local integration [26]. Secondly, we are focusing on Spain as a paradigm of an intermediate country [89], so an analysis of companies in Spain can, therefore, help to generalize outcomes for a number of countries which, like Spain, are neither in the vanguard nor lagging behind in technological development [25]. Lastly, the growing importance of sustainable issues makes it an interesting context for researching the dynamics of sustainable innovation [92].
3.2. Specification of the Model
Given that the dependent variable is a dichotomous variable, a binary result model is used that controls the possible selection bias that arises from the exclusion of the analysis of companies that are not innovative. This method has proven to be suitable for estimating real results and more suitable than a Heckman selection model, given that the dependent variable is binary and not continuous [8,93,94].
We, therefore, undertook a binary logistic regression analysis, through block selection, using a forward conditional method for the selection of variables. This gave rise to a hierarchical model, so all the variables and interactions are compiled within the table, which contribute to the model’s overall adjustment, based on the relevance of the Rao score statistic [95].
The likelihood that a company becomes innovative is calculated using a logistic cumulative distribution function, where the conditional probability has the following form:
where the logit model is the logarithm of the odds ratio:
The model expressed in its general form, taking into account the groups of variables that will be analyzed in the study, is the following:
where:
Control.V: Control variables of the model, which are the variables of the Size (Tait) and Antiquity (Abit) of the companies, so .
ISO: Indicators of sustainable objectives that would be expressed in the equation as . These variables are the ones that determine if the companies carry out innovations guided by sustainable objectives.
Coop: Cooperation variables that include six types of partners with which companies can cooperate, their expression being disaggregated in the model .
CA: Variables that define the absorptive capacity of companies in two groups, Human Capital (Peit) and Information Sources (Icit), so that .
Moderating.V: This group is formed by the variables that reflect the moderating effect between the variables of human capital, cooperation, and indicators of sustainable objectives.
Therefore, the Model (3) to estimate in a disaggregated way will be
Lastly, as has already been mentioned, the Equation (4) has been estimated for two groups, FDI and NFDI, based on whether or not the company has foreign direct investment, respectively (this division has been made taking into account the content of the “company type” question, which forms the PITEC base). We will, therefore, have different equations depending on the groups considered above:
3.3. Identification, Measurement, and Relationship of the Variables
This section presents the definitions and measurements of the variables for this study. For more information see Appendix A.
3.3.1. Sustainability-Oriented Innovations (SOI)
The “internal innovation” (R + D + iit) is the dependent variable of the model, measured as a dichotomous variable, which includes the value 1, which indicates whether the company “i” has systematically carried out creative works with the objective of developing new products (goods/services) and new, or significantly improved, processes at the time “t”.
If such innovation has been guided by sustainable goals, we can say that it is an SOI [13]. This is why we have incorporated “indicators of sustainable objectives” (ISOfit) as an explanatory variable, which includes economic, environmental, and social sustainability.
These indicators of sustainable objectives have been developed based on a principal component analysis. This aims to reduce the volume of data and maintain the variation of the initial dataset, hence, its transformation into a new set of variables, which are uncorrelated and classified in such a way that the first conserves most of the variation of the rest of the original variables [96]. The results of this technique are often expressed in terms of scores of components and loadings [97]. It also reduces the risk of double weighting [98], making it an appropriate technique for developing sustainability indicators [56].
The reliability of the scale was demonstrated by calculating its Cronbach’s alpha, which gave the validity and reliability results presented in Appendix B. The result of the factor analysis supports the validity of the three subconstructions for both groups (economic, environmental, and social sustainability) given that the aforementioned amount of variance exceeded 50%, and the weighting factors of all the items in each scale exceeded 0.5 [99].
3.3.2. Cooperation
The model uses information on active cooperation in innovation with external partners. The explanatory variables (Cdit) include cooperation for the innovation of company “i” with different partners “d” at the temporary moment “t”. This cooperation consists in the active participation with other companies from the group, providers, clients, competitors, consultants, universities, and research centers, in activities of innovation. The two parties do not necessarily obtain commercial profit. Simply subcontracting work without active cooperation was excluded [8].
3.3.3. Absorptive Capacity
Given the multidimensional nature of knowledge, we needed to distinguish between two types: one for establishing a company’s capacity to assess external information, and a second for assessing its capacity to use it. The first entails relatively simple knowledge while the second implies complex and abstract knowledge [100].
We considered the two aforementioned types of absorptive capacity: the first allows a company to scan their immediate environment for knowledge, for which we used the responses on the importance of external information sources for innovation. These sources, contained within the “information sources” (Icit) variable, include clients, providers, competitors, universities, consultants, commercial laboratories, or private R&D institutes, within a company or group of companies, departments, employees, etc. [101,102].
As a proxy for the second type of absorptive capacity, the (Peit) variables are used, which collect, by quartiles, the percentage of human capital with higher education that the company “i” has at a given moment “t”. Having this kind of employee increases a company’s ability to absorb and apply new knowledge in their innovation processes. In addition, it facilitates the exchange of knowledge within the organization and offers a greater capacity to find, integrate, and use new tacit knowledge [91,103].
The reason for dividing the human capital with higher education variable into quartiles is that this allowed us to better observe the different knowledge needs that are required by companies to cooperate in innovation with their various partners which, in turn, provide skills and different capacities [74].
Given that human capital, through training and experience, can be improved and, therefore, have a greater capacity to absorb and use new sources of knowledge [71], we postulated that the employees of companies with FDI, being highly qualified [85] and having to develop multicultural skills and interact across borders, will develop a greater absorptive capacity [104], which will give them a greater propensity for SOI.
3.3.4. Moderating Variables
In Model (4), we tried to check the moderator role of the “staff” (Peit) and “cooperation” (Cdit) variables in the development of SOI. A moderation hypothesis attempts to determine under what conditions a relationship becomes stronger, weaker, disappears, or changes direction. A moderating variable is a qualitative or quantitative variable that affects the magnitude and/or direction of a relationship between an independent or predictor variable and a dependent variable or criterion. The moderating effects are also called interaction effects.
Moderating variables have been introduced to verify the following hypotheses:
Hypothesis 1 (H1).
Thanks to having qualified human capital, can the assimilation and exploitation of companies’ external sources be improved, in such a way that those that have enough will be able to efficiently manage said sources?
In this paper, this is reflected in the use of these employees in cooperation with different partners. To assess this, we included a product term between the “cooperation” (Cdit) and “staff” (Peit) variables, which encompass qualified human capital used as a proxy for the second type of absorptive capacity [102].
Companies face an important challenge in the development of SOI, since sustainability must be understood and integrated into the innovative process [2]. In this context,
Hypothesis 2 (H2).
Can staff training play a key role in guaranteeing the skills for this?
The assessment for this is carried out through a product term between the variables “indicators of sustainable objectives” and “staff” (Peit*ISOfit).
Given that the literature places the emphasis on knowing how companies expand and exploit their external links as regards sustainability through cooperation with external collaborators [3],
Hypothesis 3 (H3).
Can cooperation with each of the potential partners affect the different sustainable areas?
The paper measures how cooperation with each of the potential partners can affect the different sustainable areas through the product of the “cooperation” variable and the “indicators of sustainable objectives” variable (Cdit*ISOfit). This, therefore, implies that a diverse range of paths can be taken to achieve this [7].
Learning is key to increasing skills in the area of SOI, understanding it as the assimilation and application of acquired knowledge, so that not only will the participation of external partners be required, which provide new paths and knowledge structures but, also, human capital with some kind of higher education, to assimilate and apply new knowledge in a company’s innovation processes [59,60,91,101]. In this regard,
Hypothesis 4 (H4).
What kind of learning will enhance sustainable objectives?
Hence, we introduced the product of the variables “cooperation”, “staff”, and “indicators of sustainable objectives” (Cdit*ISOfit*Peit).
3.3.5. Control Variables
The following control variables were included in this paper. Firstly, we controlled the company “size” (Sait) variable, in which we distinguish between large companies and SMEs [105].
This division is important because, despite as SMEs are recognized as being key for sustainable development, their research tends to focus more on environmental issues than SOI. In addition, these often have a lack of resources, a situation that acts as an incentive for them to cooperate with others. In this sense, there are studies that find an inverse relationship between firm size and a proven commitment to sustainability ideals [106].
However, few studies explore the role that the different partners play in contributing knowledge for achieving SOI [61]. Studying the strategies of these businesses can provide a better understanding of the tensions between firm size and sustainability goals [107].
For its part, there is ample evidence to indicate that large companies increase opportunities for innovation, as they have more extensive resource bases [4] and have the internal capacities needed to participate in R&D alliances [103].
Secondly, we controlled “age” (Abit), which, like “size”, is widely used as a control variable in studies of this nature. The company’s age can have an influence, given that having more experience probably means a greater accumulation of knowledge, but can also become a source for generating inertia, which enables adaptation, as well as the introduction of new developments in products and processes [108]. It seems that older companies are better, or that they currently place more emphasis on the integration of sustainability issues [2].
4. Result
Table 4 (for more information, see Appendix C) shows the results obtained from the binary logistic regression for the two compared groups, FDI vs NFDI, considering their size, thereby allowing us to carry out a comparative analysis and study the shared and disparate effects which result from this. Four possible scenarios of how companies can achieve SOI were found (for the comparison between variables, we need to look at the difference in the odds ratio. The odds of the event is the probability it will occur divided by the probability that it will not. It is, therefore, interpreted as a ratio, i.e., the number of times that something could happen over the times it might not happen).
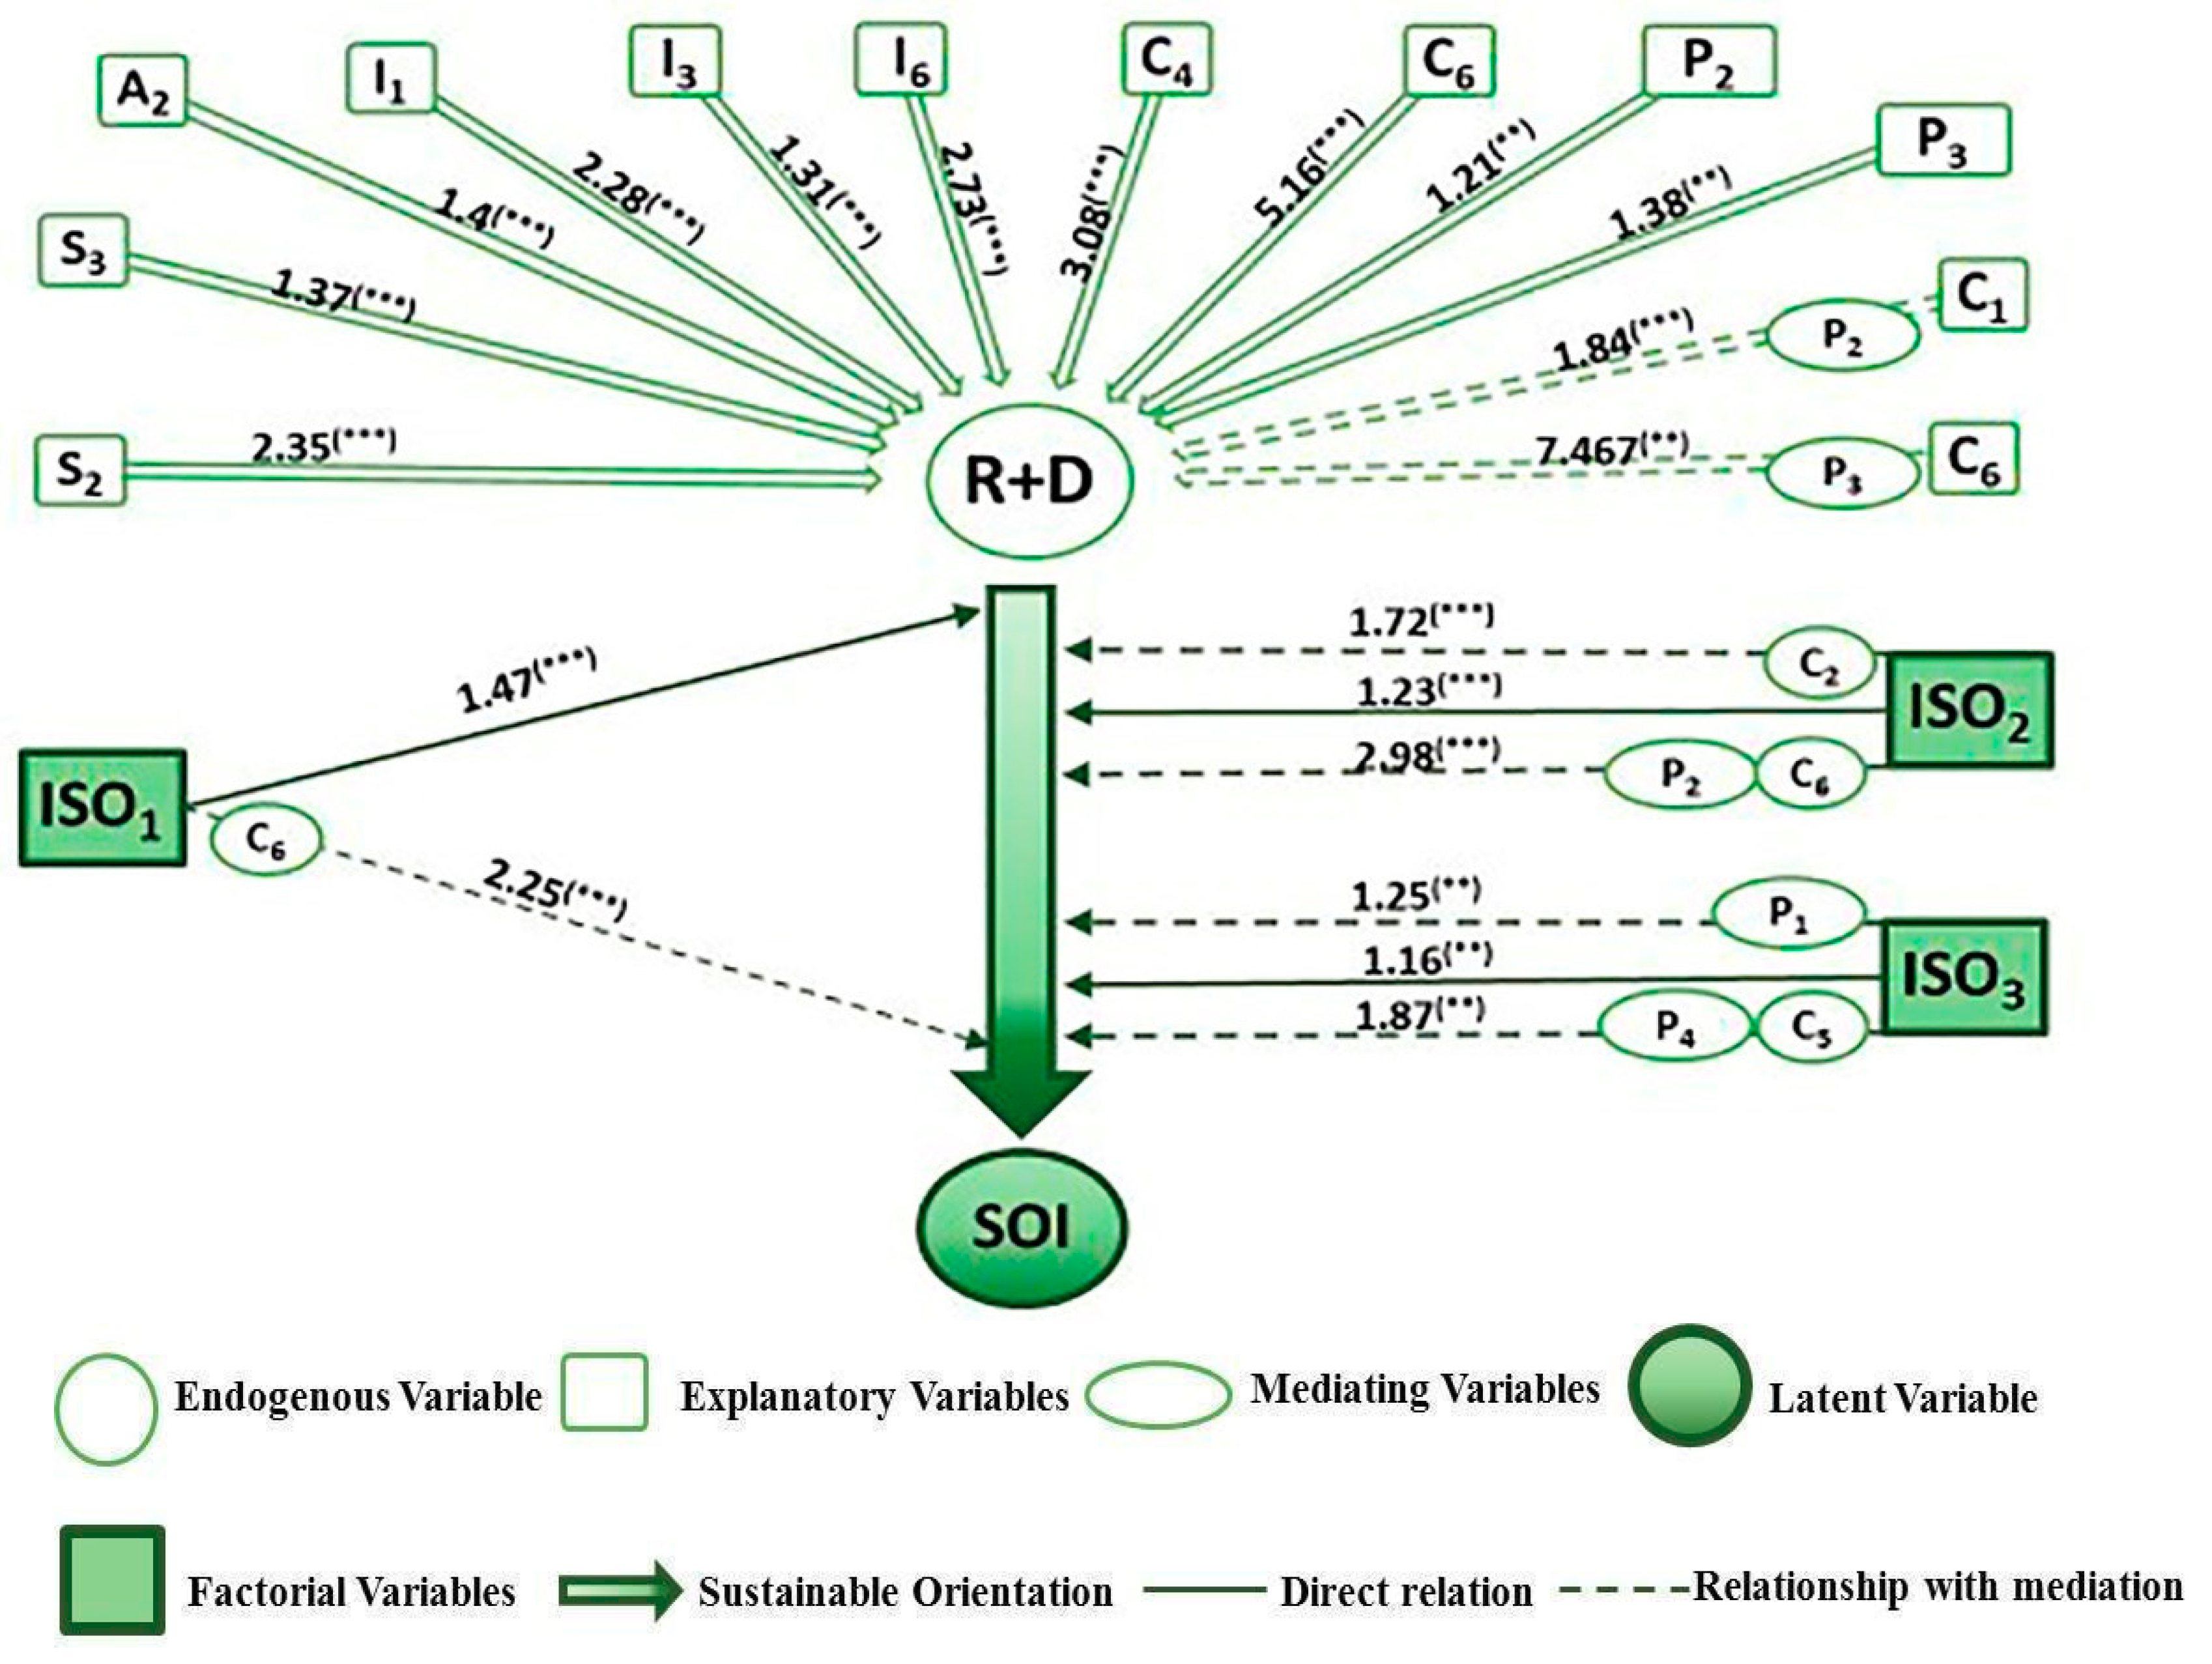
Analyzing the results, we can see that, across the board, there is a series of direct and indirect relationships when it comes to incentivizing innovation, which is oriented towards sustainability through its goals. These relationships for SMEs with FDI are represented in Figure 1.
Figure 1 shows that, although being of a medium-size, Company (S3) increases the possibilities for innovation, and this grows by 98% when it has a size corresponding to between 10 and 50 employees (S2) (difference between odds ratio S2 and odds ratio S3), this being influenced by companies aged between 5 and 15 years old (A2), as the other (Abit) variables are not significant.
These SMEs will be more innovative if they have information which is from universities (I6), internal (I1), and from the client (I3), this being the order based on their odds ratios (2.73 > 2.28 > 1.31). With regard to the integration of stakeholders, we can observe how the cooperation (C6) with competitors and universities (C4) increases innovation.
The significance of the products (C6*P3) and (C1*P2) suggests that there is better assimilation and exploitation both of cooperation with universities (C6) and internal cooperation (C1), thanks to qualified staff. This improvement is more than double for the case of universities, but requires between 50% and 75% qualified staff (P3). If there is 25–50%, qualified staff (P2), there will be an improvement due to internal cooperation, which will increase the possibilities of innovation by 84%.
SMEs that orient their innovation goals towards sustainability have a greater propensity to innovate, demonstrated by the significance of all the goals (ISO1, ISO2, ISO3). However, we do see that the influence of these goals on the innovative process, aside from being direct, can be moderate.
The moderator effect of cooperation with universities (C6*ISO1) and providers (C2*ISO2) indicates that these links will enhance the effect of economic and environmental sustainability, specifically increasing innovation by 78% and 49%, respectively.
The moderator effect of staff (P1*ISO3) establishes that with less than 25% qualified staff, there will be sufficient skills to understand and efficiently integrate social sustainability, increasing innovation by 9%.
Lastly, moderation as a whole, between cooperation with universities and qualified staff (C6*P2*ISO2), reflects the fact that university participation can improve the effect of environmental sustainability, but requires between 25% and 50% qualified staff, which will enable the newly acquired knowledge to be applied to innovation, increasing this by 175%. Equally, cooperation with consultants and qualified staff (C5*P4*ISO3) reflects the fact that the participation of these can improve the effect of social sustainability, but requires more than 75% qualified staff, which allows newly acquired knowledge to be applied to innovation, increasing this by 71%.
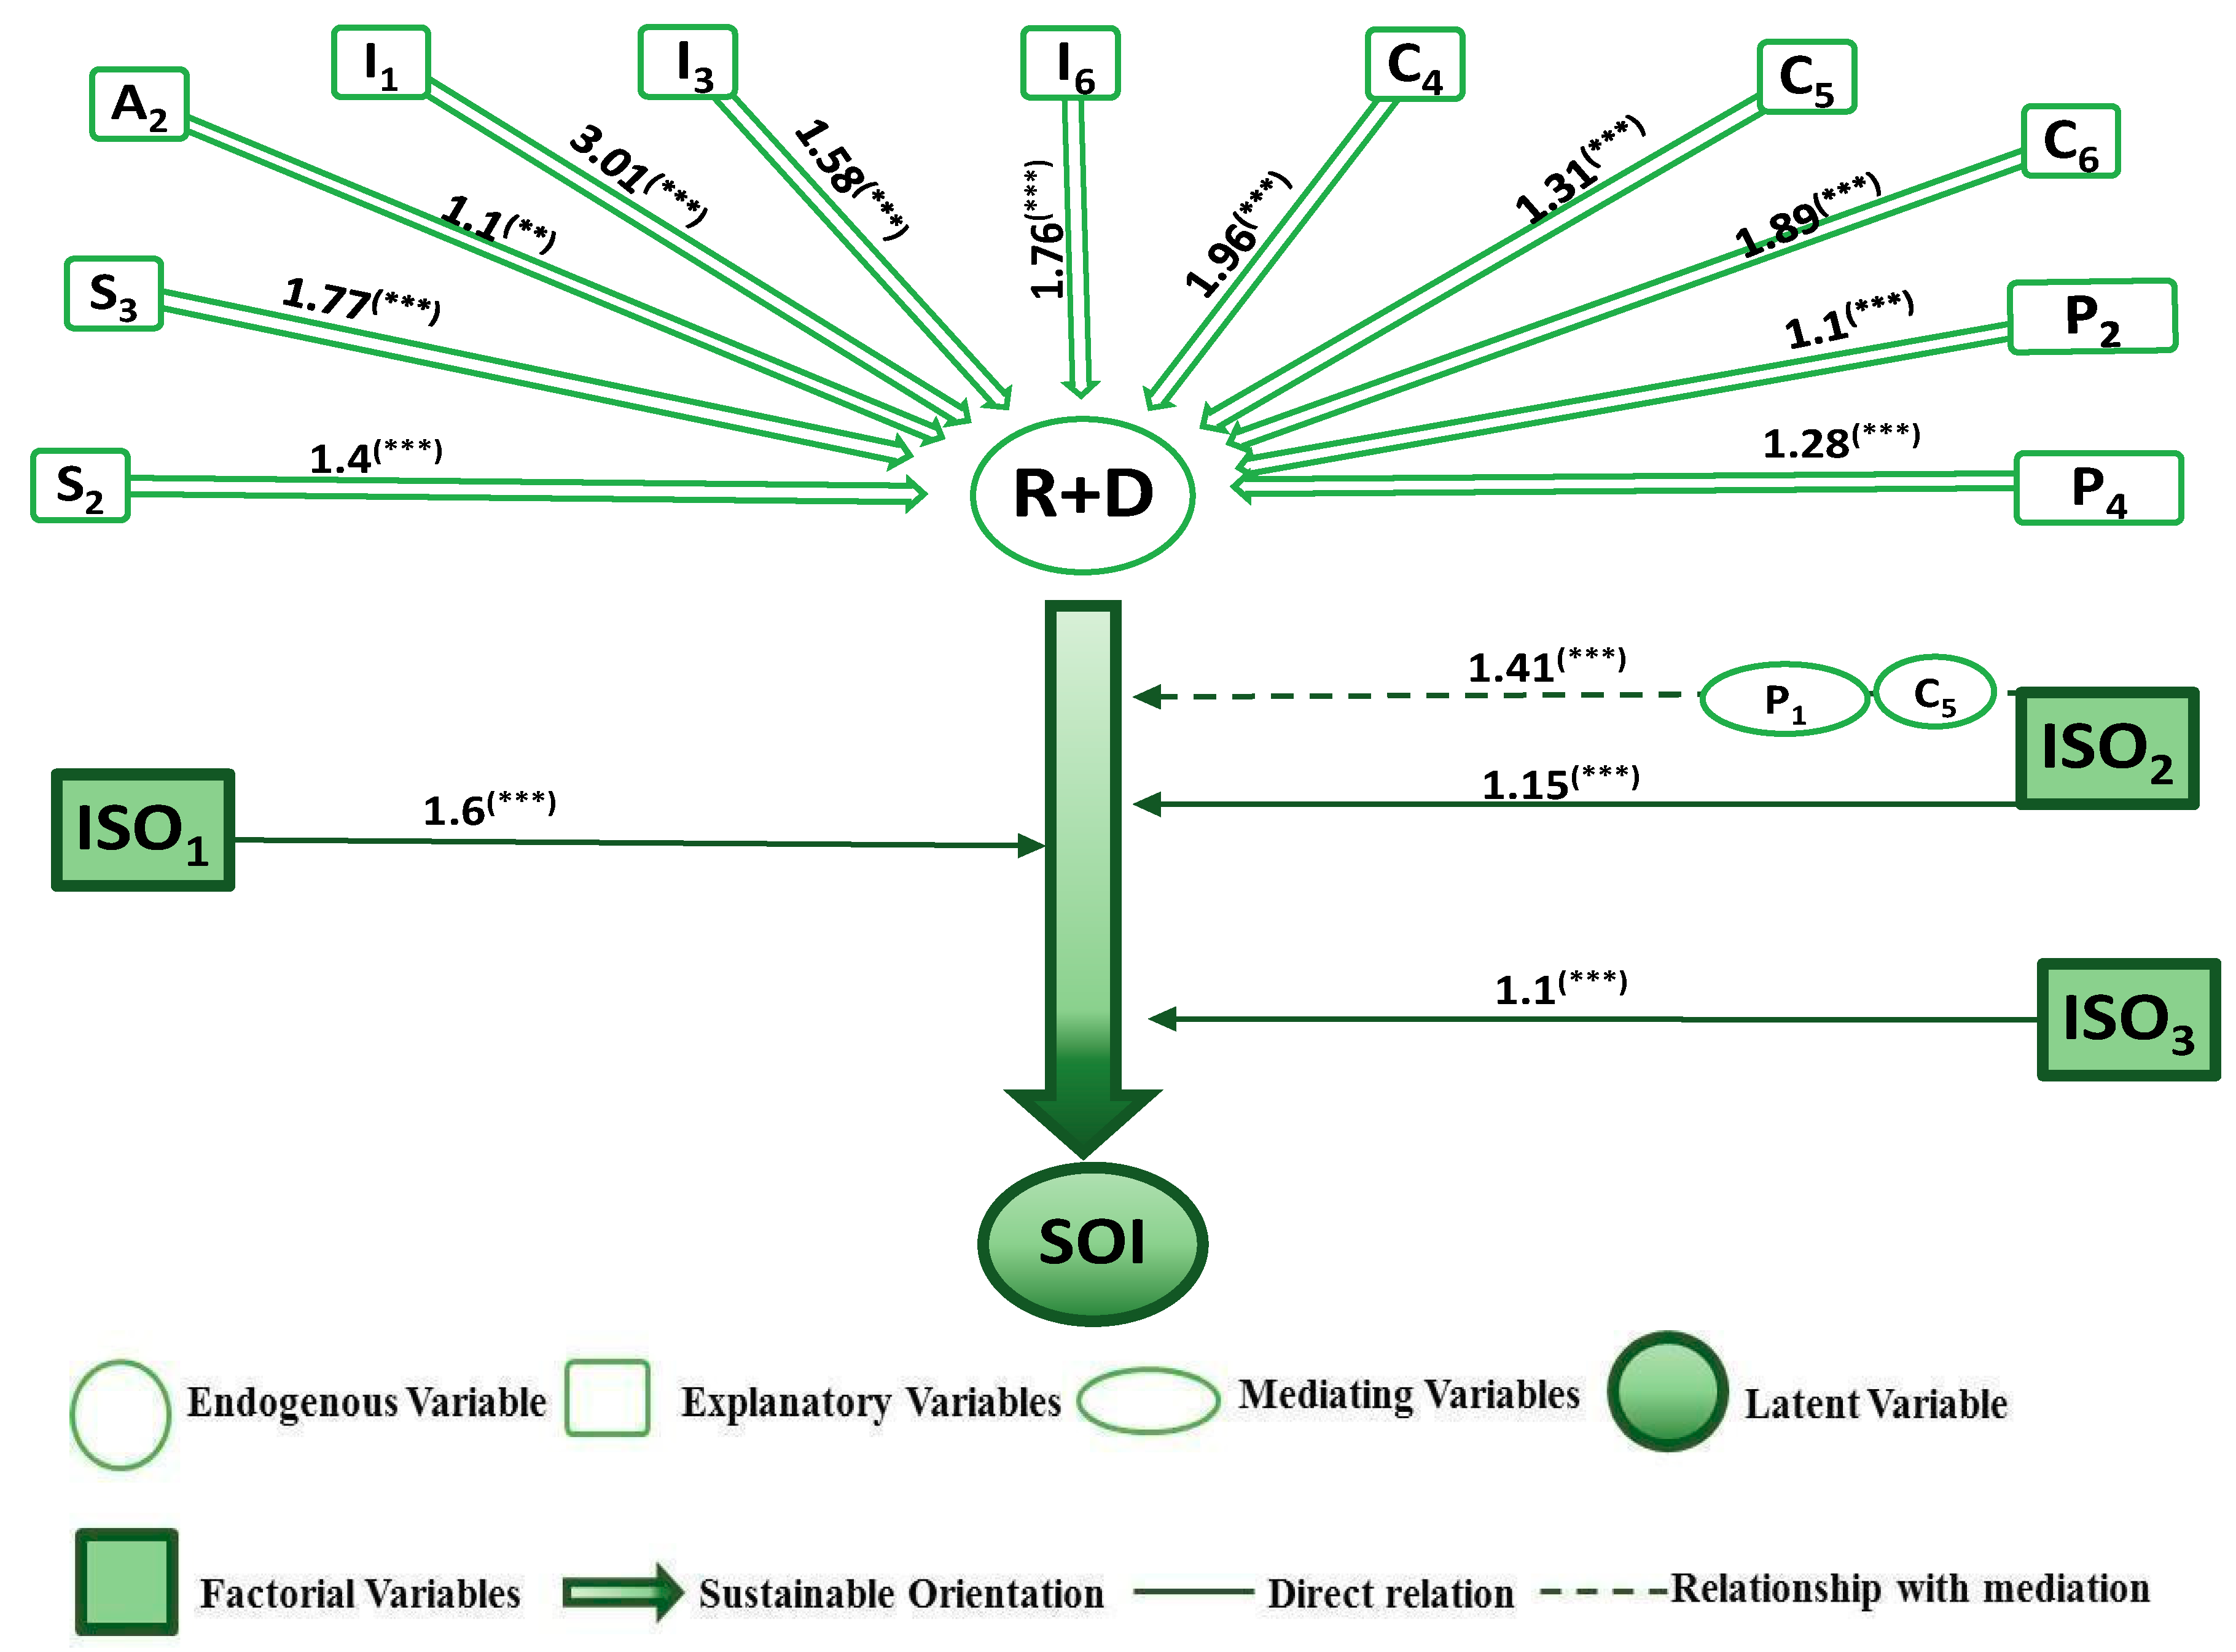
Figure 2 compares these results with those corresponding to NFDI SMEs.
The first difference we can observe is that which relates to size. In contrast to the previous case, although being a small company (S2) increases the possibilities of innovation, these increase by 37% when the company employs between 50 and 250 workers (S3) (difference between odds ratio S3 and odds ratio S2). There is a shared trait, however, in that both are influenced by age, within the 5-to-15-year range (A2), as the rest of the (Abit) variables are not significant.
These SMEs, like their counterparts, will be more innovative if they have information that is internal (I1), and from universities (I6) and clients (I3), however, the order has been modified, with an emphasis placed on the importance of information derived from companies of the group, department, etc. As regards the integration of stakeholders, we can observe how cooperation with competitors (C4) and universities (C6) increases innovations as it did with the previous SMEs, and there is now cooperation with consultants (C5).
However, despite there being a direct influence of the absorptive capacity on two ranges, one from 25–50% (P2) and the other from 75–100% (P4), there is no moderator effect with cooperation that motivates innovation.
In this scenario, the NFDI SMEs that orient the goals of their innovation towards sustainability are more inclined to innovate, as indicated by the significance of all the goals (ISO1, ISO2, ISO3), as happened in the previous case. The difference can be seen in the effect of these goals, which is direct, and is only strengthened indirectly in the case of environmental sustainability goals (ISO2).
Moderation as a whole, therefore, between cooperation with consultants and staff (C5*P1*ISO2) reflects the idea that participation of this nature can lead to improvements in the effect of environmental sustainability, but this requires less than 25% qualified staff, which will enable newly acquired knowledge to be applied to innovation, increasing this by 26%.
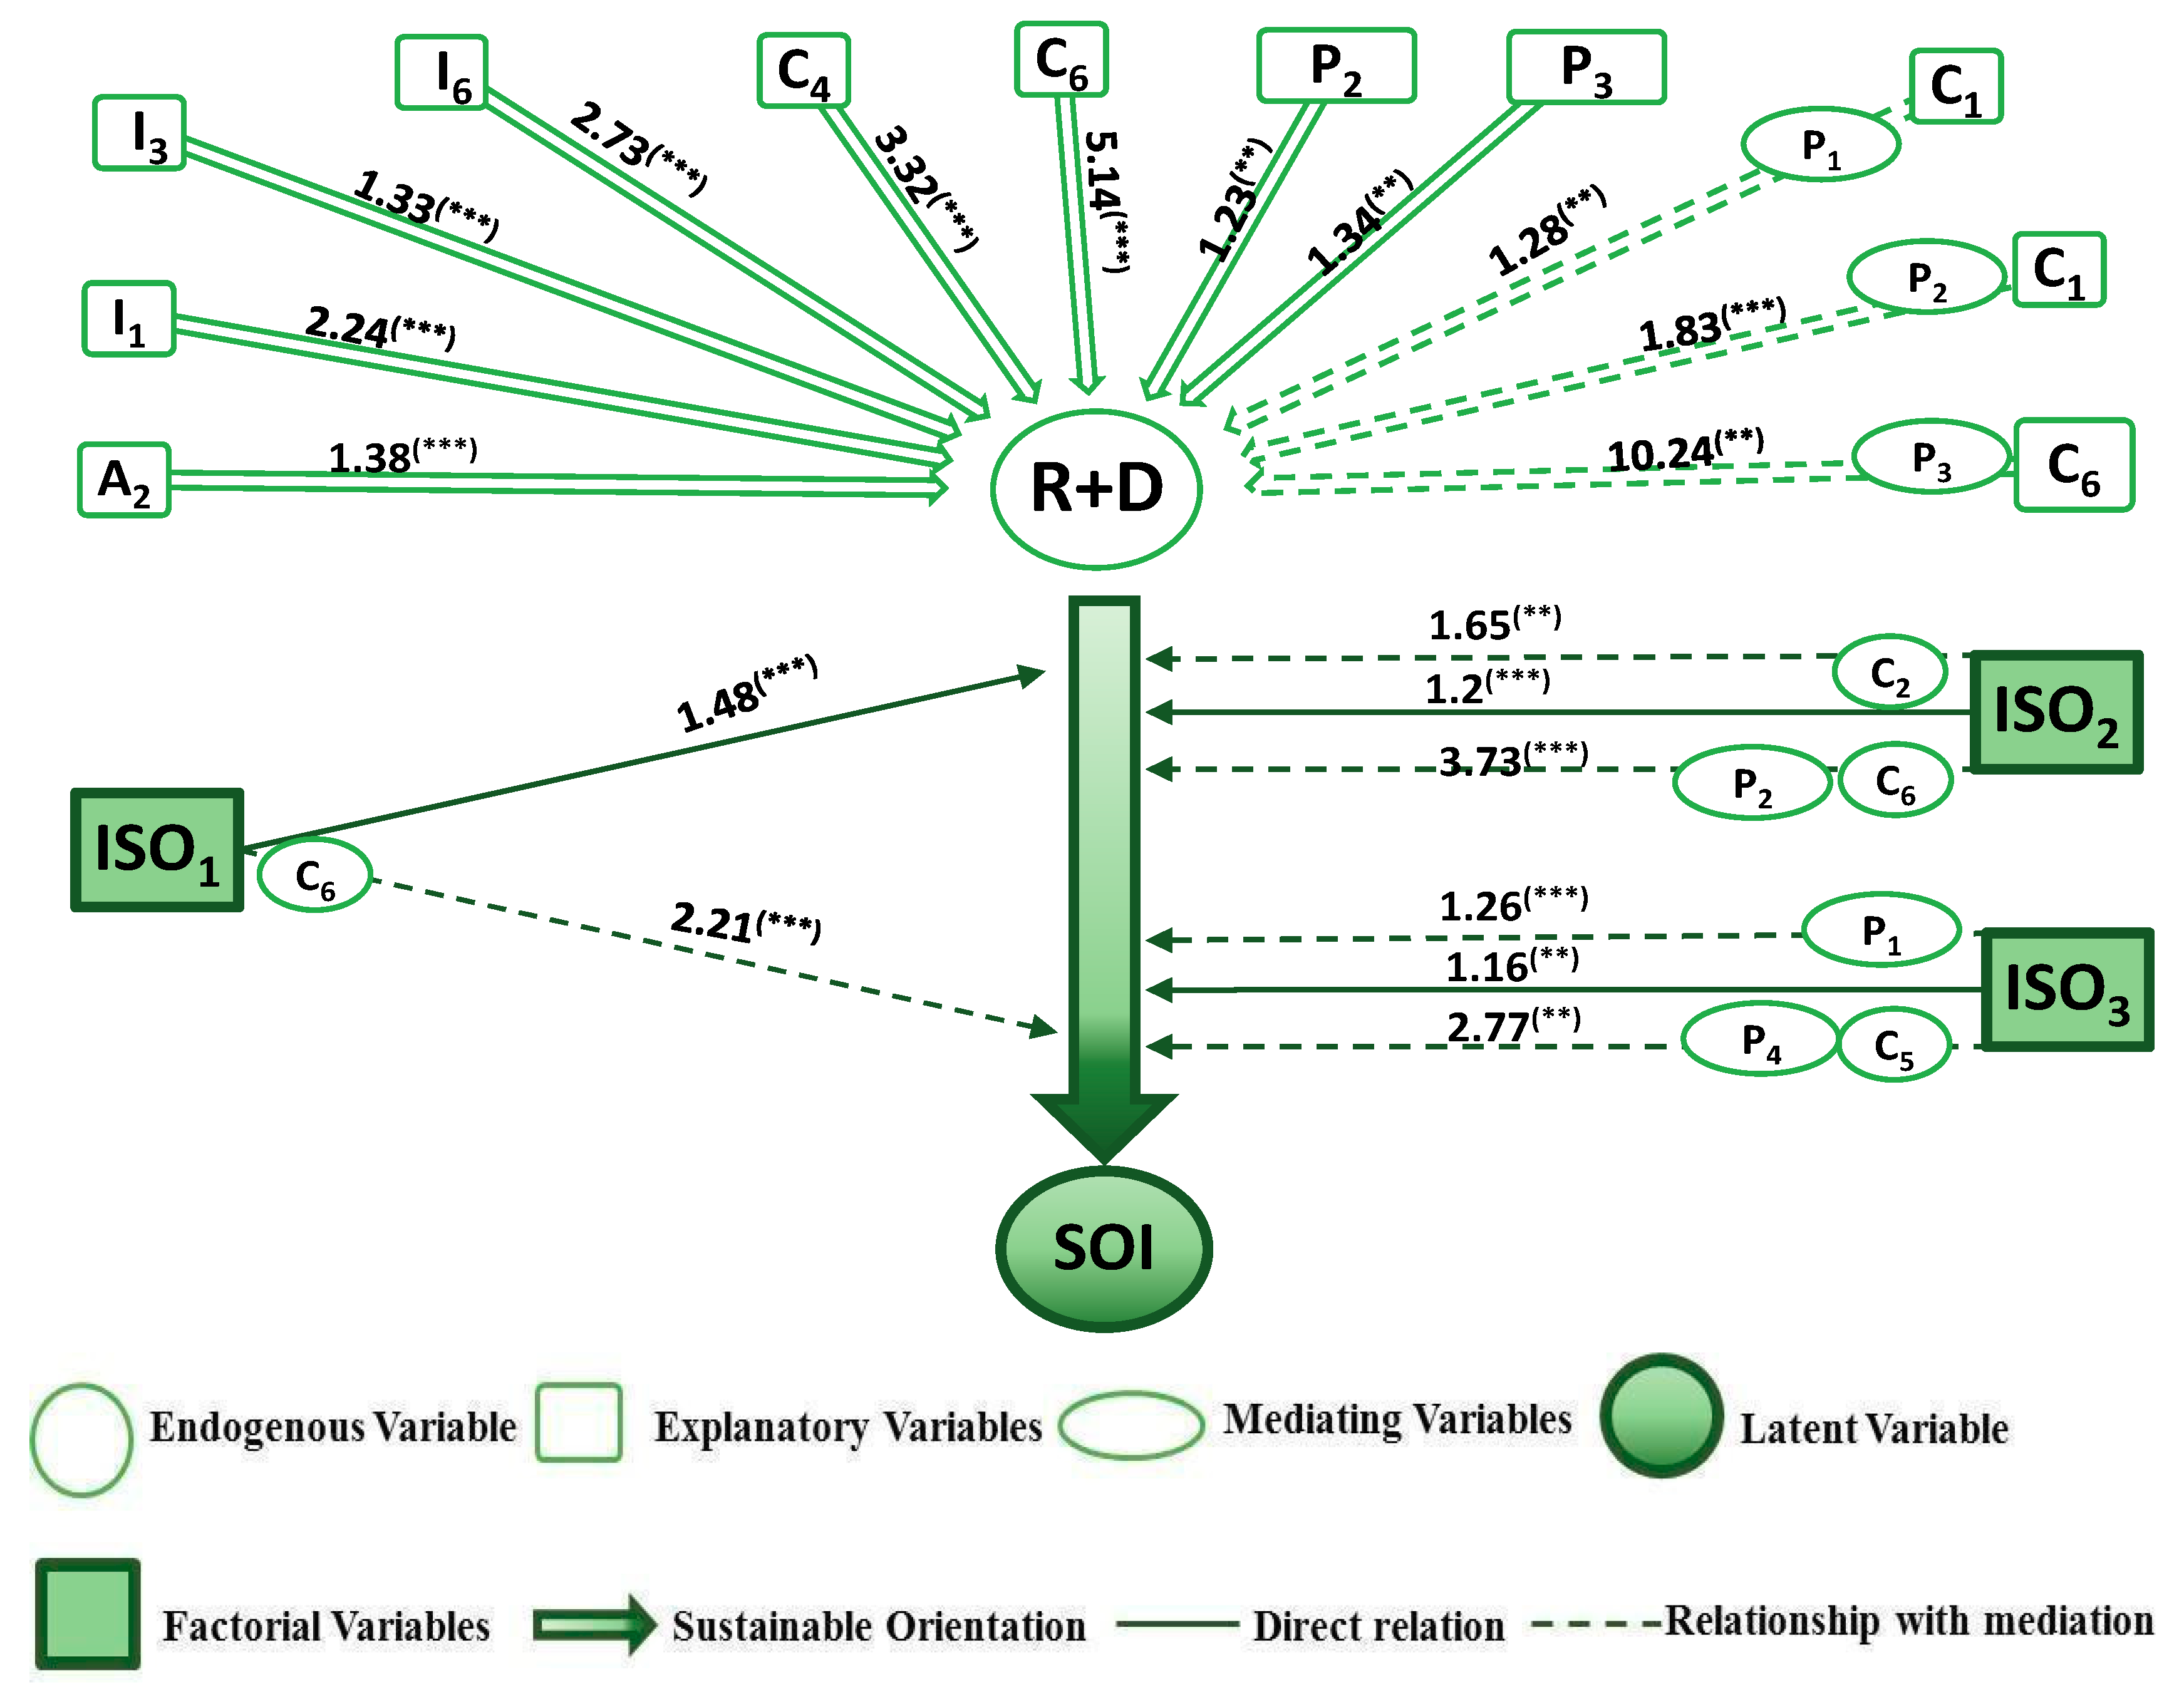
The results for the large companies in both groups do not differ to those of the SMEs, except in the probability of certain relationships, as can be seen below, Figure 3.
What can be seen first, in Figure 3, is that there is no S4 variable, because, as can be observed in Table 4, this variable is significant but negative, indicating that, within this group, the companies with the fewest employees are the most innovative. On the other hand, as in the two previous cases, innovation continues to be influenced by the age of those between 5 and 15 years (A2), since the rest of the (Abit) variables are not significant.
These large companies are more innovative if they have information which is from universities (I6), internal (I1), and from the client (I3), this being the order based on their odds ratios (2.73 > 2.24 > 1.33). With regard to the integration of stakeholders, we can see how cooperation with competitors (C4) and universities (C6) increases innovation.
The significance of the products (C6*P3), (C1*P1), and (C1*P2), indicates that there is better assimilation and exploitation of both cooperation with universities (C6) and internal (C1), thanks to qualified staff. This improvement will more than double in the case of university cooperation, but requires between 50% and 75% of qualified staff (P3). On the other hand, there will be an improvement due to internal cooperation that will increase the possibilities of innovation by 28%, if qualified staff is less than 25% (P1), and of 83% if qualified staff amounts to more than 25% and less 50%.
Large companies that orient their innovation goals towards sustainability have a greater tendency to innovate, which can be seen in the significance of all their goals (ISO1, ISO2, ISO3). However, we do see that the influence of these goals on the innovative process, aside from being direct, can be moderate.
The moderator effect of cooperation with universities (C6*ISO1) and providers (C2*ISO2), indicates that these links will enhance the effect of economic and environmental sustainability, specifically increasing innovation by 73% and 45%, respectively.
The moderator effect of staff (P1*ISO3), establishes that with less than 25% qualified staff, there will be sufficient skills to understand and efficiently integrate social sustainability, increasing innovation by 10%.
Lastly, moderation as a whole, between cooperation with universities and qualified staff (C6*P2*ISO2), reflects the fact that participation of universities can improve the effect of environmental sustainability, but requires between 25–50% qualified staff, which will enable the newly acquired knowledge to be applied to innovation, increasing this by 253%. Equally, cooperation with consultants and qualified staff (C5*P4*ISO3) reflects the fact that the participation of these can improve the effect of social sustainability, but requires more than 75% qualified staff, which allows newly acquired knowledge to be applied to innovation, increasing this by 161%.
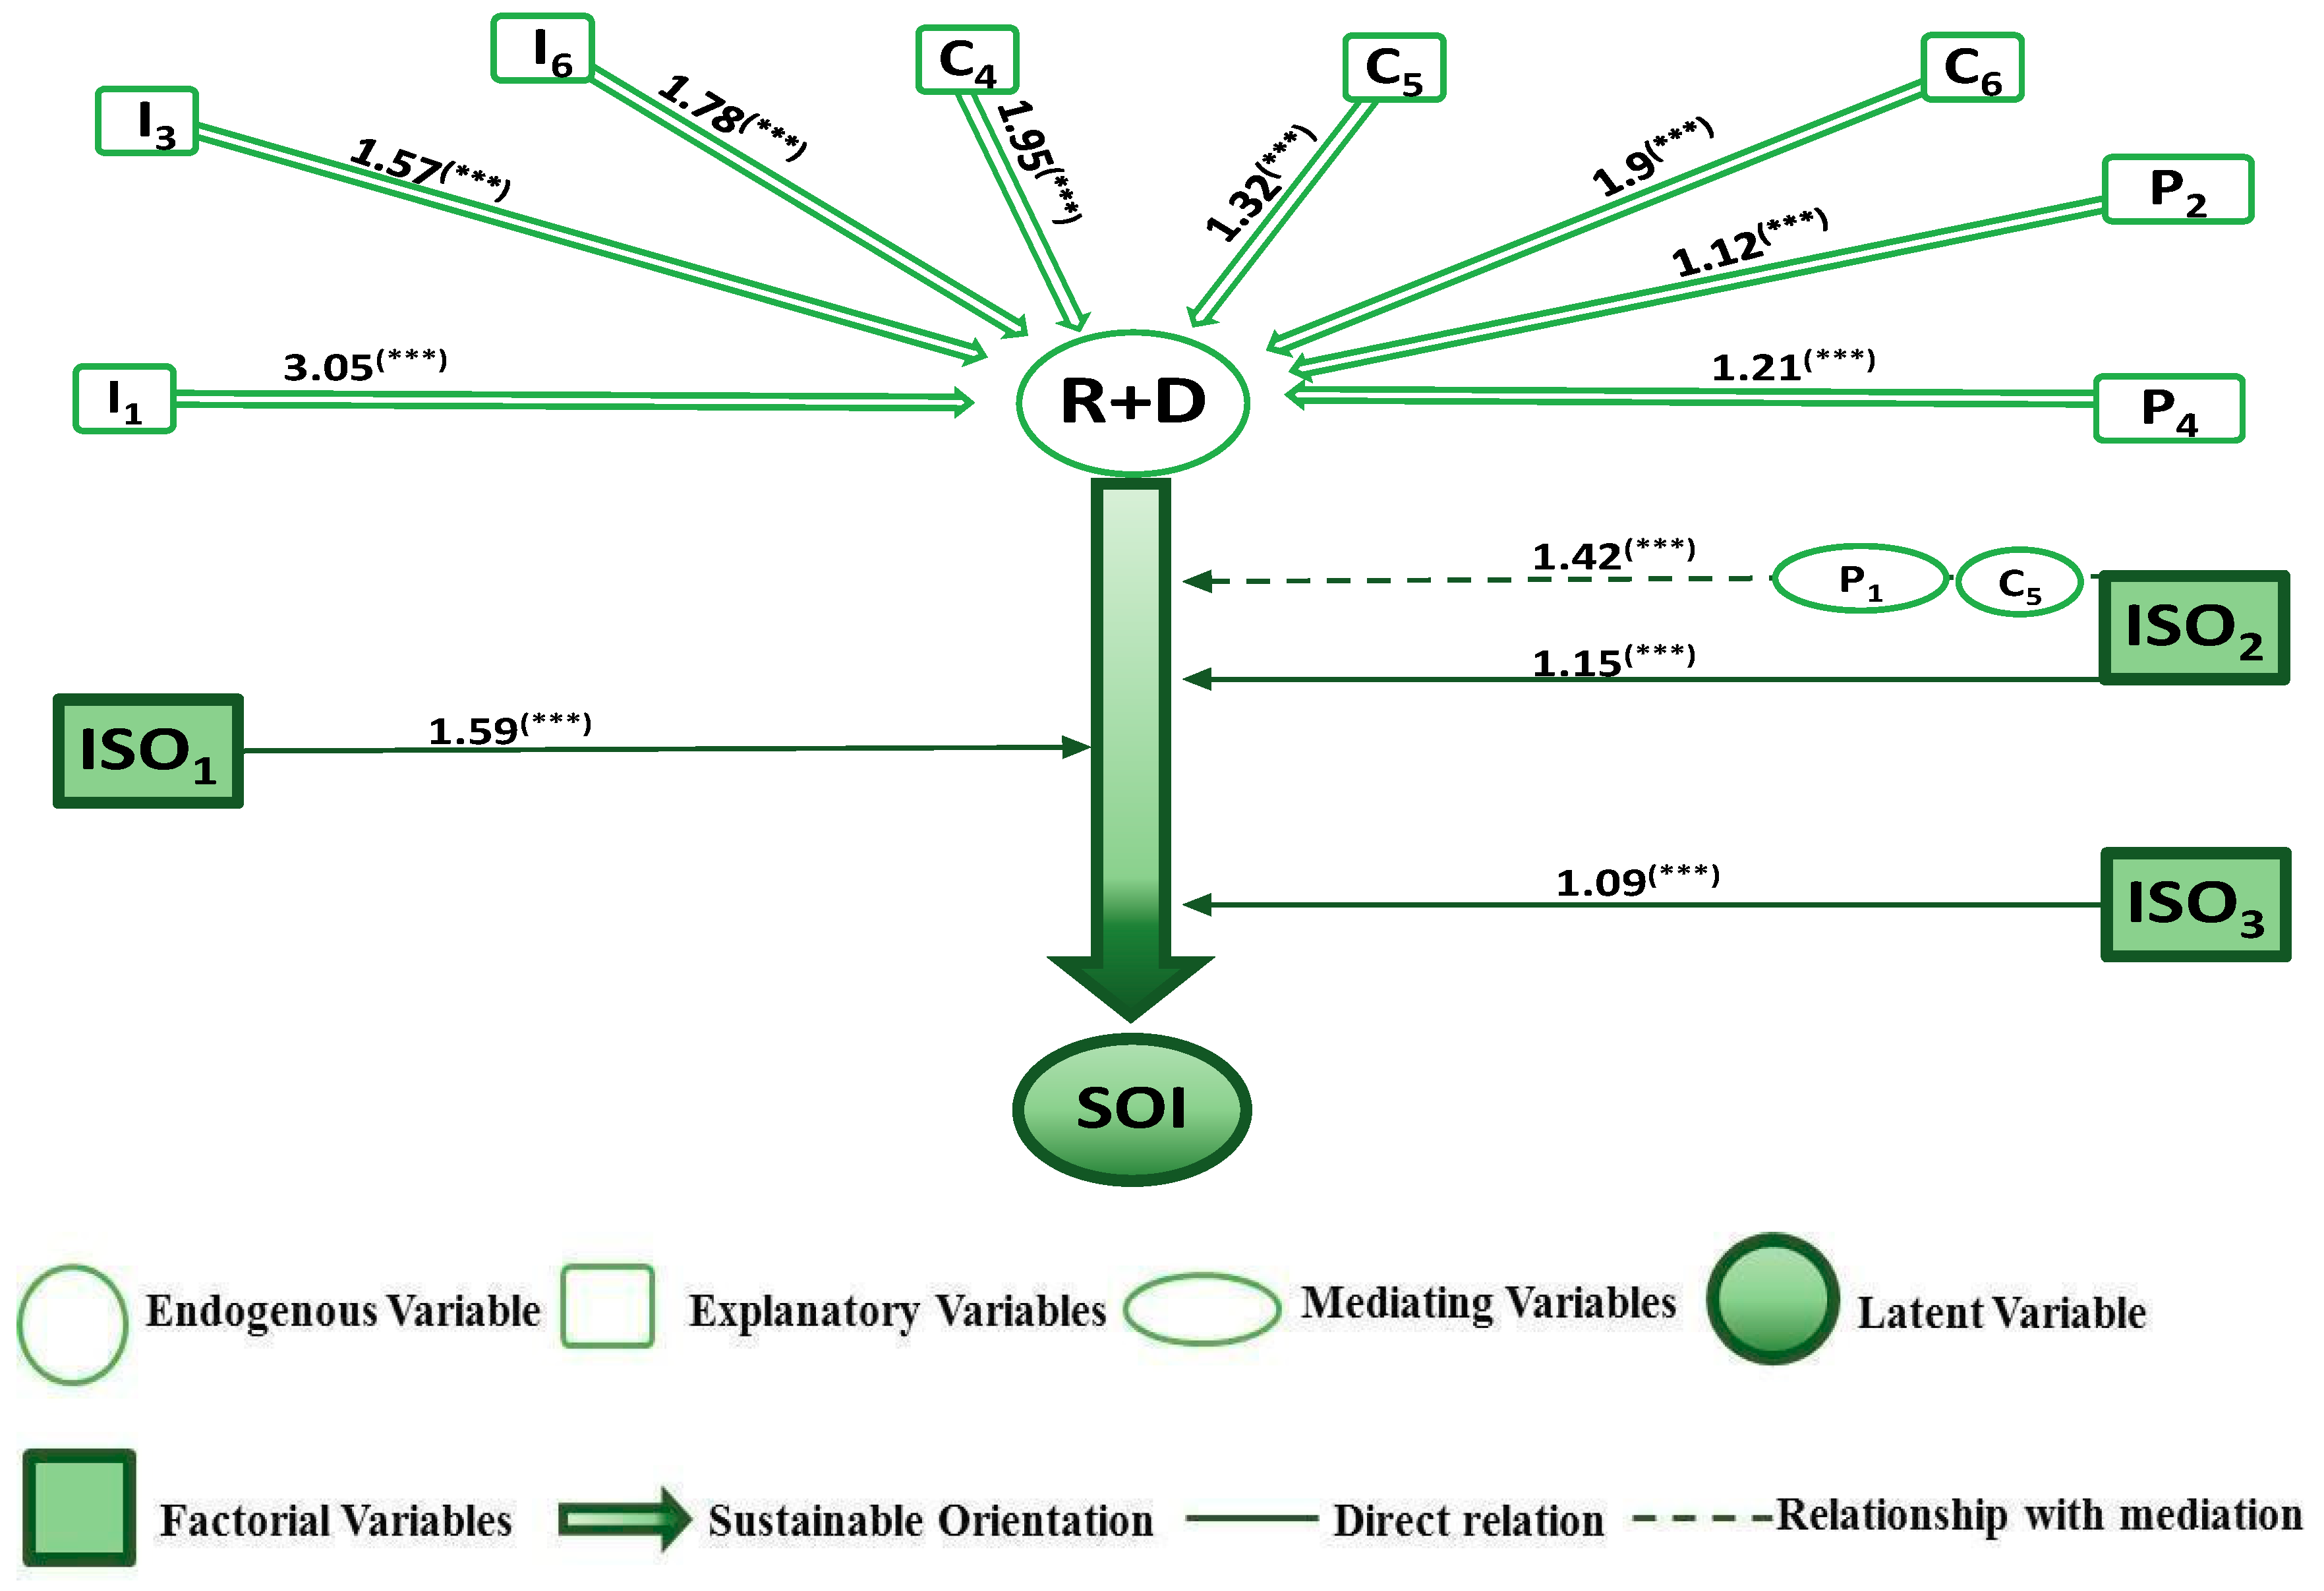
As can be seen, there are behavioral patterns common to companies with FDI, regardless of size. To see if this differs from large companies without foreign participation, we analyzed Figure 4 and compared it with Figure 3.
What is made evident first when looking at this diagram is that there are no differences in terms of the variable S4, since, as can be seen in Table 4, this variable is significant, but negative, in both cases. On the other hand, unlike in the previous cases, innovation is not influenced by the age of the company because (Abit) is not significant.
The second difference that can be observed is the order of importance of the sources of information, as these companies will be more innovative if they have information that is internal (I1), from universities (I6), and from the client (I3), in this order, in accordance with their odds ratios. Information coming from companies of the group, or company departments, etc., stands out here. With regard to the integration of stakeholders, we can see how cooperation with competitors (C4) and universities (C6) increases innovations in the same way as it does for large companies with FDI, and there is now cooperation with consultants (C5).
However, despite there being a direct influence of the absorptive capacity on two ranges, one from 25–50% (P2) and the other from 75–100% (P4), there is no moderator effect with cooperation that motivates innovation.
In this scenario, the NFDI SMEs that orient the goals of their innovation towards sustainability are more inclined to innovate, as indicated by the significance of all the goals (ISO1, ISO2, ISO3), as happened in the previous case. The difference can be seen in the effect of these goals, which is direct, and is only strengthened indirectly in the case of environmental sustainability goals (ISO2).
Moderation as a whole, therefore, between cooperation with consultants and staff (C5*P1*ISO2), reflects the idea that participation of this can lead to improvements in the effect of environmental sustainability, but this requires less than 25% qualified staff, which will enable newly acquired knowledge to be applied to innovation, increasing this by 27%.
5. Discussion
This study proposed researching the different channels for accessing knowledge for SOI, examining them through absorptive capacity and cooperation, according to company age and size, in a comparative analysis between foreign and national companies.
The literature establishes, on the one hand, that the complexity of SOI implies the inclusion of a wide set of actors and, on the other, that FDI enables its requirements to be met [7,17]. This comparative study arises from these two premises, based on which we have found that such diversity gives rise to two paths by which sustainable goals influence the innovative process, one direct and the other moderate.
In reference to the former, and in line with the literature that establishes that innovation can be driven by sustainability [1,16], these results go one step further by responding to the request for greater direct monitoring of the impacts of sustainability [64]. The results show that, for both types of company, economic sustainability has the most weight in innovation, followed by environmental sustainability, with social sustainability having the least weight of the three.
However, if we consider this shared trait, we see that the importance of innovation for these goals of environmental and social sustainability is greater in companies with FDI than in companies without FDI, the opposite being the case with goals of economic sustainability.
As regards the latter, the moderator effect (Table 5), and the literature establishes that:
- To understand and integrate sustainability in the innovative process requires having qualified staff with the skills to do so [2]. This only happens if the company has FDI, less than 25% qualified staff, and if innovation has been oriented by social sustainability, indicating that these companies require the second type of absorptive capacity [100].
- Cooperation with external partners in the interest of sustainability should be exploited [3]. Companies with FDI will achieve this exploitation when they cooperate with universities and providers, improving their economic and environmental sustainability, respectively. The role of providers, as key partners for environmental sustainability, corroborates the idea of the presence of technological interdependencies [8].
- To achieve sustainability, learning is key, when understood as the assimilation and application of newly acquired knowledge in SOI [59,60], in both types of company. For those that have FDI, learning from universities can enhance environmental sustainability and learning from consultants can enhance social sustainability, the latter requiring a greater percentage of qualified staff. For companies without FDI there is learning from consultants, which enhances environmental sustainability, without a significantly high percentage of qualified staff. These results run counter to studies that establish that the level of education of workers does not affect the introduction of environmental innovation [62], and demonstrate that the management of knowledge and cooperation are drivers of sustainable innovation [64].
Successful sustainable innovation needs a focus on resource co-specialization that allows companies to bring together specialized resources and competences scattered in diverse actors around a sustainability opportunity [69].
Therefore, a greater propensity to innovate sustainably, thanks to external knowledge sources and cooperation agreements [61], only occurs for the case of cooperation with providers, universities, and consultants. This runs counter to the idea that a more proactive and structured relationship with clients can foster the acquisition of sustainability-oriented knowledge [63]. This result is not surprising given the complexity attached to these innovations.
Greater use of relationships with universities in the case of environmental sustainability indicates, on the one hand, an interdependence between knowledge, skills, and resources, which arise in the development of said innovations and, on the other, a need to complement the knowledge base [62].
The results of this comparative analysis align with the literature, which distinguishes the cooperation models of foreign and national companies [25,88] and, more specifically, with those studies that establish that companies with FDI have a greater propensity to cooperate in R&D [26,87].
However, the results run counter to the idea that this distinction, when related with aspects of sustainability, is motivated by knowledge complementarity [25], as they show that foreign companies are more likely to innovate if they cooperate with universities and providers. In addition, they are contrary to the technology orientation negatively affecting environmental dimensions [30].
Finally, the positive impacts of big companies (FDI and NFDI) whose innovation is oriented by sustainable objectives, is similar to that of SMEs (FDI and NFDI). This is contrary to the literature, which establishes an inverse relationship between firm size and a proven commitment to sustainability ideals [106].
6. Conclusions
The SOI cases in this study display the distinctive traits of sustainable innovation for companies with and without FDI, in terms of the capacities required for integrating external actors and their effects. It also provides a deeper understanding of the different channels for accessing knowledge for SOI, as it examines the links through absorptive capacity and cooperation, according to company age and size. It thereby contributes to the literature that analyzes the benefits of cooperation.
This paper jointly considered the effects of firm strategic and organizational orientations (technology orientation and internally organizational orientation) on several dimensions of sustainable performance, objectively measured, and contributes to advancing the existing knowledge on the relationships between firms’ orientations and their sustainable performance.
It provides a useful theoretical lens for advancing knowledge of management practices for sustainable innovation. In addition, this leads to improving practical understanding of how resources and competences are deployed, and firms, through innovation, create sustainability value. This shows that a company’s innovation for sustainability notably depends on how effectively the company catches the complementary resources and competences around an innovation opportunity.
One of the most significant implications arises from not having an integrated absorptive capacity in a construct, thereby offering the possibility of seeing the individual effect of each dimension. Therefore, if a company wants to maximize the effect of cooperation with its partners, it should consider that qualified staff is not the same in all cases, and depends on the type of cooperator and the goal of the cooperation. This document sheds light on the possibilities of improving the absorptive capacity for acquiring and assimilating knowledge on issues related to sustainability.
This study contributes to the international literature by looking, in greater depth, at the comparative differences in behavior of foreign and national companies, analyzing how the same elements affect their interaction and result in sustainable development. Focusing on companies with FDI highlights the specific and intrinsic advantages associated with foreign investment, and how those companies gain knowledge when interacting with diverse markets and institutional sources. This shows how external links make these companies more innovative, as well as more sustainable.
This study concludes that similar efforts to orient innovation towards sustainable goals should be more skeptical with respect to approaches that rely primarily on size differentiation. However, the fact that sustainability-oriented knowledge is acquired and assimilated more efficiently in SMEs with FDI, shows that FDI helps companies to meet the requirements demanded by SOI by offering the internal capacities and cooperation structure to facilitate this.
Given the complexity of SOI, companies with FDI cooperate with universities and private research institutes, which provide highly specialized knowledge, and with providers, because of their understanding regarding the supply of raw materials and inputs that help to reduce resource intensity, emissions, and waste, proof of their capacity to import specialized knowledge.
In this process, the absorptive capacity serves as a moderator, strengthening the effect of environmental and social goals in the innovative process, becoming a core competency for IOS. Staff will, therefore, be sufficiently qualified and have the necessary characteristics to retain, reactivate, and apply the knowledge obtained in products and processes, confirming a company’s potential to achieve sustainable innovations.
Therefore, FDI helps overcome the difficulty of creating learning networks derived from an SOI process. It is different in how it cooperates and obtains external knowledge, preferring not to look only for local knowledge, but also specialized knowledge. This is different from what the literature establishes as its habitual behavior when undertaking unsustainable innovations, without this difference growing due to size and age.
From a general perspective, a question that companies involved in sustainable initiatives should address is how to reconcile cooperation with different partners. This study helps managers to get involved in sustainable development by offering some initial guidelines that will enable them to benefit from cooperation with different partners, and the possible effects of this on their companies’ capacity for sustainable innovation. These guidelines will enable companies to understand how, based on their needs, they should complement their knowledge to achieve SOI. Thus, the companies’ managers should think of alternative, sustainably innovative routes to go, and adopt different approaches for managing innovation for sustainability.
Limitations and Future Research
There are certain limitations to this study that offer new research opportunities. First, the findings of this research are based on a quantitative study. Future research should also include case studies that take into account other actors, such as NGOs, for example, expanding the scope of this issue.
Second, we created our own measures for strategy by collecting data in the Technological Innovation Panel (PITEC). Although this could seem to provide measures that are highly dependent on what companies want to communicate to stakeholders, it is coherent with our aim of measuring “orientation” [30].
Third, training employees enables companies to recognize and acquire external knowledge, although there are studies that establish that infrastructure capacities could also be enhanced [63]. Future research, therefore, could include these within an absorptive capacity.
Fourth, by taking into account the goals that orient innovation, we controlled the relevance of the different partners arising from the specific strategy pursued by the company. However, the relevant partners can also vary depending on the industry, something which should be contemplated in future studies [62].
Fifth, although this study offers a detailed vision of cooperation with diverse partners individually, neither frequency nor depth were included, both of which are concepts that would enable cooperation networks for sustainable innovation to become operational [71].
Sixth, it should be considered that cooperation in companies with FDI could be influenced both by its origin and by how it entered the company, both of which are aspects that could potentially influence a company’s motivation for seeking to complement its knowledge [25].
Seventh, an in-line analysis with a Bayesian approach using a posterior odds ratio approach would be interesting.
Lastly, given that the interaction between universities and companies with FDI can represent a powerful mechanism for improving the linkage between national innovation systems and global innovation dynamics, it would be interesting to study the incentives for the financing that would enhance this interaction [88].
Author Contributions
Main idea, A.M.-L.; Data Curation, A.M.-L.; Methodology, A.M.-L. and A.Á.-H.; Software, A.M.-L.; Writing—original draft preparation, A.M.-L.; Writing—review and editing, A.M.-L. and A.Á.-H.; Visualization, A.M.-L.; Supervision, A.Á.-H.
Funding
This research received no external funding.
Acknowledgments
We thank two referees for their valuable recommendations to previous version of the paper.
Conflicts of Interest
The authors declare no conflict of interest.
Appendix A. Variables of the Model
- Dependent or explained variable:
- ⚬
- R + D + iit Company “i” undertakes or does not undertake internal innovation activity at the point in time “t”. This variable arises from the question:
- ▪
- Has your company undertaken internal R&D activities in the year t?
- Independent or explanatory variables:
- ⚬
- Company size (Sait): Takes a value of 1 if the company “i” has a size “a” at the point in time “t” and a value of 0 if not. Where a = 1 if it is a Micro-enterprise, a = 2 if it is a Small Company, a = 3 if it is a Medium Company and a = 4 for Large Companies (a Micro-enterprise is considered any company with fewer than 10 employees, Small Company with between 10 and 50 employees, Medium Company between 50 and 250 and Large Companies if it has more than 250 employees [105]).
- ⚬
- Company Age (Abit): Takes a value of 1 if the company “i” has an age “b” at the point in time “t” and a value of 0 if not. Where b = 1 if it is less than 5 years old, b = 2 if it is between 5 and 15 years old and b = 3 if it is more than 15 years old (given that SMEs generally have a high mortality rate in the first five years, there is the generalized idea that this is an incubation period, which needs to be exceeded for the company to become fully established [109].).
- ⚬
- Information source (Icit): Variable that includes the importance of each of the sources “c” for the innovation activities of company “i” at the point in time “t” (initially this variable was scored on a scale of one to four depending on the level of importance (1 = High, 2 = Medium, 3 = Low and 4 = Not relevant). To facilitate the handling and interpretation of the variables, the scale was restructured so that the values 1 and 2 take a value of 1, while the values 3 and 4 take a value of 0). This variable arises from the question:
- ▪
- In the period t − 2 to t, what importance have each of the following information sources had for the innovation activities of your company?
- c = 1: Internal information (within the company or group of companies, departments, employees …).
- c = 2: Providers of equipment, material, components or software.
- c = 3: Clients.
- c = 4: Competitors or other companies from its branch of activity.
- c = 5: Consultants, commercial laboratories, or private R&D institutes.
- c = 6: Universities or other higher education centers.
- ⚬
- Cooperation (Cdit): Variable used if for the innovation activities of company “i” the company has cooperated with partner “d” at the point in time “t”. It takes a value of 1 if it has cooperated and 0 if not. This variable arises from the question:
- ▪
- In the period t − 2 to t, did your company cooperate with other companies or entities in any of its innovation activities? Indicate what kinds of partners were involved:
- d = 1: Other companies from its own group.
- d = 2: Providers of equipment, material, components or software.
- d = 3: Clients from the private and/or public sector.
- d = 4: Competitors or other companies from its branch of activity.
- d = 5: Consultants or commercial laboratories
- d = 6: Universities or other higher education centers.
- ⚬
- Personal (Peit): Variable that represents the percentage of human capital with higher education, “e”, of company “i” at the point in time “t”. It takes a value of 1 if the company has this human capital and 0 if it does not. In the model that we propose, this variable is split into quartiles:
- e = 1: If the company has between 0% and 25% of staff with higher education.
- e = 2: If the company has between 25% and 50% of staff with higher education.
- e = 3: If the company has between 50% and 75% of staff with higher education.
- e = 4: If the company has between 75% and 100% of staff with higher education.
- ⚬
- Indicators of Sustainable Objectives (ISOfit): Variable that includes the goal “f” that has oriented the innovation of the company “i” at the time “t”. Where f = 1 for the economic sustainable objective indicator, f = 2 for the environmental sustainable objective indicator and f = 3 for the social sustainable objective indicator (these three variables are the sustainable objective indicators and have been constructed through an analysis of the main components). This variable arises from the question:
- ▪
- In the period t − 2 to t, the innovative activity undertaken in your company may have been oriented towards different objectives. Indicate the degree of importance of the objectives (this variable was scored on a scale of one to four depending on the level of importance (1 = High, 2 = Medium, 3 = Low and 4 = Not relevant).
Appendix B. Indicators of Sustainable Objectives
As can be seen in Table A1, the results show that the goals oriented towards economic sustainability represent 63.48% and 63.11% of the variance, for the FDI and NFDI groups, respectively (statistic K-M-O 0.754 and 0.753, average ratio), the goals oriented towards environmental sustainability represent 72.89% and 71.06% of variance (statistic K-M-O 0.708 in both cases, average ratio) and, lastly, the goals oriented towards social sustainability represent 64.02% and 62.49% of the variance (statistic K-M-O 0.800 in both cases, satisfactory ratio). The alpha coefficients have an acceptable value that ranges from 0.796 to 0.875 for companies with FDI and from 0.793 to 0.863 for NFDI companies, values that are far higher than the recommended value of 0.7, which is considered satisfactory for exploratory research [97].
Therefore, a model with these factors is suitable for assessing the sustainability of the innovative process. The first factor, the “Economic sustainable objective indicator”, shows the variables that have a shared underlying economic dimension. The main variables, which have a strong influence on this factor, are those related with new markets and a greater capacity to produce and, therefore, having a wider range to sell, which shows a relationship with innovative solutions in economic sustainability. The second factor, known as the “Environmental sustainable objective indicator”, includes the variables related with the environment, which means that these goals foster innovations related with environmental sustainability. Lastly, the “Social sustainable objective indicator” includes variables with a dual social impact: on the one hand, if it improves the quality of the products that clients receive and, on the other, if it improves quality of life, individual wealth, new jobs are created, or there is greater security for the worker.

Table A1.
Validity and reliability results for the scale of the items of the factorial analysis of the main components of the Indicators of Sustainable Objectives.
Table A1.
Validity and reliability results for the scale of the items of the factorial analysis of the main components of the Indicators of Sustainable Objectives.
| Factor | Items | Factor Structure Matrix | Explained Variance | ||
|---|---|---|---|---|---|
| FDI | NFDI | FDI | NFDI | ||
| Economic sustainable objective indicator | Wider range of goods or services | 0.832 | 0.818 | 63.94% | 63.15% |
| Penetration in new markets | 0.879 | 0.884 | |||
| Higher market share | 0.904 | 0.893 | |||
| Increased production or service capacity | 0.526 | 0.528 | |||
| Kaiser-Meyer-Olkin Measure of Sampling Adequacy | 0.755 | 0.753 | |||
| Cronbach’s Alpha | 0.800 | 0.793 | |||
| Environmental sustainable objective indicator | Less material per unit produced | 0.831 | 0.833 | 71.95% | 71.06% |
| Less energy per unit produced | 0.883 | 0.865 | |||
| Lower environmental impact | 0.858 | 0.846 | |||
| Compliance with environmental regulatory requirements | 0.820 | 0.828 | |||
| Kaiser-Meyer-Olkin Measure of Sampling Adequacy | 0.709 | 0.708 | |||
| Cronbach’s Alpha | 0.869 | 0.863 | |||
| Social sustainable objective indicator | Higher quality of goods or services | 0.642 | 0.617 | 65.2% | 62.46% |
| Improvement in the health and safety of employees | 0.753 | 0.706 | |||
| Increase in total employment | 0.877 | 0.871 | |||
| Increase in skilled employment | 0.895 | 0.889 | |||
| Job maintenance | 0.843 | 0.834 | |||
| Kaiser-Meyer-Olkin Measure of Sampling Adequacy | 0.808 | 0.800 | |||
| Cronbach’s Alpha | 0.857 | 0.84 | |||
Source: prepared by the authors.
Appendix C. Choice a Cut-Off Value for the Odds
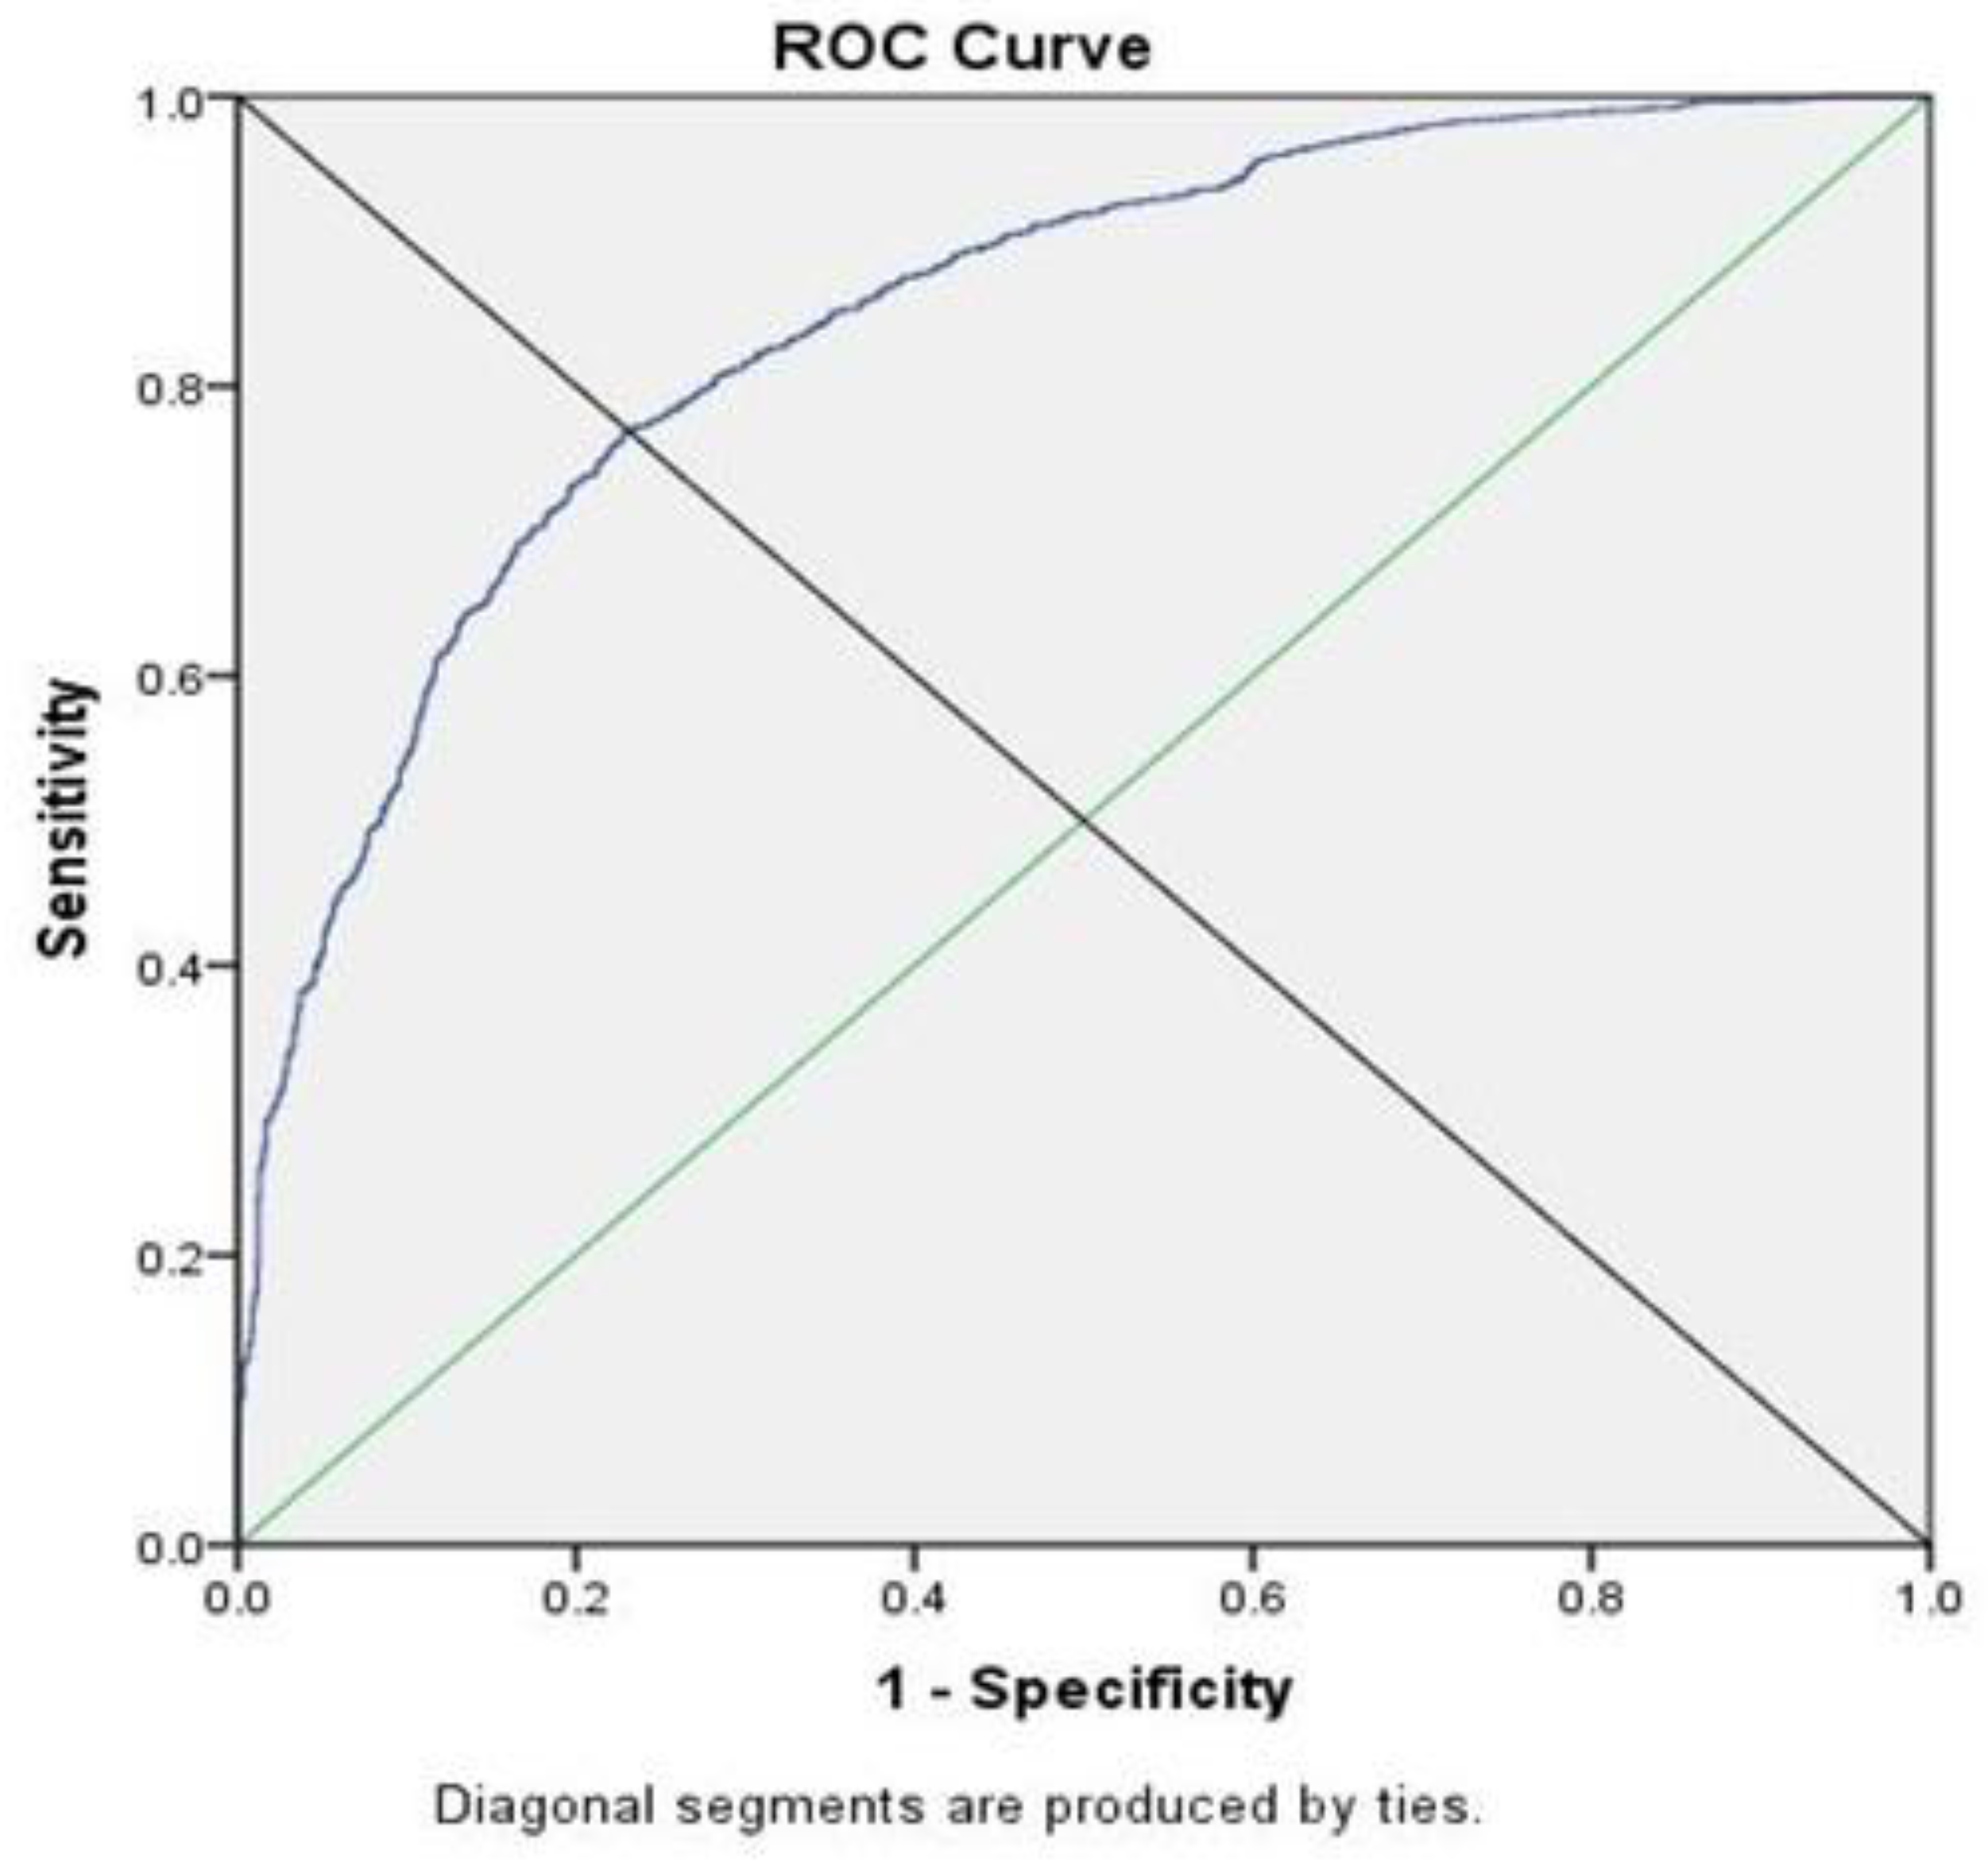
Table A2.
Curve OC FDI SMEs.
| Area Under the Curve | ||||
| Test Result Variable(s): Predicted Probability | ||||
| Area | Std. Error a | Asymptotic Sig. b | Asymptotic 95% Confidence Interval | |
| Lower Bound | Upper Bound | |||
| 0.844 | 0.006 | 0.000 | 0.832 | 0.855 |
| Classification Table c | Predicted | |||
| R + D + i | Percentage Correct | |||
| Observed | 0 | 1 | ||
| R + D + i | 0 | 1063 | 323 | 76.7 |
| 1 | 691 | 2308 | 77.0 | |
| Overall Percentage | 76.9 | |||
Source: prepared by the authors. The test result variable(s): Predicted probability has at least one tie between the positive actual state group and the negative actual state group. Statistics may be biased. (a) Under the nonparametric assumption; (b) Null hypothesis: true area = 0.5, (c) The cut value is 0.675.
Figure A1.
Curve ROC FDI SMEs.

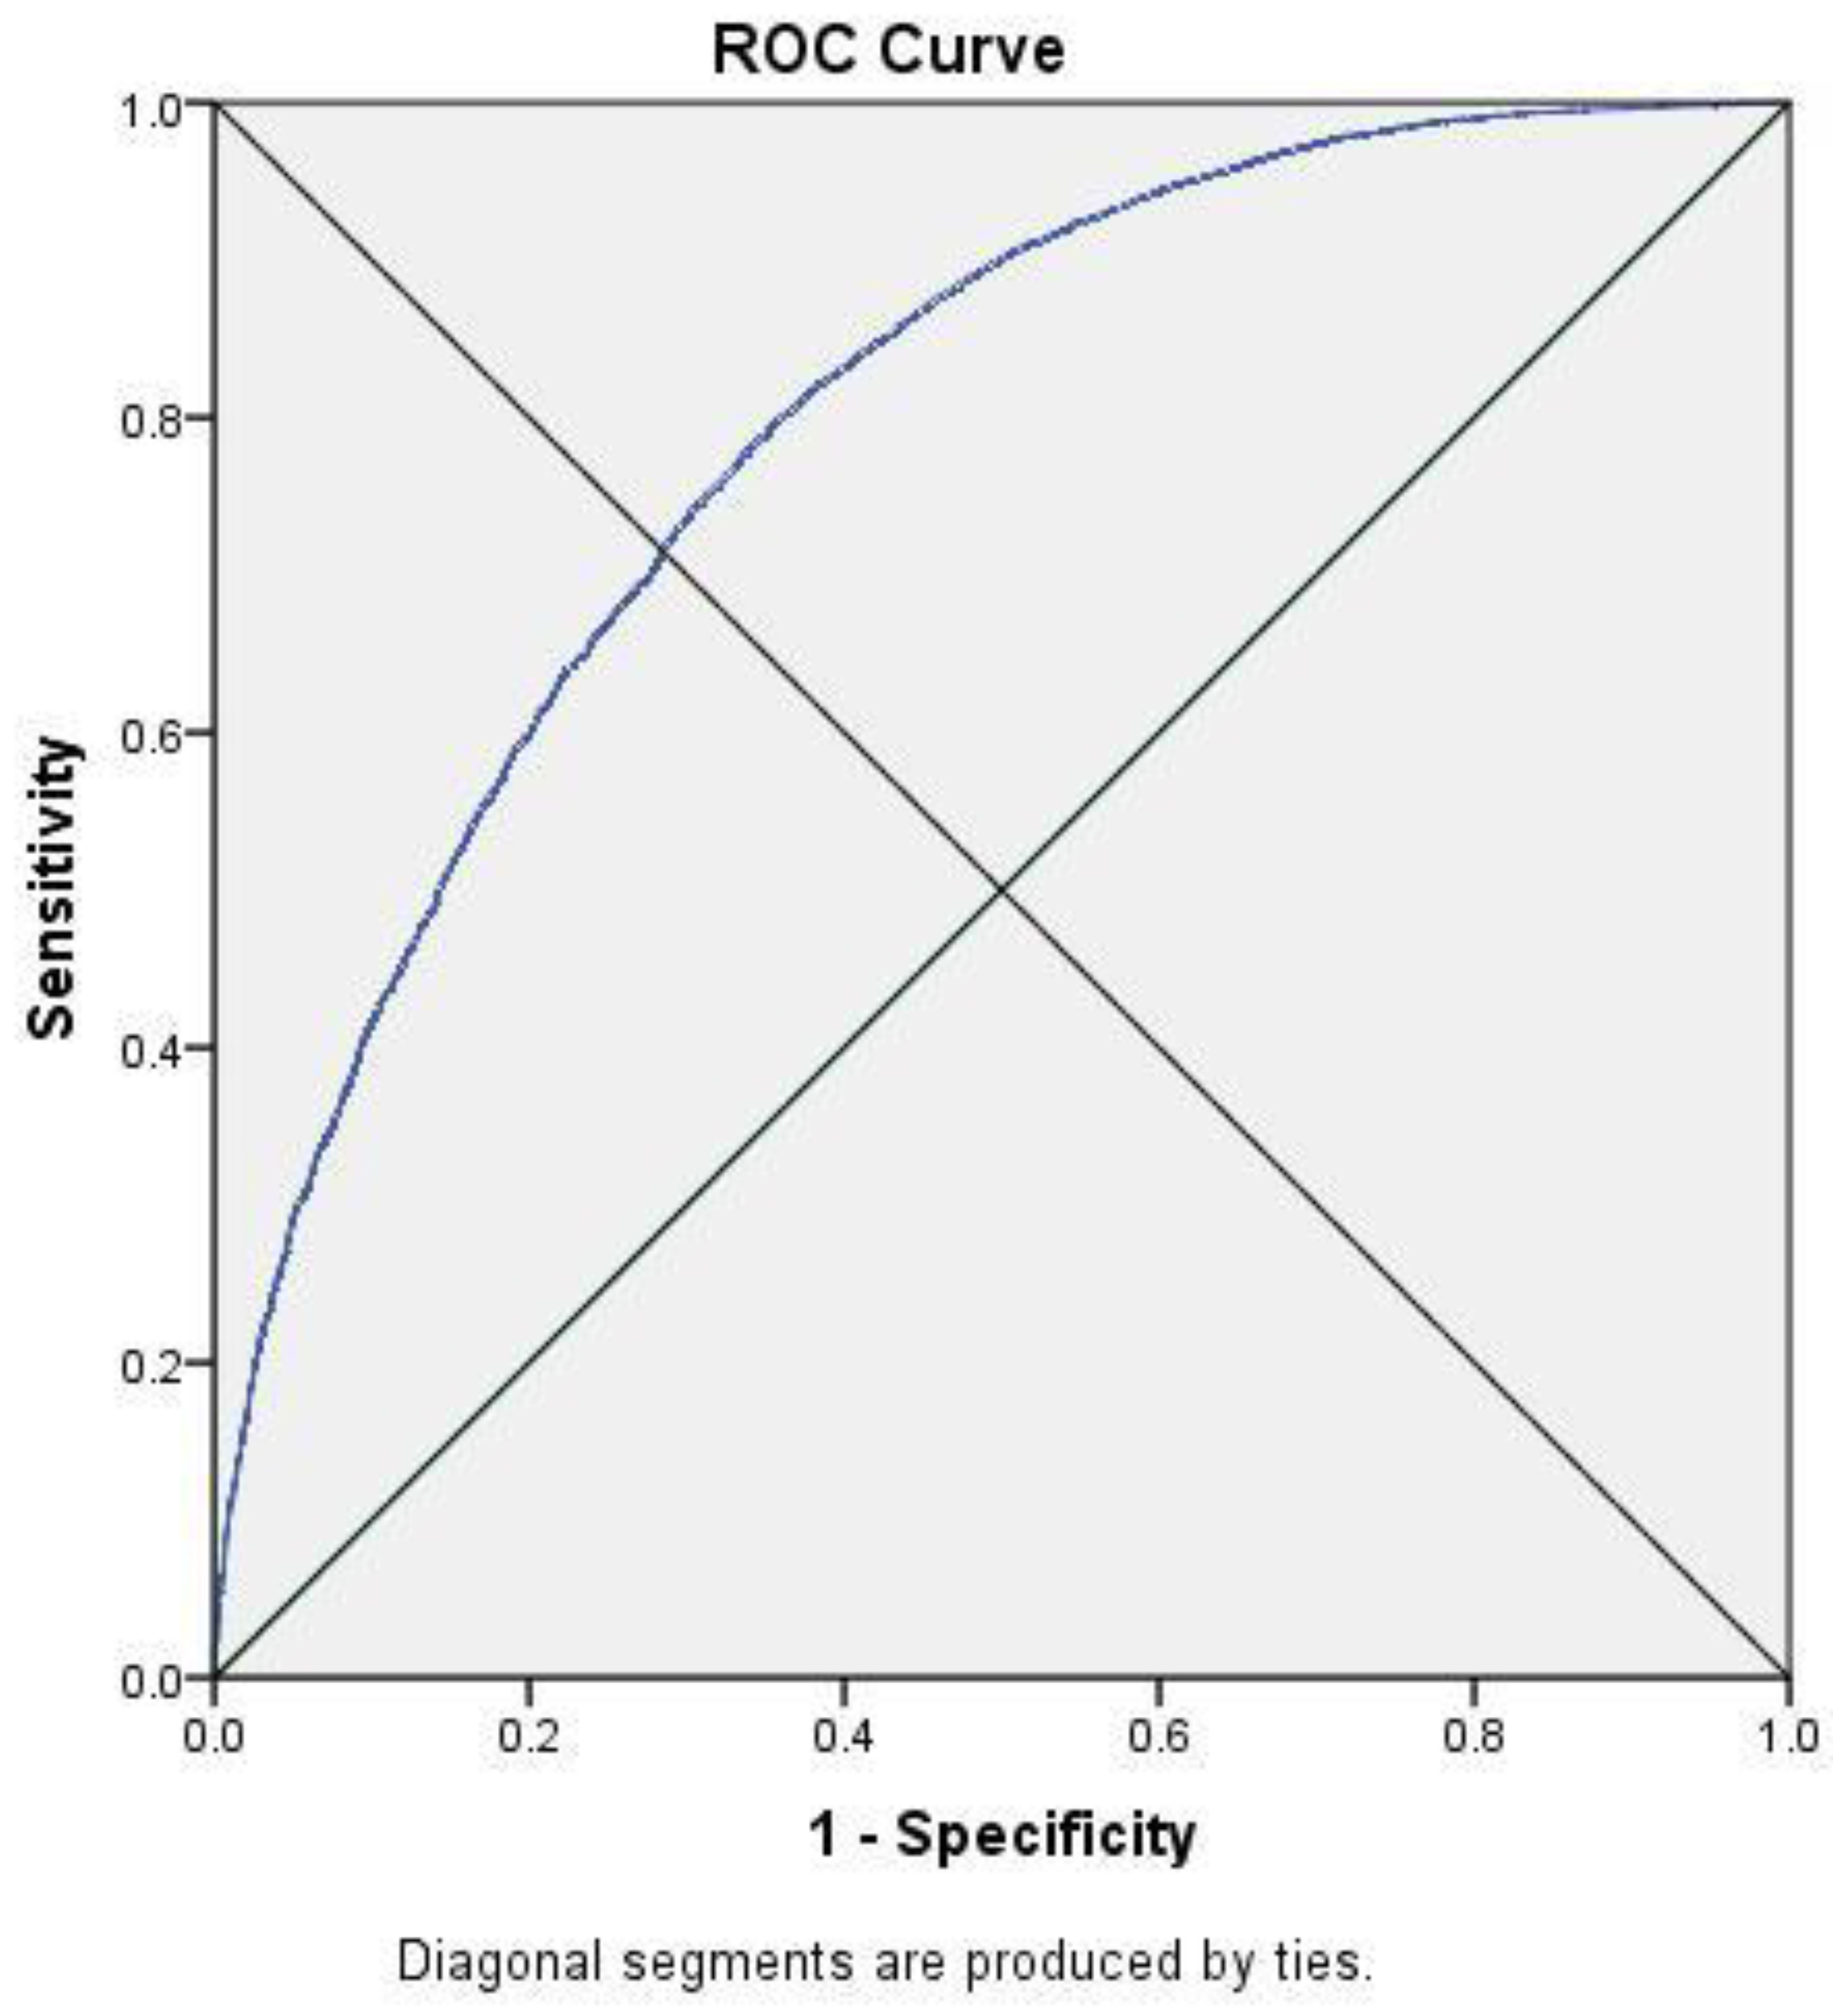
Table A3.
Curve ROC NFDI SMEs.
| Area Under the Curve | ||||
| Test Result Variable(s): Predicted Probability | ||||
| Area | Std. Error a | Asymptotic Sig. b | Asymptotic 95% Confidence Interval | |
| Lower Bound | Upper Bound | |||
| 0.796 | 0.003 | 0.000 | 0.789 | 0.802 |
| Classification Table c | Predicted | |||
| R + D + i | Percentage Correct | |||
| Observed | 0 | 1 | ||
| R + D + i | 0 | 4944 | 1959 | 71.6 |
| 1 | 4410 | 10,873 | 71.1 | |
| Overall Percentage | 71.3 | |||
Source: prepared by the authors. The test result variable(s): Predicted probability has at least one tie between the positive actual state group and the negative actual state group. Statistics may be biased. (a) Under the nonparametric assumption; (b) Null hypothesis: true area = 0.5; (c) The cut value is 0.715.
Figure A2.
Curve ROC NFDI SMEs.

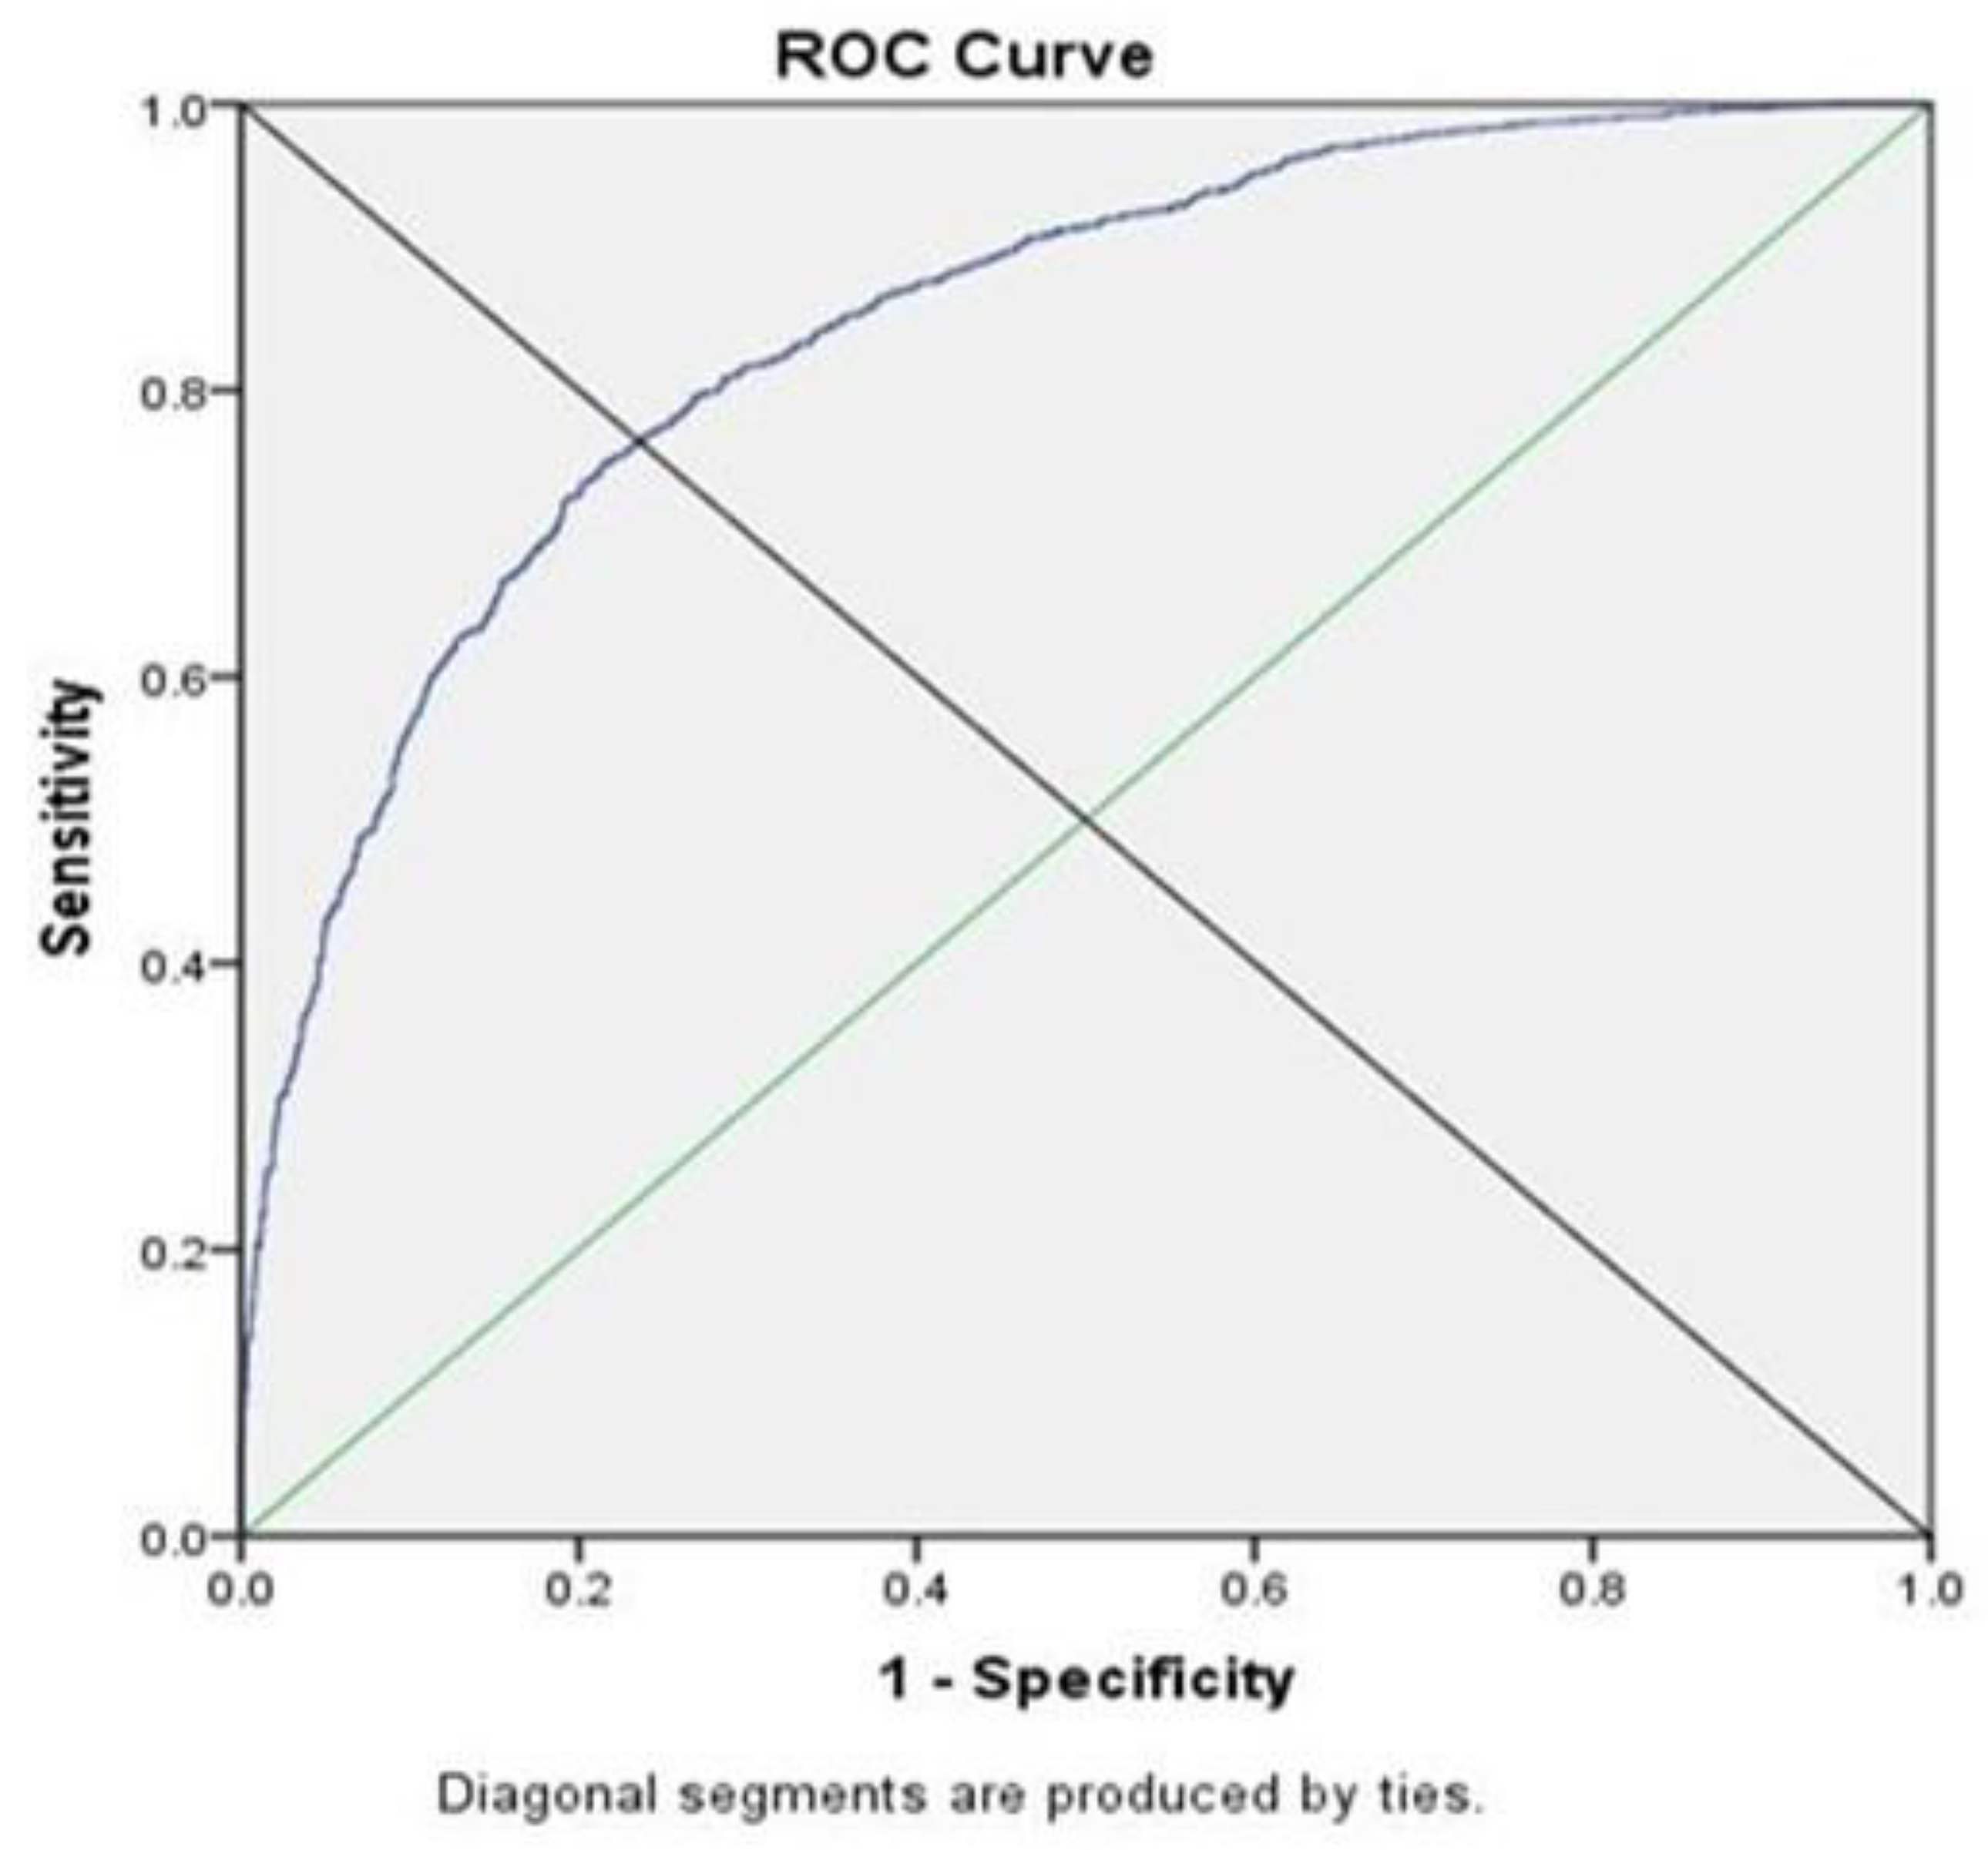
Table A4.
Curve ROC FDI Big.
| Area Under the Curve | ||||
| Test Result Variable(s): Predicted Probability | ||||
| Area | Std. Error a | Asymptotic Sig. b | Asymptotic 95% Confidence Interval | |
| Lower Bound | Upper Bound | |||
| 0.843 | 0.006 | 0.000 | 0.831 | 0.855 |
| Classification Table c | Predicted | |||
| R + D + i | Percentage Correct | |||
| Observed | 0 | 1 | ||
| R + D + i | 0 | 1064 | 322 | 76.8 |
| 1 | 715 | 2284 | 76.2 | |
| Overall Percentage | 76.4 | |||
Source: prepared by the authors. The test result variable(s): Predicted probability has at least one tie between the positive actual state group and the negative actual state group. Statistics may be biased. (a) Under the nonparametric assumption; (b) Null hypothesis: true area = 0.5; (c) The cut value is 0.675.
Figure A3.
Curve ROC FDI Big.

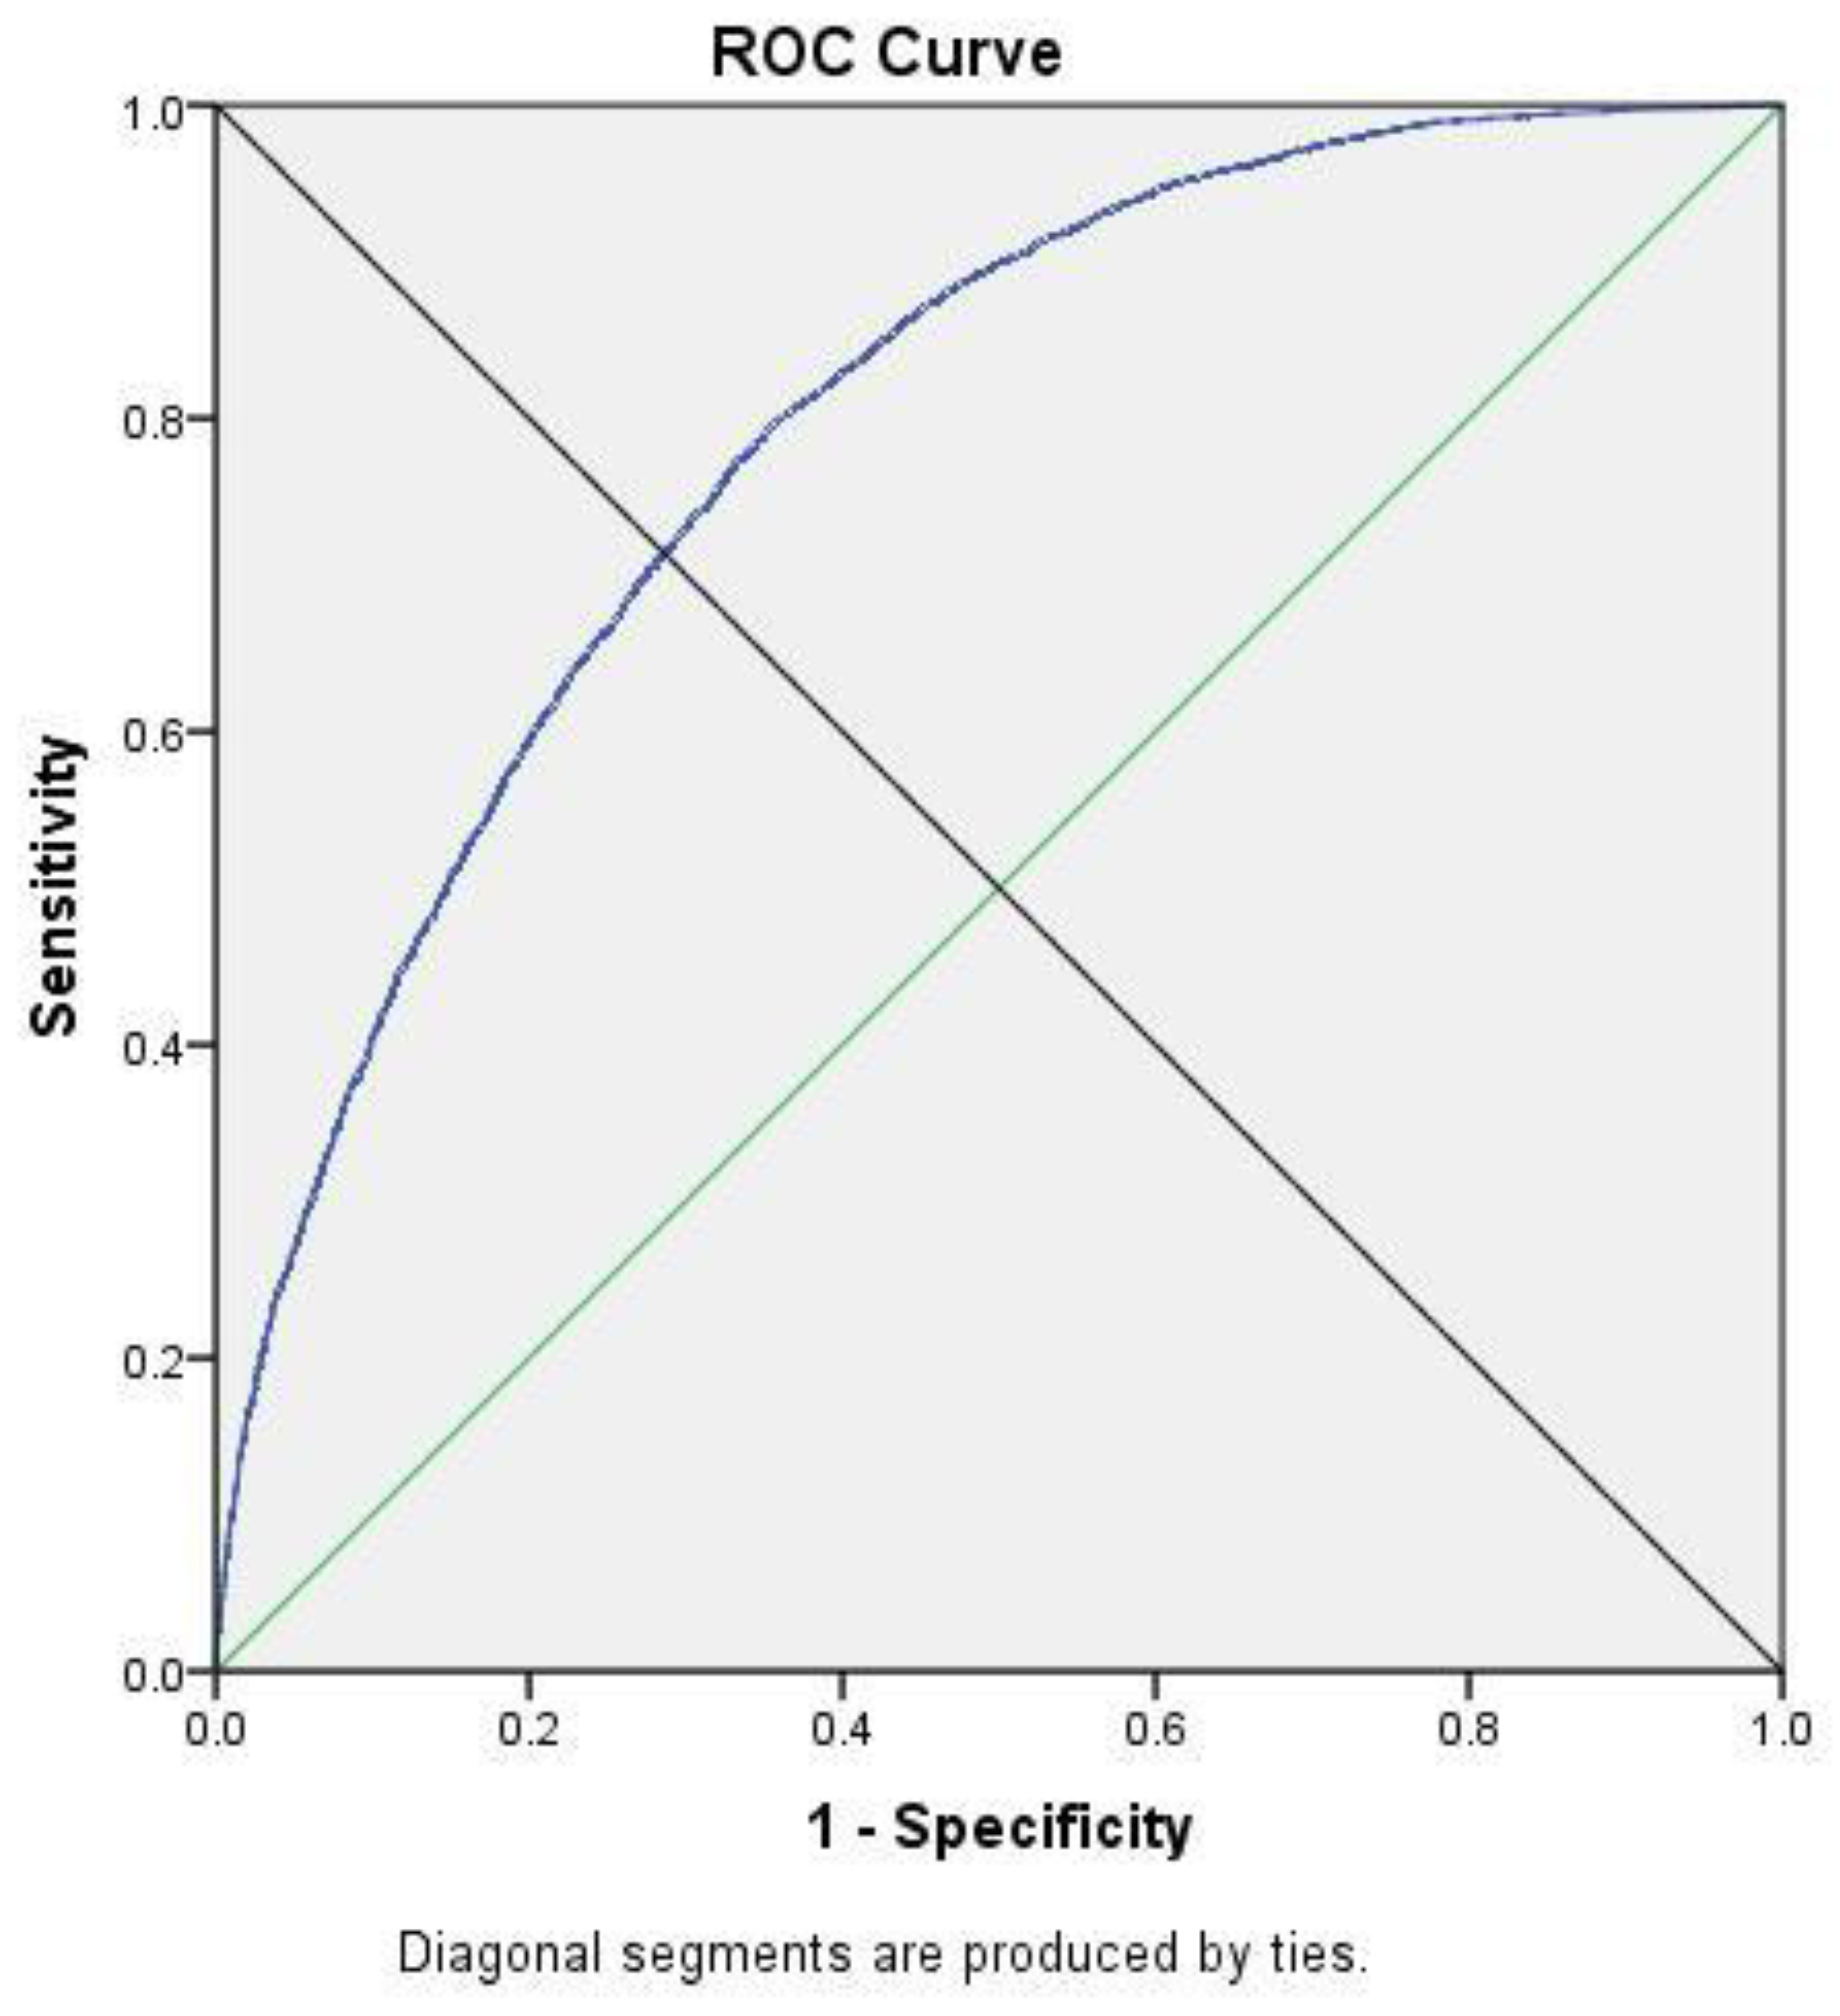
Table A5.
Curve ROC NFDI Big.
| Area Under the Curve | ||||
| Test Result Variable(s): Predicted Probability | ||||
| Area | Std. Error a | Asymptotic Sig. b | Asymptotic 95% Confidence Interval | |
| Lower Bound | Upper Bound | |||
| 0.793 | 0.003 | 0.000 | 0.787 | 0.800 |
| Classification Table c | Predicted | |||
| R + D + i | Percentage Correct | |||
| Observed | 0 | 1 | ||
| R + D + i | 0 | 4919 | 1984 | 71.3 |
| 1 | 4354 | 10,929 | 71.5 | |
| Overall Percentage | 71.4 | |||
Source: prepared by the authors. The test result variable(s): Predicted probability has at least one tie between the positive actual state group and the negative actual state group. Statistics may be biased. (a) Under the nonparametric assumption; (b) Null hypothesis: true area = 0.5; (c) The cut value is 0.715.
Figure A4.
Curve ROC NFDI Big.

References
- Van Geenhuizen, M.; Ye, Q. Responsible innovators: Open networks on the way to sustainability transitions. Technol. Forecast. Soc. 2014, 87, 28–40. [Google Scholar] [CrossRef]
- Dangelico, R.M.; Pontrandolfo, P.; Pujari, D. Developing sustainable new products in the textile and upholstered furniture industries: Role of external integrative capabilities. J. Prod. Innov. Manag. 2013, 30, 642–658. [Google Scholar] [CrossRef]
- Adams, R.; Jeanrenaud, S.; Bessant, J.; Denyer, D.; Overy, P. Sustainability-oriented innovation: A systematic review. Int. J. Manag. Rev. 2016, 18, 180–205. [Google Scholar] [CrossRef] [Green Version]
- Ayuso, S.; Rodríguez, M.Á.; García-Castro, R.; Ariño, M.Á. Does stakeholder engagement promote sustainable innovation orientation? Ind. Manag. Data Syst. 2011, 111, 1399–1417. [Google Scholar] [CrossRef]
- Bossink, B.A. The interorganizational innovation processes of sustainable building: A Dutch case of joint building innovation in sustainability. Build. Environ. 2007, 42, 4086–4092. [Google Scholar] [CrossRef]
- Petruzzelli, A.M.; Dangelico, R.M.; Rotolo, D.; Albino, V. Organizational factors and technological features in the development of green innovations: Evidence from patent analysis. Innov. Manag. Policy Pract. 2011, 13, 291–310. [Google Scholar] [CrossRef]
- Behnam, S.; Cagliano, R.; Grijalvo, M. How should firms reconcile their open innovation capabilities for incorporating external actors in innovations aimed at sustainable development? J. Clean. Prod. 2018, 170, 950–965. [Google Scholar] [CrossRef]
- De Marchi, V. Environmental innovation and R&D cooperation: Empirical evidence from Spanish manufacturing firms. Res. Policy 2012, 41, 614–623. [Google Scholar] [CrossRef]
- Liedtke, C.; Baedeker, C.; Hasselkuß, M.; Rohn, H.; Grinewitschus, V. User-integrated innovation in Sustainable LivingLabs: An experimental infrastructure for researching and developing sustainable product service systems. J. Clean. Prod. 2015, 97, 106–116. [Google Scholar] [CrossRef]
- Lim, K.; Chesbrough, H.; Ruan, Y. Open innovation and patterns of R&D competition. Int. J. Technol. Manag. 2010, 52, 295–321. [Google Scholar] [CrossRef]
- Gemünden, H.G.; Ritter, T.; Heydebreck, P. Network configuration and innovation success: An empirical analysis in German high-tech industries. Int. J. Res. Mark. 1996, 13, 449–462. [Google Scholar] [CrossRef]
- Cassiman, B.; Di Guardo, M.C.; Valentini, G. Organizing links with science: Cooperate or contract? A project-level analysis. Res. Policy 2010, 39, 882–892. [Google Scholar] [CrossRef]
- Goodman, J.; Korsunova, A.; Halme, M. Our Collaborative Future: Activities and Roles of Stakeholders in Sustainability-Oriented Innovation. Bus. Strateg. Environ. 2017, 26, 731–753. [Google Scholar] [CrossRef]
- Matos, S.; Silvestre, B.S. Managing stakeholder relations when developing sustainable business models: The case of the Brazilian energy sector. J. Clean. Prod. 2013, 45, 61–73. [Google Scholar] [CrossRef]
- Özdemir, E.D.; Härdtlein, M.; Jenssen, T.; Zech, D.; Eltrop, L. A confusion of tongues or the art of aggregating indicators—Reflections on four projective methodologies on sustainability measurement. Renew. Sustain. Energy Rev. 2011, 15, 2385–2396. [Google Scholar] [CrossRef]
- Ayuso, S.; Rodríguez, M.A.; Ricart, J. Using stakeholder dialogue as a source for new ideas: A dynamic capability underlying sustainable innovation. Corp. Gov. Int. J. Bus. Soc. 2006, 6, 475–490. [Google Scholar] [CrossRef]
- Melane-Lavado, A.; Álvarez-Herranz, A.; González-González, I. Foreign direct investment as a way to guide the innovative process towards sustainability. J. Clean. Prod. 2018, 172, 3578–3590. [Google Scholar] [CrossRef]
- United Nations Conference on Trade and Development (UNCTAD). World Investment Report 2014: Investing in the SDGs: An Action Plan; UN: New York, NY, USA, 2014. [Google Scholar]
- Haskel, J.E.; Pereira, S.C.; Slaughter, M.J. Does inward foreign direct investment boost the productivity of domestic firms? Rev. Econ. Stat. 2007, 89, 482–496. [Google Scholar] [CrossRef]
- UNCTAD. Investment, Enterprise and Development Commission; UNCTAD: Geneva, Switzerland, 2015. [Google Scholar]
- Albulescu, C.T.; Tămăşilă, M. The impact of FDI on entrepreneurship in the European Countries. Procedia Soc. Behav. Sci. 2014, 124, 219–228. [Google Scholar] [CrossRef]
- Agosín, M.R.; Machado, R. Foreign investment in developing countries: Does it crowd in domestic investment? Oxf. Dev. Stud. 2005, 33, 149–162. [Google Scholar] [CrossRef]
- Sayek, S.; Alfaro, L.; Chanda, A.; Kalemli-Ozcan, S. FDI Spillovers, Financial Markets and Economic Development; (No. 3-186); International Monetary Fund: Washington, DC, USA, 2003. [Google Scholar]
- Iamsiraroj, S.; Doucouliagos, H. Does Growth Attract FDI; (No. 2015-18); Economics Discussion Papers; EconStor: Berlin, Germany, 2015. [Google Scholar]
- Un, C.A.; Rodríguez, A. Local and global knowledge complementarity: R&D collaborations and innovation of foreign and domestic firms. J. Int. Manag. 2018, 24, 137–152. [Google Scholar] [CrossRef]
- Holl, A.; Rama, R. Foreign subsidiaries and technology sourcing in Spain. Ind. Innov. 2014, 21, 43–64. [Google Scholar] [CrossRef] [Green Version]
- Fernández, J. Search Strategy for External Knowledge of Advanced and Developing Countries MNEs’ Subsidiaries in Spain. Available online: https://papers.ssrn.com/sol3/papers.cfm?abstract_id=2546941 (accessed on 10 April 2018).
- Kiron, D.; Kruschwitz, N.; Reeves, M.; Goh, E. The benefits of sustainability-driven innovation. MIT Sloan Manag. Rev. 2015, 54, 69. [Google Scholar] [CrossRef]
- Hansen, E.G.; Grosse-Dunker, F.; Reichwald, R. Sustainability innovation cube—A framework to evaluate sustainability-oriented innovations. Int. J. Innov. Manag. 2009, 13, 683–713. [Google Scholar] [CrossRef]
- Ardito, L.; Dangelico, R.M. Firm Environmental Performance under Scrutiny: The Role of Strategic and Organizational Orientations. Corp. Soc. Responsib. Environ. Mgmt. 2018, 25, 426–440. [Google Scholar] [CrossRef] [Green Version]
- Wagner, M.; Llerena, P. Drivers for Sustainability-Related Innovation: A Qualitative Analysis of Renewable Resources, Industrial Products and Travel Services; UDS: Strasbourg, France, 2008. [Google Scholar]
- Halme, M.; Korpela, M. Responsible innovation toward sustainable development in small and medium-sized enterprises: A resource perspective. Bus. Strateg. Environ. 2014, 23, 547–566. [Google Scholar] [CrossRef]
- Singh, R.K.; Murty, H.R.; Gupta, S.K.; Dikshit, A.K. An overview of sustainability assessment methodologies. Ecol. Ind. 2012, 15, 281–299. [Google Scholar] [CrossRef]
- Jain, D.; Tiwari, G. Sustainable mobility indicators for Indian cities: Selection methodology and application. Ecol. Indic. 2017, 79, 310–322. [Google Scholar] [CrossRef]
- Veleva, V.; Ellenbecker, M. Indicators of Sustainable Production: A new tool for promoting business sustainability. New Solut. Int. J. Environ. Health Res. 2001, 11, 41–62. [Google Scholar] [CrossRef] [PubMed]
- Azapagic, A. Systems approach to corporate sustainability: A general management framework. Process Saf. Environ. 2003, 81, 303–316. [Google Scholar] [CrossRef]
- Krajnc, D.; Glavič, P. A model for integrated assessment of sustainable development. Resour. Conserv. Recycl. 2005, 43, 189–208. [Google Scholar] [CrossRef]
- Labuschagne, C.; Brent, A.C.; Van Erck, R.P. Assessing the sustainability performances of industries. J. Clean. Prod. 2005, 13, 373–385. [Google Scholar] [CrossRef] [Green Version]
- Kinderytė, L. Methodology of sustainability indicators determination for enterprise assessment. Environ. Res. Eng. Manag. 2010, 52, 25–31. [Google Scholar]
- Keskin, G.A.; İlhan, S.; Özkan, C. The Fuzzy ART algorithm: A categorization method for supplier evaluation and selection. Expert Syst. Appl. 2010, 37, 1235–1240. [Google Scholar] [CrossRef]
- Zhu, Q.; Dou, Y.; Sarkis, J. A portfolio-based analysis for green supplier management using the analytical network process. Supply Chain Manag. 2010, 15, 306–319. [Google Scholar] [CrossRef]
- Büyüközkan, G.; Çifçi, G. A novel fuzzy multi-criteria decision framework for sustainable supplier selection with incomplete information. Comput. Ind. 2011, 62, 164–174. [Google Scholar] [CrossRef]
- Punniyamoorthy, M.; Mathiyalagan, P.; Parthiban, P. A strategic model using structural equation modeling and fuzzy logic in supplier selection. Expert Syst. Appl. 2011, 38, 458–474. [Google Scholar] [CrossRef]
- Govindan, K.; Khodaverdi, R.; Jafarian, A. A fuzzy multi criteria approach for measuring sustainability performance of a supplier based on triple bottom line approach. J. Clean. Prod. 2013, 47, 345–354. [Google Scholar] [CrossRef]
- Feil, A.A.; de Quevedo, D.M.; Schreiber, D. Selection and identification of the indicators for quickly measuring sustainability in micro and small furniture industries. Sustain. Prod. Consum. 2015, 3, 34–44. [Google Scholar] [CrossRef]
- Dočekalová, M.P.; Kocmanová, A. Composite indicator for measuring corporate sustainability. Ecol. Ind. 2016, 61, 612–623. [Google Scholar] [CrossRef]
- Medel-González, F.; García-Ávila, L.F.; Salomon, V.A.P.; Marx-Gómez, J.; Hernández, C.T. Sustainability performance measurement with Analytic Network Process and balanced scorecard: Cuban practical case. Production 2016, 26, 527–539. [Google Scholar] [CrossRef] [Green Version]
- Azapagic, A.; Perdan, S. Indicators of sustainable development for industry: A general framework. Process Saf. Environ. 2000, 78, 243–261. [Google Scholar] [CrossRef]
- Azapagic, A. Developing a framework for sustainable development indicators for the mining and minerals industry. J. Clean. Prod. 2004, 12, 639–662. [Google Scholar] [CrossRef]
- Singh, R.K.; Murty, H.R.; Gupta, S.K.; Dikshit, A.K. Development of composite sustainability performance index for steel industry. Ecol. Ind. 2007, 7, 565–588. [Google Scholar] [CrossRef]
- Arbačiauskas, V.; Staniškis, J. Sustainability performance indicators for industrial enterprise management. Environ. Res. Eng. Manag. 2009, 48, 42–50. [Google Scholar]
- Erol, I.; Cakar, N.; Erel, D.; Sari, R. Sustainability in the Turkish retailing industry. Sustain. Dev. 2009, 17, 49–67. [Google Scholar] [CrossRef] [Green Version]
- Bai, C.; Sarkis, J. Integrating sustainability into supplier selection with grey system and rough set methodologies. Int. J. Prod. Econ. 2010, 124, 252–264. [Google Scholar] [CrossRef]
- Tokos, H.; Pintarič, Z.N.; Krajnc, D. An integrated sustainability performance assessment and benchmarking of breweries. Clean Technol. Environ. 2012, 14, 173–193. [Google Scholar] [CrossRef]
- Zhou, L.; Tokos, H.; Krajnc, D.; Yang, Y. Sustainability performance evaluation in industry by composite sustainability index. Clean Technol. Environ. 2012, 14, 789–803. [Google Scholar] [CrossRef]
- Li, T.; Zhang, H.; Yuan, C.; Liu, Z.; Fan, C. A PCA-based method for construction of composite sustainability indicators. Int. J. Life Cycle Assess. 2012, 17, 593–603. [Google Scholar] [CrossRef]
- Shuaib, M.; Seevers, D.; Zhang, X.; Badurdeen, F.; Rouch, K.E.; Jawahir, I.S. Product sustainability index (ProdSI). J. Ind. Ecol. 2014, 18, 491–507. [Google Scholar] [CrossRef]
- Krajnc, D.; Glavič, P. Indicators of sustainable production. Clean Technol. Environ. 2003, 5, 279–288. [Google Scholar] [CrossRef]
- De Medeiros, J.F.; Ribeiro, J.L.D.; Cortimiglia, M.N. Success factors for environmentally sustainable product innovation: A systematic literature review. J. Clean. Prod. 2014, 65, 76–86. [Google Scholar] [CrossRef]
- Tidd, J.; Bessant, J.R.; Pavitt, K. Managing Innovation: Integrating Technological, Market and Organizational Change; John Wiley & Sons Inc.: Hoboken, NJ, USA, 2009. [Google Scholar]
- Jones, J.; de Zubielqui, G.C. Doing well by doing good: A study of university-industry interactions, innovations and firm performance in sustainability-oriented Australian SMEs. Technol. Forecast. Soc. 2017, 123, 262–270. [Google Scholar] [CrossRef]
- Cainelli, G.; De Marchi, V.; Grandinetti, R. Does the development of environmental innovation require different resources? Evidence from Spanish manufacturing firms. J. Clean. Prod. 2015, 94, 211–220. [Google Scholar] [CrossRef]
- Johnson, M.P. Knowledge acquisition and development in sustainability-oriented small and medium-sized enterprises: Exploring the practices, capabilities and cooperation. J. Clean. Prod. 2017, 142, 3769–3781. [Google Scholar] [CrossRef]
- Lopes, C.M.; Scavarda, A.; Hofmeister, L.F.; Thomé, A.M.T.; Vaccaro, G.L.R. An analysis of the interplay between organizational sustainability, knowledge management, and open innovation. J. Clean. Prod. 2017, 142, 476–488. [Google Scholar] [CrossRef]
- Ghisetti, C.; Marzucchi, A.; Montresor, S. The open eco-innovation mode. An empirical investigation of eleven European countries. Res. Policy 2015, 44, 1080–1093. [Google Scholar] [CrossRef]
- De Marchi, V.; Grandinetti, R. Knowledge strategies for environmental innovations: The case of Italian manufacturing firms. J. Knowl. Manag. 2013, 17, 569–582. [Google Scholar] [CrossRef]
- Lee, K.H.; Kim, J.W. Integrating suppliers into green product innovation development: An empirical case study in the semiconductor industry. Bus. Strateg. Environ. 2011, 20, 527–538. [Google Scholar] [CrossRef]
- Schiederig, T.; Tietze, F.; Herstatt, C. Green innovation in technology and innovation management–an exploratory literature review. R D Manag. 2012, 42, 180–192. [Google Scholar] [CrossRef]
- Mousavi, S.; Bossink, B.A. Firms’ capabilities for sustainable innovation: The case of biofuel for aviation. J. Clean. Prod. 2017, 167, 1263–1275. [Google Scholar] [CrossRef]
- Aschehoug, S.H.; Boks, C.; Storen, S. Environmental information from stakeholders supporting product development. J. Clean. Prod. 2012, 31, 1–13. [Google Scholar] [CrossRef]
- Najafi-Tavani, S.; Najafi-Tavani, Z.; Naudé, P.; Oghazi, P.; Zeynaloo, E. How collaborative innovation networks affect new product performance: Product innovation capability, process innovation capability, and absorptive capacity. Ind. Mark. Manag. 2018, 73, 193–205. [Google Scholar] [CrossRef]
- Lund Vinding, A. Absorptive capacity and innovative performance: A human capital approach. Econ. Innov. New Technol. 2006, 15, 507–517. [Google Scholar] [CrossRef] [Green Version]
- Han, S.Y.; Bae, S.J. Internalization of R&D outsourcing: An empirical study. Int. J. Prod. Econ. 2014, 150, 58–73. [Google Scholar] [CrossRef]
- Ferreras-Méndez, J.L.; Newell, S.; Fernández-Mesa, A.; Alegre, J. Depth and breadth of external knowledge search and performance: The mediating role of absorptive capacity. Ind. Mark. Manag. 2015, 47, 86–97. [Google Scholar] [CrossRef]
- Lewin, A.Y.; Massini, S.; Peeters, C. Microfoundations of internal and external absorptive capacity routines. Organ. Sci. 2011, 22, 81–98. [Google Scholar] [CrossRef]
- Cave, A. Environmentally responsible management in international business: A literature review. Multinatl. Bus. Rev. 2014, 22, 78–102. [Google Scholar] [CrossRef]
- Cantwell, J.; Dunning, J.H.; Lundan, S.M. An evolutionary approach to understanding international business activity: The co-evolution of MNEs and the institutional environment. J. Int. Bus. Stud. 2010.41, 567–586. [CrossRef]
- Hsu, C.W.; Lien, Y.C.; Chen, H. R&D internationalization and innovation performance. Int. Bus. Rev. 2015, 24, 187–195. [Google Scholar] [CrossRef]
- Castellani, D.; Zanfei, A. Internationalization, innovation and productivity: How do firms differ in Italy? World Econ. 2007.30, 156–176. [CrossRef]
- Cantwell, J.; Iammarino, S. Multinational corporations and the location of technological innovation in the UK regions. Reg. Stud. 2000, 34, 317–332. [Google Scholar] [CrossRef]
- Vahter, P. Does FDI Spur Innovation, Productivity and Knowledge Sourcing by Incumbent Firms? Evidence from Manufacturing Industry in Estonia. Available online: https://papers.ssrn.com/sol3/papers.cfm?abstract_id=1601215 (accessed on 10 September 2018).
- Narula, R. Exploring the paradox of competence-creating subsidiaries: Balancing bandwidth and dispersion in MNEs. Long Range Plan. 2014, 47, 4–15. [Google Scholar] [CrossRef]
- Meyer, K.E.; Mudambi, R.; Narula, R. Multinational enterprises and local contexts: The opportunities and challenges of multiple embeddedness. J. Manag. Stud. 2011, 48, 235–252. [Google Scholar] [CrossRef]
- Guimón, J.; Chaminade, C.; Maggi, C.; Salazar-Elena, J.C. Policies to attract R&D-related FDI in small emerging countries: Aligning incentives with local linkages and absorptive capacities in Chile. J. Int. Manag. 2017, 2, 165–178. [Google Scholar] [CrossRef]
- Colakoglu, S.; Yamao, S.; Lepak, D.P. Knowledge creation capability in MNC subsidiaries: Examining the roles of global and local knowledge inflows and subsidiary knowledge stocks. Int. Bus. Rev. 2014, 23, 91–101. [Google Scholar] [CrossRef]
- Cozza, C.; Perani, G.; Zanfei, A. Multinationals and R&D cooperation: Empirical evidence from the Italian R&D survey. Econ Polit. 2018, 35, 601–621. [Google Scholar] [CrossRef]
- García-Sánchez, A.; Molero, J.; Rama, R. Patterns of local R&D cooperation of foreign subsidiaries in an intermediate country: Innovative and structural factors. Int. J. Technol. Transf. Commer. 2017, 15, 38–64. [Google Scholar] [CrossRef]
- Guimón, J.; Salazar-Elena, J.C. Collaboration in innovation between foreign subsidiaries and local universities: Evidence from Spain. Ind. Innov. 2015, 22, 445–466. [Google Scholar] [CrossRef]
- García-Sánchez, A.; Molero, J.; Rama, R. Are ‘the best’foreign subsidiaries cooperating for innovation with local partners? The case of an intermediate country. Sci. Publ. Policy 2015, 43, 532–545. [Google Scholar] [CrossRef]
- Van Beers, C.; Berghäll, E.; Poot, T. R&D internationalization, R&D collaboration and public knowledge institutions in small economies: Evidence from Finland and the Netherlands. Res. Policy 2008, 37, 294–308. [Google Scholar] [CrossRef] [Green Version]
- Lucena, A.; Roper, S. Absorptive capacity and ambidexterity in R&D: Linking technology alliance diversity and firm innovation. Eur. Manag. Rev. 2016, 13, 159–178. [Google Scholar] [CrossRef]
- Przychodzen, W.; Przychodzen, J. Sustainable innovations in the corporate sector–The empirical evidence from IBEX 35 firms. J. Clean. Prod. 2018, 172, 3557–3566. [Google Scholar] [CrossRef]
- Rehfeld, K.; Rennings, K.; Ziegler, A. Integrated product policy and environmental product innovations: An empirical analysis. Ecol. Econ. 2007, 61, 91–100. [Google Scholar] [CrossRef] [Green Version]
- Kammerer, D. The effects of customer benefit and regulation on environmental product innovation: Empirical evidence from appliance manufacturers in Germany. Ecol. Econ. 2009, 68, 2285–2295. [Google Scholar] [CrossRef]
- Pardo, A.; Ruiz, M.Á. SPSS 11: Guia Para el Analisis de Datos; Mc Graw Hill: New York, NY, USA, 2002. [Google Scholar]
- Hosseini, H.M.; Kaneko, S. Dynamic sustainability assessment of countries at the macro level: A principal component analysis. Ecol. Ind. 2011, 11, 811–823. [Google Scholar] [CrossRef]
- Shaw, P.J. Multivariate Statistics for the Environmental Sciences; Wiley: Hoboken, NJ, USA, 2009. [Google Scholar]
- Yeheyis, M.; Hewage, K.; Alam, M.S.; Eskicioglu, C.; Sadiq, R. An overview of construction and demolition waste management in Canada: A lifecycle analysis approach to sustainability. Clean Technol. Environ. 2013, 15, 81–91. [Google Scholar] [CrossRef]
- Hair, J.F.; Anderson, R.E.; Babin, B.J.; Black, W.C. Multivariate Data Analysis: A Global Perspective; Pearson: Upper Saddle River, NJ, USA, 2010; Volume 7. [Google Scholar]
- Arbussa, A.; Coenders, G. Innovation activities, use of appropriation instruments and absorptive capacity: Evidence from Spanish firms. Res. Policy 2007, 36, 1545–1558. [Google Scholar] [CrossRef]
- Martinez-Senra, A.I.; Quintás, M.A.; Sartal, A.; Vázquez, X.H. How can firms’ basic research turn into product innovation? The role of absorptive capacity and industry appropriability. IEEE Trans. Eng. Manag. 2015, 62, 205–216. [Google Scholar] [CrossRef]
- Badillo, E.R.; Moreno, R. Does absorptive capacity determine collaboration returns to innovation? A geographical dimension. Ann. Reg. Sci. 2015, 60, 473–499. [Google Scholar] [CrossRef]
- Martinez, M.G.; Zouaghi, F.; Garcia, M.S. Capturing value from alliance portfolio diversity: The mediating role of R&D human capital in high and low-tech industries. Technovation 2017, 59, 55–67. [Google Scholar] [CrossRef]
- Un, C.A. Absorptive capacity and R&D outsourcing. J. Eng. Technol. Manag. 2017, 43, 34–47. [Google Scholar] [CrossRef]
- European Commission. Small and Medium-Sized Enterprises. 2012. Available online: http://ec.europa.eu/enterprise/policies/sme/facts-figures-analysis/ sme-definition/index_en.htm (accessed on 20 March 2018).
- Howard, P.H.; Jaffee, D. Tensions between firm size and sustainability goals: Fair trade coffee in the United States. Sustainability 2013, 5, 72–89. [Google Scholar] [CrossRef]
- Hockerts, K.; Wüstenhagen, R. Greening Goliaths versus emerging David’s—Theorizing about the role of incumbents and new entrants in sustainable entrepreneurship. J. Bus. Ventur. 2010, 25, 481–492. [Google Scholar] [CrossRef]
- Claver-Cortés, E.; Marco-Lajara, B.; Manresa-Marhuenda, E.; García-Lillo, F.; Seva-Larrosa, P. Location decisions and agglomeration economies: Domestic and foreign companies. Reg. Stud. 2017, 39, 99–135. [Google Scholar]
- Calvo-Flores, A.; García, D.; Madrid, A. Tamaño, Antigüedad y Fracaso Empresarial. Working Paper. 2006. Available online: https://www.uv.es/catedra-aeca/workshop/files/files/SP1_Calvo_Garcia_Madrid.pdf (accessed on 20 April 2018).
Figure 1.
Orientation towards sustainability for SMEs with foreign direct investment (FDI). Source: prepared by the authors. Note: the value represents the odds ratio. (**), (***) significant coefficients up to 5% and 1%.
Figure 1.
Orientation towards sustainability for SMEs with foreign direct investment (FDI). Source: prepared by the authors. Note: the value represents the odds ratio. (**), (***) significant coefficients up to 5% and 1%.

Figure 2.
Orientation towards sustainability for SMEs without foreign direct investment (NFDI). Source: prepared by the authors. Note: the value represents the odds ratio. (**), (***) significant coefficients up to 5% and 1%.
Figure 2.
Orientation towards sustainability for SMEs without foreign direct investment (NFDI). Source: prepared by the authors. Note: the value represents the odds ratio. (**), (***) significant coefficients up to 5% and 1%.

Figure 3.
Orientation towards sustainability of large companies with foreign direct investment (FDI). Source: prepared by the authors. Note: the value represents the odds ratio. (**), (***) significant coefficients up to 5% and 1%.
Figure 3.
Orientation towards sustainability of large companies with foreign direct investment (FDI). Source: prepared by the authors. Note: the value represents the odds ratio. (**), (***) significant coefficients up to 5% and 1%.

Figure 4.
Orientation towards sustainability of large companies without foreign direct investment (NFDI). Source: prepared by the authors. Note: the value represents the odds ratio. (**), (***) significant coefficients up to 5% and 1%.
Figure 4.
Orientation towards sustainability of large companies without foreign direct investment (NFDI). Source: prepared by the authors. Note: the value represents the odds ratio. (**), (***) significant coefficients up to 5% and 1%.

Table 1.
Review of the literature on sustainable criteria.
| Factor | Items | Authors |
|---|---|---|
| Economic sustainability criteria | Market shares Production Commercial opportunities | [35,36,37,38,39,40,41,42,43,44,45,46,47] |
| Environmental sustainability criteria | Use of energy Use of materials Environmental impact Compliance with environmental regulations | [34,35,36,37,38,39] [41] [44,45,46,47,48,49,50,51,52,53,54,55,56,57] |
| Social sustainability criteria | Customer satisfaction Employee health Employee security Employment creation Employment stability Qualified jobs | [34,35,36,37,38,39,40] [44,45,46] [48,49,50] [54,55,56,57,58] |
Source: prepared by the authors.
Table 2.
Studies on the relationship between cooperation and sustainable innovation.
| Authors | Purpose | Actors Involved | Result | Methodology |
|---|---|---|---|---|
| [7] | To examine open innovation capabilities when innovations are particularly focused on sustainable development | Research institution Employees Users Suppliers External agents Competitors | For innovations to develop a sustainable product or service, preestablished, open conventional innovation capabilities can be used | Multiple-case study |
| [63] | This paper investigates the ability of sustainability-oriented small and medium-sized enterprises to acquire and develop explicit knowledge required for an environmental management system and related tools | Strategic alliances with suppliers and customers | Proactive approaches to acquiring knowledge are complemented by structured interaction with external stakeholders | Qualitative interviews and content analyses |
| [64] | This paper explores the case of a Brazilian family-owned company of rubber-based products, operating in the sectors of health, education, and coatings, which, based on organizational sustainability, uses knowledge to develop open innovations aimed at promoting sustainable innovation | Customers Industry Schools in the region and the country Health professionals Suppliers | Organizational survival depends directly on the actions of creating new ideas and innovation cycles and, moreover, allowing interaction among stakeholders | Exploratory single case study |
| [61] | To find out the effect of university-business interactions on the performance of SOI in SMEs | Universities | The interaction between Universities and Business leads to greater productivity and sales of SOI | Structural equation modelling |
| [65] | This paper deals with the open innovation mode in the environmental realm and investigates the effects that knowledge sourcing has on firms’ environmental innovations | Cooperation without distinction of partner Depth, as the number of external sources of information to which the company attributes a high degree of importance Diversity, as the number of information sources from external companies that depend on the company for their innovation activities | Both the variety and the intensity of the company’s search for external knowledge can help the decision to introduce an environmental innovation | Hierarchical econometric models |
| [62] | To provide a comprehensive framework for understanding the specific role of—internal, external and hybrid—resources in environmental innovation | External companies or institutions | Green innovators seem to be characterised by more intensive external relationships | Probit models |
| [9] | To create a methodological framework to accompany the innovation of sustainable product services | Customers | Strong influence of user habits on the consumption of heating energy and shows the starting points for the development of sustainable product services | Case study |
| [1] | This paper connected responsible innovation with open knowledge networks | Opening capacity Diversity opening | Responsible innovation drives openness with regard to capacity and diversity | Exploratory quantitative approach and case study |
| [2] | To integrate knowledge and competencies from outside of the firm on green product development | Collaboration networks External knowledge links | External knowledge links play a key role in the integration of principles of environmental sustainability into the manufacturing process | Regression analysis in two steps |
| [66] | This paper investigates how green innovators address the knowledge needs that emerge when initiating a pathway of sustainability | Important as a source of information for: Suppliers Clientele Competitors KIBS Universities Public research centres Others Diversity of cooperation Cooperation with foreign partners (% of companies) | The authors’ results suggest that the development of EIs entails a higher recourse to external knowledge, in the form of the use of external information sources, acquiring R&D from external firms and cooperation. Relationships with partners that do not belong to the supply chain—including KIBS, universities, research institutions and competitors—are far more important than for other innovations | ANOVA |
| [67] | This paper explores the role of suppliers in enhancing the manufacturer’s ability to successfully carry out green innovation in product development | Suppliers | There is a strong link between environmental compliance and new green product developments. Involving key suppliers in green new product development for environmentally demanding customers and markets can bring both environmental and commercial success | Case study |
Source: prepared by the authors.
Table 3.
Cooperation patterns of foreign vs. national companies.
| Authors | Purpose | Cooperation | Difference | Methodology |
|---|---|---|---|---|
| [86] | To explore the effects of multinationality on the propensity to R&D cooperation, considering subsidiaries of foreign MNEs and domestic owned MNEs | Cooperation with Italian counterparts Cooperation with foreign counterparts | Foreign MNEs are better at R&D cooperation with foreign partners, but it is domestic-owned MNEs that exhibit the highest propensity to R&D cooperation with local firms. By contrast, foreign MNEs have much the same propensity to enter local R&D cooperation as non-MNEs | Probit regressions with random effects |
| [25] | To analyze how research and development (R&D) cooperation affects product innovation for subsidiaries of foreign multinational firms and domestic firms | Universities Customers Suppliers Competitors | Subsidiaries may benefit more from undertaking R&D cooperation with customers and competitors, whose deeper knowledge of local conditions better complements the more global knowledge base of subsidiaries. In contrast, domestic firms may benefit more from engaging in R&D cooperation with suppliers and universities, whose more global nature of knowledge better complement the deeper local knowledge base of domestic firms | Probit regressions with random effects |
| [87] | To contribute a better understanding of cooperative innovation patterns of foreign subsidiaries in Spain, looking more closely at sectoral taxonomy. Attention is focused more on innovative intensive subsidiaries and innovation and structural-competitive variables are combined to explain local cooperation | Company has cooperated with external partners (own business group excluded) located in Spain | More intense cooperation of FS with local agents in dynamic specialisation sectors. Cooperative activities are influenced by economic-structural factors of the Spanish economy. Cooperative strategies of domestic firms might also have an influence on those foreign subsidiaries | Logit |
| [88] | To explore differences between the propensity to cooperate with universities of foreign subsidiaries and Spanish firms | Universities | Relevant differences between foreign subsidiaries and local groups or companies in terms of their propensity to cooperate with universities | Probit Case study |
| [89] | To understand the relationship between foreign status and local cooperation for innovation | Company has cooperated with external partners (own business group excluded) located in Spain Extent of local cooperative activities Local R&D networks | Foreign status increases the probability of local cooperation for innovation | Logit |
| [26] | To compare the technology sourcing of foreign subsidiaries and domestic firms looking at domestic R&D outsourcing, international R&D outsourcing, domestic cooperation for innovation and international cooperation for innovation | Cooperation with an unaffiliated partner in Spain Cooperation with an unaffiliated partner in another country | Foreign subsidiaries show a lesser propensity for external technology sourcing via R&D outsourcing from independent firms in the host country, for international R&D outsourcing and for international cooperation for innovation. In contrast, foreign subsidiaries show a greater propensity for domestic cooperation for innovation | Multivariate probit |
| [27] | To examine how the search strategy for external knowledge differs between domestic companies in Spain and foreign subsidiaries from developed and developing countries | Companies with external R&D collaboration agreements | Subsidiaries from developing countries draw upon more external knowledge sources than subsidiaries from developed countries; while both types of firms have a less intensive search strategy than domestic firms | Tobit |
| [90] | To investigate domestic and foreign innovating firms’ determinants of R&D cooperation with domestic universities and public knowledge institutes in Finland and the Netherlands | R&D cooperation with domestic public knowledge institutions | Foreign firms in the Netherlands are less likely to cooperate with domestic public knowledge institutions than domestic firms, while in Finland no significant difference can be detected | Heckman probit estimates |
Source: prepared by the authors.
Table 4.
Results of the logistic regression.
| Independent Variable | SMEs NFDI | SMEs FDI | BIG NFDI | BIG FDI | ||||
|---|---|---|---|---|---|---|---|---|
| R + D + iit | β | Odds Ratio | β | Odds Ratio | β | Odds Ratio | β | Odds Ratio |
| Constant | 0.56 | 0.57 | −0.71 | 0.49 | −0.2 | 0.82 | −0.29 | 0.75 |
| Control variables | ||||||||
| S2 | 0.34 *** | 1.4 | 0.86 *** | 2.35 | ||||
| S3 | 0.57 *** | 1.77 | 0.31 *** | 1.37 | ||||
| S4 | −0.42 *** | 0.66 | −0.41 *** | 0.66 | ||||
| Indicators of Sustainable Objectives | ||||||||
| ISO1 | 0.47 *** | 1.6 | 0.38 *** | 1.47 | 0.47 *** | 1.59 | 0.39 *** | 1.48 |
| ISO2 | 0.14 *** | 1.15 | 0.21 *** | 1.23 | 0.14 *** | 1.15 | 0.18 *** | 1.2 |
| ISO3 | 0.09 *** | 1.1 | 0.15 ** | 1.16 | 0.09 *** | 1.09 | 0.15 ** | 1.16 |
| Cooperation | ||||||||
| C4 | 0.67 *** | 1.96 | 1.12 *** | 3.08 | 0.67 *** | 1.95 | 1.2 *** | 3.32 |
| C5 | 0.27 *** | 1.31 | 0.28 *** | 1.32 | ||||
| C6 | 0.64 *** | 1.89 | 1.64 *** | 5.16 | 0.64 *** | 1.9 | 1.64 *** | 5.14 |
| Absorptive capacity | ||||||||
| I1 | 1.1 *** | 3.01 | 0.82 *** | 2.28 | 1.11 *** | 3.05 | 0.80 *** | 2.24 |
| I2 | −0.35 *** | 0.7 | −0.33 *** | 0.72 | ||||
| I3 | 0.46 *** | 1.58 | 0.27 *** | 1.31 | 0.45 *** | 1.57 | 0.28 *** | 1.33 |
| I6 | 0.57 *** | 1.76 | 1.01 *** | 2.73 | 0.58 *** | 1.78 | 1.004 *** | 2.73 |
| P1 | −0.37 *** | 0.69 | −0.3 *** | 0.74 | ||||
| P2 | 0.1 *** | 1.1 | 0.19 ** | 1.21 | 0.11 *** | 1.12 | 0.21 ** | 1.23 |
| P3 | 0.33 ** | 1.38 | 0.29 ** | 1.34 | ||||
| P4 | 0.25 *** | 1.28 | −0.47 *** | 0.62 | 0.19 *** | 1.2 | −0.44 *** | 0.64 |
| Moderating variables | ||||||||
| C1*P1 | 0.25 ** | 1.28 | ||||||
| C1*P2 | 0.61 *** | 1.84 | 0.61 *** | 1.83 | ||||
| C1*P3 | −0.53 ** | 0.59 | −0.52 ** | 0.59 | ||||
| C3*P3 | −0.96 ** | 0.38 | −1.06 *** | 0.34 | ||||
| C6*P1 | −1.23 *** | 0.29 | −1.19 *** | 0.3 | ||||
| C6*P2 | −0.93 ** | 0.4 | ||||||
| C6*P3 | 2.01 ** | 7.47 | 2.33 ** | 10.24 | ||||
| C2*ISO2 | 0.54 *** | 1.72 | 0.50 *** | 1.65 | ||||
| C3*ISO2 | −0.22 *** | 0.8 | −0.38 ** | 0.68 | −0.21 *** | 0.81 | ||
| C6*ISO1 | 0.81 *** | 2.25 | 0.79 *** | 2.21 | ||||
| C6*ISO3 | −0.66 *** | 0.51 | −0.58 ** | 0.56 | ||||
| P1*ISO3 | 0.22 *** | 1.25 | 0.23 *** | 1.26 | ||||
| P4*ISO3 | −0.37 *** | 0.69 | −0.39 *** | 0.68 | ||||
| C2*P2*ISO3 | −0.86 *** | 0.42 | −0.86 *** | 0.42 | ||||
| C2*P3*ISO3 | 0.63 ** | 1.87 | ||||||
| C5*P1*ISO2 | 0.34 *** | 1.41 | 0.35 *** | 1.42 | ||||
| C5*P2*ISO2 | −0.41 ** | 0.66 | −0.41 ** | 0.66 | ||||
| C5*P4*ISO2 | 1.02 ** | 2.77 | ||||||
| C5*P1*ISO3 | −0.26 ** | 0.77 | −0.27 ** | 0.76 | ||||
| C5*P3*ISO3 | −0.42 ** | 0.66 | −0.39 ** | 0.68 | ||||
| C6*P2*ISO2 | 1.09 ** | 2.98 | 1.32 *** | 3.73 | ||||
| Number of cases | 28,536 | 5646 | 28,536 | 5646 | ||||
| Omnibus test | 6005.662 (23) | 0.0E0 | 1576.629 (37) | 1.4647E-307 | 5925.798 (21) | 0.0E0 | 1561.328 (35) | 2.5953E-304 |
| Nagelkerke’s R2 | 0.334 | 0.424 | 0.330 | 0.420 | ||||
| Hosmer−Lemeshow test | 39.069 (8) | 0.0512 | 46.328 (8) | 0.0549 | 42.506 (8) | 0.0533 | 28.804 (8) | 0.0656 |
| Percentage of correct predictions: | 71.3 | 76.9 | 71.4 | 76.4 | ||||
Source: prepared by the authors. Note: ** and *** significant coefficients up to 5% and 1%, respectively.
Table 5.
Comparison of the moderator effect between companies with foreign direct investment (FDI) vs without foreign direct investment (NFDI).
Table 5.
Comparison of the moderator effect between companies with foreign direct investment (FDI) vs without foreign direct investment (NFDI).
| Innovative Companies with Foreign Direct Investment (FDI) | Innovative Companies without Foreign Direct Investment (NFDI) |
|---|---|
| Economic sustainability through cooperation with universities | |
| Environmental sustainability through university-based learning and cooperation with the provider | Environmental sustainability through learning from consultants, thanks to qualified workforce not exceeding 25% |
| Social sustainability through human capital, generating learning from consultants if this is very high |
Source: prepared by the authors.
© 2018 by the authors. Licensee MDPI, Basel, Switzerland. This article is an open access article distributed under the terms and conditions of the Creative Commons Attribution (CC BY) license (http://creativecommons.org/licenses/by/4.0/).
Share and Cite
MDPI and ACS Style
Melane-Lavado, A.; Álvarez-Herranz, A. Different Ways to Access Knowledge for Sustainability-Oriented Innovation. The Effect of Foreign Direct Investment. Sustainability 2018, 10, 4206. https://doi.org/10.3390/su10114206
AMA Style
Melane-Lavado A, Álvarez-Herranz A. Different Ways to Access Knowledge for Sustainability-Oriented Innovation. The Effect of Foreign Direct Investment. Sustainability. 2018; 10(11):4206. https://doi.org/10.3390/su10114206
Chicago/Turabian StyleMelane-Lavado, Alberto, and Agustín Álvarez-Herranz. 2018. "Different Ways to Access Knowledge for Sustainability-Oriented Innovation. The Effect of Foreign Direct Investment" Sustainability 10, no. 11: 4206. https://doi.org/10.3390/su10114206
Note that from the first issue of 2016, this journal uses article numbers instead of page numbers. See further details here.