Article

Heritage Image and Attitudes toward a Heritage Site: Do They Really Mediate the Relationship between User-Generated Content and Travel Intentions toward a Heritage Site?

by
Shafaqat Mehmood
1,2,†,
Changyong Liang
1,† and
Dongxiao Gu
1,*,†
1
School of Management, Hefei University of Technology, Hefei 230009, China
2
School of Accounting and Finance, Faculty of Management Studies, University of Central Punjab, 1-Khayaban-e-Jinnah Road, Johar Town, Lahore 54000, Pakistan
*
Author to whom correspondence should be addressed.
All authors contributed equally and share equal first authorship rights.
Sustainability 2018, 10(12), 4403; https://doi.org/10.3390/su10124403
Submission received: 11 October 2018 / Revised: 16 November 2018 / Accepted: 18 November 2018 / Published: 25 November 2018
(This article belongs to the Special Issue Heritage Tourism)

Abstract

:
Traveling to heritage sites represents a growing sector with great potential in the context of heritage tourism, which is a relevant topic but has received little scholarly attention. The present study tries to bridge this gap by investigating the mediating role of heritage image and attitudes toward a heritage site in the relationship between user-generated content (UGC) and travel intention toward a heritage site. In particular, we applied partial least squares structural equation modeling (PLS-SEM), which is a relatively popular new method, instead of the traditionally used covariance-based structural equation modeling (CB-SEM) method. The rise in popularity of PLS-SEM has been particularly noticeable since 2013, but in the area of heritage tourism, research is still in an early stage of development because the heritage discipline has hardly exploited the benefits of this approach. We proposed a multimediation model for heritage tourism to address this relatively new research avenue. It was discovered that exogenous variables directly and indirectly influenced travel intentions toward a heritage site through their mediators (i.e., heritage image and attitudes toward a heritage site). The findings provide an appropriate empirical and theoretical conclusion as well as valuable insights for heritage management organizations (HMOs) into the performance of heritage tourism, both for local professionals and the host communities that assist in increasing the development of heritage tourism.

1. Introduction

Nowadays in social science, especially in heritage tourism studies, one topic that has attracted the attention of academics and researchers alike is the extensive evaluation of heritage image, the attitude of tourists toward heritage sites, and, more importantly, travel intentions [1,2,3]. Heritage image is positively associated with the tourist’s acuities and the quality of the destination [1]. Rindell [4] stated [2] that heritage image represents “the temporal dimension in the tourist’s impression of cultural heritage sites”. According to Keller [5], corporate image can be defined as “perceptions of an organization reflected in the associations held in the consumer’s memory”. The concept of heritage image was generated based on the findings of empirical studies, which were focused on the consumer’s corporate image. This concept is expected to be a valuable conceptual framework to realize the role of the past on the present heritage image formation of travelers. However, few academics and researchers have paid attention to exploring heritage image measurement in the context of the international tourism industry [1,2,6].
The influence of the destination image on a tourist’s mind is very significant in the selection of favorite destinations for probable trips, and also influences future intentions for those specific tourist places [7]. Previous studies have also emphasized important elements that have a significant impact on destination image improvement [8,9], intention to travel [10,11,12], and attitudes toward a destination [13,14,15]. The identification of the most relevant factors that influence image, attitude, and travel intention [16] could help to find and classify target markets. However, the literature is still very limited, and emphasizes the forces affecting the development of heritage image attitude and travel intention toward heritage sites. Beerli and Martin [17] stated that personal features and information sources were two of the major motivating factors. Information sources were more important than personal factors in the context of the formation of destination perceptions prior to probable visiting [18]. Destination image and the selection of the destination were significantly influenced by the information sources that a tourist obtained [19]. According to Baloglu and McCleary [7], out of six types of information sources (i.e., word-of-mouth (WOM), advertisements, books, news, movies, and professional advice), WOM positively and significantly affected the image of a destination, travel intention, and attitudes toward a destination.
WOM is defined as the information shared by individuals through face-to-face communication and electronic WOM (e-WOM). e-WOM denotes the information shared by the individual using commercial and noncommercial electronic channels. In accordance with the marketing perspective, WOM is now an important topic and is a strategic player in marketing monopoly difference and the decision-making process, as it also helps to reduce the chances of risk and uncertainty [20]. WOM has been considered one of the strongest believable and truthful channels of communication, and it also affects intellectual destination image [17]. There is still a lack of investigation into explaining the unique effects of different sources of information. Categorically, WOM has two major forms, traditional WOM and e-WOM, where e-WOM allows people to share ideas, opinions, and experiences with each other using electronic communication platforms (e.g., social websites, emails, chat rooms, and online reviews) [20]. There are two types of e-WOM, commercial and user-generated content (UGC). In the case of commercial e-WOM, people share information via commercial channels such as commercial trip advisors and company websites. However, in the case of UGC, personal and UGC channels are used by individuals to share information. Traditional WOM and commercial e-WOM have been recognized as the most prominent and influential sources of information that can influence customer attitudes, behavioral intentions [21], and destination image [22].
Recent studies have indicated that traditional WOM and commercial e-WOM, among other information sources, have positive and significance influences on visit intention, destination image, and attitudes toward the destination [10,11,13,14,16,23]. In fact, previous studies have not paid particular attention and have focused on heritage image and UGC, which are important antecedents to attitude and travel intention toward a specific destination [1,24]. The use of mobile internet has increased globally day by day, and helps tourists interact virtually on one platform [25]. This has led to new research avenues that are relevant to the important role of e-WOM (i.e., commercial and UGC) in the reinvention and acquisition of tourists in the era of e-commerce [26]. At least 35% of online spending belongs to travel-related activities, whereas more than 74.2% of tourists use the reviews, comments, and opinions of other travelers as a source of information when making plans to travel [27]. The online opinions, reviews, and comments of other travelers are frequently considered as more likely to provide reliable, enjoyable, and up-to-date available information when compared to contents posted or published by travel service providers [28]. Therefore, UGC is generally considered to be more reliable [24,29]. Many customers share their point of view or experiences with friends and family members regarding the products or services they have used in the past. In particular, Kinard and Capella [30] mentioned that consumers gave importance to reviews, suggestions, and advice from experienced people with regard to the services relevant to the area of tourism and hospitality. Senecal and Nante [28] documented that it was more important to review the comments or information related to products or services from consumers before purchasing or using them. Zarrad and Debabi [24] highlighted the significance of online user reviews and comments in the performance of tourism businesses.
In accordance with the above-mentioned ideas, such stimulating judgments have raised the interest of researchers and created curiosity for further exploration of the subject. The issue associated with the difference between heritage image and UGC has not been adequately addressed. Despite the significance of UGC and heritage image in the area of heritage tourism, the existing body of literature is still limited. However, travel to heritage sites represents a vast potential in the context of international tourism, but has attained little scholarly attention. This study tries to bridge this gap by proposing an integrated approach to investigate the mediation role of heritage image and attitude toward a heritage site in the relationship between word-of-mouth and travel intention toward heritage sites. In this study, we proposed a conceptual multimediation model that used six constructs (i.e., heritage image, attitude toward heritage site, travel intention toward heritage site, traditional WOM, commercial e-WOM, and UGC) together for heritage tourism. Our study presented a unique and first attempt to answer this question: Do heritage image and attitudes toward heritage sites really mediate the relationship between user-generated content and travel intention toward heritage sites? A questionnaire survey was conducted in the Huang Mountains in China among domestic and international tourists during the Chinese summer vacation. Additionally, “the rise in popularity of the PLS-SEM is particularly noticeable 2013 onwards” [31] (p. 2), but the use of partial least squares structural equation modeling (PLS-SEM) in the area of heritage tourism research is still at an early stage of development as the heritage discipline has hardly exploited the benefits of this approach. Therefore, we applied this relatively popular new method instead of the traditionally used covariance-based structural equation modeling (CB-SEM) method.
In the next section, Section 2, we review the relevant literature along with the development of the hypotheses. Section 3 describes the study area. Section 4 introduces the process of the sample and data collection. Section 5 contains the results and discussion, which is followed by our concluding remarks in Section 6 along with theoretical contributions, practical implications, limitations, and future research.

2. Literature Review and Hypotheses Development

2.1. Influences of Traditional WOM

Carl [32], precisely as Naqvi et al. did [33], stated that traditional WOM can be defined as “face-to-face communication about products or companies between those people who were not commercial entities”. Gupta and Harris [34] stated that consumer behavior was strongly and significantly influenced by consumer-to-consumer communication. Tourism-related products and services are intangible in nature. Hence, the creditworthiness of the available information is considered noteworthy for users in minimizing the risks associated with the consumption of products and services [19,35]. Traditional WOM uses face-to-face communication, plays a key role in consumer choice, and has an important influence on the decision-making process and consumer purchasing behavior. The information obtained from strong tie-based connections is more credible and reliable than those with weak-tie connections [36]. According to Jalilvand et al. [9], traditional WOM significantly influenced behavioral intentions and consumer attitudes. Steffes and Burgee [37] conducted a study to check the influences of traditional and electronic WOM on students’ course decision making and concluded that online information seekers preferred information that belonged to strong ties. Bieger and Laesser [38] found that information obtained from strong-tie connections (such as friends and relatives) was the most credible and reliable. Mehmood, Ahmad, and Khan [39] also found a positive association between tourists and immigrants based on strong ties with family and friends. Tourists use strong ties based on WOM information for decision-making and the formation of destination image [38]. Travelers may use information obtained from both traditional WOM and e-WOM in the decision-making process and destination image formation process [7]. Moreover, the decision-making process is strongly influenced by traditional WOM instead of e-WOM [8,40]. Therefore, it can be strongly concluded that traditional WOM is one of the drivers of travel intention, attitude, and destination image. Similarly, it is anticipated that heritage image, attitude toward heritage sites, and travel intention toward heritage sites could be influenced by traditional WOM. Hence, we hypothesized:
Hypothesis 1a (H1a).
Traditional WOM has a significantly positive influence on the heritage image.
Hypothesis 1b (H1b).
Traditional WOM has a significantly positive influence on travel intention toward heritage sites.
Hypothesis 1c (H1c).
Traditional WOM has a significantly positive influence on attitudes toward heritage sites.

2.2. Influences of Commercial e-WOM

Commercial e-WOM is defined as information shared by individuals using commercial channels such as commercial trip advisor websites and company websites [24]. Many web-based platforms (e.g., websites, blogs, Facebook, Twitter, social networking sites, newsgroups, and Instagram) are used by people to communicate with each other [8,41]. Commercial e-WOM provides detailed information relevant to different scenic spots, which creates an image for the potential visitor to visit these places [12,42]. Fakeye and Crompton [43] found that e-WOM had a significant impact on image destination. Furthermore, e-WOM is a very important source used by tourists after their vacation to create a destination image that tourists make after their vacation [12]. Tourists share their travel experiences through pictures and video clips on social media, which leads to a meaningful destination image [43]. Jalilvand et al. [9] investigated the influence of e-WOM on destination image in Iran and concluded that e-WOM had a positive and significant influence on destination image. Previous studies have also documented the positive and significant effect of e-WOM on tourists’ attitudes toward the destination [11,24,44]. Pietro, Virgilio, and Pantano [45] suggested that tourists share their traveling experiences on social networks, which becomes a source of entertainment for another user, which finally positively influences the potential tourist’s attitude toward visiting those destinations. Castañeda, Rodríguez, and Luque [46] studied the attitude of tourists toward the usage of the Internet and a variety of different websites and concluded that tourists’ attitudes could assist in explaining their behavior. According to Rizky et al. [10], the influence of e-WOM on the tourist intention to travel refers to “the person’s give a recommendation, comment, and giving appraisal about tourist destination through the Internet and social media”. Ladhari and Michaud [47] conducted a study to gauge the effect of e-WOM on the hotel industry, and their findings stated that information gathered by tourists from e-WOM positively influenced the traveler’s intention to visit the hotel. Abubakar and Ilkan [12] mentioned that e-WOM was a very useful source for tourists in gathering relevant information about specific tourist points in Turkey. Recent literature documented that e-WOM positively and significantly influenced travel intention [44] toward visiting tourist points in Jordan [48] and Tunisia [24]. According to Dennis, Morgan, Wright, and Jayawardhena [49], a conceptual model of e-consumers’ behavior and a positive attitude toward a specific shop significantly influenced the intention of the consumer to buy products or services from the same shop. One of the easiest ways to find relevant information related to specific and desired travel destinations is e-WOM [47].
Based on these notions, it is expected that travelers are well-aware of the information offered by e-WOM, which means that travelers would recognize this information as useful in creating an image of destinations, attitude, and travel intention toward the destination. Similarly, it is anticipated that e-WOM could positively influence heritage image, attitudes, and travel intention toward heritage sites. Consequently, we hypothesized:
Hypothesis 2a (H2a).
Commercial e-WOM has a significantly positive influence on heritage image.
Hypothesis 2b (H2b).
Commercial e-WOM has a significantly positive influence on travel intention toward a heritage site.
Hypothesis 2c (H2c).
Commercial e-WOM has a significantly positive influence on attitude toward a heritage site.

2.3. Influences of User-Generated Content

UGC refers to the sharing of information by individuals via UGC or personal channels. UGC is also known as personal e-WOM, or user-generated content [8]. Consumers mostly rely on the information that has been obtained from experienced consumers and UGC instead of information obtained from marketer-generated contents [50,51]. The credibility of available information, the information provider, and ties with the information provider are also critically considered by online community users [52]. Vermeulen and Seegers [53] stated that a traveler’s interest indicated an increasing trend in reviewing the comments and opinions of experienced consumers or travelers that were relevant to the targeted products or services, which could improve awareness about the products and services. O’Connor [50] suggested that potential travelers and consumers also focused and kept actively updated with other consumers and traveler opinions about relevant products or services to minimize and manage the risk associated with that product or service. User-provided online information is regarded as being more important, reliable, enjoyable, and trustworthy than marketer-provided opinions and information [27,29,54,55]. Information generated by the consumer is significant because consumers of tourism and hospitality-related products and services mostly rely on the opinions and advice provided by those users who have experienced the same services [28,56]. Cox et al. [35] documented that information generated by the experienced user was considered more important among potential tourists. On social media platforms such as Instagram, many people have a lot of followers who view and read all kinds of information (e.g., text, audio, video clips) posted on Instagram by different users. Therefore these sources of information influence the traveler’s intention to travel toward a destination [10,44]. It should be studied whether strong ties are appropriate in the perspective of the formation of destination image, travel intention, and tourists’ attitudes toward the destination in an online discussion environment [8].
In this vein, it is hypothesized that if travelers were conscious about the online reviews and comments offered by UGC sources, travelers would distinguish other travelers’ and tourists’ comments, reviews, and suggestions as useful in creating images of destinations, travel intention, and attitude toward destinations. Correspondingly, it is projected that UGC could also positively and significantly influence the image of heritage, attitude, and travel intention toward heritage sites. Hence, we hypothesized:
Hypothesis 3a (H3a).
UGC has a significantly positive influence on heritage image.
Hypothesis 3b (H3b).
UGC has a significantly positive influence on travel intention toward heritage sites.
Hypothesis 3c (H3c).
UGC has a significantly positive influence on attitude toward heritage sites.

2.4. Heritage Image and Its Mediating Role

Destination image is defined as “an individual’s overall perception or the total set of impressions of a place”, [57] and “it is regarded as the mental portrayal of a destination” [58]. Image is a very important concept in understanding the destination selection process of a traveler [59]. Heritage image is defined as “the temporal dimension in the tourist’s impression of cultural heritage sites” [4]. The concept was generated based on the findings of empirical studies that focused on the consumer’s corporate image [5]. Heritage image has been positively associated with the acuities of the tourist and destination quality [1]. The decision regarding travel intention has significantly influenced the destination image that was owned by a particular tourist spot [12]. In accordance with the most recent literature related to marketing and tourism, destination image significantly influenced the process of destination selection and the subjective awareness of tourists along with a subsequent assessment of trips and tourists’ future intentions [14]. The findings of Phau et al. [18] mentioned that image was a key factor in determining the importance of a destination prior to the probable visit, in eliciting willingness [60], and in reinforcing the travelers’ preferences to revisit it [61]. Therefore, visit intention was directly influenced by the destination image that was owned by a tourist [15]. Nassar, Mustofa, and Resinger [62] conducted a study on Kuwaiti national tourists and mentioned that proper emphasis on the destination image backed by particular strategies had a strong and significant influence on travel intention. Furthermore, the results reinforced that destination image had a positive and significant effect on tourist destinations in determining the intention of their visits to a beautiful place in Iran [63]. In a variety of earlier studies, heritage image was an impression and expression that was obtained by tourists on their journey. Therefore, the image of tourist destinations may affect the decision to visit those places. Therefore, this concept is expected to be a valuable conceptual framework in realizing the role of the past on the traveler’s present heritage image formation. However, few academics and researchers have paid attention to exploring the measurement of heritage image in the context of the international tourism industry [2,6]. Therefore, we hypothesized:
Hypothesis 4a (H4a).
Heritage image has a positive influence on travel intention toward heritage sites.
Based on the above-mentioned notion, it is believed that if travelers have a positive image and attitude toward the destination, this could lead toward a positive travel intention. Therefore, image and attitude could mediate the relationship between WOM and travel intention, rather than employ a direct effect of WOM on travel intention. Similarly, it is expected that the relationship between WOM (traditional, commercial e-WOM, or UGC) and travel intention toward a heritage site could be mediated by heritage image and attitude toward heritage sites. Accordingly, the following three hypotheses pertaining to the mediating roles were established:
Hypothesis 4b (H4b).
The relationship between traditional WOM and travel intention toward heritage sites is mediated by heritage image in heritage tourism.
Hypothesis 4c (H4c).
The relationship between e-WOM and travel intention toward heritage sites is mediated by heritage image in heritage tourism.
Hypothesis 4d (H4d).
The relationship between UGC and travel intention toward heritage sites is mediated by heritage image in heritage tourism.

2.5. A Tourist’s Attitude Toward Heritage Sites and Its Mediating Role

Attitude is very important because of its capability and power to predict particular behaviors [64]. Tourist attitude “describes the psychological tendencies expressed by the positive or negative evaluations of tourists” [65] when involved in determining behaviors [66]. Attitude toward the behavior is defined as “the degree to which a person a favorable or unfavorable evaluation or appraisal of the behavior in question. In general, the more favorable the attitude toward behavior, the stronger will be an individual’s intention to adopt the behavior” [24]. Most tourists use social media websites to explore their target tourist destinations, and the attitude of the tourist has a strong influence on the destination selection process [45]. Therefore, keeping in touch on social media and tourism-related websites can play a vital role in exploring new tourist places and managing existing ones. The tourist attitude contains three components: Behavioral, effective, and cognitive. The behavioral component is a vocal sign of the tourist’s intention to use or visit that entity, the effective component is a psychological indication expressing the tourist’s preference for an entity, and the cognitive reaction is the assessment made in developing an attitude. Attitude makes a person susceptible to performing or acting in a precise manner in accordance with household recycling behavior studies [67], tourism behavior studies [68,69], and pro-environmental behavior studies [70]. Recent studies have found that travel intention is influenced by attitudes toward the destination [10,13,68,71], and a traveler’s positive experience regarding products, services, and other resources offered by tourism places could lead toward a revisit [63]. Tourist attitude plays a vital role as an effective predictor in the process of the traveler’s decision making regarding a certain tourist place [44]. Hence, we hypothesized that:
Hypothesis 5a (H5a).
Tourist attitude toward heritage sites has a significant positive direct influence on travel intention toward heritage sites.
Based on these notions, it is supposed that tourists’ positive attitudes toward the destination could lead toward positive travel intention. Other than employing a direct effect of WOM on travel intention, attitude could mediate the relationship between WOM and travel intention. Correspondingly, it is expected that the relationship between WOM (traditional, commercial e-WOM, or UGC) and travel intention toward heritage could be mediated by the attitude toward heritage sites. Hence, the following three hypotheses concerning mediating roles were established:
Hypothesis 5b (H5b).
The relationship between traditional WOM and travel intention toward heritage sites is mediated by tourist attitude toward heritage sites in heritage tourism.
Hypothesis 5c (H5c).
The relationship between commercial e-WOM and travel intention toward heritage sites is mediated by tourist attitude toward heritage sites in heritage tourism.
Hypothesis 5d (H5d).
The relationship between UGC and travel intention toward heritage sites is mediated by tourist attitude toward heritage sites in heritage tourism.
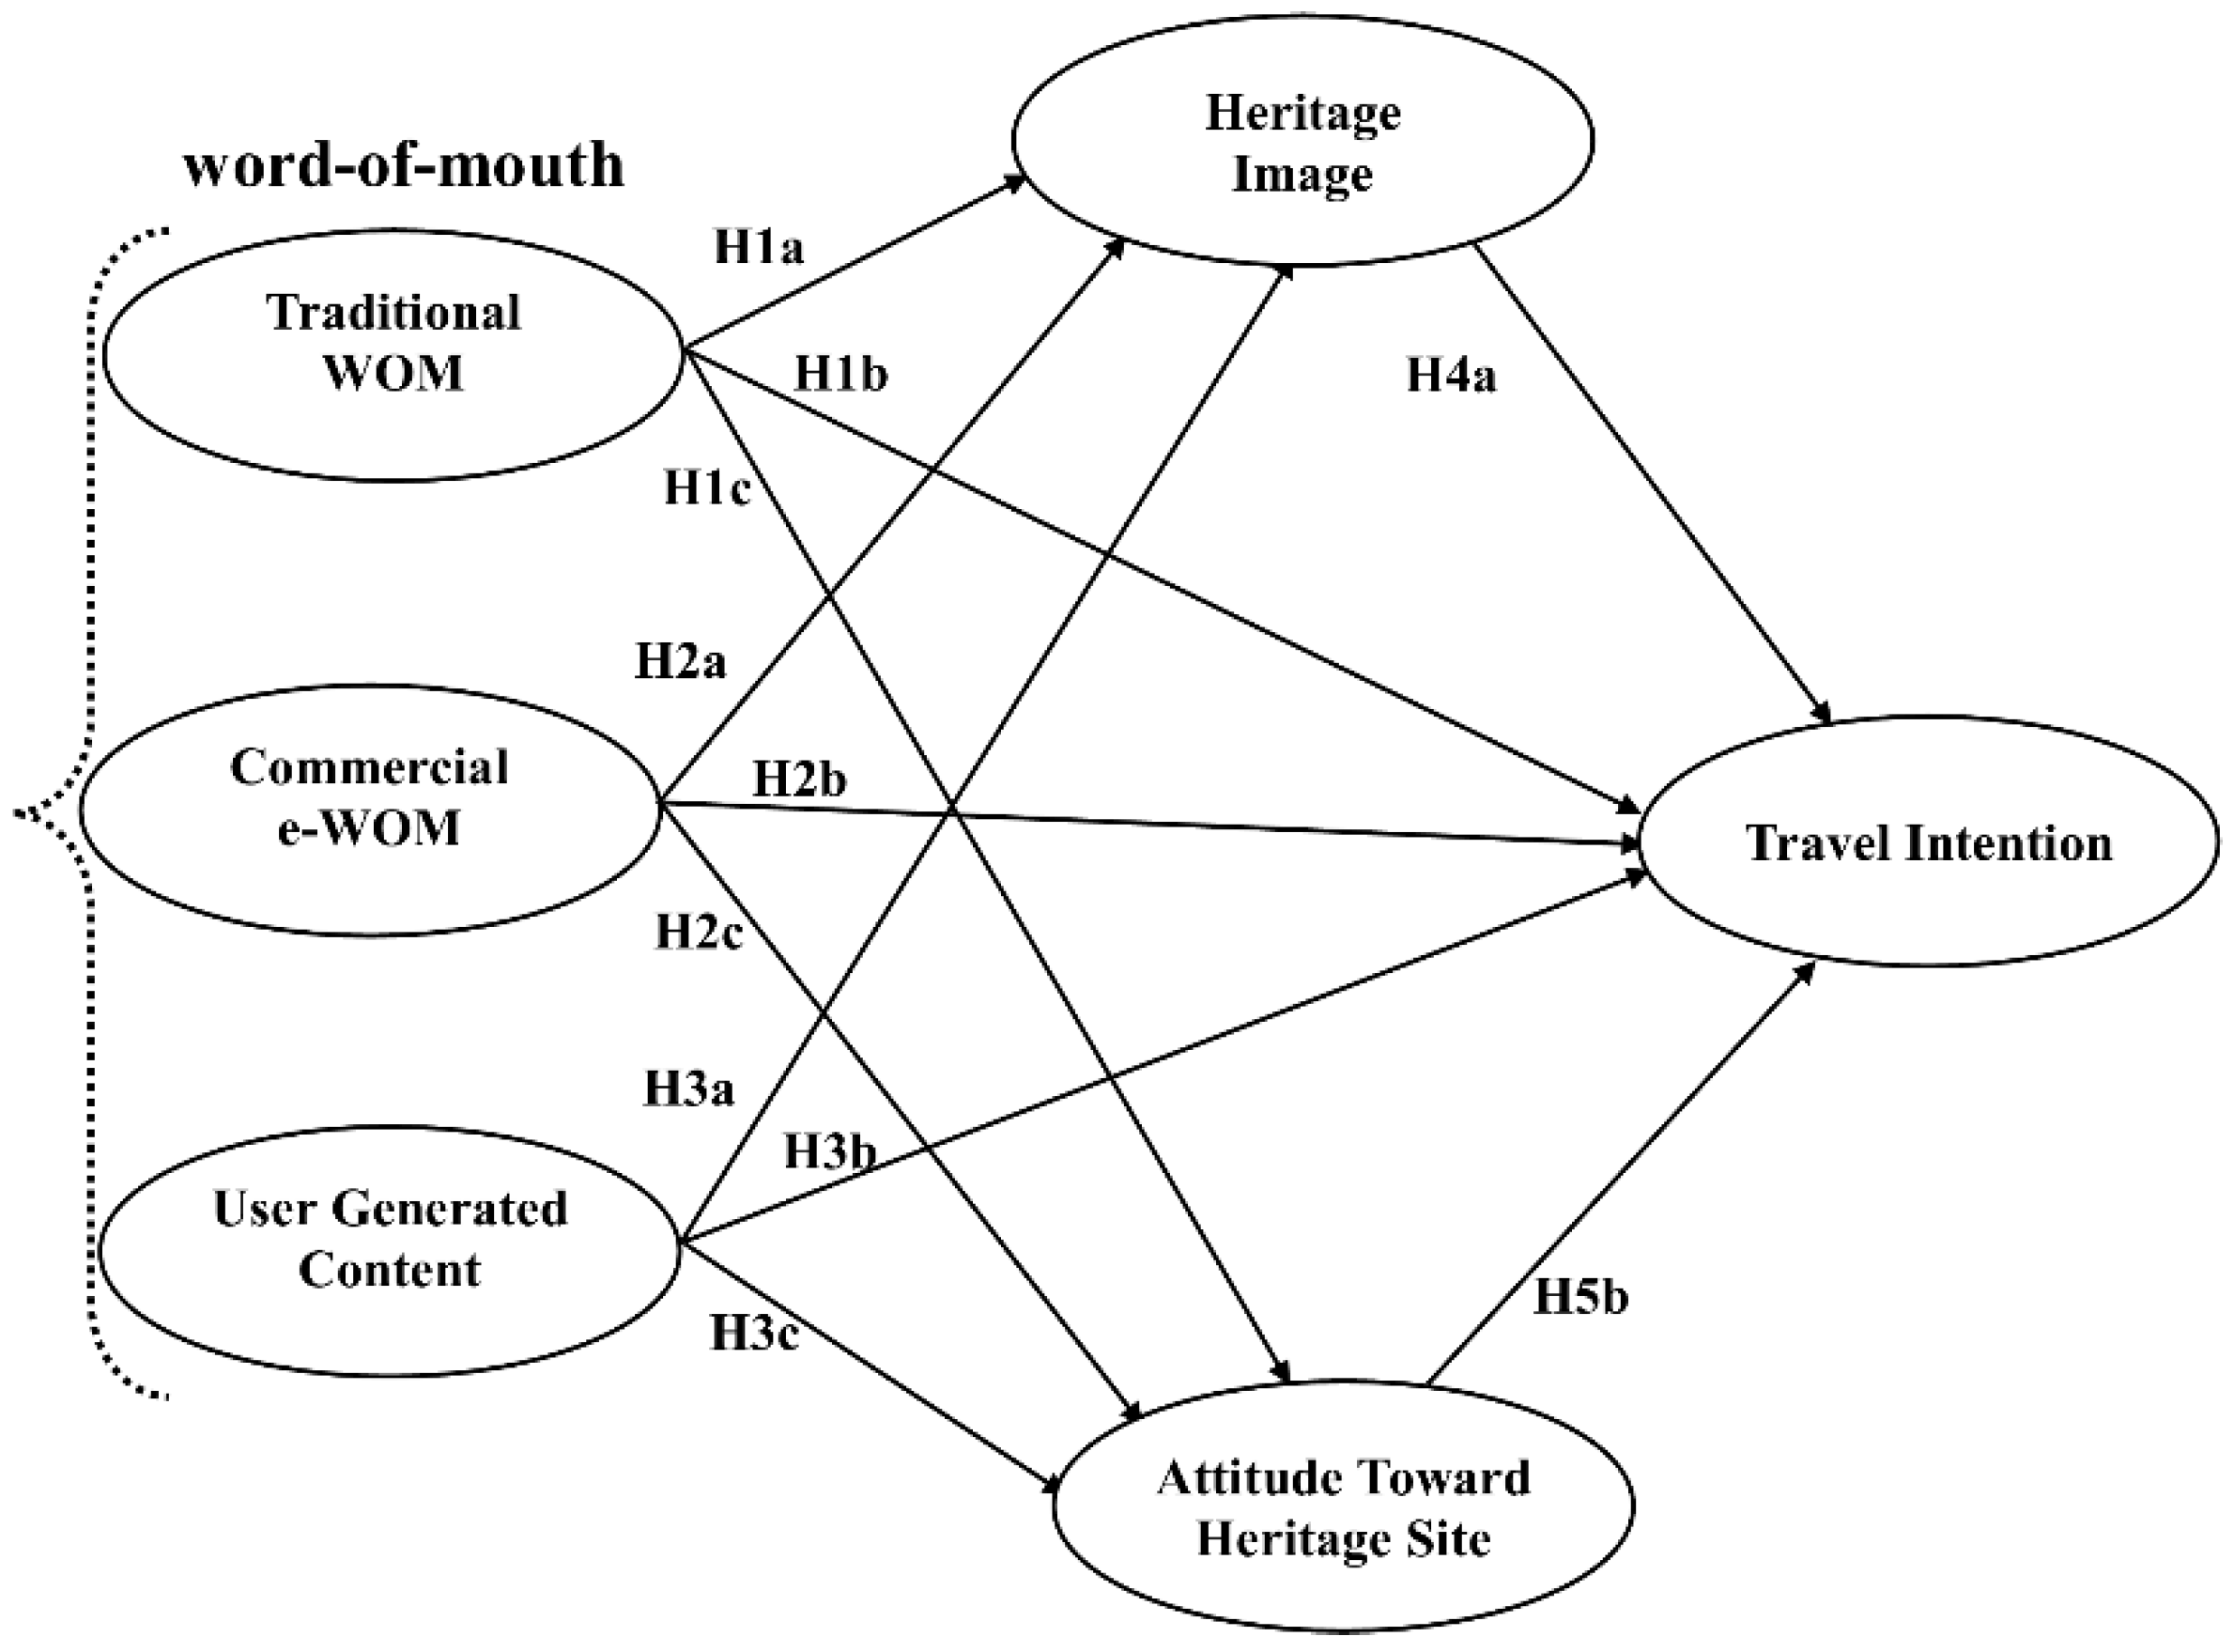
To sum up, it was expected that exogenous variables could directly, positively, and significantly influence travel intention toward the heritage site. Moreover, it was also expected that the relationship between WOM (traditional, commercial, or UGC) and travel intention toward heritage sites could be mediated by heritage image and attitude toward heritage sites. In this vein, based on the above-mentioned details and the literature review, and despite the significance of heritage image, attitude toward heritage sites, and word-of-mouth in the area of heritage tourism, we proposed a multimediation model as illustrated in Figure 1 and Figure 2.

3. Study Area

The main area of our study was Mount Huangshan (also known as the Yellow Mountains) in Anhui Province. Mount Huang was designated a United Nations Educational, Scientific and Cultural Organization (UNESCO) World Heritage Site in 1990. It is one of the most attractive tourism destinations in China. Its geographical location is 1170 12’–1180 53’E, 290 24’–300 31’N. Huangshan is famous as a tourism destination due to its beautiful location. According to a 2015 survey, approximately 1.95 million visitors visited Mount Huang, which created 40.07 billion Renminbi (RMB) in revenue [72]. It contains various tourist points that play a significant role in the development of tourism. Huangshan City contains four counties (Qimeng, She, Xiuning, and Yi), three districts (Huizhou, Tunxi, and Huangshan), and more than 100 towns. The area of Huangshan City is approximately 9776 km2, mostly contains hilly and mountainous land (90%), and has mountains as high as 1826 m [73]. Huangshan City’s annual temperature is approximately 16–17 °C, and its climate is typically humid monsoon. Huangshan is famous for its yellowish-red-colored soil, which is considered good for forestry and the cultivation of rice and tea [74]. Huangshan City fulfills its water requirements from two major water sources, the Xin’anjiang River and Taiping Lake [73].

4. Data and Methodology

4.1. Sampling and Data Collection

A questionnaire survey was conducted during the Chinese summer vacation. Data collection activities were carried out over three consecutive days from 3 August 2018, to 5 August 2018. This study used the convenience sampling method, as the population of domestic and international tourists was unknown. Domestic and international tourists were deemed appropriate for the purpose of the survey. As previous statistics have shown that a large number of Chinese domestic tourists like to visit scenic spots within China during annual summer vacation, domestic tourists were also included in this survey due to the Chinese annual summer vacation. We used two versions of the questionnaire (English and Chinese). The English version of the questionnaires was used for international tourists. The Chinese version of the questionnaire was used for domestic tourists. Questionnaires were filled out by the respondents through face-to-face contact and frank interaction as the respondents were supposed to receive about ¥5 Chinese yuan (CNY) worth of incentives in the form of different gifts for completing the questionnaires. A total of 300 questionnaires were filled out by the tourists. We found 8 questionnaires with a specific outlier, and 12 questionnaire sets were not correctly filled. Therefore, 20 questionnaires were excluded during the analysis process, and 280 valid samples were used for the data analysis. In the context of gender status, 115 participants were male and 165 were female out of the total of 280 respondents (Table 1).
Table 1 shows the demographic characteristics of the respondents. In the context of the respondents’ marital status, out of 280 respondents, 51.79% were single, 41.07% were married, and 7.14% were divorced. In terms of the respondents’ age, 3.93% of the participants were under 18 years old, 33.93% of the participants were 18–30 years old, 30% of the participants were 31–40 years old, 18.93% of the participants were 41–50 years old, and 13.21% of the participants were above 50 years old. With regard to education, 16.43% of the respondents had a high school education, 20.71% had a college degree, 43.21% had a bachelor’s degree, and 19.64% of the respondents had a higher degree. As for the respondents’ income, 8.93% of the respondents had an income of less than 3000 RMB per month, 16.43% of the respondents had a monthly income of 3000–4900 RMB, 26.07% of the respondents had an income of 5000–7900 RMB per month, 24.29% of the respondents had a monthly income of 8000–10,000 RMB, and 24.28% of the respondents had an income of more than 10,000 RMB per month. Out of 280 respondents, 61.43% of the participants were visiting the Yellow Mountains for the first time, 28.93% of the participants had visited the mountain 2–3 times, and 9.64% had visited Huangshan four times or more.

4.2. Scale Development

Data were collected through a questionnaire, which used a multi-item approach. Items were adapted from the literature because of the content validity concern of the data. For the purpose of reliability and validity improvement, several items were used to assess each concerned construct. The questionnaire was divided into three sections. The first section contained a brief description of the questionnaire for a better understanding of the questions. The second part included the participants’ demographic information (i.e., gender, marital status, level of education, age, education, monthly income, and visit). The third section presented the main body of the questionnaire, which comprised 23 items (also known as manifest variables) of the six concerned constructs (i.e., traditional WOM, commercial e-WOM, UGC, heritage image, travel intention toward heritage sites, and attitude toward heritage sites) (Table 2). “Traditional WOM” was measured using three-item scales (face-to-face opinions, advice, and choices), which were adopted from a previously published study [75]. A six-item modified scale (good impressions of heritage site, right heritage site, attractive heritage site, certain heritage site, correct decision, and feel confident) was used to assess “commercial e-WOM”, and was adapted from the existing literature [44]. Minor modifications were incorporated in accordance with the projected hypotheses. “UGC” was tested by including three modified items (friends’ opinions, relatives’ suggestions, and friends’ advice), which were borrowed from a previous study [75]. “Heritage image” was assessed by incorporating five modified items (safe and secure, interesting place, natural attraction, pleasant climate, and good value) that were taken from a previous study [76]. A three-item modified scale (very bad/very good, very worthless/very valuable, and very unpleasant/very pleasant) was considered to assess “attitude toward heritage site”, which was also adopted from previous research [77]. “Travel intention toward heritage site” was also tested by integrating three modified items (revisit, preference, and future intention), which were adopted from the literature [63]. Basically, the incorporated modifications were minor in nature because we only replaced the names of the destinations from previous studies with our target heritage site, namely “Mount Huangshan” (also known as the Yellow Mountains). Therefore, a seven-point Likert scale (ranging from 1 = strongly disagree to 7 = strongly agree) was used. Participants were requested to rate it in accordance with their experience.

5. Results and Discussion

5.1. Data Analysis

The increase in the popularity of partial least squares structural equation modeling has been mainly noticeable from 2013 onwards [31], but PLS-SEM in the area of heritage tourism research is still in an early stage of development as the heritage discipline has hardly exploited the benefits of this approach. Therefore, we applied this relatively popular new variance-based SEM approach of PLS [78,79] instead of the traditionally used covariance-based SEM (CB-SEM) [80]. This method was used because: (1) in PLS-SEM, mediation analysis is a process rather than a step; (2) the prediction orientation of path modeling in PLS; (3) high-level model complexity prefers the PLS-SEM procedure; (4) the formative measured construct in PLS modeling; (5) PLS-SEM is appropriate for small sample sizes; (6) compared to CB-SEM, PLS-SEM does not rely on strict data assumptions; (7) the multimediation effects test in an incomplete model; and (8) the differences between CB-SEM and PLS path modeling [78,80,81,82,83,84]. In this study, we used SmartPLS (v 3.2.7) software [85].

5.2. Measurement Model Assessment

We checked convergent validity and discriminant validity to evaluate the measurement model. Composite reliability (CR) [78] and rho indexes [86] are considered as the best measures of internal consistency. As suggested by Gadermann, Guhn, and Zumbo [87], we did not use Cronbach’s alpha for the reliability contrast as it was not appropriate for the PLS-SEM. The average variance extracted (AVE) of the constructs and the factor loadings was considered as the best measure for convergent validity [88,89]. Furthermore, the square root values of AVE and the correlations between the constructs were compared to check the discriminant validity. The values of factor loading > 0.707 [88], CR > 0.7 (78), rho > 0.7 [86], and AVE > 0.5 [89] were all above the required values and met the suggested requirements [78,90] (Table 3).
Additionally, the discriminant validity or divergent validity was tested by the heterotrait–monotrait ratio (HTMT) and the Fornell–Larcker test. Comparatively, HTMT is a new method that is considered to be more suitable for testing discriminant validity [91]. The HTMT criterion is defined as the “average of the heterotrait–heteromethod correlations (correlations of indicators across constructs measuring different phenomena) relative to the average of the monotrait–heteromethod (correlation of indicators within the same construct)” [91] (p. 121). The correlation values between the constructs were less than 0.85 [92]. Furthermore, the AVE square root value of all constructs was also greater than the values of correlation between the constructs [93]. In accordance with the suggestion of Reference [78], values of the HTMT were smaller than 0.90 (Table 4).

5.3. Structured Model Assessment

The hypothesized relationships between the concerned constructs of the proposed structured model were assessed by using bootstrapping (4000 resamples) to generate confidence intervals and t-values. Streukens and Leroi-Werelds [94] (p. 4) mentioned that “the number of bootstrap replications varies tremendously (minimum = 500; maximum = 5000)”. The bootstrap is a test of nonparametric resampling [95]. This method is appropriate for a smaller sample size because it does not rely on the normality assumption [78]. This method is applied twice (i.e., with and without) in the presence of mediation [96]. There is no mediation effect if the direct effect is insignificant [78]. Table 5 presents the hypotheses testing of the direct effects, as demonstrated in Figure 3, along with the overall fit statistics for better illustration.
All of the concerned exogenous variables denoted a significant and positive antecedent to their particular endogenous variables. Specifically, traditional e-WOM (TWOM) was a significant and positive predictor of heritage image (HI) (H1a: b = 0.120, p < 0.01, t-value = 2.260), travel intention toward heritage site (TITHS) (H1b: b = 0.102, p < 0.05, t-value = 1.705), and attitude toward heritage site (ATHS) (H1c: b = 0.265, p < 0.001, t-value = 4.353). Moreover, commercial e-WOM (CEWOM) significantly and positively influenced HI (H2a: b = 0.273, p < 0.001, t-value = 6.092), TITHS (H2b: b = 0.183, p < 0.001, t-value = 3.729), and ATHS (H2c: b = 0.198, p < 0.001, t-value = 4.091). Furthermore, UGC also significantly and positively influenced HI (H3a: b = 0.540, t-value = 9.536, p < 0.001), TITHS (H3b: b = 0.172, p < 0.01, t-value = 2.554), and ATHS (H3c: b = 0.427, p < 0.001, t-value = 6.230). Finally, HI affirmatively and significantly affected TITHS (H4b: b = 0.285, p < 0.001, t-value = 4.470), and ATHS also affirmatively and significantly influenced TITHS (H5: b = 0.244, p < 0.001, t-value = 3.992). Thus, all hypotheses were supported. Additionally, we also reported the confidence interval to check the significance of the structural path coefficients [97]. “When a confidence interval for a difference does not include zero, the hypothesis that the difference is zero is rejected. Testing with confidence intervals has the advantage that they give more information by indicating the direction and something about the magnitude of the difference or, if the hypothesis is not rejected, the power of the procedure can be gauged by the width of the interval” [98] (p. 575). The results of the percentile method also supported the proposed hypotheses, as 0 values were not counted in either confidence interval [99].
According to Henseler, Hubona, and Ray [100], the standardized root mean square residual (SRMR) can be used for PLS-SEM as a goodness of fit measure to avoid the misspecification of the model. Hu and Bentle [101], precisely like Kenny [102], defined SRMR as “the standardized difference between the observed correlation and the predicted correlation”. Therefore, SRMR was used to measure the global model fit. Following the suggestion of Henseler et al. [100] and Hu and Bentler [101], the value of SRMR was 0.047, below 0.08. The predictive power of the structure model was checked by examining the values of the coefficient of determination (R2), which represented the combined effects of exogenous contracts on endogenous constructs. The values of R2 could be estimated by the following formula [103]:
R 2 = j | β j ^ c o r   ( η i ,   ξ j )  
where c o r   ( η i ,   ξ j ) is the latent variable and β j is a parameter of the structured model that represents the nexus between η j and ξ a i . The values of R2 = 0.25, 0.50, and 0.75 refer to weak, moderate, and strong, respectively [78]. The structured model explained 72.35% of the variance in travel intention toward heritage sites, 67.08% of heritage image, and 60.39% of attitude toward heritage sites. The values of R2 were between relatively moderate and substantial [88]. Given the lack of providing the overall fit statistics in PLS, researchers and academics have recently begun to use goodness of fit (GoF). Therefore, we also computed the value of the GoF to check the overall quality of our proposed model. Following the suggestion of Tenenhaus et al. [103], the value of the GoF was computed as (see Tenenhaus et al. [103] for detailed information on the GoF computation: Here, the communality of TWOM, CEWOM, UGC, HI, ATHS, and TITHS denoted 0.452, 0.493, 0.387, 0.454, 0.422, and 0.422, respectively):
G O F = C o m m u n a l i t y ¯ × R ¯ 2 = 0.4483 × 0.6617 = 0.2966 = 0.5447 .

5.4. The Effect Size and Predictive Relevance

Following the suggestion of Hair et al. [78], the values of Q2 were computed to check the predictive relevance and accuracy of the model. The value of Q2 assesses the predictive validity of a large and complex model in PLS by using the blindfolding method [104,105]. Chin [106] stated that “the prediction of observables or potential observables is of much greater relevance than the estimator of what are often artificial construct-parameters” (p. 320). The value of Q2 for endogenous constructs was 0.357, 0.330, and 0.419 for HI, ATHS, and TITHS, respectively, demonstrating an acceptable level of predictive relevance (Table 6). The value of Q2 > 0 showed the model’s predictive relevance [107], along with presenting a moderate effect [78,106].
Cohen’s f2 was used to check the degree of contribution by an exogenous variable in terms of R2 to explain the endogenous variable. The values of f2 = 0.02, 0.15, and 0.35 were referred to as a weak, moderate, and strong effect size of the constructs, respectively [107]. Specifically, the f2 value was large (UGC → HI, f2 = 0.39, over 0.35), which showed a large effect between UGC and heritage image. There was a moderate effect between UGC and attitude toward heritage site (UGC → ATHS, f2 = 0.20, over 0.15) and between commercial e-WOM and heritage image (CEWOM → HI, f2 = 0.15, equal to 0.15). The f2 values met the base level criteria of 0.02 in the case of the remaining relationships.

5.5. Multiple Mediating Effect Tests

To test the mediating role of heritage image and attitude toward heritage site (H4b, H4c, H4c, H5b, H5c, and H5d), we applied the relatively popular new analytical method recommended by recent studies [31,108,109]. Table 7 shows the outcomes of the indirect and total effects of the exogenous variables (TWOM, CEWOM, and UGC) on the endogenous variable (TITHS) through their mediators (i.e., heritage image and attitude toward heritage site). Moreover, the results of the multiple mediation paths along with the computation of their magnitudes or strength of mediation effects are also displayed in Figure 4, Figure 5 and Figure 6 for a better illustration. The bootstrapping technique using bias correction and percentiles was applied to test the specific indirect effects.
As mentioned earlier, the direct effects of TWOM, CEWOM, and UGC on TITHS were supported (H1b: c1; H2b: c2, and H3b: c3, respectively). Additionally, the resultsrevealed that the indirect effects of the exogenous variables were also significantly supported, as 0 values were not counted in either confidence intervals. The significance of the structural coefficients could also be checked by reporting the bias-corrected confidence interval [110]. Specifically, heritage image mediated the relationship between TWOM and TITHS (H4b: b = 0.034, p < 0.05), CEWOM and TITHS (H4c: b = 0.078, p < 0.001), and UGC and TITHS (H4d: b = 0.154, p < 0.001). Moreover, attitude toward heritage site also mediated the relationship between TWOM and TITHS (H5b: b = 0.065, p < 0.01), CEWOM and TITHS (H5c: b = 0.048, p < 0.01), and UGC and TITHS (H5d: b = 0.104, p < 0.001).

5.6. Magnitude and Strength of Mediation

Additionally, we followed the suggestion of Hair et al. [78] to conclude to reject or not to reject the mediation hypotheses (H4b, H4c, H4d, H5b, H5c, and H5d). The computation of the strength of mediation or magnitude is important in the context of concluding remarks about the mediation effect. Therefore, as suggested by Hair et al. [78], the strength or magnitudes of mediation were computed (see Figure 4, Figure 5 and Figure 6) by incorporating the variance accounted for (VAF) method (VAF < 0.2, no mediation; 0.2 ≤ VAF ≤ 0.8, partial mediation; VAF > 0.8, full mediation).
Figure 4 illustrates the magnitude of mediation in terms of heritage image (H4b: a1b1), and attitude toward heritage site (H5b: a2b2) mediated the relationship between TWOM and TITHS. The contrast revealed that heritage image did not mediate the relationship between TWOM and TITHS, as the VAF presented a value under 0.2, which indicates zero mediation [78], so the mediation hypothesis (H4b) was not supported. In contrast, attitude toward heritage site mediated the relationship between TWOM and TITHS, as the VAF presented a value greater than 0.2. Hence, complementary partial mediation was supposed because the direct and indirect effects of TWOM were both significant and their product (i.e., a1*b1*c1) was also positive. According to Hair et al. [78] (p. 234), “When both the direct and indirect effects are significant, we can distinguish between complementary and competitive mediation. Complementary mediation describes a situation in which the direct effect and the indirect effect p1·p2 point in the same direction. In other words, the product of the direct effect and the indirect effect (i.e., p1·p2·p3) is positive.”
Figure 5 demonstrates that the strength of mediation in terms of heritage image (H4c: a3b1) and attitude toward heritage site (H5c: a4b2) mediated the relationship between CEWOM and TITHS. The contrast shows that heritage image mediated the relationship between CEWOM and TITHS, as the VAF presented a value greater than 0.2. Hence, complementary partial mediation was supposed because the direct and indirect effects of TWOM were both significant and their product (i.e., a3*b4*c2) was also positive [78]. In contrast, the attitude toward heritage site did not mediate the relationship between CEWOM and TITHS, as the VAF presented a value under 0.2, which indicates zero mediation [78], so the mediation hypothesis (H4b) was not supported.
Figure 6 illustrates the magnitude of mediation in terms of heritage image (H4d: a5b1), and attitude toward heritage site (H5d: a6b2) mediated the relationship between UGC and TITHS. The values of VAF were greater than 0.2, and hence complementary partial mediations were supposed because the direct and indirect effects of UGC were both significant and their products (i.e., a5*b1*c3 and a6*b1*c3) were also positive [78].

5.7. Impact–Performance Map Analysis (IPMA)

The IPMA provides an extended form of path coefficient (importance) by considering the performance (average value) of each construct [31]. The study of Hair et al. [78] explained the IPMA in detail, whereas Hair et al. [109] and Ringle and Sarstedt [111] discussed its applications. According to Ringle and Sarstedt [111], IPMA is “a useful analysis approach in PLS-SEM that extends the standard results reporting of path coefficient estimates by adding a dimension that considers the average values of the latent variable scores”. Figure 7 illustrates the results of the IPMA.
The x axis denotes the impact (importance) of a target variable, whereas the y axis represents the average value (performance), which ranged from 0 to 100. This method provided a guide as to the importance of areas which needed to improve even though the present performance of those areas was weak. The IPMA results for the travel intention toward heritage site (TITHS) in heritage tourism revealed that ATHS, CEWOM, HI, UGC, and TWOM had a higher performance (average values) and importance (average values) for the TITHS (ATHS: 0.244, 69.642; CEWOM: 0.309, 67.786; HI: 0.285, 63.639; UGC: 0.43, 68.316; TWOM: 0.201, 64.323). Accordingly, per each unit increase in the ATHS, CEWOM, HI, UGC, and TWOM, the performance of travel intention toward heritage site increased by 0.244, 0.309, 0.285, 0.43, and 0.201, respectively.

5.8. Discussion

To accomplish the objectives of the present study, we conducted a questionnaire survey and proposed an integrated model (Figure 1) and multiple mediation models (Figure 2), which included 17 accompanying hypotheses. The first 11 projected hypotheses (H1a, H1b, H1c, H2a, H2b, H2c, H3a, H3b, H3c, H4a, and H5a) denoted direct effects, and the remaining six projected hypotheses (H4b, H4c, H4d, H5b, H5c, and H5d) presented the mediating roles of heritage image and attitude toward heritage site in the relationship between WOM and travel intention toward heritage site. First of all, as predicted by the hypotheses associated with the direct effect of traditional WOM (i.e., H1a, H1b, and H1c), the results revealed that traditional WOM was a significant and positive predictor of heritage image (H1a), attitude (H1b), and intention toward heritage site (H1c), which means that hypotheses H1a, H1b, and H1c were proven. These results are similar to the findings of previous studies [8,9,34]. Ishida et al. [8] examined the influence of traditional WOM for vacation tourists, and found that traditional WOM had a positive and significant effect on visit intention and destination image, and also significantly influenced consumer attitudes and behavioral intentions [9], as traditional WOM is extensively considered to be one of the main influential predictors [40]. Information acquired from friends and relatives was considered to be the most credible and reliable, was used by potential tourists in the travel decision-making process, and also strongly influenced destination image. The traditional view claims that face-to-face communication and face-to-face communication plays a key role in consumer behavior and consumer choice, and ultimately influences decisions [34].
As predicted by H2a, H2b, and H2c, commercial e-WOM significantly and positively influenced heritage image (H2a), travel intention toward heritage site (H2b), and attitude toward heritage site (H2c), which means that hypotheses H2a, H2b, and H3c were also supported. These results of our study are also in line with those in previous literature [10,11,12,44,56]. Rizky et al. [10] found that e-WOM had an affirmatively positive effect on destination image, travel intention, and attitudes. There were also positive and significant associations between e-WOM, trust in the destination, and revisit intention [11]. Tourists shared their traveling experience on social networks, and therefore e-WOM could be considered to be a positive and significant predictor of travel intention [44] in Tunisia [24]. Furthermore, e-WOM was a very important and useful resource for tourists in gathering information about destinations and sharing opinions, which they made after their vacation in Turkey [12].
Furthermore, as predicted by the hypotheses associated with the direct effect of UGC (i.e., H3a, H3b, and H3c), it was found that the UGC was a positive predictor of heritage image (H3a), travel intention toward heritage site (H3b), and attitude toward heritage site (H3c). Correspondingly, our results were conceptually and logically consistent with the findings of a few previous studies. The online information seeker mostly chose information that belonged to strong-tie connections [37]. Tourists’ online comments, opinions, suggestions, advice, and reviews about tourism and hospitality services were commonly considered to be more reliable and up-to-date when compared to contents posted by travel service providers [28,30]. Hence, UGC is considered to be more reliable [24,29]. Therefore, our study bridged this gap in the existing body of literature despite the importance of UGC in the area of tourism and hospitality.
In accordance with the prediction of H4a, heritage image affirmatively affected travel intention toward heritage sites. These results support the existing body of literature [10,14,15,56,112]. The destination image has positively influenced visit intention [10]. Image is an impression and expression that is acquired by a traveler at the end of the journey, and therefore visit intention is directly predicted by the location image [15]. Moreover, destination image is one of the main factors in revisiting a destination, among other factors such as travelers’ experience, leisure constraint, and familiarity with the experience [14]. Information given by tourists about the destination image was significant because potential travelers mostly relied on the opinions and advice provided by those users who have experienced the same services [56], and therefore a perceived image of a target location positively and significantly influenced the tourists’ attitudes [112]. In contrast, our findings were not in line with previous studies [113,114,115]. Artuger and Cetinsoz [114] examined the impact of destination image (cognitive image and affective image) on revisiting intention and concluded that affective image positively, but insignificantly, influenced travel intention. Furthermore, they mentioned that previous studies had only considered the cognitive aspect of the destination image, whereas affective image also contains equal importance in an accurate assessment of the influence of destination image in the decision-making process. Stylos et al. [115] found that destination image (affective image and cognitive image) did not have a significant impact on travel intention. In accordance with the prediction of the hypotheses associated with the direct effects of attitude toward heritage site (H5a), our results showed that tourists’ attitudes toward heritage sites had a positive and significant impact on travel intention toward heritage sites. The results of our study also reinforced the opinions of References [13,16,71]. Kim and Kwon [71] conducted a study to examine the links between attitude, image, and intention to visit Korea and concluded that attitude had an affirmative influence on travel intention. Visitation intention was highly affected by a positive attitude change [16]. In the context of the mediating role of heritage image and attitude toward heritage sites in the relationship between word-of-mouth (i.e., traditional, commercial, and UGC) and travel intention toward heritage sites, our study contributes a noteworthy contribution in the existing body of literature because there have been very few studies that have used these two mediators.

6. Conclusions

The present study adds value to the existing body of literature on heritage tourism, as this field has received little scholarly attention. The understanding of the predictors of heritage image, attitude toward heritage site, and travel intention toward heritage site for heritage tourism purposes is a noteworthy contribution. Despite the significance of UGC [116] and heritage image in the area of tourism and hospitality, the existing body of literature is still limited. In fact, previous studies have not paid particular attention and have focused on heritage image in the context of WOM (i.e., traditional, commercial e-WOM, and UGC), which is an important antecedent to travel intention and attitude toward heritage site [8] (p. 24). This study bridged this gap by investigating the mediating role of heritage image and attitude toward a heritage site in the relationship between exogenous constructs and travel intention toward heritage sites. We employed the PLS-SEM method instead of the traditionally used CB-SEM method.
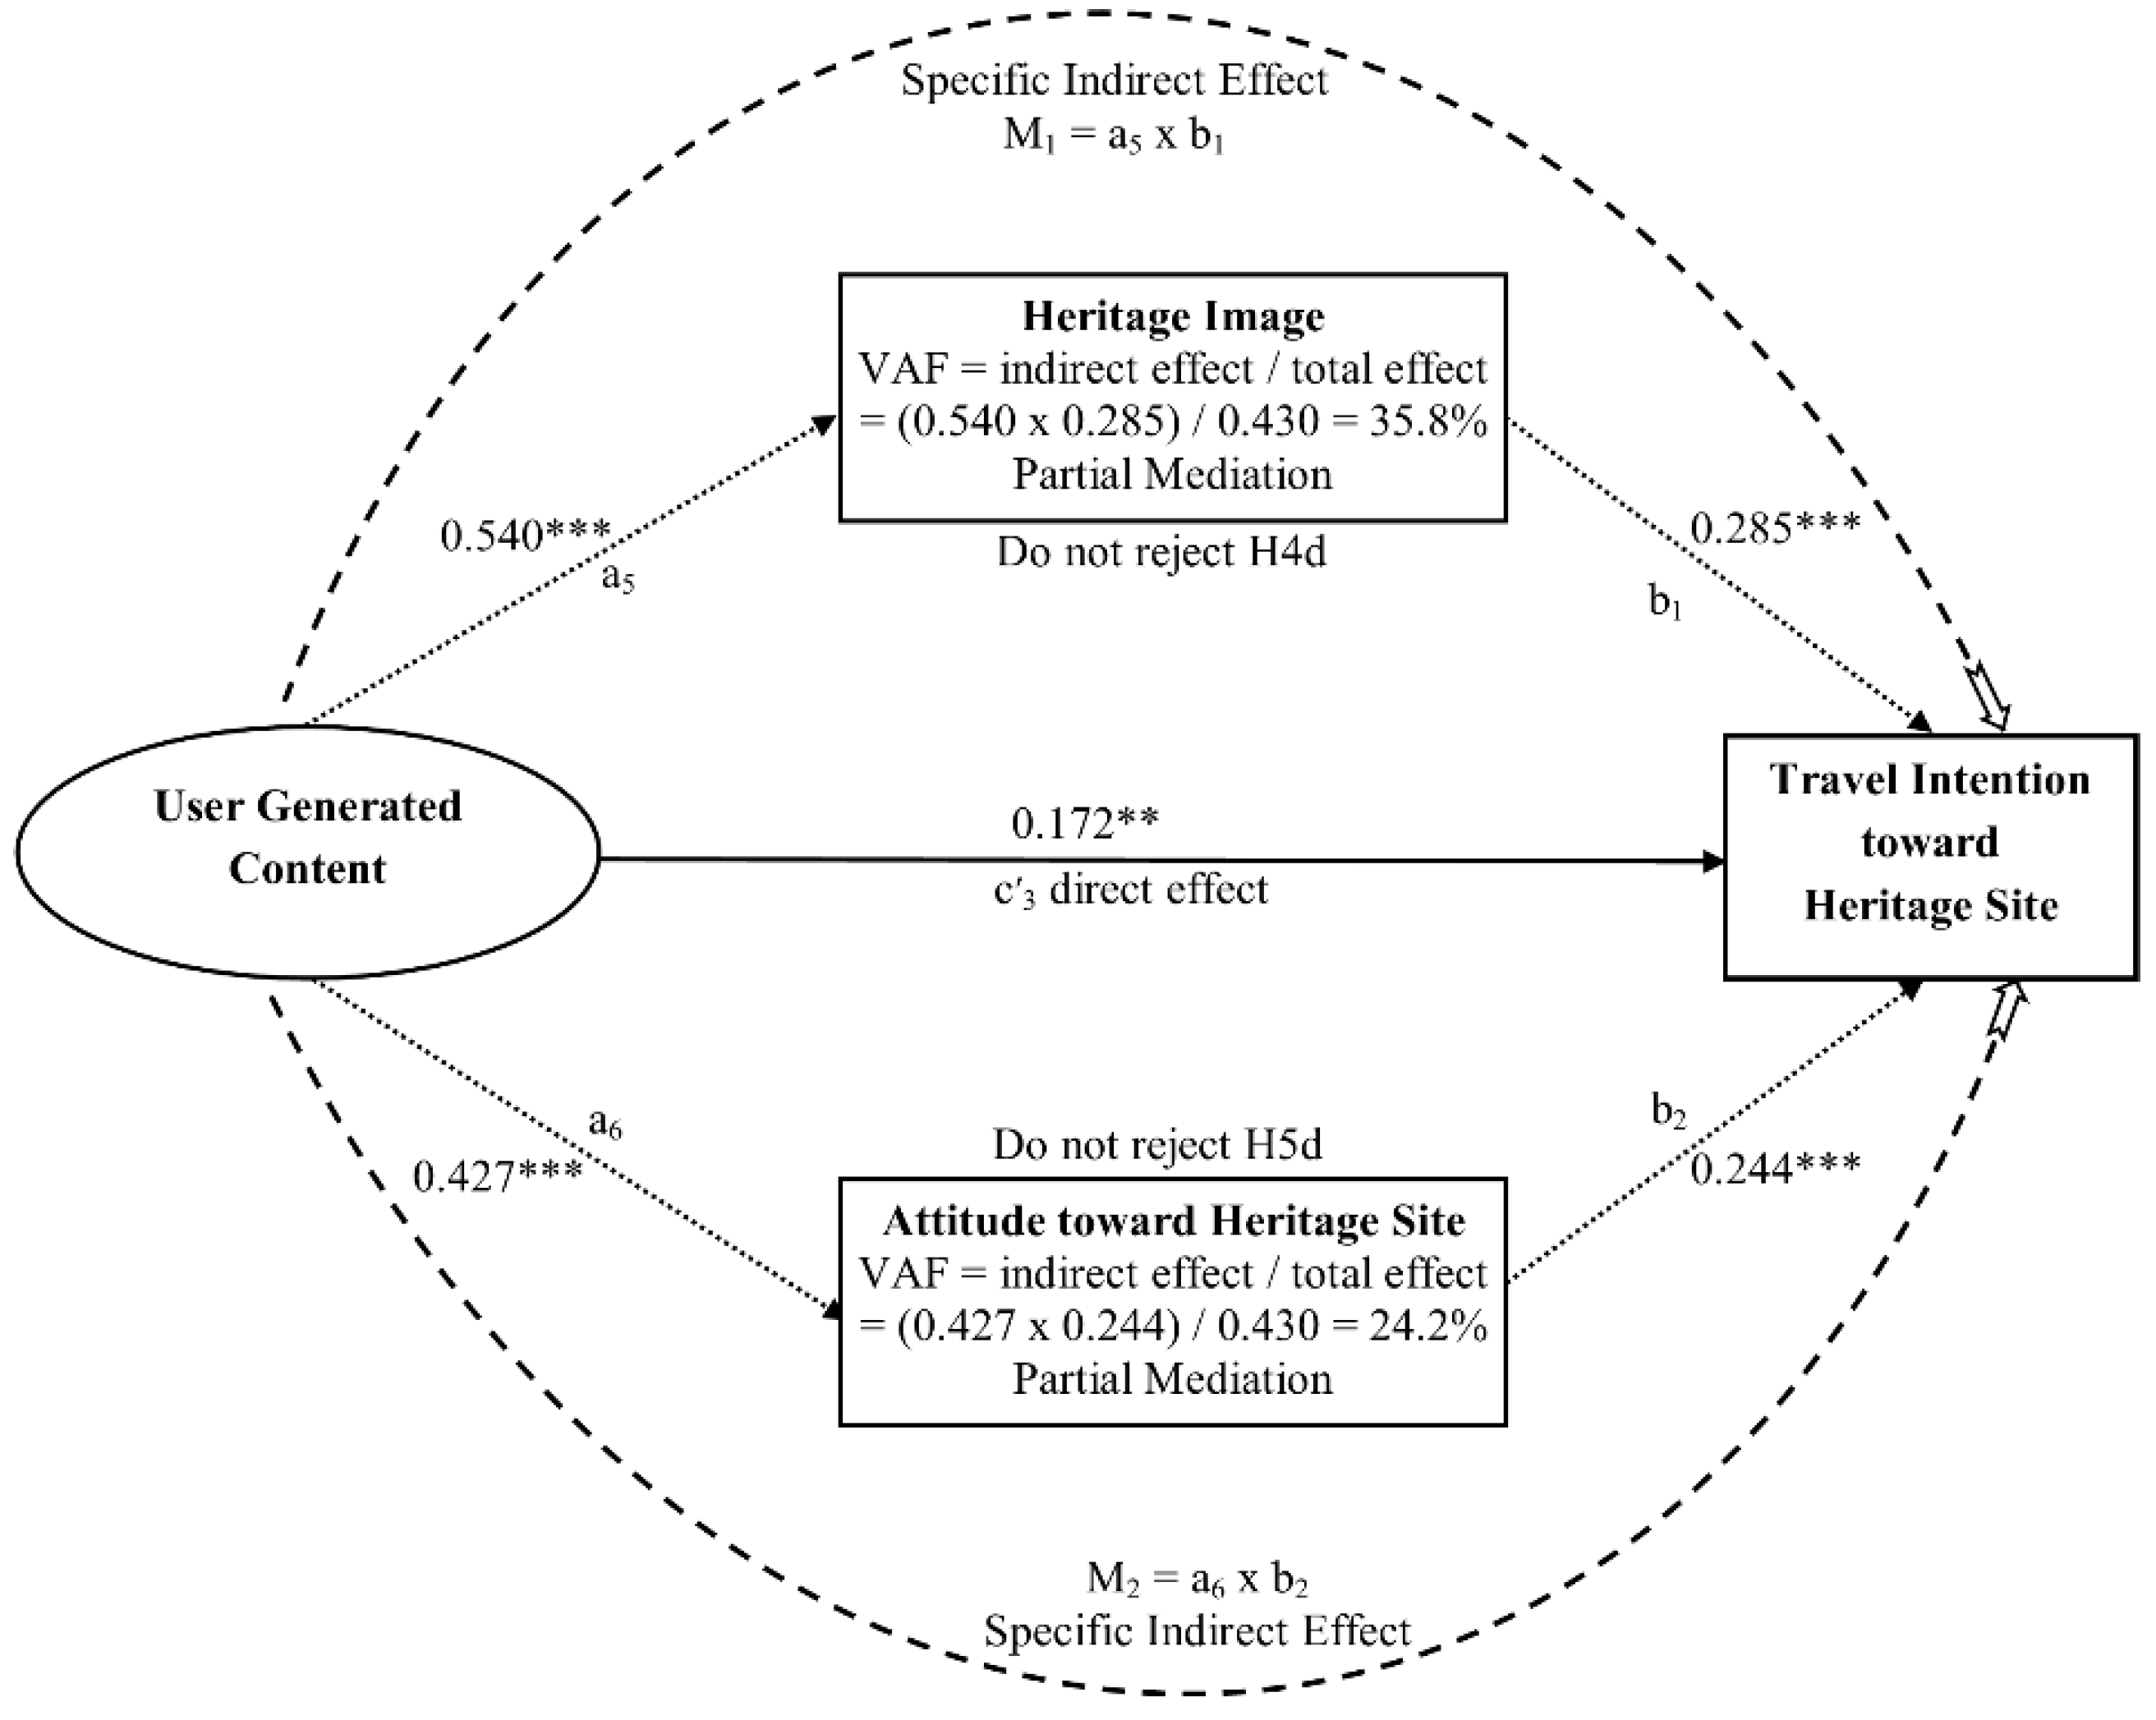
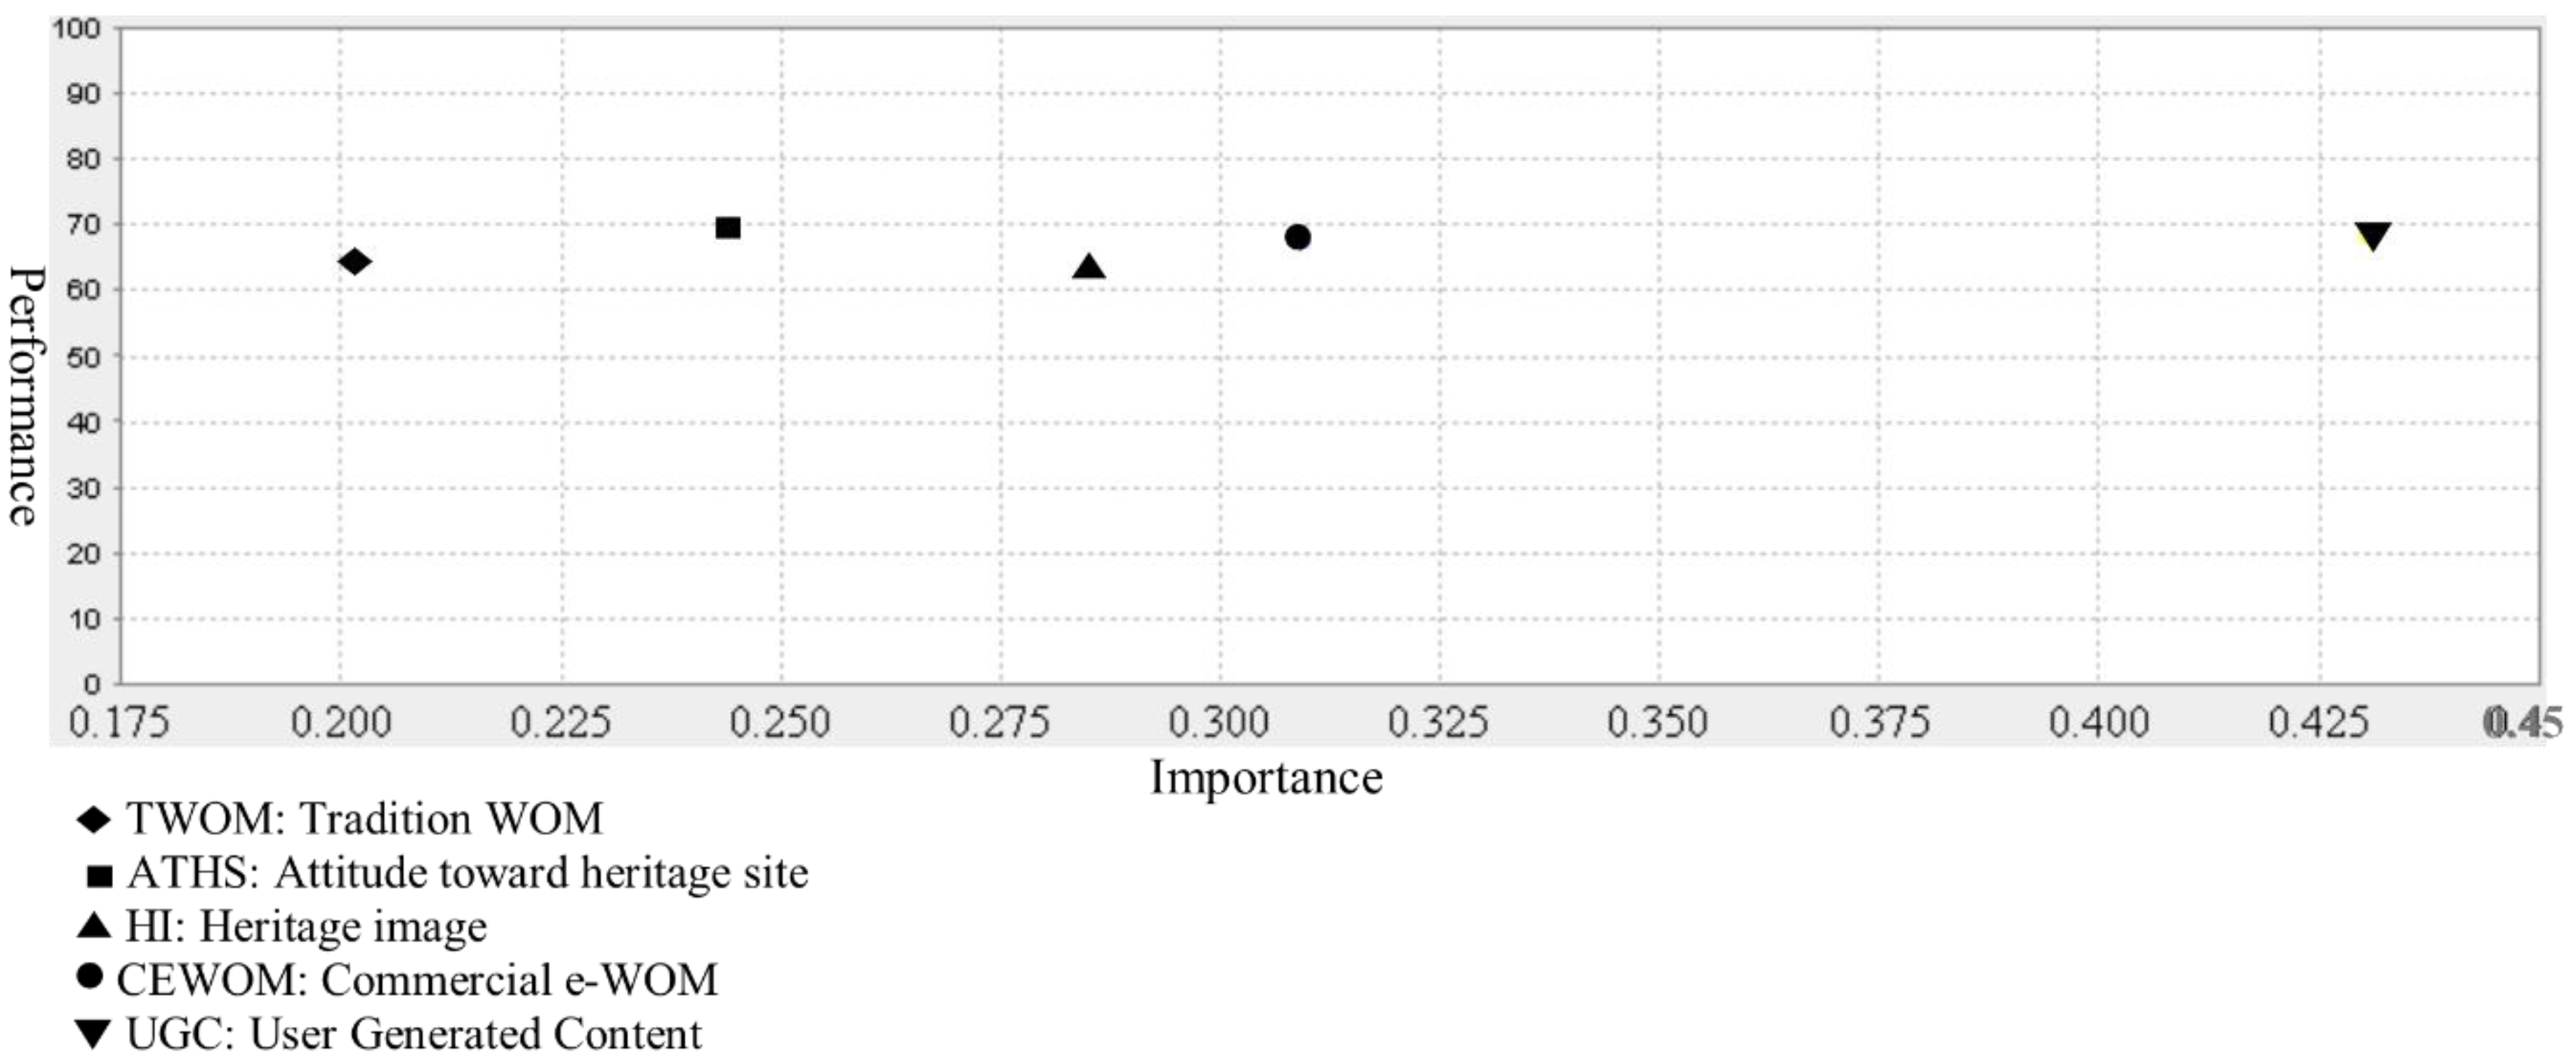
First, the findings recognized that UGC, traditional WOM, and commercial e-WOM were counted as important for marketing resources in accordance with their level of significance. Second, all exogenous variables directly influenced travel intention toward a heritage site. Third, exogenous variables indirectly also influenced travel intention toward a heritage site. Fourth, in accordance with the magnitude or worth of the mediation role of heritage image (HI): (1) HI mediated the relationship between UGC and TITHS, (2) HI mediated the relationship between CEWOM and TITHS, and (3) HI did not mediate the relationship between TWOM and TITHS. Fifth, in accordance with the worth of the mediation role of attitude toward heritage site (ATHS): (1) ATHS mediated the relationship between TWOM and TITHS, (2) ATHS mediated the relationship between TWOM and TITH and UGC and TITHS, and (3) ATHS did not mediate the relationship between CEWOM and TITHS. Therefore, the findings of the present research suggested appropriate empirical and theoretical conclusions as well as valuable insights for heritage management organizations (HMOs), including both local professionals and the host communities that assist in increasing the development of heritage tourism.

6.1. Theoretical and Practical Implications

The theoretical contribution of this study stems from a holistic emphasis on WOM (categorically speaking, traditional, commercial e-WOM, and UGC) as it reflected the visitors’ attitudes toward heritage sites, heritage image, and travel intention toward heritage sites. The following are some noteworthy implications of this study. First, this study considered traditional WOM, commercial e-WOM, and UGC as predictors of heritage image, attitude, and travel intention toward heritage sites in the heritage tourism environment, which has hardly been previously taken into account. Second, we applied PLS-SEM, a relatively popular new method, instead of the traditionally used CB-SEM. Third, this study contributed to the body of literature by introducing and proposing an integrated approach that used six constructs together in identifying tourism behavior in the heritage tourism field. Comparatively, few studies have been conducted on the decision-making process and travel behavior in the context of tourism in mountain areas. Fourth, the present research work incorporated heritage image and attitude toward heritage site as mediators in the relationship between concerned exogenous variables and an endogenous variable. Fifth, the study focused on Mount Huangshan, a UNESCO World Heritage Site and the most attractive tourism destination in Anhui Province, China, which had previously not gained much consideration from academics and researchers in the context of the extensive evaluation of potential tourists’ attitudes toward heritage sites, heritage image, and more importantly travel intention toward heritage sites. Furthermore, an important predictor (UGC), along with other predictors (traditional WOM and commercial e-WOM), were tested from the perspective of Mount Huangshan. They are very significant, but appear to have been neglected and not tested before together in empirical studies.
The findings of our study also offer some useful managerial directions. This study identified (1) five noteworthy dimensions of travel intention toward heritage sites, (2) three dimensions of attitude toward heritage sites, and (3) three dimensions regarding the improvement of heritage image. In the context of travel intention toward mountains, the results showed the positive and significant influence of destination image, attitude, traditional WOM, commercial e-WOM, and UGC. Therefore, planners and marketing departments must keep in mind the worth of a different kind of WOM (categorically speaking, traditional, commercial e-WOM, and UGC) in their policies on sustainable development in the field of heritage tourism. Therefore, in the context of practical contribution, it could be recognized which type of WOM is counted as the most important for marketing resources in accordance with their level of credibility. The findings of our study are also helpful for promoting and branding the image of and attitude toward mountain area destinations. The implication in practice should be enhanced from the perspective of marketing based on new social media and how to use big data from social media to obtain valuable information to support decision making and promotion. The significant results also recommend that tourism management organizations and their managers should focus on social media platforms, as UGC was one of the most important predictors of image, attitude, and travel intention toward visiting mountain area destinations. Moreover, by creating public discussion blogs for experienced tourists, managers could spread awareness among the general public about the image of heritage sites, which could possibly lead toward a positive attitude and travel intention toward heritage sites and ultimately increase the number of potential tourists in scenic spots in mountain areas.

6.2. Limitations and Future Research

This study had some inescapable limitations that must be considered. First, the findings of this study cannot be generalized to a large extent because the scope of our study was limited to one scenic spot, Mount Huangshan. Second, this study used a convenience sampling method. Third, the respondents of this study were a mixture of domestic and international tourists. Fourth, we used two versions of the questionnaire (English and Chinese). Fifth, the variables used in the present study, despite being based on other studies, could be modified or extended, since other variables can be used to measure user attitudes. The same applies to the variables that measured the other constructs. Furthermore, the sample size was limited to 280 respondents. There are some possible future work directions related to the present study. A more accurate or different sampling method could be used with an increased sample size to support these findings in the future. In future investigations, the authors should have more answers or should limit the analysis to international or domestic tourists, as they have different perspectives, life experiences, and above all, knowledge of the area of study. As this study was limited to one scenic spot, future studies may want to replicate the same proposed model by using a different scenic spot. There are also future directions that can be considered in replicating the same proposed model in the context of domestic and international tourists separately. In this advanced technology era, most internet users use mobile internet to explore social networking websites and other different platforms. Therefore, the significance of different kinds of WOM as predictors of heritage image, attitude, and travel intention toward heritage sites can be checked by incorporating mobile users into our proposed model. As the present study was conducted during the Chinese summer vacations, future studies may want to change the time period of data collection to check seasonal effects. As UGC mostly belongs to social media marketing (SNS), future studies may want to incorporate the pervasive adoption of SNS into the model proposed in the present study, along with psychological factors relevant to behavior.

Author Contributions

C.L., D.G., and S.M. conceived this study and executed the idea.

Funding

This research received no external funding.

Acknowledgments

This research was partially supported by the National Natural Science Foundation of China under Grant Nos. 71331002, 71771075, 71771077, and 71601061.

Conflicts of Interest

The authors declare no conflict of interest.

References

  1. Saeedi, H.; Hanzaee, K.H. The effects of heritage image on destination branding: An Iranian perspective. J. Herit. Tour. 2018, 13, 152–166. [Google Scholar] [CrossRef]
  2. Wu, H.C.; Li, T. A study of experiential quality, perceived value, heritage image, experiential satisfaction, and behavioral intentions for heritage tourists. J. Hosp. Tour. Res. 2017, 41, 904–944. [Google Scholar] [CrossRef]
  3. Mainolfi, G.; De Nisco, A.; Marino, V.; Napolitano, M.R. The role of cultural heritage in country image research. Proposal and testing of a cultural heritage image scale. In Proceedings of the 6th EMAC Regional Conference Convergence and Divergence in the New Europe: Marketing Challenges and Issues, Vienna, Austria, 16–18 September 2015; pp. 1–7. [Google Scholar]
  4. Rindell, A. Image Heritage—The Temporal Dimension in Consumers’ Corporate Image Constructions; Svenska Handelshögskolan: Helsinki, Finland, 2008. [Google Scholar]
  5. Keller, K. Conceptualizing, measuring, and managing customer based equity. J. Mark. 1993, 1, 1–22. [Google Scholar] [CrossRef]
  6. Rindell, A. Time in corporate images: Introducing image heritage and image-in-use. Qual. Mark. Res. 2013, 16, 197–213. [Google Scholar] [CrossRef]
  7. Baloglu, S.; McCleary, K.W. A model of destination image formation. Ann. Tour. Res. 1999, 26, 868–897. [Google Scholar] [CrossRef]
  8. Ishida, K.; Slevitch, L.; Siamionava, K. The Effects of Traditional and Electronic Word-of-Mouth on Destination Image: A Case of Vacation Tourists Visiting Branson, Missouri. Adm. Sci. 2016, 6, 12. [Google Scholar] [CrossRef]
  9. Jalilvand, M.R.; Ebrahimi, A.; Samiei, N. Electronic word of mouth effects on tourists’ attitudes toward Islamic destinations and travel intention: An empirical study in Iran. Procedia Soc. Behav. Sci. 2013, 81, 484–489. [Google Scholar] [CrossRef]
  10. Rizky, R.M.; Kusdi, R.; Yusri, A. The impact of e-WOM on destination image, attitude toward destination and travel intention. Russ. J. Agric. Socio-Econ. Sci. 2017, 61, 94–104. [Google Scholar]
  11. Abubakar, A.M.; Ilkan, M.; Al-Tal, R.M.; Eluwole, K.K. eWOM, revisit intention, destination trust and gender. J. Hosp. Tour. Manag. 2017, 31, 220–227. [Google Scholar] [CrossRef] [Green Version]
  12. Abubakar, A.M.; Ilkan, M. Impact of online WOM on destination trust and intention to travel: A medical tourism perspective. J. Destin. Mark. Manag. 2016, 5, 192–201. [Google Scholar] [CrossRef]
  13. Mahpour, A.; Mamdoohi, A.; HosseinRashidi, T.; Schmid, B.; Axhausen, K.W. Shopping destination choice in Tehran: An integrated choice and latent variable approach. Transp. Res. Part F 2018, 58, 566–580. [Google Scholar] [CrossRef]
  14. Tan, W.K. Repeat visitation: A study from the perspective of leisure constraint, tourist experience, destination images, and experiential familiarity. J. Destin. Mark. Manag. 2017, 6, 233–242. [Google Scholar] [CrossRef]
  15. Whang, H.; Yong, S.; Ko, E. Pop culture, destination images, and visit intentions: Theory and research on travel motivations of Chinese and Russian tourists. J. Bus. Res. 2016, 69, 631–641. [Google Scholar] [CrossRef]
  16. Tussyadiah, I.P.; Wang, D.; Jung, T.H.; Dieck, M.C. Virtual reality, presence, and attitude change: Empirical evidence from tourism. Tour. Manag. 2018, 66, 140–154. [Google Scholar] [CrossRef]
  17. Beerli, A.; Martin, J.D. Factors influencing destination image. Ann. Tour. Res. 2004, 31, 657–681. [Google Scholar] [CrossRef]
  18. Phau, I.; Shanka, T.; Dhayan, N. Destination image and choice intention of university student travellers to Mauritius. Int. J. Contemp. Hosp. Manag. 2010, 22, 758–764. [Google Scholar] [CrossRef]
  19. Murray, K.B. A test of services marketing theory: Consumer information acquisition activities. J. Mark. 1991, 55, 10–25. [Google Scholar] [CrossRef]
  20. Blal, I.; Sturman, M.C. The differential effects of the quality and quantity of online reviews on hotel room sales. Cornell Hosp. Q. 2014, 55, 365–375. [Google Scholar] [CrossRef]
  21. Xia, L.; Bechwati, N. Word of mouse: The role of cognitive personalization in online consumer reviews. J. Interact. Advert. 2008, 9, 3–13. [Google Scholar] [CrossRef]
  22. Hanlan, J.; Kelly, S. Image formation, information sources and an iconic Australian tourist destination. J. Vacat. Mark. 2005, 11, 163–177. [Google Scholar] [CrossRef]
  23. Yang, F.X. Effects of restaurant satisfaction and knowledge sharing motivation on eWOM intentions: The moderating role of technology acceptance factors. J. Hosp. Tour. Res. 2017, 41, 93–127. [Google Scholar] [CrossRef]
  24. Zarrad, H.; Debabi, M. Analyzing the effect of electronic word of mouth on tourists’ attitude toward Destination and Travel Intention. Int. Res. J. Soc. Sci. 2015, 4, 53–60. [Google Scholar]
  25. Gursoy, D.; McCleary, K.W. An integrative model of tourists’ information search behavior. Ann. Tour. Res. 2004, 31, 353–373. [Google Scholar] [CrossRef]
  26. Jalilvand, M.R.; Esfahani, S.S.; Samiei, N. Electronic word-of-mouth: Challenges and opportunities. Procedia Comput. Sci. 2011, 3, 42–46. [Google Scholar] [CrossRef]
  27. Gretzel, U.; Yoo, K.H. Use and impact of online travel reviews. In Information and Communication Technologies in Tourism; Springer: Vienna, Austria, 2008; pp. 35–46. [Google Scholar]
  28. Senecal, S.; Nantel, J. The influence of online product recommendations on consumers’ online choices. J. Retail. 2004, 80, 159–169. [Google Scholar] [CrossRef]
  29. Goh, K.Y.; Heng, C.S.; Lin, Z. Social media brand community and consumer behavior: Quantifying the relative impact of user-and marketer-generated content. Inf. Syst. Res. 2013, 24, 88–107. [Google Scholar] [CrossRef]
  30. Kinard, B.R.; Capella, M.L. Relationship marketing: The influence of consumer involvement on perceived service benefits. J. Serv. Mark. 2006, 20, 359–368. [Google Scholar] [CrossRef]
  31. Avkiran, N.K. Rise of the Partial Least Squares Structural Equation Modeling: An Application in Banking. In Partial Least Squares Structural Equation Modeling; Springer: Cham, Switzerland, 2018; pp. 1–29. [Google Scholar]
  32. Carl, W.J. What’s all the buzz about? Everyday communication and the relational basis of word-of-mouth and buzz marketing practices. Manag. Commun. Q. 2006, 19, 601–634. [Google Scholar] [CrossRef]
  33. Naqvi, M.H.A.; Jiang, Y.; Naqvi, M.H.; Miao, M.; Liang, C.; Mehmood, S. The Effect of Cultural Heritage Tourism on Tourist Word of Mouth: The Case of Lok Versa Festival, Pakistan. Sustainability 2018, 10, 2391. [Google Scholar] [CrossRef]
  34. Gupta, P.; Harris, J. How e-WOM recommendations influence product consideration and quality of choice: A motivation to process information perspective. J. Bus. Res. 2010, 63, 1041–1049. [Google Scholar] [CrossRef]
  35. Cox, C.; Burgess, S.; Sellitto, C.; Buultjens, J. The role of user-generated content in tourists’ travel planning behavior. J. Hosp. Mark. Manag. 2009, 18, 743–764. [Google Scholar] [CrossRef]
  36. Brown, J.J.; Reingen, P.H. Social ties and word-of-mouth referral behavior. J. Consum. Res. 1987, 14, 350–362. [Google Scholar] [CrossRef]
  37. Steffes, E.M.; Burgee, L.E. Social ties and online word of mouth. Internet Res. 2009, 19, 42–59. [Google Scholar] [CrossRef]
  38. Bieger, T.; Laesser, C. Information sources for travel decisions: Toward a source process model. J. Travel Res. 2004, 42, 357–371. [Google Scholar] [CrossRef]
  39. Mehmood, S.; Ahmad, Z.; Khan, A.A. Dynamic relationships between tourist arrivals, immigrants, and crimes in the United States. Tour. Manag. 2016, 54, 383–392. [Google Scholar] [CrossRef]
  40. Daugherty, T.; Hoffman, E. eWOM and the importance of capturing consumer attention within social media. J. Mark. Commun. 2014, 20, 82–102. [Google Scholar] [CrossRef]
  41. Hennig-Thurau, T.; Gwinner, K.P.; Walsh, G.; Gremler, D.D. Electronic word-of-mouth via consumer-opinion platforms: What motivates consumers to articulate themselves on the internet? J. Interact. Mark. 2004, 18, 38–52. [Google Scholar] [CrossRef]
  42. Setiawan, P.Y.; Troena, E.A.; Armanu, N. The effect of e-WOM on destination image, satisfaction and loyalty. Int. J. Bus. Manag. Invent. 2014, 3, 22–29. [Google Scholar]
  43. Fakeye, P.C.; Crompton, J.L. Image differences between prospective, first-time, and repeat visitors to the Lower Rio Grande Valley. J. Travel Res. 1991, 30, 10–16. [Google Scholar] [CrossRef]
  44. Jalilvand, M.R.; Samiei, N. The impact of electronic word of mouth on a tourism destination choice: Testing the theory of planned behavior (TPB). Internet Res. 2012, 22, 591–612. [Google Scholar] [CrossRef]
  45. Di Pietro, L.; Di Virgilio, F.; Pantano, E. Social network for the choice of tourist destination: Attitude and behavioural intention. J. Hosp. Tour. Technol. 2012, 3, 60–76. [Google Scholar] [CrossRef]
  46. Castañeda, J.A.; Rodríguez, M.A.; Luque, T. Attitudes’ hierarchy of effects in online user behaviour. Online Inf. Rev. 2009, 33, 7–21. [Google Scholar] [CrossRef]
  47. Ladhari, R.; Michaud, M. eWOM effects on hotel booking intentions, attitudes, trust, and website perceptions. Int. J. Hosp. Manag. 2015, 46, 36–45. [Google Scholar] [CrossRef]
  48. Albarq, A.N. Measuring the impacts of online word-of-mouth on tourists’ attitude and intentions to visit Jordan: An empirical study. Int. Bus. Res. 2013, 7, 14–22. [Google Scholar] [CrossRef]
  49. Dennis, C.; Morgan, A.; Wright, L.T.; Jayawardhena, C. The influences of social e-shopping in enhancing young women’s online shopping behaviour. J. Cust. Behav. 2010, 9, 151–174. [Google Scholar] [CrossRef]
  50. O’Connor, P. Managing a hotel’s image on TripAdvisor. J. Hosp. Mark. Manag. 2010, 19, 754–772. [Google Scholar] [CrossRef]
  51. Bickart, B.; Schindler, R.M. Internet forums as influential sources of consumer information. J. Interact. Mark. 2001, 15, 31–40. [Google Scholar] [CrossRef]
  52. Brown, J.; Broderick, A.J.; Lee, N. Word of mouth communication within online communities: Conceptualizing the online social network. J. Interact. Mark. 2007, 21, 2–20. [Google Scholar] [CrossRef]
  53. Vermeulen, I.E.; Seegers, D. Tried and tested: The impact of online hotel reviews on consumer consideration. Tour. Manag. 2009, 30, 123–127. [Google Scholar] [CrossRef]
  54. Zhang, Z.; Ye, Q.; Law, R.; Li, Y. The impact of e-word-of-mouth on the online popularity of restaurants: A comparison of consumer reviews and editor reviews. Int. J. Hosp. Manag. 2010, 29, 694–700. [Google Scholar] [CrossRef]
  55. Schmallegger, D.; Carson, D. Blogs in tourism: Changing approaches to information exchange. J. Vacat. Mark. 2008, 14, 99–110. [Google Scholar] [CrossRef]
  56. Abubakar, A.M. Does eWOM influence destination trust and travel intention: A medical tourism perspective. Econ. Res.-Èkon. Istraz. 2016, 29, 598–611. [Google Scholar]
  57. Phelps, A. Holiday destination image—The problem of assessment: An example developed in Menorca. Tour. Manag. 1986, 7, 168–180. [Google Scholar] [CrossRef]
  58. Alhemoud, A.M.; Armstrong, E.G. Image of tourism attractions in Kuwait. J. Travel Res. 1996, 34, 76–80. [Google Scholar] [CrossRef]
  59. Hunt, J.D. Image as a factor in tourism development. J. Travel Res. 1975, 13, 1–7. [Google Scholar] [CrossRef]
  60. Alcañiz, E.B.; García, I.S.; Blas, S.S. Relationships among residents’ image, evaluation of the stay and post-purchase behaviour. J. Vacat. Mark. 2005, 11, 291–302. [Google Scholar] [CrossRef]
  61. Lin, C.H.; Morais, D.B.; Kerstetter, D.L.; Hou, J.S. Examining the role of cognitive and affective image in predicting choice across natural, developed, and theme-park destinations. J. Travel Res. 2007, 46, 183–194. [Google Scholar] [CrossRef]
  62. Nassar, M.A.; Mostafa, M.M.; Reisinger, Y. Factors influencing travel to Islamic destinations: An empirical analysis of Kuwaiti nationals. Int. J. Cult. Tour. Hosp. Res. 2015, 9, 36–53. [Google Scholar] [CrossRef]
  63. Jalilvand, M.R.; Samiei, N.; Dini, B.; Manzari, P.Y. Examining the structural relationships of electronic word of mouth, destination image, tourist attitude toward destination and travel intention: An integrated approach. J. Destin. Mark. Manag. 2012, 1, 134–143. [Google Scholar] [CrossRef]
  64. Kraus, S.J. Attitudes and the prediction of behavior: A meta-analysis of the empirical literature. Personal. Soc. Psychol. Bull. 1995, 21, 58–75. [Google Scholar] [CrossRef]
  65. Schiffman, L.G.; Kanuk, L.L. Consumer Behavior, 5th ed.; Prentice Hall: Englewood Cliffs, NJ, USA, 1995. [Google Scholar]
  66. Ajzen, I. The theory of planned behavior. Organ. Behav. Hum. Decis. Process. 1994, 50, 179–211. [Google Scholar] [CrossRef]
  67. Vining, J.; Ebreo, A. What makes a recycler? A comparison of recyclers and non-recyclers. Environ. Behav. 1990, 22, 55–73. [Google Scholar] [CrossRef]
  68. Lee, T.H. A structural model to examine how destination image, attitude, and motivation affect the future behavior of tourists. Leis. Sci. 2009, 31, 215–236. [Google Scholar] [CrossRef]
  69. Sparks, B. Planning a wine tourism vacation? Factors that help to predict tourist behavioural intentions. Tour. Manag. 2007, 28, 1180–1192. [Google Scholar] [CrossRef]
  70. Steel, B.S. Thinking globally and acting locally? Environmental attitudes, behaviour and activism. J. Environ. Manag. 1996, 47, 27–36. [Google Scholar] [CrossRef]
  71. Kim, S.B.; Kwon, K.J. Examining the Relationships of Image and Attitude on Visit Intention to Korea among Tanzanian College Students: The Moderating Effect of Familiarity. Sustainability 2018, 10, 360. [Google Scholar] [CrossRef]
  72. The Office of Statistics Huangshan City. National Economy and Society Developed Statistical Bulletin of Huangshan City; The Office of Statistics Huangshan City: Huangshan, China, 2015. [Google Scholar]
  73. Ministry of Environmental Protection of the China. Ecological Environment Protection Planning of Lakes at Good Water Quality (2013–2020). 2013. Available online: http://www.zhb.gov.cn/gkml/hbb/bwj/201409/t20140930_289795.htm (accessed on 23 February 2018).
  74. Cui, S.Q.; Zhao, L.; Lu, C.-W. Land use change and its ecological effect in Huangshan city. Ecol. Sci. 2006, 25, 350–353. [Google Scholar]
  75. Mack, R.W.; Blose, J.E.; Pan, B. Believe it or not: Credibility of blogs in tourism. J. Vacat. Mark. 2008, 14, 133–144. [Google Scholar] [CrossRef]
  76. Lee, R.; Lockshin, L. Halo effects of tourists’ destination image on domestic product perceptions. Australas. Mark. J. 2011, 19, 7–13. [Google Scholar] [CrossRef]
  77. Gamble, A.; Juliusson, E.A.; Gärling, T. Consumer attitudes towards switching supplier in three deregulated markets. J. Socio-Econ. 2009, 38, 814–819. [Google Scholar] [CrossRef]
  78. Hair, J.F.; Hult, G.T.M.; Ringle, C.M.; Sarstedt, M. A Primer on Partial Least Squares Structural Equation Modeling (PLS-SEM), 2nd ed.; Sage: Thousand Oaks, CA, USA, 2017. [Google Scholar]
  79. Nitzl, C.; Chin, W.W. The case of partial least squares (PLS) path modeling in managerial accounting research. J. Manag. Control 2017, 28, 137–156. [Google Scholar] [CrossRef]
  80. Jöreskog, K.G. Basic ideas of factor and component analysis. In Advances in Factor Analysis and Structural Equation Models; Jöreskog, K.G., Sörbom, D., Eds.; University Press of America: New York, NY, USA, 1979; pp. 5–20. [Google Scholar]
  81. Sarstedt, M.; Hair, J.F.; Ringle, C.M.; Thiele, K.O.; Gudergan, S.P. Estimation Issues with PLS and CBSEM: Where the Bias Lies! J. Bus. Res. 2016, 69, 3998–4010. [Google Scholar] [CrossRef]
  82. Henseler, J.; Dijkstra, T.K.; Sarstedt, M.; Ringle, C.M.; Diamantopoulos, A.; Straub, D.W.; Ketchen, D.J.; Hair, J.F.; Hult, G.T.M.; Calantone, R.J. Common Beliefs and Reality about Partial Least Squares: Comments on Rönkkö & Evermann. Organ. Res. Methods 2014, 17, 182–209. [Google Scholar]
  83. Wong, K.K. Handling small survey sample size and skewed dataset with partial least square path modelling. Vue, 20 November 2010; 20–23. [Google Scholar]
  84. Henseler, J.; Ringle, C.M.; Sinkovics, R.R. The use of partial least squares path modeling in international marketing. In New Challenges to International Marketing; Emerald Group Publishing Limited: Bingley, UK, 2009; pp. 277–319. [Google Scholar]
  85. Ringle, C.M.; Wende, S.; Becker, J.M. SmartPLS 3; SmartPLSGmbH: Boenningstedt, Germany, 2015; Available online: http://www.smartpls.com (accessed on 16 March 2017).
  86. Dijkstra, T.K.; Henseler, J. Consistent partial least squares path modeling. MIS Q. 2015, 39, 297–316. [Google Scholar] [CrossRef]
  87. Gadermann, A.M.; Guhn, M.; Zumbo, B.D. Estimating ordinal reliability for Likert-type and ordinal item response data: A conceptual, empirical, and practical guide. Pract. Assess. Res. Eval. 2012, 17, 1–13. [Google Scholar]
  88. Hair, J.F.; Ringle, C.M.; Sarstedt, M. PLS-SEM: Indeed a silver bullet. J. Mark. Theory Pract. 2011, 19, 139–151. [Google Scholar] [CrossRef]
  89. Chin, W.W. How to write up and report PLS analyses. In Handbook of Partial Least Squares: Concepts, Methods and Applications; Springer Handbooks of Computational Statistics Series; Vinzi, V.E., Chin, W.W., Henseler, J., Wang, H., Eds.; Springer: Heidelberg, Germany, 2010; Volume 2, pp. 655–690. [Google Scholar]
  90. Schuberth, F.; Henseler, J.; Dijkstra, T.K. Partial least squares path modeling using ordinal categorical indicators. Qual. Quant. 2018, 52, 9–35. [Google Scholar] [CrossRef] [PubMed]
  91. Henseler, J.; Ringle, C.M.; Sarstedt, M. A new criterion for assessing discriminant validity in variance-based structural equation modeling. J. Acad. Mark. Sci. 2015, 43, 115–135. [Google Scholar] [CrossRef]
  92. Kline, R.B. Principles and Practice of Structural Equation Modeling; Guilford Publications: New York, NY, USA, 2015. [Google Scholar]
  93. Fornell, C.; Larcker, D.F. Evaluating structural equation models with unobservable variables and measurement error. J. Mark. Res. 1981, 18, 39–50. [Google Scholar] [CrossRef]
  94. Streukens, S.; Leroi-Werelds, S. Bootstrapping and PLS-SEM: A step-by-step guide to get more out of your bootstrap results. Eur. Manag. J. 2016, 34, 618–632. [Google Scholar] [CrossRef]
  95. Preacher, K.J.; Hayes, A.F. Asymptotic and resampling strategies for assessing and comparing indirect effects in multiple mediator models. Behav. Res. Methods 2008, 40, 879–891. [Google Scholar] [CrossRef] [PubMed] [Green Version]
  96. Wong, K.K. Mediation analysis, categorical moderation analysis, and higher order constructs modeling in Partial Least Squares Structural Equation Modeling (PLSSEM): A B2B Example using SmartPLS. Mark. Bull. 2016, 26, 1–22. [Google Scholar]
  97. Streukens, S.; Wetzels, M.; Daryanto, A.; De Ruyter, K. Analyzing factorial data using PLS: Application in an online complaining context. In Handbook of Partial Least Squares; Springer: Berlin/Heidelberg, Germany, 2010; pp. 567–587. [Google Scholar]
  98. Shaffer, J.P. Multiple hypothesis testing. Ann. Rev. Psychol. 1995, 46, 561–584. [Google Scholar] [CrossRef]
  99. Henseler, J.; Ringle, C.M.; Sarstedt, M. Testing measurement invariance of composites using partial least squares. Int. Mark. Rev. 2016, 33, 405–431. [Google Scholar] [CrossRef]
  100. Henseler, J.; Hubona, G.; Ray, P.A. Using PLS path modeling in new technology research: Updated guidelines. Ind. Manag. Data Syst. 2016, 116, 2–20. [Google Scholar] [CrossRef]
  101. Hu, L.T.; Bentler, P.M. Cut off criteria for fit indexes in covariance structure analysis: Conventional criteria versus new alternatives. Struct. Equ. Model. 1999, 6, 1–55. [Google Scholar] [CrossRef]
  102. Kenny, D. Measuring Model Fit. In IBM SPSS Statistics for Windows Version 22.0; IBM Corp.: Armonk, NY, USA, 2015; Available online: http://davidakenny.net/cm/fit.htm (accessed on 18 June 2018).
  103. Tenenhaus, M.; Vinzi, V.E.; Chatelin, Y.M.; Lauro, C. PLS path modeling. Comput. Stat. Data Anal. 2005, 48, 159–205. [Google Scholar] [CrossRef]
  104. Chin, W.W. Commentary: Issues and Opinion on Structural Equation Modeling. MIS Q. 1998, 22, vii. [Google Scholar]
  105. Stone, M. Cross-validatory choice and assessment of statistical predictions. J. R. Stat. Soc. Ser. B 1974, 36, 111–147. [Google Scholar]
  106. Chin, W.W. The partial least squares approach to structural equation modeling. Mod. Methods Bus. Res. 1998, 295, 295–336. [Google Scholar]
  107. Cohen, J. Statistical Power Analysis for the Behavioral Sciences; Lawrence Erlbaum: Hillside, NJ, USA, 1988. [Google Scholar]
  108. Cepeda, G.; Nitzl, C.; Roldán, J.L. Mediation analyses in partial least squares structural equation modeling: Guidelines and empirical examples. In Partial Least Squares Path Modeling: Basic Concepts, Methodological Issues and Applications; Latan, H., Noonan, R., Eds.; Springer: Heidelberg, Germany, 2018; pp. 173–195. [Google Scholar]
  109. Hair, J.F.; Sarstedt, M.; Ringle, C.M.; Gudergan, S.P. Advanced Issues in Partial Least Squares Structural Equation Modeling (PLS-SEM); Sage: Thousand Oaks, CA, USA, 2018. [Google Scholar]
  110. Gudergan, S.P.; Ringle, C.M.; Wende, S.; Will, A. Confirmatory tetrad analysis in PLS path modeling. J. Bus. Res. 2008, 61, 1238–1249. [Google Scholar] [CrossRef]
  111. Ringle, C.M.; Sarstedt, M. Gain more insight from your PLS-SEM results: The importance-performance map analysis. Ind. Manag. Data Syst. 2016, 116, 1865–1886. [Google Scholar] [CrossRef]
  112. Phillips, W.; Jang, S. Destination image and tourist attitude. Tour. Anal. 2008, 13, 401–411. [Google Scholar]
  113. Lindblom, A.; Lindblom, T.; Lehtonen, M.J.; Wechtler, H. A study on country images, destination beliefs, and travel intentions: A structural equation model approach. Int. J. Tour. Res. 2018, 20, 1–10. [Google Scholar] [CrossRef]
  114. Artuger, S.; Cetinsoz, B.C. The impact of destination image and the intention to revisit: A study regarding Arab Tourists. Eur. Sci. J. 2017, 13, 82–98. [Google Scholar] [CrossRef]
  115. Stylos, N.; Vassiliadis, C.A.; Bellou, V.; Andronikidis, A. Destination images, holistic images and personal normative beliefs: Predictors of intention to revisit a destination. Tour. Manag. 2016, 53, 40–60. [Google Scholar] [CrossRef] [Green Version]
  116. Litvin, S.W.; Goldsmith, R.E.; Pan, B. Electronic word-of-mouth in hospitality and tourism management. Tour. Manag. 2008, 29, 458–468. [Google Scholar] [CrossRef] [Green Version]
Figure 1. Conceptual model.
Sustainability 10 04403 g001
Figure 2. Multimediation model.
Sustainability 10 04403 g002
Figure 3. Structured model and direct effects.
Sustainability 10 04403 g003
Figure 4. Magnitudes of the mediation paths H4b and H5b.
Sustainability 10 04403 g004
Figure 5. Magnitudes of the mediation paths H4c and H5c.
Sustainability 10 04403 g005
Figure 6. Magnitudes of the mediation paths H4d and H5d.
Sustainability 10 04403 g006
Figure 7. ImpactPerformance Map Analysis (IPMA) for travel intention toward heritage site.
Sustainability 10 04403 g007
Table 1. The demographic characteristics of the respondents.
FrequencyPercentCumulative Percent
GenderMale11541.0741.07
Female16558.93100
Marital StatusSingle14551.7951.79
Married11541.0792.86
Divorced207.14100
AgeUnder 18113.933.93
18–309533.9337.86
31–40843067.86
41–505318.9386.79
51 and above3713.21100
EducationHigh school or below4616.4316.43
College degree5820.7137.14
Bachelor’s degree12143.2180.36
Higher degree5519.64100
IncomeBelow 3000258.938.93
3000–49004616.4325.36
5000–79007326.0751.43
8000–10,0006824.2975.71
Over 10,0006824.29100
VisitFirst time17261.4361.43
2–3 times8128.9390.36
Over 3 times279.64100
Table 2. Measures.
Table 2. Measures.
ConstructsItemsSources
Heritage imageHI1: Safe and secure[76]
HI2: Interesting places
HI3: Natural attractions
HI4: Pleasant climate
HI5: Good value
Attitude toward heritage siteATHS1: Very good[77]
ATHS2: Valuable
ATHS3: Pleasant
Travel intention toward heritage siteTITHS1: Revisit[44]
TITHS2: Preference
TITHS3: Future intention
Traditional WOMTWOM1: Face-to-face opinions[75]
TWOM2: Face-to-face advice
TWOM3: Face-to-face choices
Commercial e-WOMCEWOM1: Good impressions[44]
CEWOM2: Right destination
CEWOM3: Attractive destination
CEWOM4: Certain destination
CEWOM5: Correct decision
CEWOM6: Feel confident
User-generated contentNEWOM1: Friends’ opinions[75]
NEWOM2: Relatives’ Suggestions
NEWOM3: Friends’ advice
Table 3. Reliability and validity of measurement scales.
ConstructsItemsOuter LoadingMean (SD)AlphaRhoCRAVE
HIHI10.8615.26 (0.933)0.9180.9180.9380.753
HI20.8755.39 (1.008)
HI30.8275.24 (0.882)
HI40.8835.24 (1.009)
HI50.8915.29 (0.967)
ATHSATHS10.8765.44 (0.973)0.840.8410.9040.758
ATHS20.8585.33 (0.932)
ATHS30.8785.44 (0.904)
TITHSTITHS10.8945.36 (0.972)0.8850.8850.9290.812
TITHS20.9005.46 (0.959)
TITHS30.9105.38 (0.948)
TWOMTWOM10.8935.23 (0.970)0.860.8630.9150.782
TWOM20.9045.28 (1.052)
TWOM30.8555.16 (0.829)
CEWOMCEWOM10.8915.45 (0.829)0.9410.9420.9530.773
CEWOM20.8895.40 (1.002)
CEWOM30.8795.43 (0.975)
CEWOM40.8665.43 (1.008)
CEWOM50.8845.57 (1.033)
CEWOM60.8655.46 (0.951)
UGCNEWOM10.8545.43 (0.979)0.8140.8150.890.729
NEWOM20.8605.38 (0.887)
NEWOM30.8485.45 (1.020)
Note: TWOM, CEWOM, UGC, HI, ATHS, and TITHS denote traditional e-WOM, commercial e-WOM, user-generated content, heritage image, attitude toward heritage site, and travel intention toward heritage site, respectively. SD, Alpha, CR, and AVE denote the standard deviation, Cronbach’s alpha, composite reliability, and average variance extracted, respectively.
Table 4. Discriminant validity.
CEWOMTWOMUGCHIATHSTITHS
CEWOM0.879
TWOM0.5310.884
UGC0.5510.7220.854
HI0.6340.6550.7770.868
ATHS0.5740.6780.7270.7350.870
TITHS0.6530.6760.7460.7810.7530.901
Heterotrait–monotrait ratio (HTMT)
CEWOM
TWOM0.587
UGC0.6280.862
HI0.6810.7360.898
ATHS0.6450.7960.8780.837
TITHS0.7130.7730.8780.8660.872
Note: TWOM, CEWOM, UGC, HI, ATHS, and TITHS denote traditional e-WOM, commercial e-WOM, user-generated content, heritage image, attitude toward heritage site, and travel intention toward heritage site, respectively. Fornell–Larcker parentheses bold values refer to the square root of the AVE values, and off-diagonal denotes the correlation between constructs.
Table 5. Structured model.
RelationDirect Effectt-ValueDecisionEffect Size f25%95%
H1aTWOM → HI0.120 **2.260Do not reject0.020.030.21
H1bTWOM → TITHS0.102 *1.705Do not reject0.020.000.20
H1cTWOM → ATHS0.265 ***4.353Do not reject0.080.160.36
H2aCEWOM → HI0.273 ***6.092Do not reject0.150.200.35
H2bCEWOM → TITHS0.183 ***3.729Do not reject0.070.100.27
H2cCEWOM → ATHS0.198 ***4.091Do not reject0.070.120.28
H3aUGC → HI0.540 ***9.536Do not reject0.390.450.63
H3bUGC → TITHS0.172 **2.554Do not reject0.030.070.29
H3cUGC → ATHS0.427 ***6.230Do not reject0.200.310.54
H4HI → TITHS0.285 ***4.470Do not reject0.090.180.39
H5ATHS → TITHS0.244 ***3.992Do not reject0.080.150.35
Note: TWOM, CEWOM, UGC, HI, ATHS, and TITHS denote traditional e-WOM, commercial e-WOM, user-generated content, heritage image, attitude toward heritage site, and travel intention toward heritage site, respectively. The asterisks *, **, and *** denote significance at the 1, 5, and 10 percent levels, respectively.
Table 6. Effect size and predictive relevance.
Endogenous VariablesQ2R2Exogenous VariablesEffect Size f2
HI0.3550.671TWOM0.02
CEWOM0.15
UGC0.39
ATHS0.3300.604TWOM0.08
CEWOM0.07
UGC0.03
ATTHS0.4190.723TWOM0.02
CEWOM0.07
UGC0.20
HI0.09
ATHS0.08
Note: TWOM, CEWOM, UGC, HI, ATHS, and TITHS denote traditional e-WOM, commercial e-WOM, user-generated content, heritage image, attitude toward heritage site, and travel intention toward heritage site, respectively. Q2 and R2 denote predictive relevance and the coefficient of determination, respectively.
Table 7. Multiple mediation analysis.
Mediation PathsSpecific Indirect EffectTotal EffectBootstrap 95%Remarks 1
Bias-CorrectedPercentile
H4bTWOMD → HI → TITHS0.034 *0.201 *** (3.128)[0.012; 0.072][0.008; 0.066]Reject
H5bTWOM → ATHS → TITHS0.065 ** [0.037; 0.112][0.031; 0.102]Do not reject
H4cCEWOM → HI → TITHS0.078 ***0.309 *** (6.356)0.046; 0.114][0.045; 0.114]Do not reject
H5cCEWOM → ATHS → TITHS0.048 ** [0.024; 0.085][0.022; 0.080]Reject
H5dUGC → HI → TITHS0.154 ***0.430 *** (6.639)[0.094; 0.225][0.094; 0.224]Do not reject
H5dUGC → ATHS → TITHS0.104 *** [0.060; 0.165][0.054; 0.157]Do not reject
Note: The asterisks *, **, and *** denote significance at the 1, 5, and 10 percent levels, respectively. TWOM, CEWOM, UGC, HI, ATHS, and TITHS denote traditional e-WOM, commercial e-WOM, user-generated content, heritage image, attitude toward heritage site, and travel intention toward heritage site, respectively. The number in parentheses is the t-value. DE, SIE, TE, and BC denote the direct effect, specific indirect effect, total effect, and bias-corrected, respectively. Here, t (0.05; 3999) = 1.645 *, t (0.01; 3999) = 2.327 **, t (0.001; 3999) = 3.092 ***; * p < 0.05, ** p < 0.01, and *** p < 0.001.1 We computed the variance accounted for (VAF) as suggested by Reference [78] to conclude to reject or not reject the mediation hypotheses. Hair et al. [78] mentioned that the VAF would be smaller than 0.2 in the presence of a significant indirect effect (VAF < 0.2, no mediation; 0.2 ≤ VAF ≤ 0.8, partial mediation; VAF > 0.8, full mediation).

