Design of Bus Bridging Routes in Response to Disruption of Urban Rail Transit


1
Department of Traffic Engineering, School of Highway, Chang’an University, Xi’an 710064, China
2
The Key Laboratory of Road and Traffic Engineering, Ministry of Education, Tongji University, Shanghai 201804, China
3
Department of Transportation Management Engineering, School of Traffic and Transportation, Beijing Jiaotong University, Beijing 100044, China
4
Department of Traffic Engineering, School of Highway, Chang’an University, Xi’an 710064, China
*
Author to whom correspondence should be addressed.
Sustainability 2018, 10(12), 4427; https://doi.org/10.3390/su10124427
Submission received: 30 September 2018
/
Revised: 17 November 2018
/
Accepted: 23 November 2018
/
Published: 27 November 2018
(This article belongs to the Section Sustainable Transportation)
Abstract
:Bus bridging has been widely used to connect stations affected by urban rail transit disruptions. This paper designs bus bridging routes for passengers in case of urban rail transit disruption. The types of urban rail transit disruption between Origin-Destination stations are summarized, and alternative bus bridging routes are listed. First, the feasible route generation method is established. Feasible routes for each pair of the disruption Origin-Destination stations include urban rail transit transfer, direct bus bridging, and indirect bus bridging. Then the feasible route generation model with the station capacity constraint is established. The k-short alternative routes are generated to form the bus bridging routes. Lastly, by considering the bus bridging resource constraints, the final bus bridging routes are obtained by merging and filtering the initial bridging routes. Numerical results of an illustrative network show that the bus bridging routes generated from the proposed model can significantly reduce travel delay of blocked passengers, and it is necessary to maintain the number of passengers in the urban rail transit below the station capacity threshold for ensuring a feasible routing design. One more important finding of this work is that the direct bridging route is preferred for short travel distances, while the indirect bridging route is preferred for longer travel distances. After the bridging bus routes are taken, the passenger’s total travel time is significantly lower than when no measures are taken. However, after the capacity constraint of a station is considered, the passenger’s total travel time will be increased by 3.49% compared with not considering a capacity constraint.
1. Introduction
Urban rail transit is a major traffic mode in many cities for its efficiency. However, rail transit disruptions, such as station equipment failures, power outages, explosions, etc., would occur from time to time. Statistics have shown that the outage time caused by disruption ranges from 10 min to even a few days. After such disruptions, a large number of passengers may gather in urban rail transit stations, which severely affects the entire urban rail transit system [1]. Many cities have established emergency evacuation plans for urban rail transit disruption, in order to transport passengers to the ground and recover normal operations of the urban rail transit system as quickly as possible to reduce losses. Common practices include transferring passengers to other rail lines and ground buses or emergency bus bridging and taxis [2].
Transfers within the urban rail transit system include reorganizing and adjusting subway operations in no disruption areas. Shen and Wilson put forward holding, skipping, and short-turning strategies, and pointed out holding combinations with short-turning can help reduce waiting times of blocked passengers [3]; Jespersen-Groth et al. proposed three sub-problems related to disruption response management for rail transit systems: timetable adjustment, rolling stock rescheduling, and crew rescheduling [4]. Corman and D’ariano considered several disruption resolution scenarios involving cancellation of services, rerouting, and shuttle trains [5]. Laporte et al. yielded a network that provided several alternative routes for given origin–destination pairs, therefore increasing robustness [6]. Cadarso et al. developed an integrated model of timetabling and rolling stock that gave specific consideration to the disruption response [7].
Providing alternative travel routes in the urban rail transit network relies on topological structures of the urban rail transit network (whether there is an alternative urban rail transit route between two stations) after disruption, as well as the severity of the damage (whether disruption affects more than one line). In the case that other urban rail transit routes cannot accommodate the blocked passengers within a tolerable time, bus bridging should be used instead [8,9,10,11]. That is, bus bridging should be utilized when the lasting time of the disruption is up to a certain threshold (for instance, policies in China require bus bridging when the forecast disruption time of two-way urban rail transit traffic is above 30 min); moreover, when only the road infrastructure and the bus services are fully efficient. Zeng et al. proposed that the combination of urban rail transit and taxi operation can help transport blocked passengers in time by adjusting the taxi fares [12]. Peng classified bus bridging into three categories: pick-up and drop-off of the passengers along the urban rail transit stations; transferring the blocked passengers to the surrounding transportation hub; and increasing the insufficient urban rail transit capacity in peak hours as supplementary transport [13]. Teng and Xu proposed an emergency cooperation strategy between urban rail transit and bus bridging [14]. However, current operations tend to solely rely on operators’ experience to design the route of bus bridging. Therefore, Jin et al. introduced localized integration with bus services to achieve the desired resilience to potential disruptions of urban rail transit [15]. Yang proposed an analytical framework for evaluating, in the case of interrupted conditions, the effect of bus bridging services on the degree of connectivity of rail networks [16]. Some researchers studied the response mechanism of urban rail transit disruption, and planned bus bridging routes by minimizing the waiting time and total loss of all passengers in the disruption area [17,18,19,20,21,22,23]. Van der Hurk et al. proposed a model to select bus bridging and frequencies under budget constraints [24]. Kepaptsoglou proposed a planning and design framework of bus bridging based on urban rail transit station layout, and a dynamic schedule model of bus bridging in urban rail transit disruption [25].
Firstly, most existing bus bridging routes are only planned between disrupted stations on a single line or several disrupted stations within a small scope, and the feasible routes are simple. In fact, most Origin-Destination (hereinafter called OD) pairs, and even farther OD pairs would be impacted in disruption, given that many real-world rail transit networks can be more complex; there are potentially many feasible routes for bus bridging, including direct bus bridging routes, bus bridging + urban rail transit, urban rail transit + bus bridging, urban rail transit + bus bridging + urban rail transit—the bus bridging problem becomes more and more complex. Consequently, in this paper, we established an optimal design model of bus bridging routes considering all feasible routes between disruption OD pairs and passenger route-choice behavior. Furthermore, most existing models aim to transport the blocked passengers to a bridging station near the disrupted zone, but because the station capacity constraints may not guarantee that all passengers can be transported to the same bridging station, more bridging stations should be chosen. Consequently, in this paper, we established an optimal design model of bus bridging routes considering bridging station capacity constraint and solved this model using the penalty method.
The rest of this paper is organized as follows. In Section 2, we define the types of disruption in an urban rail transit network and corresponding alternative bus bridging routes, further proposing the feasible route generation method considering passenger alternative route-choice behavior and bridging station capacity constraint, then merge the resulting bus bridging routes. Section 3 presents a case study containing four urban rail transit lines with 82 stations and analyzes the bus bridging route design results and relationship between bus bridging route and travel distance. Section 4 concludes the paper.
2. Methods
2.1. Notation
= disruption indicator from to ;
= the normal urban rail transit network without disruption, where is the set of urban rail transit stations; is the set of urban rail transit link units;
= the disrupted urban rail transit network is defined by a directed graph, where is the set of urban rail transit link units that are still available;
i, j = any station in the network, and are not necessarily adjacent to each other;
= the shortest route of urban rail transit transfer from to ;
= urban rail transit lines set;
= the urban rail transit stations set;
= whether the directed urban rail transit link from h to k is chosen;
= the in-vehicle cost of urban rail transit link h to k;
= the cost of transfer the urban rail transit;
ad(h) = the set of the stations that can be reached from station h by one urban rail transit link unit;
= direct bus bridging route from to ;
= the running time on a bus bridging route from to ;
= the shortest indirect bus bridging route from to ;
= the set of urban rail transit stations located on ;
= the set of stations located inside the disrupted section/between origin and fault section/between disrupted section and destination;
= the set of urban rail transit link units that still are available;
= the set of bus bridging link units;
represents a bus bridging route from to , to , to , respectively;
is a part of ;
= dependent factor;
= whether the directed bus bridging link from h to k is chosen;
= the cost of the bus bridging link;
= the transfer cost between bus bridging and urban rail transit;
= the total number of all the feasible routes from to ;
= punishment route from to ;
M = an arbitrary large positive value;
= the bus bridging network;
/ = the set of the urban rail transit/bus bridging link units which constitute the alternative routes ;
= the set of urban rail transit stations that are passed by the alternative routes ;
= passenger flow on the bridging route r before merging;
= the average waiting time on route r/merger route;
/ = the in-vehicle time on route r/merger route;
p,q = the stations connected by the bridging route r before merging;
= the realistic headway/demand frequency of the bus bridging on r;
= the length of r;
= the speed of the bus bridging;
= the assign/demand number of bus bridging on r;
c = the capacity of one bus bridging;
= load factor.
2.2. Types of Urban Rail Transit Network Disruption and Alternate Bus Bridging Routes
We define a pair of rail transit stations as disrupted OD stations if such pair of rail transit stations is interrupted in the disrupted network. Further, we define the interruption as complete disruption if stations i, j are unable to be connected within the disrupted network through any transfer, and the interruption as incomplete disruption if stations i, j can still be connected through a transfer. The bus bridging routes of complete disruption only include direct and indirect bus bridging routes, while bus bridging routes of incomplete disruption need to consider transfer urban rail transit as well. This disruption indicator is defined as follows.
Incomplete disruption is considered because although stations can be connected through transfers, the time required is possibly far greater than the normal travel time. For example, disruption occurs on the ring line and all disrupted OD stations are still connected, but the detour time through the opposite direction will greatly increase, and using bus bridging is a more realistic alternative. While for the case where the transfer to other urban rail transit lines needs less time than bus bridging, the bus bridging becomes unnecessary. In other words, if = 0, we need a bus bridging service between i, j stations. If = 0.5, we need to consider whether the transfer or the bus bridging saves more time.
The bus bridging routes between the disrupted OD stations include both direct and indirect routes.
- (a)
- Direct bus bridging routes connect disrupted OD stations directly.
- (b)
- Indirect bus bridging routes connect disrupted OD stations by combining a bus bridging route and the urban rail transit network that has not been damaged. According to the combination sequence of traffic modes, the indirect bus bridging routes can be further divided into three types.
Indirect bus bridging route Type 1: bus bridging + urban rail transit. Passengers take a bridging bus from the origin station to an urban rail transit station across the disrupted zone, and then take urban rail transit to the destination.
Indirect bus bridging route Type 2: urban rail transit + bus bridging. Passengers take urban rail transit to a station near the disrupted zone, and then transfer to a bridging bus across the disrupted zone to the destination.
Indirect bus bridging route Type 3: urban rail transit + bus bridging + urban rail transit. Passengers take urban rail transit to a station near the disrupted zone, transfer to a bridging bus across the disrupted zone, and then take urban rail transit to the destination.
2.3. Feasible Route Generation
2.3.1. Feasible Route Generation without Capacity Constraint
The feasible routes that connect the disrupted OD stations include urban rail transit transfers, direct and indirect bus bridging. The feasible route generation method is introduced as follows Figure 1.
Step 1: Generating the shortest route of urban rail transit transfer. means urban rail transit transfer. The shortest route search model of urban rail transit transfer is established as follows. If no specific instructions are given, the stations mentioned belong to .
Objective Equation (2) generates the urban rail transit transfer route with minimum cost, which includes in-vehicle costs and transfer costs of urban rail transit. In-vehicle cost is defined as the total in-vehicle time on urban rail transit routes, and transfer cost is defined as the number of transfers multiplied by transfer time.
The model deals with the transfer judgement as follows. For the case without transfers, the two urban rail transit links in connecting to station h belong to the same urban rail transit line, . For the case with transfers, the two urban rail transit links in connecting to station h belong to different urban rail transit lines and , i.e., , which is equivalent to . Hence, Equation (10) indicates whether transfers occur at station h.
Equations (3) and (4) constrain that the directed route starts from the origin station i; Equations (5) and (6) constrain that the directed route ends at the terminal station j; Equation (7) prevents the directed route breaking at the stations except for i and j; Equation (8) prevents a circuit route being generated.
The cost of the shortest transfer route is defined in Equation (11). If , it means that there is no transfer route to connect the disrupted OD stations in the disrupted urban rail transit network.
Step 2: Generating the direct bus bridging route . The direct bus bridging routes connect the disrupted OD stations directly. There is no transfer cost in direct bus bridging. Especially, if the disrupted OD stations are inside the disrupted section simultaneously, they can only be connected by direct bus bridging. If is greater than the threshold = 30 min, then the route is canceled. The cost of the direct bus bridging route is defined in Equation (12).
Step 3: Generating the shortest indirect bus bridging route . If the OD stations are outside the disrupted section, can be divided into three subsets . The bus bridging links are set to connect any pair of and to ensure the bus bridging route spans the disrupted section. If the destination/origin is inside the disrupted section, can be divided into two subsets . The bus bridging links are set to connect any pair of and destination/ and origin. The running time of the bus bridging links must be less than . Then is expanded, here .
According to the analysis, the indirect bus bridging route can be divided into a trip chain as Equation (13). :
The route search model of shortest indirect bridging is established as follows. If no specific instructions are given, the stations mentioned belong to .
Objective Equation (14) generates the cost of the indirect bridging route , which includes in-vehicle time of the bus bridging, in-vehicle time of urban rail transit, and transfer time.
The model deals with the transfer judgement as follows: for the case without a transfer, the two links in connecting to station h are both urban rail transit links, ; for the case with a transfer, the two links in connecting to station h, one is an urban rail transit link, the other is a bus bridging link. or , which is equivalent to or . Hence Equation (23) indicates whether transfer occurs at station h.
Equations (15)–(20) are similar to Equations (3)–(8); Equation (21) prevents the direct bus bridging route generating here.
The cost of the shortest indirect bridging route is shown as Equation (24).
2.3.2. Feasible Route Generation with Capacity Constraints of Station
Due to the station capacity constraints, only one shortest feasible route for each pair of disruption OD stations is not enough. When multiple routes intersect at the one station, the volume of passengers would exceed the realistic station capacity. Thus, part of the pairs of the disruption OD stations need to sacrifice their shortest ones to choose other feasible routes to avoid transfer at the saturation station. However, it is not possible to include all feasible routes of each pair of the disruption OD stations simultaneously in traffic assignment, since that would dramatically increase the computational cost. Thus, k-short alternative routes are proposed, where the k value is critical. We propose a method to determine the k value which is based on the feedback of the station permittable flow volume; extract alternative routes by increasing k values progressively to form the bus bridging route; and assign passenger flow considering the station capacity constraint. The progress stops when there is no bottleneck station in the bridging network. The feasible route generation method with capacity constraints of the station is introduced as follows in Figure 2.
In the bus bridging network, the passenger flow volume of stations includes regular passenger flow and bridging passenger flow . The stations where passenger flow increases: (1) transfer station in the urban rail transit transfer route , as shown in Figure 3a; (2) station in the indirect bridging route where bus bridging/urban rail transit transfer bus bridging/urban rail transit, as shown in Figure 3b. Here the passenger flow stops additionally at the non-OD station for transfer. The stations where passenger flow decreases: (3) the terminal station / in the direct bridging route /indirect bridging route where bus bridging connects, as shown in Figure 3c. The passenger flow need not enter the urban rail transit station because they can get to the destination on the ground by taking the bus bridging option.
Step 1: Set k = 1.
Step 2: (a) Generating k-short alternative routes; (b) the original k-1 alternative routes continue to be used. The kth alternative route is selected by comparing the cost of feasible routes, including urban rail transit transfer, direct and indirect bus bridging as in Equation (25). Feasible routes are generated by the method introduced above.
According to the survey, if there are no significant differences in travel time, the blocked passengers tend to choose transfers in the urban rail transit system. This tendency is related to the ease of transfers within a single traffic mode and many other issues. Thus, a dependent factor < 1 is introduced for an urban rail transit transfer route to reflect the passengers’ perception of travel cost. Further discussion is beyond the scope of this paper. Readers can refer to some literature [26] on perceived travel cost etc., for more insights on this topic.
The new generated routes are brought into the alternative route set . When , this pair of OD stations is marked. In the later cycles, this pair of OD stations skips Step 2 and accesses Step 3, the number of alternative routes keep unchanged. The alternative routes set .
Step 3: Forming the bus bridging network ) by the alternative routes set, here .
Step 4: Defining the correlation matrix of the urban rail transit link unit-route in the bus bridging network as follows:
Similarly, defining the correlation matrix of the bus bridging link unit-route in the bridging network as follows:
Step 5: Selecting the feasible alternative routes. In the process of the k-1th passenger flow assignment, there must be bottleneck stations in the bridging network, where the bridging flow volume is beyond capacity, and passenger flow cannot be assigned. Thus, a punishment route is added and separated from the bridging network, with no capacity constraint, and the route cost is an arbitrarily large positive value. If there is any passenger flow assigned to punishment routes, then we say bottleneck stations and transfers are the part of that pass those stations to the punishment routes. The route optimization model is established as follows.
Objective Equation (30) minimizes the total travel time of the blocked passengers; Equation (31) constrains that all the passengers of the disruption OD stations must choose only one alternative route or punishment route; Equation (32) is the station capacity constraint, and represents a safe overload rate. In overcapacity and under the safe overload rate, the performance of the station will decrease but does not have to be shut down; Equation (33) judges the transfer station on the route . The judgement method is the same as Equation (10); Equation (34) judges the transfer station on the route . The judgement method is the same as Equation (23); Equations (35) and (36) identify whether the terminal stations of the route / are connected by bus bridging routes; Equation (37) represents the changing volume of passenger flow at station h.
If , it implies that there exists bottleneck stations, and the current bridging network cannot satisfy the bridging demand of all , turning to Step 6; if , the algorithm stops, and the initial design of bus bridging routes can be generated. The bus bridging is deployed according to the assigned passenger flow volume.
Step 6: Set k = k + 1, go to Step 2.
2.4. Route Merging and Filtering
The result generated by the above methods is an initial design plan of the bus bridging routes. The process of the shortest alternative route generation for each pair of the disrupted OD stations is independent. In fact, the existing feasible routes may have an influence on the feasible route generation for the other pairs of the disrupted OD stations. It means that some bridging routes can probably be replaced by the other two bridging routes. Moreover, the resource of bus bridging is limited in an emergency, and some bridging routes with low passenger flow need to be merged or filtered in order to reduce the route numbers and improve the utilization of public transport.
- (1)
- The two (or more) bus bridging routes, whose original stations are the same and destination stations are on the same urban rail transit line, can be merged into one route, as shown in Figure 4a.
- (2)
- The two bus bridging routes that start from the same station to two (or more) adjacent stations on the other urban rail transit lines, as shown in Figure 4b, or four bus bridging routes that each two stations belong to the same urban rail transit line and are adjacent, as shown in Figure 4c, also can be merged into a ring route.
- (3)
- For the series of bus bridging ring routes generated, if the larger ring route with a small distance detour can cover the small ring route, the small ring route can be merged with the larger ring route, as shown in Figure 4d.
Whether the routes are eventually merged or not depends on whether the total travel time can be reduced. A judgement algorithm is built as follows.
For the blocked passengers, the travel time of the bus bridging includes the average waiting time and the in-vehicle time :
After merging the bus bridging route, on one hand, the passenger flow load on the original routes are increased. As the bus bridging departure frequency increases, the average waiting time of passengers is reduced. On the other hand, the merger may increase the route distance between some pairs of stations and in-vehicle time for the detour. The change of the total travel time before and after the merger is as follows:
If Equation (40) is positive, it means the waiting time saved is greater than the in-vehicle time increase; in this case, route mergers can reduce the total travel time. On the contrary, the merger will increase the total travel time; Equations (41) and (42) represent the change of the average waiting time/the in-vehicle time of the bridging passengers of route r after merging.
In order to increase the in-vehicle time as little as possible and save the total travel time when routes are merged, it is important to choose the merger routes. Obviously, merging the nearer routes will produce less detour time, merging less departure frequency routes is more effective for reducing the waiting time. The bus bridging assign model with resource constraints is established as follows.
Equation (43) minimizes the total travel time of the blocked passengers.. represents the passenger flow from station p to q. is opposite to . Equation (44) prevents the assigned number of bus bridging going beyond the demand and ensures every bridging route is available; Equation (45) constrains the total number of bus bridging that can be deployed.
The final design scheme of the bus bridging routes is obtained by merging and filtering.
3. Results and Discussion
The urban rail transit network in the illustrative example abstract from Tianjin in China, and it is constituted by four urban rail transit lines with 82 stations. In 2017, the annual passenger volume of was 407 million, and the average daily passenger volume was 1,115,100, and the disruption rate per million kilometers was 0.5 in the railway transit system (the data was acquired from the Urban Railway Transit Management Company in Tianjin city). In the case study, the link units C11–C10 and C11–C12 were disrupted in peak hour, and C11 is a transfer station, as shown in Figure 5. The average passenger flow of each OD pair station in peak hour was obtained from historical data. The travel time for railway transit and bus bridging was calculated by operation velocity and distance of between stations. The data is used after eliminating a portion (5% through the survey) of passengers who selected a taxi, car, or other private transportation when the urban rail transit network was disrupted.
In Figure 3, we find that A{1~22}/B{1~26}/C{1~10}/D{1~18} to C{12~20} are complete disruptions, while B{1–13}/B{15~26}/D{1~18} to C{1~10}, A13 to C{9~10}, A{1~10} to D{1~18}/C11 are incomplete disruptions. The total pairs of the complete and incomplete disruption stations are 666 and 622, respectively.
3.1. Without Station Capacity Constraints
By applying the route optimization model without station capacity constraints as per Equations (32)–(37), only the shortest alternative routes are chosen for the disrupted OD stations; the bus bridging routes in scheme 1 are generated, as shown in Figure 6a. Each colored line represents one bus bridging route. The bottleneck stations are indicated by the red triangle.
By calculating the passenger flow of each station and comparing with their capacity threshold, we find that B9/B10/B12/B15/C10/C11/C12/A14 are bottleneck stations.
It is found that 75% of the bottleneck stations are located in the vicinity of the disrupted section. The reason is that scheme 1 generates a large amount of indirect bus bridging routes, and the transfer stations selected are as close to the disrupted section as possible.
After crossing the disrupted section, the bus bridging routes can extend to the terminal station, or end at the endpoint of the disrupted section and transfer to urban rail transit. The latter has an additional transfer time. However, as the speed of urban rail transit is faster than bus bridging, the in-vehicle time shortening is more than the additional transfer time beyond a certain distance. This certain distance in the case study is one or two urban rail transit link units most commonly.
For example, the alternative routes are generated for the disrupted OD stations C{1~7}–C{14~20}, because the travel time of is less than . However, the alternative routes are generated for the disrupted OD stations C{1~7}–C13, because the travel time of is less than . It can be judged that the distance from C12 to C14 is a certain distance.
For the remaining 25% of bottleneck stations, for example, the disrupted OD stations A{15~22}–C{15~20} belong to different urban rail transit lines, respectively, and A14, C12, and A9 constitute a triangle, and two stations are selected on each urban rail transit to connect the bus bridging route because of its small geometric angle. The travel time of the bus bridging route is less than urban rail transit + bus bridging route . Hence, the alternative routes are generated for the disrupted OD stations A{15~22}–C{15~20}; it leads to A14 becoming a bottleneck station that all the blocked passengers of A{15~22}–C{15~20} have to transfer at. The formation of the remaining bottleneck stations is also due to this reason.
3.2. With Station Capacity Constraints
By applying the route optimization model with station capacity constraints, when k = 3, , there are no bottleneck stations in the bridging network. The objective Equation (30) of the alternative route optimal model reaches the minimum, and the bus bridging routes design scheme 2 is generated, as shown in Figure 6b.
In scheme 2, the model transports the extra bridging passenger flow of the bottleneck stations to the adjacent stations by generating multiple alternative routes. For example, the alternative route for the disrupted OD stations B{1~6}–C{14~20} in scheme 1 is extended to in scheme 2 or avoid transferring at the bottleneck stations by generating the other type of alternative routes. For example, the indirect bus bridging route for the disrupted OD stations A{1~10}–D{1~18} are replaced with the urban rail transit transfer route in scheme 2, so that the bottleneck station C10 is avoided.
3.3. Bus Bridging Route Analysis
The alternative routes generated in scheme 2 are classified according to the travel distance (km). Three types of alternative routes are compared in Figure 7. The indirect bus bridging route accounts for 72% of the total number of alternative routes. The percentage of indirect bus bridging in the middle-and-long distance (>6 km) is higher than that of a short travel distance (0–6 km). It suggests that the speed advantage of urban rail transit dominates for longer distances. The direct bus bridging routes set for a short travel distance (0–6 km) accounted for 91.4% of the total alternative routes because it can connect the disrupted OD stations directly without transfer. The ratio between the number of urban rail transit transfer routes and the number of OD pairs of incomplete disruption is 47%. It proves the probability of selecting the urban rail transit transfer as the alternative route for the incomplete disruption is higher. The reason that, on one hand, its travel time is short, and on the other hand, it depends on the urban rail transit passenger’s travel habit.
The indirect bus bridging routes are compared. The result is shown in Figure 8. The selection proportion of the indirect bridging route 1 and 2 is 81.1% in a short travel distance (0–6 km); the proportion decreases with the increase of travel distance. In the short-and-middle travel distance below 12 km, selecting the indirect bridging route 1 and 2 can save more time because the origin or destination station must be close to the disrupted area. In the middle-and-long travel distance above 6 km, selecting the indirect bridging route 3 is more time saving because the origin or the destination station of most of the disrupted OD stations are far from the disrupted area.
3.4. Total Travel Time and Finacial Benefits Analysis
In order to verify the validity of the bridging bus routes obtained in this paper, we calculated the total travel time of passengers under normal conditions, with disruption but not taking any measures, and with disruption taking bridging bus routes. The calculation results are shown in Table 1. It can be seen from this table that after the bridging bus routes are taken, the passenger’s total travel time is significantly lower than when no measures are taken. However, after the capacity constraint of a station is considered, the passenger’s total travel time will be increased by 3.49% compared with not considering a capacity constraint.
We discussed the financial benefits from the passenger time saving and time value perspective. According to Reference [27] and the average income of Tianjin in 2017, the time value of a passenger for work is CNY 24.93 yuan/h. Consequently, the financial benefits will be up to CNY 2,419,830 yuan after carrying out the bus bridging routes considering station capacity constraints.
4. Conclusions
This paper designs bus bridging routes for disrupted urban rail transit networks. The types of urban rail transit line disruption between OD stations are summarized and alternative bus bridging routes are listed. Feasible routes are generated for each pair of the disrupted OD stations including urban rail transit transfers, direct bus bridging, and indirect bus bridging. The feasible route generation model considering passenger alternative route choice behavior and the bridging station capacity constraint is established by k-short alternative routes. Finally, while considering the bus bridging resource constraint, the initial design routes are merged and filtered to get the final design scheme. Taking an abstract urban rail transit network as an example, the results show that: the bus bridging design scheme generated from the model can significantly reduce travel delay of blocked passengers and improve the efficiency of emergency transport under the urban rail transit disruption; controlling the permittable quantity of urban rail transit passengers below the station capacity is necessary for ensuring feasibility of the bridging network; the direct bus bridging route is suitable for short travel distances and the indirect bus bridging route is suitable for middle-and-long travel distances; urban rail transit transfer routes have a higher proportion in incomplete disrupted OD stations. After the bridging bus routes are taken, the passenger’s total travel time is significantly lower than when no measures are taken. However, after the capacity constraint of the station is considered, the passenger’s total travel time will be increased compared with not considering the capacity constraint.
In order to increase the application range of the method, in the future, we should collect more origin-destination travel data and disruption data of some extra-large cities, such as Beijing and Shanghai, to verify further the reliability of the method proposed in this paper. Additionally, the depot location of bus bridging has an influence on the route design result. Therefore, we need to construct a route design model of bus bridging considering the location layout of bus bridging depots in the future.
Author Contributions
Conceptualization, Y.D. and G.L.; Data curation, Z.D.; Methodology, Y.D. and X.R.; Writing—original draft, X.R. and Z.D.; Writing—review & editing, Y.D. and G.L.
Funding
This work is supported by the National Natural Science Foundation of China (grant No. 51208054), Natural Science Foundation of Shaanxi Province (Grant No. 2017JM5104) and the Fundamental Research Funds for the Central Universities of China (Grant No. 300102218410, 300102218409).
Conflicts of Interest
The authors declare no conflict of interest.
References
- Meyer, M.D.; Belobaba, P. Contingency planning for response to urban transportation system disruptions. J. Am. Plan. Assoc. 1982, 48, 454–465. [Google Scholar] [CrossRef]
- Pender, B.; Currie, G.; Delbosc, A.; Shiwakoti, N. Planning for the unplanned: An international review of current approaches to service disruption management of rail transits. In Proceedings of the Australasian Transport Research Forum 2012 Proceedings, Perth, Australia, 26–28 September 2012; pp. 26–28. [Google Scholar]
- Shen, S.; Wilson, N.H.M. An optimal integrated real-time disruption control model for rail transit systems. In Computer-Aided Scheduling of Public Transport; Lecture Notes in Economics and Mathematical Systems; Springer: Berlin, Heidelberg, 2001; Volume 505, pp. 335–363. [Google Scholar]
- Jespersen-Groth, J.; Potthoff, D.; Clausen, J.; Huisman, D. Disruption management in passenger railway transportation. In Robust and Online Large-Scale Optimization; Springer: Berlin, Heidelberg, 2009; pp. 399–421. [Google Scholar]
- Corman, F.; D’ariano, A. Assessment of advanced dispatching measures for recovering disrupted rail transit traffic situations. Transp. Res. Rec. J. Transp. Res. Board 2012, 2289, 1–9. [Google Scholar] [CrossRef]
- Laporte, G.; Marín, Á.; Mesa, J.A.; Perea, F. Designing robust rapid transit networks with alternative routes. J. Adv. Transp. 2011, 45, 54–65. [Google Scholar] [CrossRef] [Green Version]
- Cadarso, L.; Marín, Á.; Maróti, G. Recovery of disruptions in rapid transit networks. Transp. Res. Part E Logist. Transp. Rev. 2013, 53, 15–33. [Google Scholar] [CrossRef] [Green Version]
- Kepaptsoglou, K.; Karlaftis, M.G. The Bus bridging problem in metro rail transit operations: Conceptual framework, models and algorithms. Public Transp. 2009, 1, 275–297. [Google Scholar] [CrossRef]
- Transportation Research Board. Public Transportation Security; Transit Cooperative Research Program Report 86; Transportation Research Board: Washington, DC, USA, 2007. [Google Scholar]
- Currie, G.; Muir, C. Understanding passenger perceptions and behaviors during unplanned rail disruptions. Transp. Res. Procedia 2017, 25, 4396–4402. [Google Scholar] [CrossRef]
- Pender, B.; Currie, G.; Shiwakoti, N.; Delbosc, A. New methods and perspectives in bus bridging theory and practice. In Proceedings of the the Transportation Research Board 96th Annual Meeting, Washington, DC, USA, 8–12 January 2017; pp. 1–19. [Google Scholar]
- Zeng, A.Z.; Durach, C.F.; Fang, Y. Collaboration decisions on disruption recovery service in urban public tram systems. Transp. Res. Part E Logist. Transp. Rev. 2012, 48, 578–590. [Google Scholar] [CrossRef]
- Peng, W. Passengers evacuation research in rail transit emergency event. Ph.D. Thesis, Nanjing Ligong University, Nanjing, China, 2013. [Google Scholar]
- Teng, J.; Xu, R. Bus dispatching strategies in urban rail emergent events. J. China Railway. Soc. 2010, 32, 14–17. [Google Scholar]
- Jin, J.G.; Tang, L.C.; Sun, L.; Lee, D.H. Enhancing metro network resilience via localized integration with bus services. Transp. Res. Part E Logist. Transp. Rev. 2014, 63, 17–30. [Google Scholar] [CrossRef]
- Yang, Y.; Ding, H.X.; Chen, F.; Yang, H.M. An approach for evaluating connectivity of interrupted rail networks with bus bridging services. Adv. Mech. Eng. 2018, 10, 1–12. [Google Scholar] [CrossRef]
- Darmanin, T.; Lim, C.; Gan, H.S. Public rail transit disruption recovery planning: A new recovery strategy for metro rail transit train Melbourne. In Proceedings of the the 11th Asia Pacific Industrial Engineering and Management Systems Conference, Melaka, Malaysia, 7–10 December 2010; Volume 7. [Google Scholar]
- Jin, J.G.; Teo, K.M.; Sun, L. Disruption response planning for an urban mass rapid transit network. In Proceedings of the Transportation Research Board Annual Meeting, Washington, DC, USA, 13–17 January 2013. [Google Scholar]
- Jin, J.G.; Teo, K.M.; Odoni, A.R. Optimizing bus bridging services in response to disruptions of urban transit rail networks. Transp. Sci. 2015, 50, 790–804. [Google Scholar] [CrossRef]
- Yang, Y.; Zhao, H. Responsive bus bridging service planning under urban rail transit line emergency. DEStech Trans. Eng. Technol. Res. 2016. [Google Scholar] [CrossRef]
- Hu, H.; Gao, Y.; Yu, J. Planning bus bridging evacuation during rail transit operation disruption. J. Urban Plan. Dev. 2016, 142, 04016015. [Google Scholar] [CrossRef]
- Sun, J.; Hu, H.; Liu, Z. A bus bridging optimization model for single point operational disruption of urban rail transit. Adv. Nat. Appl. Sci. 2017, 1, 388–395. [Google Scholar]
- Gu, W.; Yu, J.; Ji, Y. Plan-based flexible bus bridging operation strategy. Transp. Res. Part C Emerg. Technol. 2018, 91, 209–229. [Google Scholar] [CrossRef]
- Van der Hurk, E.; Koutsopoulos, H.N.; Wilson, N.; Kroon, L.G.; Maróti, G. Shuttle planning for link closures in urban public transport networks. Transp. Sci. 2016, 50, 947–965. [Google Scholar] [CrossRef]
- Kepaptsoglou, K. Development of Optimization Methods for the Operation of a Fixed Route System under Emergency Conditions. Ph.D. Thesis, National Technical University, Athens, Greece, 2009. [Google Scholar]
- Prashker, J.N. Mode Choice Models with Perceived Reliability Measures. Trans. Eng. J. 2014, 105, 251–262. [Google Scholar]
- Zong, F. Travel Demand Management Policy Evaluation Based on Disaggregated Model. Ph.D. Thesis, Jilin University, Changchun, China, 2008. [Google Scholar]
Figure 1.
Feasible route generation procedure without capacity constraint.
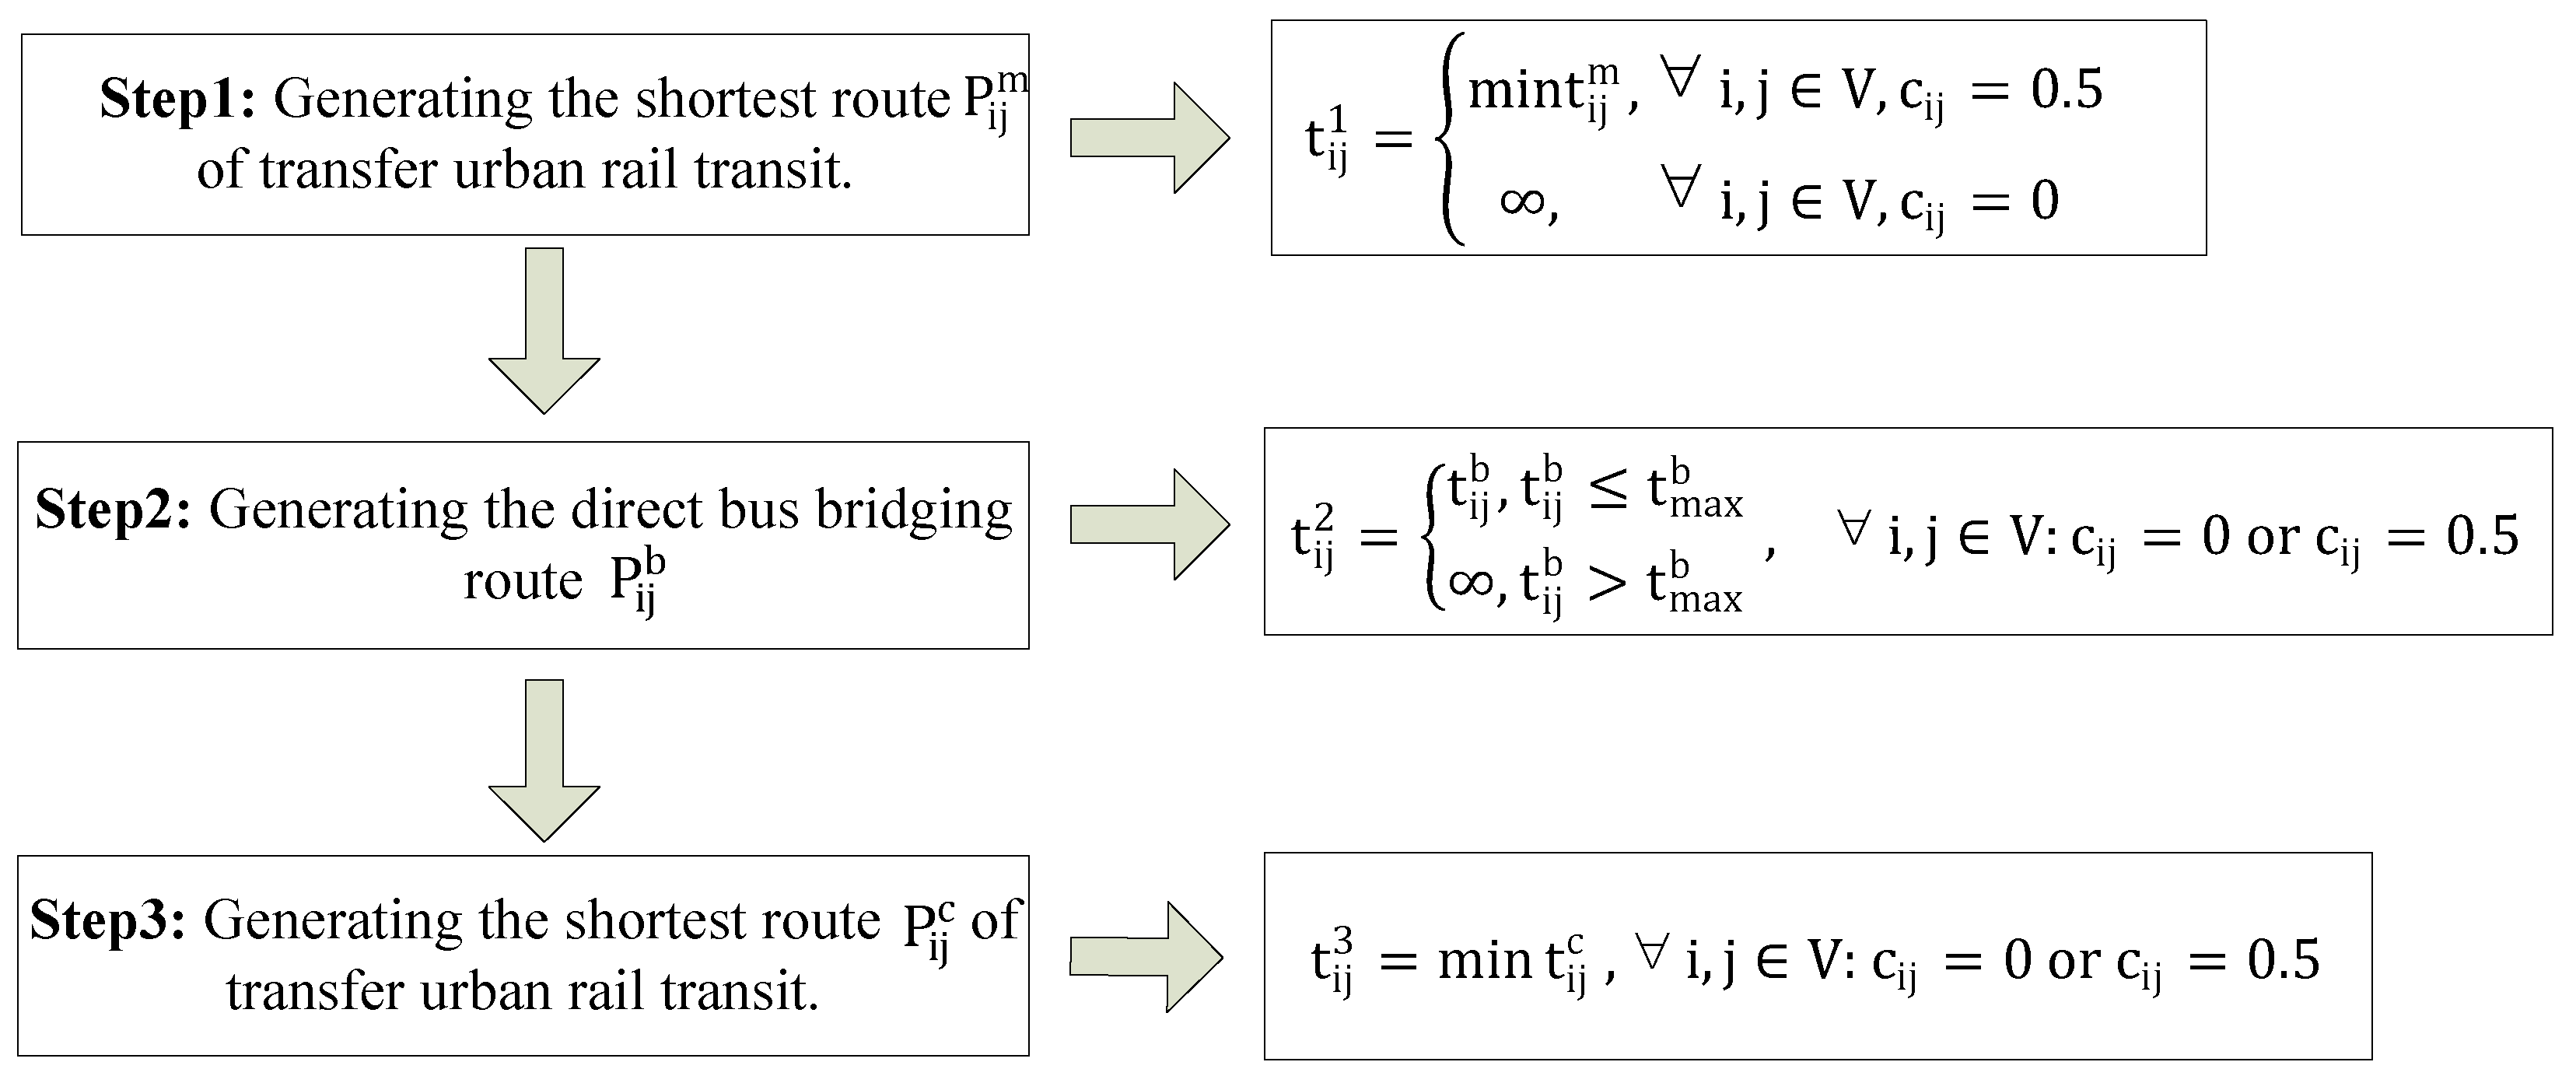
Figure 2.
Feasible route generation procedure with capacity constraint.

Figure 3.
The stations where passenger volume changed

Figure 4.
The merging of bus bridging routes.


Figure 5.
Disrupted urban rail transit system

Figure 6.
The bus bridging routes scheme. (a) Without station capacity constraints; (b) with station capacity constraints.
Figure 6.
The bus bridging routes scheme. (a) Without station capacity constraints; (b) with station capacity constraints.
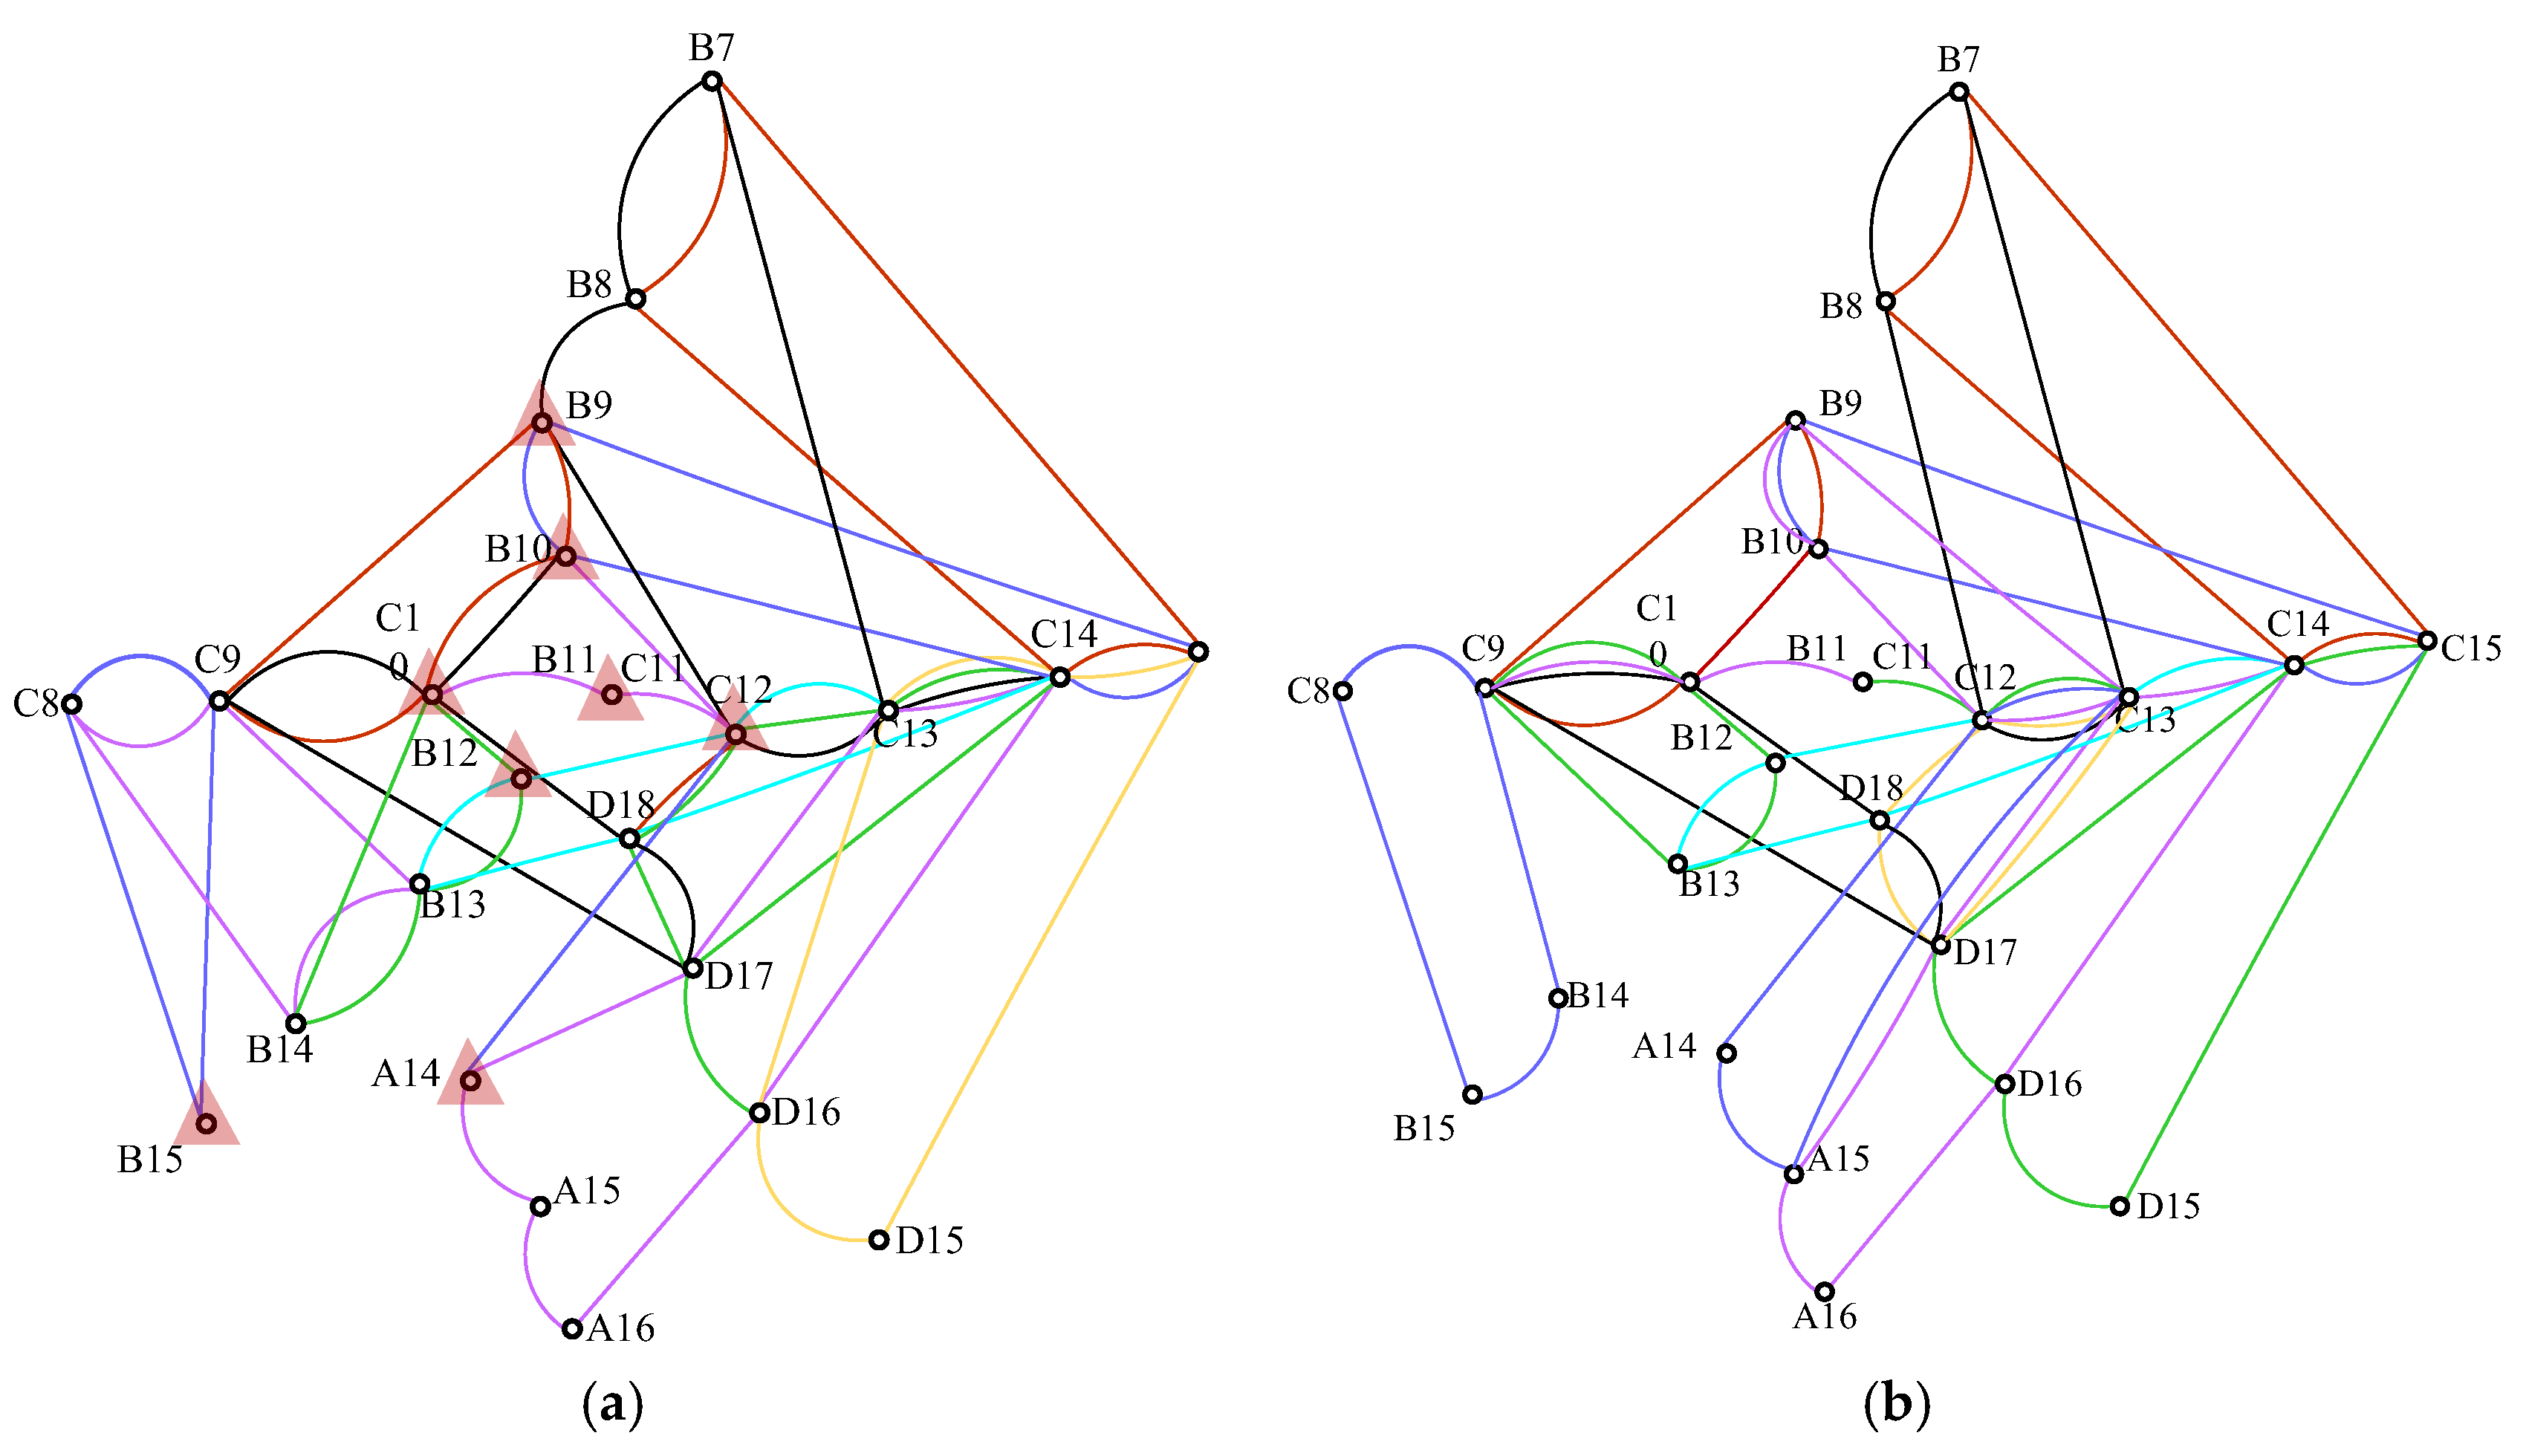
Figure 7.
Numbers of three types of the alternative routes.

Figure 8.
Comparison of indirect bus bridging routes.


Table 1.
Travel time comparison (hour).
| Analysis Condition | Normal Operation | Disruption without Taking any Measure | Bus Bridging | |
|---|---|---|---|---|
| Not Considering Station Capacity | Considering Station Capacity | |||
| Travel cost | 405,301 | 611,242 | 492,842 | 514,177 |
| Travel time variation under bus bridging | −19.37% | −15.88% | ||
| Travel time variation considering station capacity | −3.49% | |||
© 2018 by the authors. Licensee MDPI, Basel, Switzerland. This article is an open access article distributed under the terms and conditions of the Creative Commons Attribution (CC BY) license (http://creativecommons.org/licenses/by/4.0/).
Share and Cite
MDPI and ACS Style
Deng, Y.; Ru, X.; Dou, Z.; Liang, G. Design of Bus Bridging Routes in Response to Disruption of Urban Rail Transit. Sustainability 2018, 10, 4427. https://doi.org/10.3390/su10124427
AMA Style
Deng Y, Ru X, Dou Z, Liang G. Design of Bus Bridging Routes in Response to Disruption of Urban Rail Transit. Sustainability. 2018; 10(12):4427. https://doi.org/10.3390/su10124427
Chicago/Turabian StyleDeng, Yajuan, Xiaolei Ru, Ziqi Dou, and Guohua Liang. 2018. "Design of Bus Bridging Routes in Response to Disruption of Urban Rail Transit" Sustainability 10, no. 12: 4427. https://doi.org/10.3390/su10124427
Note that from the first issue of 2016, this journal uses article numbers instead of page numbers. See further details here.