Process and Mechanism of Agricultural Irrigation Benefit Allocation Coefficient Based on Emergy Analysis—A Case Study of Henan, China

1
Institute of Geographic Sciences and Natural Resources Research, Chinese Academy of Sciences, Beijing 100101, China
2
College of Environment and Planning, Henan University, Kaifeng 475004, China
3
Institute of Agriculture and rural Sustainable Development, Henan University, Kaifeng 475004, China
*
Authors to whom correspondence should be addressed.
Sustainability 2018, 10(12), 4436; https://doi.org/10.3390/su10124436
Submission received: 22 October 2018
/
Revised: 15 November 2018
/
Accepted: 16 November 2018
/
Published: 27 November 2018
(This article belongs to the Section Sustainable Agriculture)
Abstract
:The progressive development of the agricultural production system is the foundation for promoting the rapid and efficient growth of the regional economy. In this study, the irrigation benefit allocation coefficient for the agricultural irrigation system of Henan Province from 1999 to 2014 was comprehensively investigated on the basis of the theory of emergy analysis. The process and mechanism of the variation coefficient were explored using ArcGIS 10.1 (Environmental System Research Institute, Redlands, USA) and SPSS 21.0 software (IBM, Chicago, USA), and the results were shown spatially. From the analysis and results, the emergy investment and yield in the Henan agricultural production system were found to continuously increase with annual increases of 2.26% and 4.22%, respectively. However, the irrigation benefit allocation coefficient of Henan showed a continuous downward trend with a total decrease of 0.026 due to precipitation. The irrigation benefit allocation coefficient fluctuated owing to the combined influence of multiple restraining factors, among which chemical fertilizers and pesticides played the dominant role. Therefore, comprehensive application of multiple emergy investment methods was critical for boosting emergy yield.
1. Introduction
Water is a type of non-renewable resource existing in nature and is constantly self-renewed and recharged during the circulation process [1,2]. Therefore, water in natural and artificial reservoirs has significantly contributed to the development of human society [3,4]. However, the unceasing exploitation and utilization of water resources by humans have made water shortage a worldwide issue [5]. Unsurprisingly, water crises and water environment deterioration have become crucial factors restricting the rapid social development of China [6,7,8,9]. Therefore, the optimal allocation ratio of water resources for various purposes is the key in maximizing the benefit of water resource usage in China [10,11,12].
Water resource allocation has been an important issue within the international research community for a long time [13,14]. Tradable water rights, which were proposed by Rosegrant and Binswanger [15] have played a critical role in solving the problems of water resource effectiveness, equity, and sustainability in developing countries [16]. Researchers have adopted the non-inferior solution of Pareto optimality as the optimal solution to water resource allocation [17,18,19]. However, the latest studies indicate the existence of some relatively serious problems in its implementation [20] in spite of the ease of achieving the optimal solution. To compensate for the inadequacy of using a single method for water resource allocation research, the subsequently adopted models, such as the game-theory models [21,22,23], the optimal allocation of water resource models [24,25], and the multi-objective optimization problem models [26,27], have gradually become major approaches to address the water resource allocation problem. In research methods for the optimal allocation of water resources, the allocation coefficient of water resources must be determined because it is directly associated with the rationality of optimal water resource allocation and the accuracy of water resource effectiveness assessment [28,29]. China’s water resources can be characterized by several rivers and frequently occurring floods, based on which various water conservancy projects have been developed. Given the constant social and economic development, Chinese researchers have started focusing on investigating water resource allocation in specific industries [30,31,32].
Agriculture is the fundamental industry for human development and has been a popular research topic across the world [33,34,35]. Irrigation is a major factor in boosting agricultural production, and its yield-increasing mechanism attracts much attention from international researchers. Kucukmehmetoglu and Guldmann [36] calculated the benefit allocation of agricultural water in the Euphrates and the Tigris using a linear programming model and concluded that cooperation between countries all over the world can substantially enhance agricultural irrigation efficiency. By considering the non-market reclaimed water in southern Spain into the cost–benefit analysis system, Alcon et al. [37] calculated the irrigation benefit allocation coefficient and explored the potential economic effect that can be improved through the irrigation process. Alarcón et al. [38] analyzed the irrigation benefit allocation coefficient under five specific conditions and estimated the relationship between allocation ratio and yield. Giordano and Fraiture [39] concluded that small-scale private irrigation is effective and can help increase agricultural production by studying the agricultural process.
China, which is the country with the highest population in the world, feeds 22% of the world’s population using 7% of the world’s arable land; its future food security attracts attention from researchers across the world [40,41]. Chinese researchers have always focused on the effects of irrigation on production boost. The agricultural irrigation benefit allocation coefficient can be calculated using two major approaches: experiments and statistics. Since the 1990s, Hou and Yu [42] measured the irrigation benefit allocation coefficients for crops using different experimental approaches and provided suggestions for the further modification of irrigation methods for future study regions. Compared with experiments, data can be obtained more easily using statistical approaches with a wide range of applications. Zhang et al. [43] carried out in-depth and detailed studies on the irrigation benefit allocation coefficient using statistical approaches. Some inherent short backs are the limitation of aging or the stage division randomness for the traditional irrigation test method or the statistical method. Therefore, the irrigation allocation coefficient should be studied using a comprehensive research method. Emergy analysis presents an energetic basis for quantification or valuation of ecosystem goods and services. Valuation methods in environmental and ecological economics estimate the value of ecosystem inputs in terms that have been defined narrowly and anthropocentrically, while emergy tries to capture the ecocentric value [44], which was proposed by Odum [45] is suitable for this purpose. Emergy analysis is simple and convenient as the traditional approaches and can also be used to conduct research on the irrigation benefit allocation coefficient on a large scale.
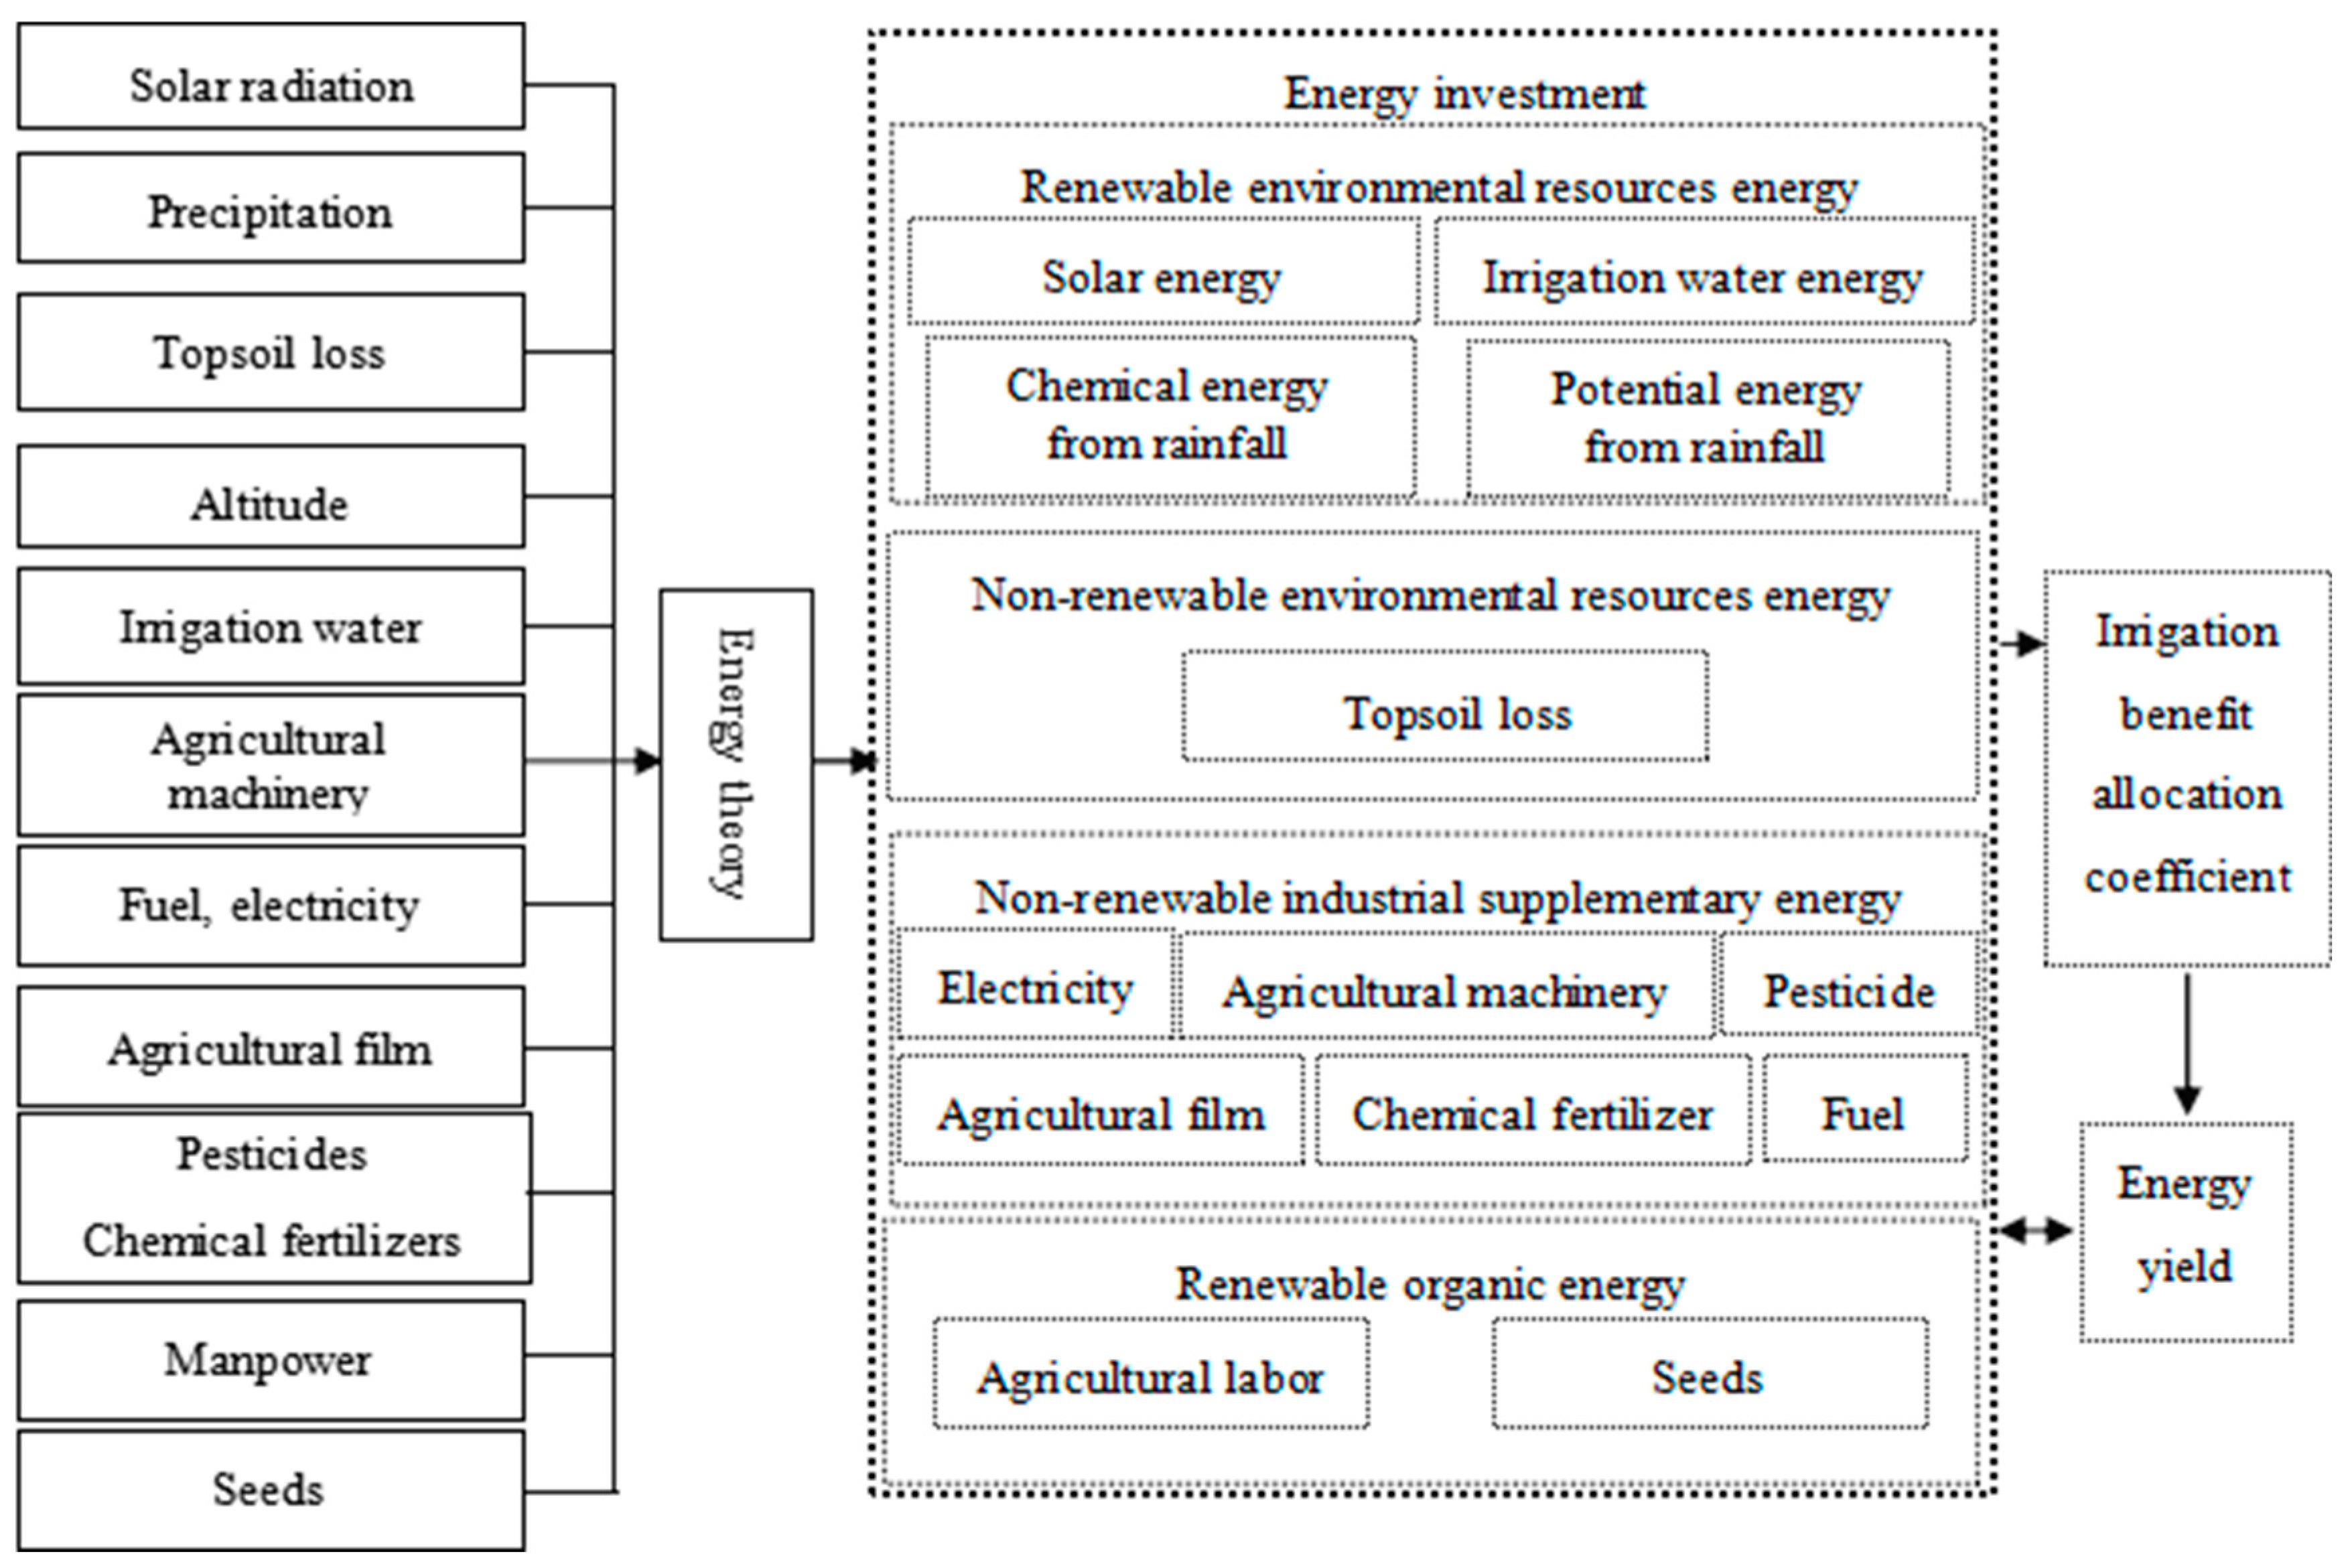
Agriculture in Henan, which is a crucial grain production base in China contributes significantly to China’s overall economic development [45,46]. Rice cultivation is dominant in the south of Henan and the irrigation water is needed to maintain the normal growth of crops in the north, especially in the areas on both sides of the Yellow River. Therefore, the large amount of water required for agricultural irrigation is one of the most important agricultural characteristics in this area. Because irrigation directly affects crop growth and development, and the input of other agricultural capital will have a direct impact on the size of irrigation, precise determination of the allocation coefficient of irrigation benefits is conducive to improving the level of regional precision agriculture, thus providing a theoretical basis for formulating reasonable and accurate agricultural development policies. In this study, agricultural irrigation benefit allocation coefficients for all the cities in Henan from 1999 to 2014 were calculated using emergy analysis. The mechanism of the spatial-temporal variations in the coefficients was studied using ArcGIS 10.1 and SPSS 21.0 software. The research results were expected to provide rational suggestions for boosting the agricultural production in Henan. The rest of the paper is organized as follows. Section 2 details the methodology as shown in Figure 1 and introduces the case study. Section 3 presents the results and discussion on the agricultural irrigation benefit allocation coefficients, which are calculated using emergy analysis, for all the cities in Henan from 1999 to 2014. The plural and future research are also described. Finally, Section 4 elaborates some policy implications and the conclusions of the study.
2. Materials and Methods
2.1. Study Area
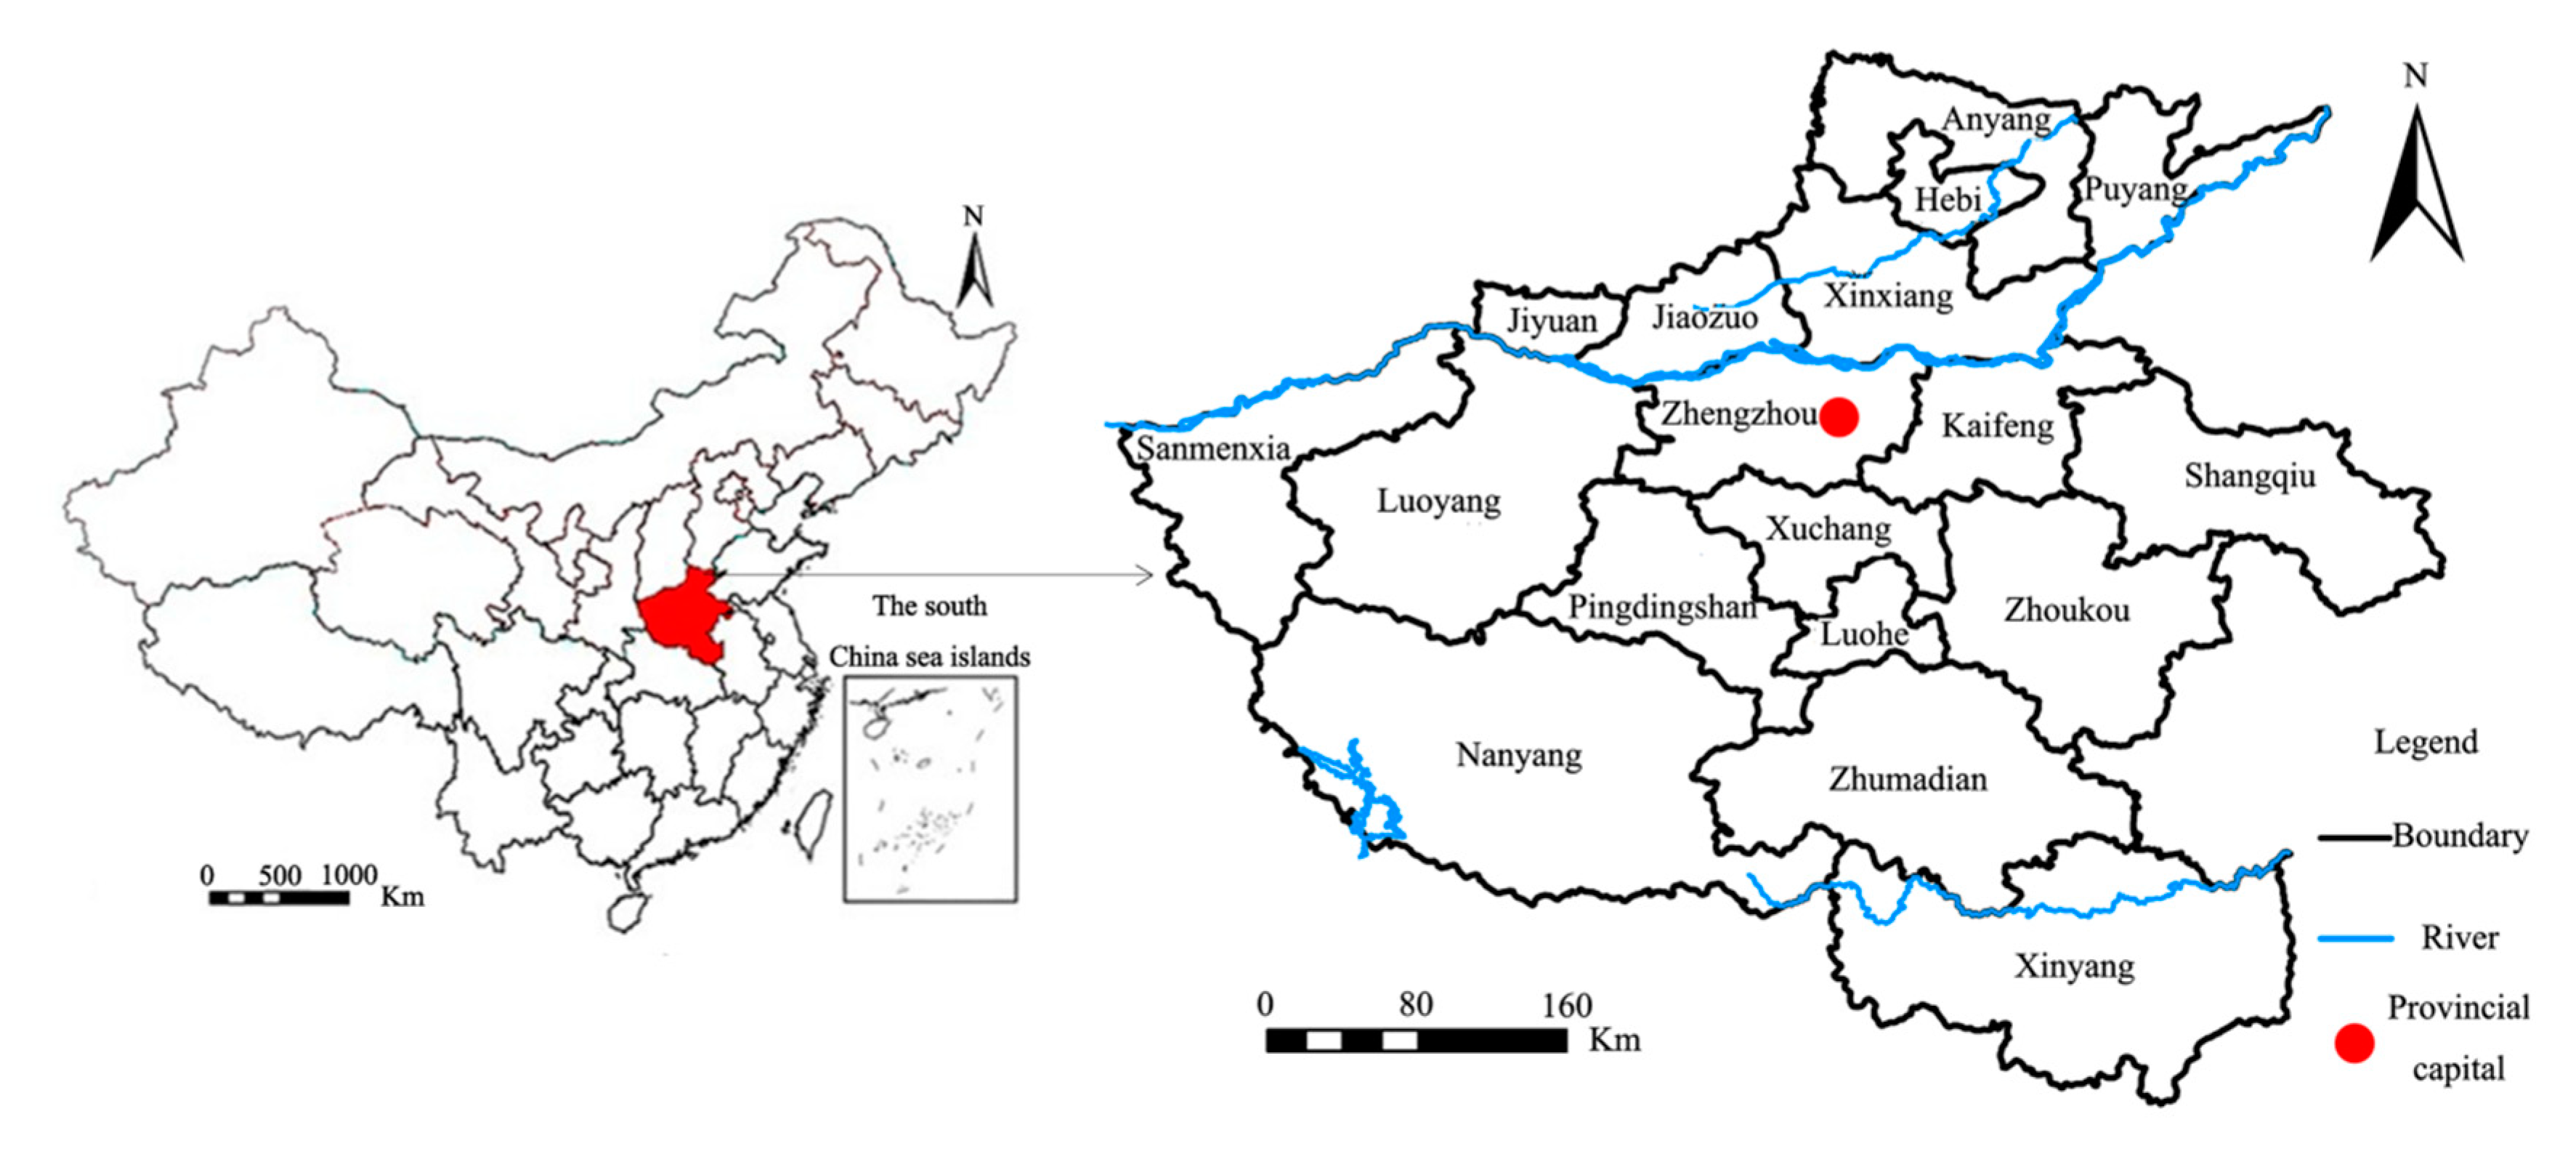
Henan is a province located in the central part of China. It is topographically high in the northwest and low in the southeast, with an average elevation of below 500 m. The vast Huang-Huai-Hai Plain has been formed in Henan and developed into a critical grain production base, thereby making Henan the topmost grain production province in China for several years. Henan possesses an abundant water resource and several rivers. The Yellow River flows into Henan from Tongguan, Shaanxi, which traverses the central part of Henan, with a length of 711 km and a drainage area of 36,200 km2, and accounts for 20% of the entire area of Henan, as shown in Figure 2. The Yellow River is a significant hydro energy exploitation base, and its surrounding bottomlands are superior farmlands for crop growth. In 2014, Henan produced 57.723 million tons of grain with a production rate of 611.74 kg per capita and ranked at the top nationally. The agricultural tractor-plowed area, effective irrigation area, agricultural machinery consumption, and fuel consumption in the province were 90,800 ha, 5,221,600 ha, 11,476.8 mW, and 1.159 mt, respectively. These agricultural indexes showed a trend of annual increase, which indicated that agricultural mechanization and modernization in Henan were gradually enhanced. Improving the grain production in Henan and consolidating the foundation of China’s grain development are essential strategies for promoting the rapid and efficient growth of the Chinese economy.
2.2. Data Collection
A large amount of data from extensive sources were required for the emergy analysis of the agricultural irrigation benefit allocation coefficient of Henan from 1999 to 2014. Data on grain production, farmland, effective irrigation area, agricultural tractor-plowed area, agricultural resource consumption, and agricultural personnel were acquired from the Henan Statistical Yearbook, China City Statistical Yearbook, Henan Rural Statistical Yearbook, China Agriculture Yearbook, and some government gazettes and internal data, as shown in Table 1. Meteorological data, including those on solar radiation and precipitation, were obtained from the China meteorological data-sharing service system. Topsoil loss data were obtained from studies by other researchers [47,48,49], and experimental calculations. Moreover, the average altitude of Henan was calculated from remote sensing-based digital elevation models.
2.3. Methods
Emergy is a concept proposed by Odum [45], and this concept represents the total effective energy directly or indirectly consumed in the process of generating energy, production, or service, that is, an expression of all the energy. In agricultural production systems, energy flow can be divided into two categories: emergy investment and emergy yield. Units of different substances should be converted into the unified solar emergy joule (seJ) on the basis of emergy analysis to calculate the energy flow in an agricultural production system accurately. Then, the contribution of various activities on a specific activity can be measured for conducting a comprehensive and scientific computation of the allocation coefficient. The most significant advantage of using emergy analysis to determine the irrigation benefit allocation coefficient is the consideration of natural factors, such as altitude, soil erosion, soil classification, and precipitation, which are under a specific category for analyzing the energy utilized in all the processes during production. In this way, the accuracy and clarity of computation can be substantially improved, and the computed results can potentially provide strong support for the determination of subsequent agricultural irrigation plans.
Detailed steps in the calculation for emergy analysis are demonstrated in Equations (1)–(7).
where E represents the emergy (seJ), τ represents the transformity (seJ/J or seJ/g), and B represents the energy (J).
where m denotes the mass of a substance (g) and l is the conversion coefficient of energy.
where Es stands for the solar energy (J/a), S stands for the planting area (m2), and Rs stands for the annual solar radiation per area (J/(m2·a)).
where ERC is the chemical energy from rainfall (J/a), ρ is the rainfall density (kg/m3), and G is the Gibbs free energy (J/kg).
where ERP denotes the potential energy of rainfall (J/a), H is the altitude (m), and g is the acceleration of gravity (m/s2).
where ESS is the annual energy consumption of topsoil (J/a), SES is the annual erosion of topsoil (g/(m2·a)), CSOM is the organic content of soil (%), and EOM is the energy contained per gram of organics (J/a).
where EAW denotes the total emergy investment of agricultural irrigation, which includes water resource investment and equipment investment; EAT represents the total emergy of agricultural investment (seJ), which includes renewable resource emergy (solar energy, irrigation water, chemical energy from rainfall, and potential energy from rainfall), non-renewable resource emergy (energy consumption by topsoil), non-renewable industrial emergy (electricity, agricultural machinery, pesticides, chemical fertilizers, and agricultural film), and renewable organic emergy (manpower and seeds), as shown in Table 2.
3. Results and Discussion
3.1. Emergy Flow Analysis of the Henan Agricultural Production System
In accordance with the basic principle of emergy analysis, the variations in emergy flow in the Henan agricultural production system from 1999 to 2014 were calculated using the existing data and relevant software. Then, the previous and present situations of the Henan agricultural production system were analyzed. An agricultural production system is universally composed of two major parts: emergy investment and emergy yield. Emergy yield refers to the crop yield of the agricultural production system, which can be examined using only the index. However, emergy investment always involves the following complex types of items:
- Renewable environmental resource emergy, such as solar energy, irrigation water, chemical energy from rainfall, and potential energy from rainfall;
- Non-renewable environmental resource emergy, such as topsoil loss;
- Non-renewable industrial emergy, such as agricultural electricity, agricultural machinery, pesticides, chemical fertilizers, agricultural film, and fuel oil;
- Renewable organic emergy, such as agricultural labor and crop seeds.
The obtained results by processing the emergy flows of the Henan agricultural production system from 1999 to 2014 are presented in Table 3.
Given the short research period, the obvious changes in the potential and chemical energy from rainfall, which is under the renewable environmental resource emergy, could not be observed. Although no apparent variation was found in the annually averaged solar radiation on the ground surface, the constant expansion of the cultivated area increased the solar emergy of the cultivated land. In addition, the unceasing extension of the cultivated area and the deepening of agricultural cultivation caused topsoil loss over time to a certain degree.
All the indexes of non-renewable industrial emergy exhibited an upward trend, among which agricultural machinery emergy contributed the most, whereas fuel emergy contributed the least. Agricultural film emergy experienced an increase of 346% for 16 years, whereas pesticide emergy experienced the smallest increase of only 35.06%. Among all the indexes, agricultural labor emergy showed a downward trend as a result of the substantial transformation of agricultural labor. This finding indicated that the simplification degree of Henan agricultural labor increased continuously with agricultural mechanization and modernization. The overall emergy investment and yield increased constantly with the overall agricultural mechanization level. However, agricultural labor demonstrated an increasing degree of transformation. For 16 years, the change in Henan irrigation water emergy fluctuated in a relatively weak increasing pattern. Therefore, exploring the variation mechanism of irrigation water emergy was the key to determine the irrigation benefit allocation coefficient correctly. The relationship between irrigation benefit allocation coefficient and rainfall emergy (chemical and potential energy) is illustrated in Figure 3.
The irrigation benefit allocation coefficient and precipitation emergy were impacted by agricultural factors to different degrees. Precipitation emergy was highly vulnerable to natural factors, while the irrigation benefit allocation coefficient exhibited an annual reduction under the influence of multiple factors. However, the overall variations in the two items showed that high precipitation (indicative of a high-precipitation year) generally corresponded to a low irrigation benefit allocation coefficient. On the contrary, low precipitation usually corresponded to a high irrigation benefit allocation coefficient. The phenomenon demonstrated that precipitation exerted a significant supplementary effect on the overall irrigation of Henan, with an apparent correlation between the fluctuations in the irrigation benefit allocation coefficient and precipitation.
3.2. City-Wise Evaluation of Irrigation Benefit Allocation Coefficient
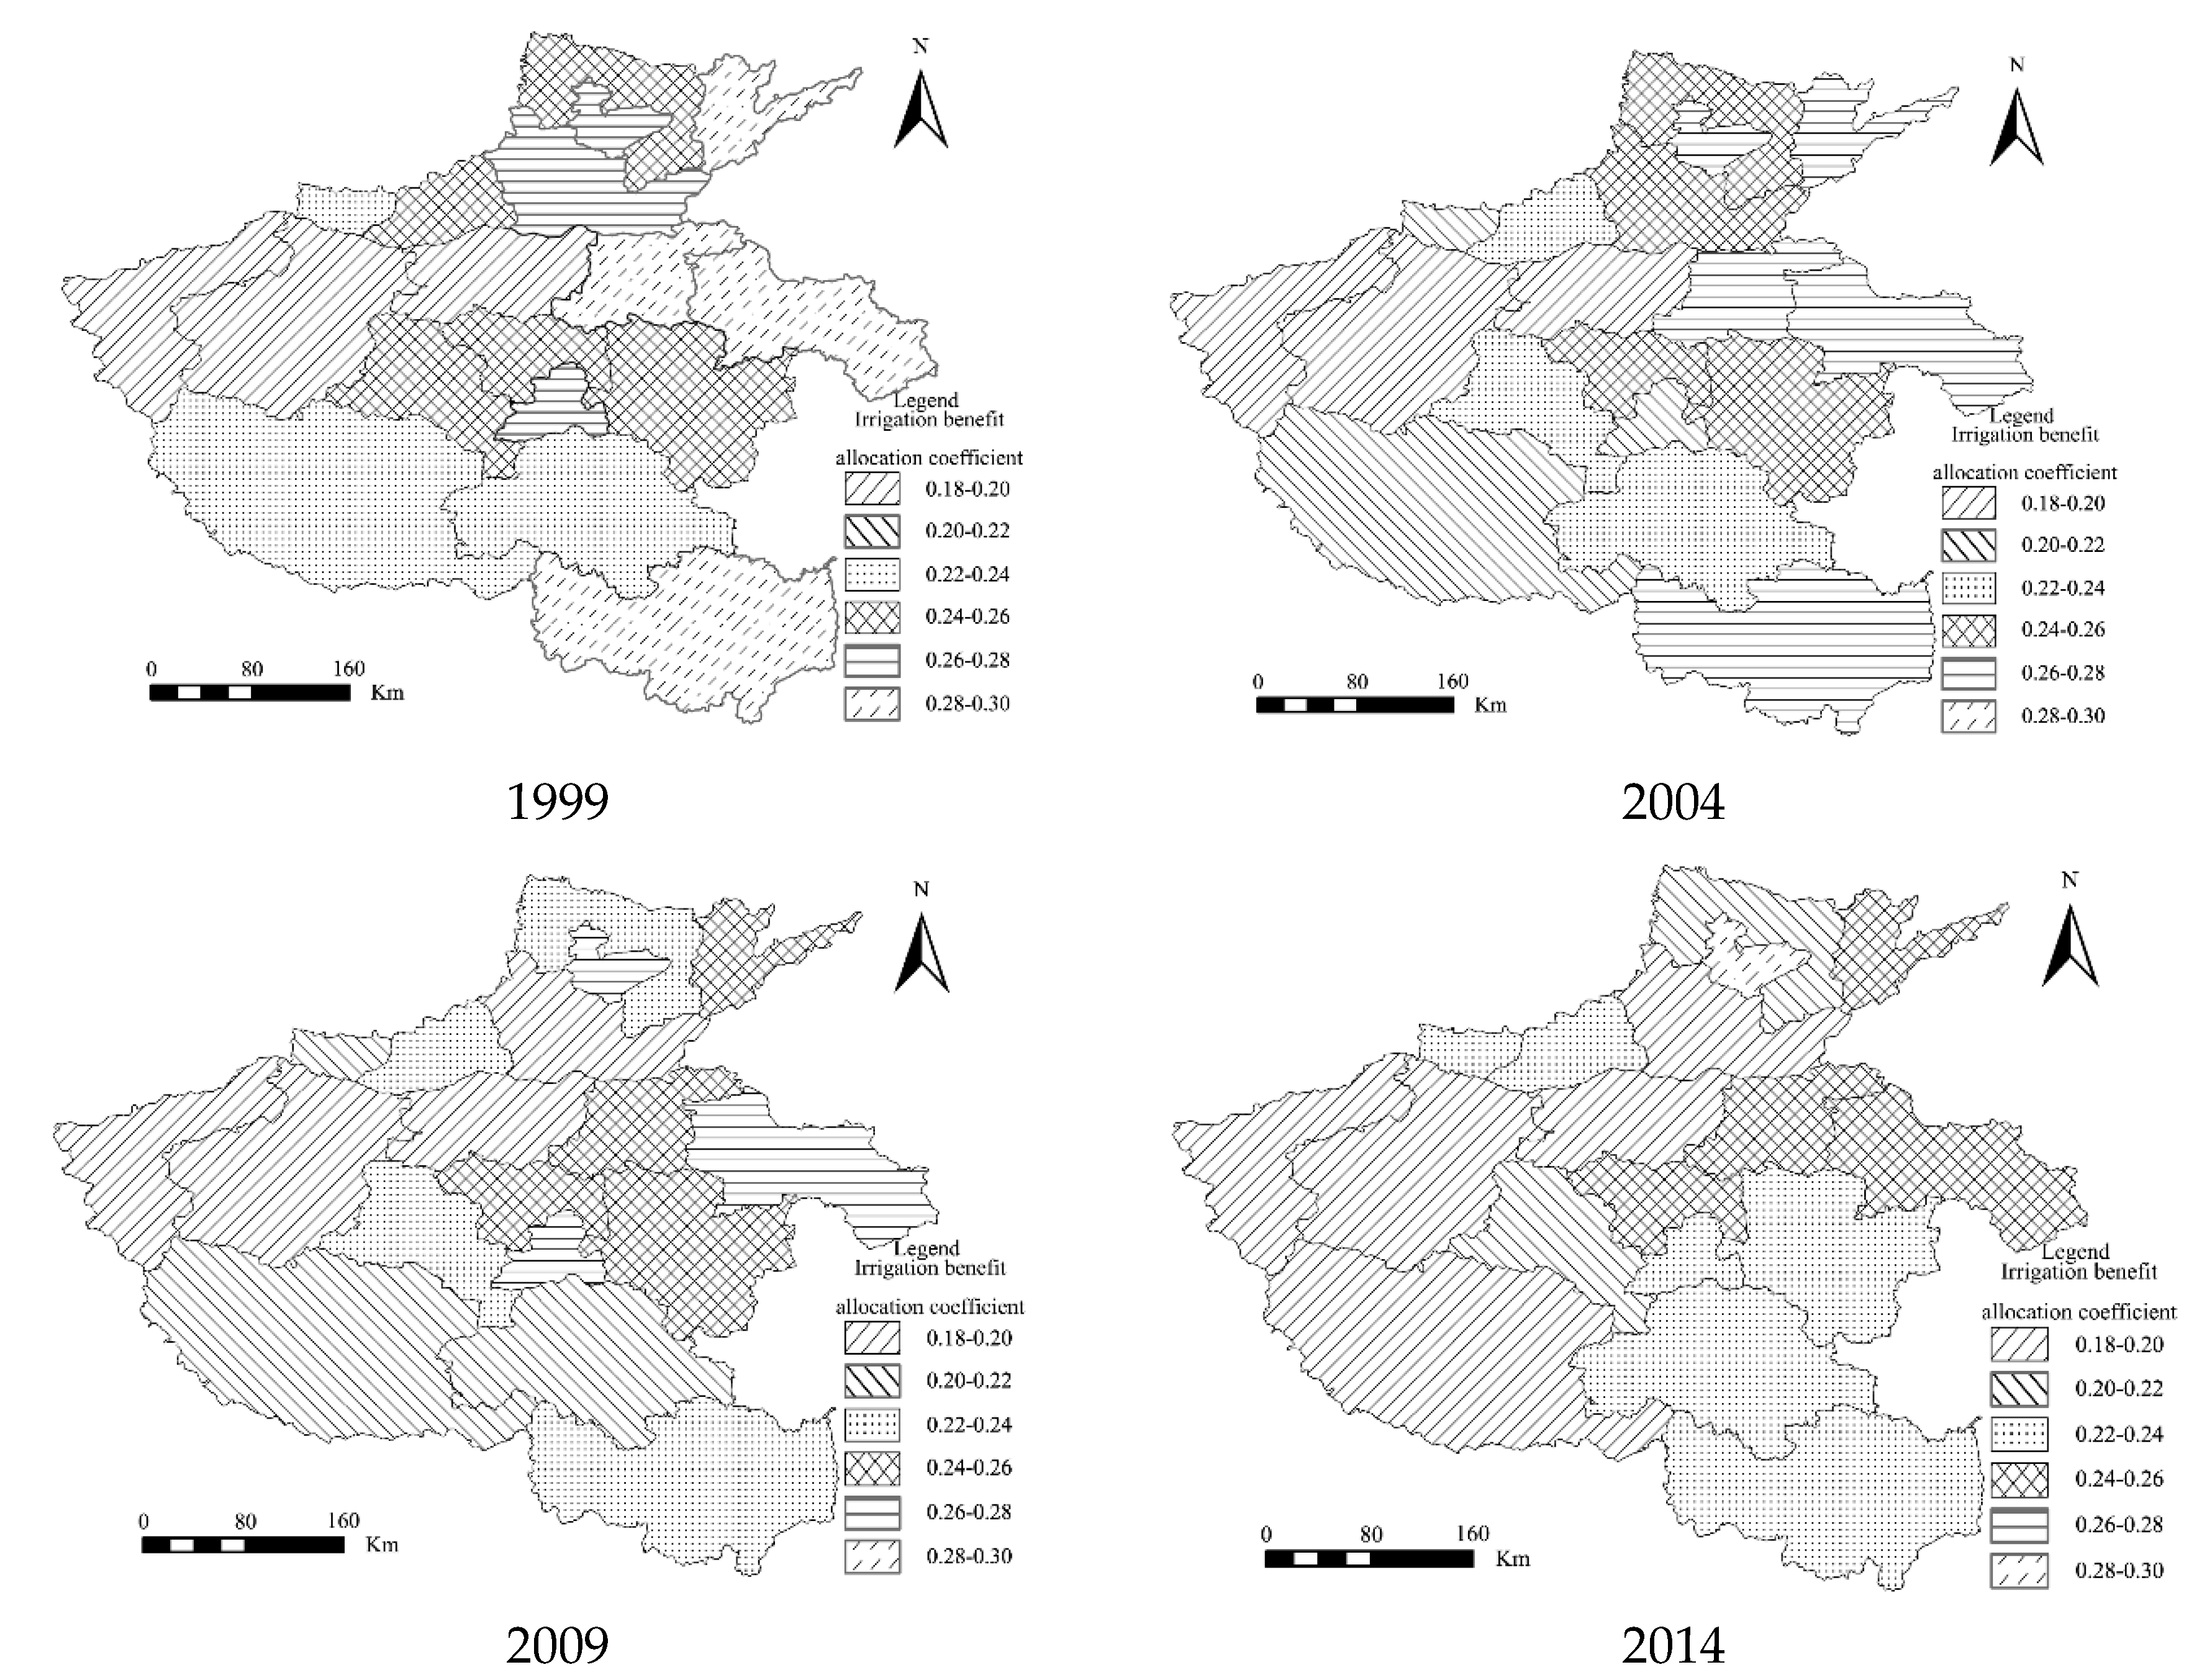
Henan’s irrigation benefit allocation coefficient descended by 0.026 for 16 years from 1999 to 2014. Therefore, the proportion and positive influence of irrigation on the agricultural production system gradually declined. To investigate the spatial-temporal variations in different prefectural and municipal irrigation benefit allocation coefficients, the calculation results of the irrigation benefit allocation coefficient were expressed in a spatial-temporal manner using ArcGIS 10.1, as shown in Table 4 and Figure 4.
Among the 18 cities of Henan, all the cities, except Hebi and Jiyuan, showed a descending trend of municipal irrigation benefit allocation coefficients. The coefficient of Hebi increased slightly by 0.01, whereas that of Jiyuan experienced no significant variation. In the two cities, the irrigation benefit allocation coefficient was mainly associated with the urban, cultivation, and effective irrigation areas (obvious correlation). The rate of development and the proportion of Hebi agricultural production irrigation projects were in the lead from 1999 to 2014. The rate of development would account for a high percentage under the condition of multifactor growth. With regard to Jiyuan being a small area, the increase in its irrigation water and facility shared nearly the same level as those in other factors. Therefore, the overall irrigation benefit allocation coefficient demonstrated no obvious variation.
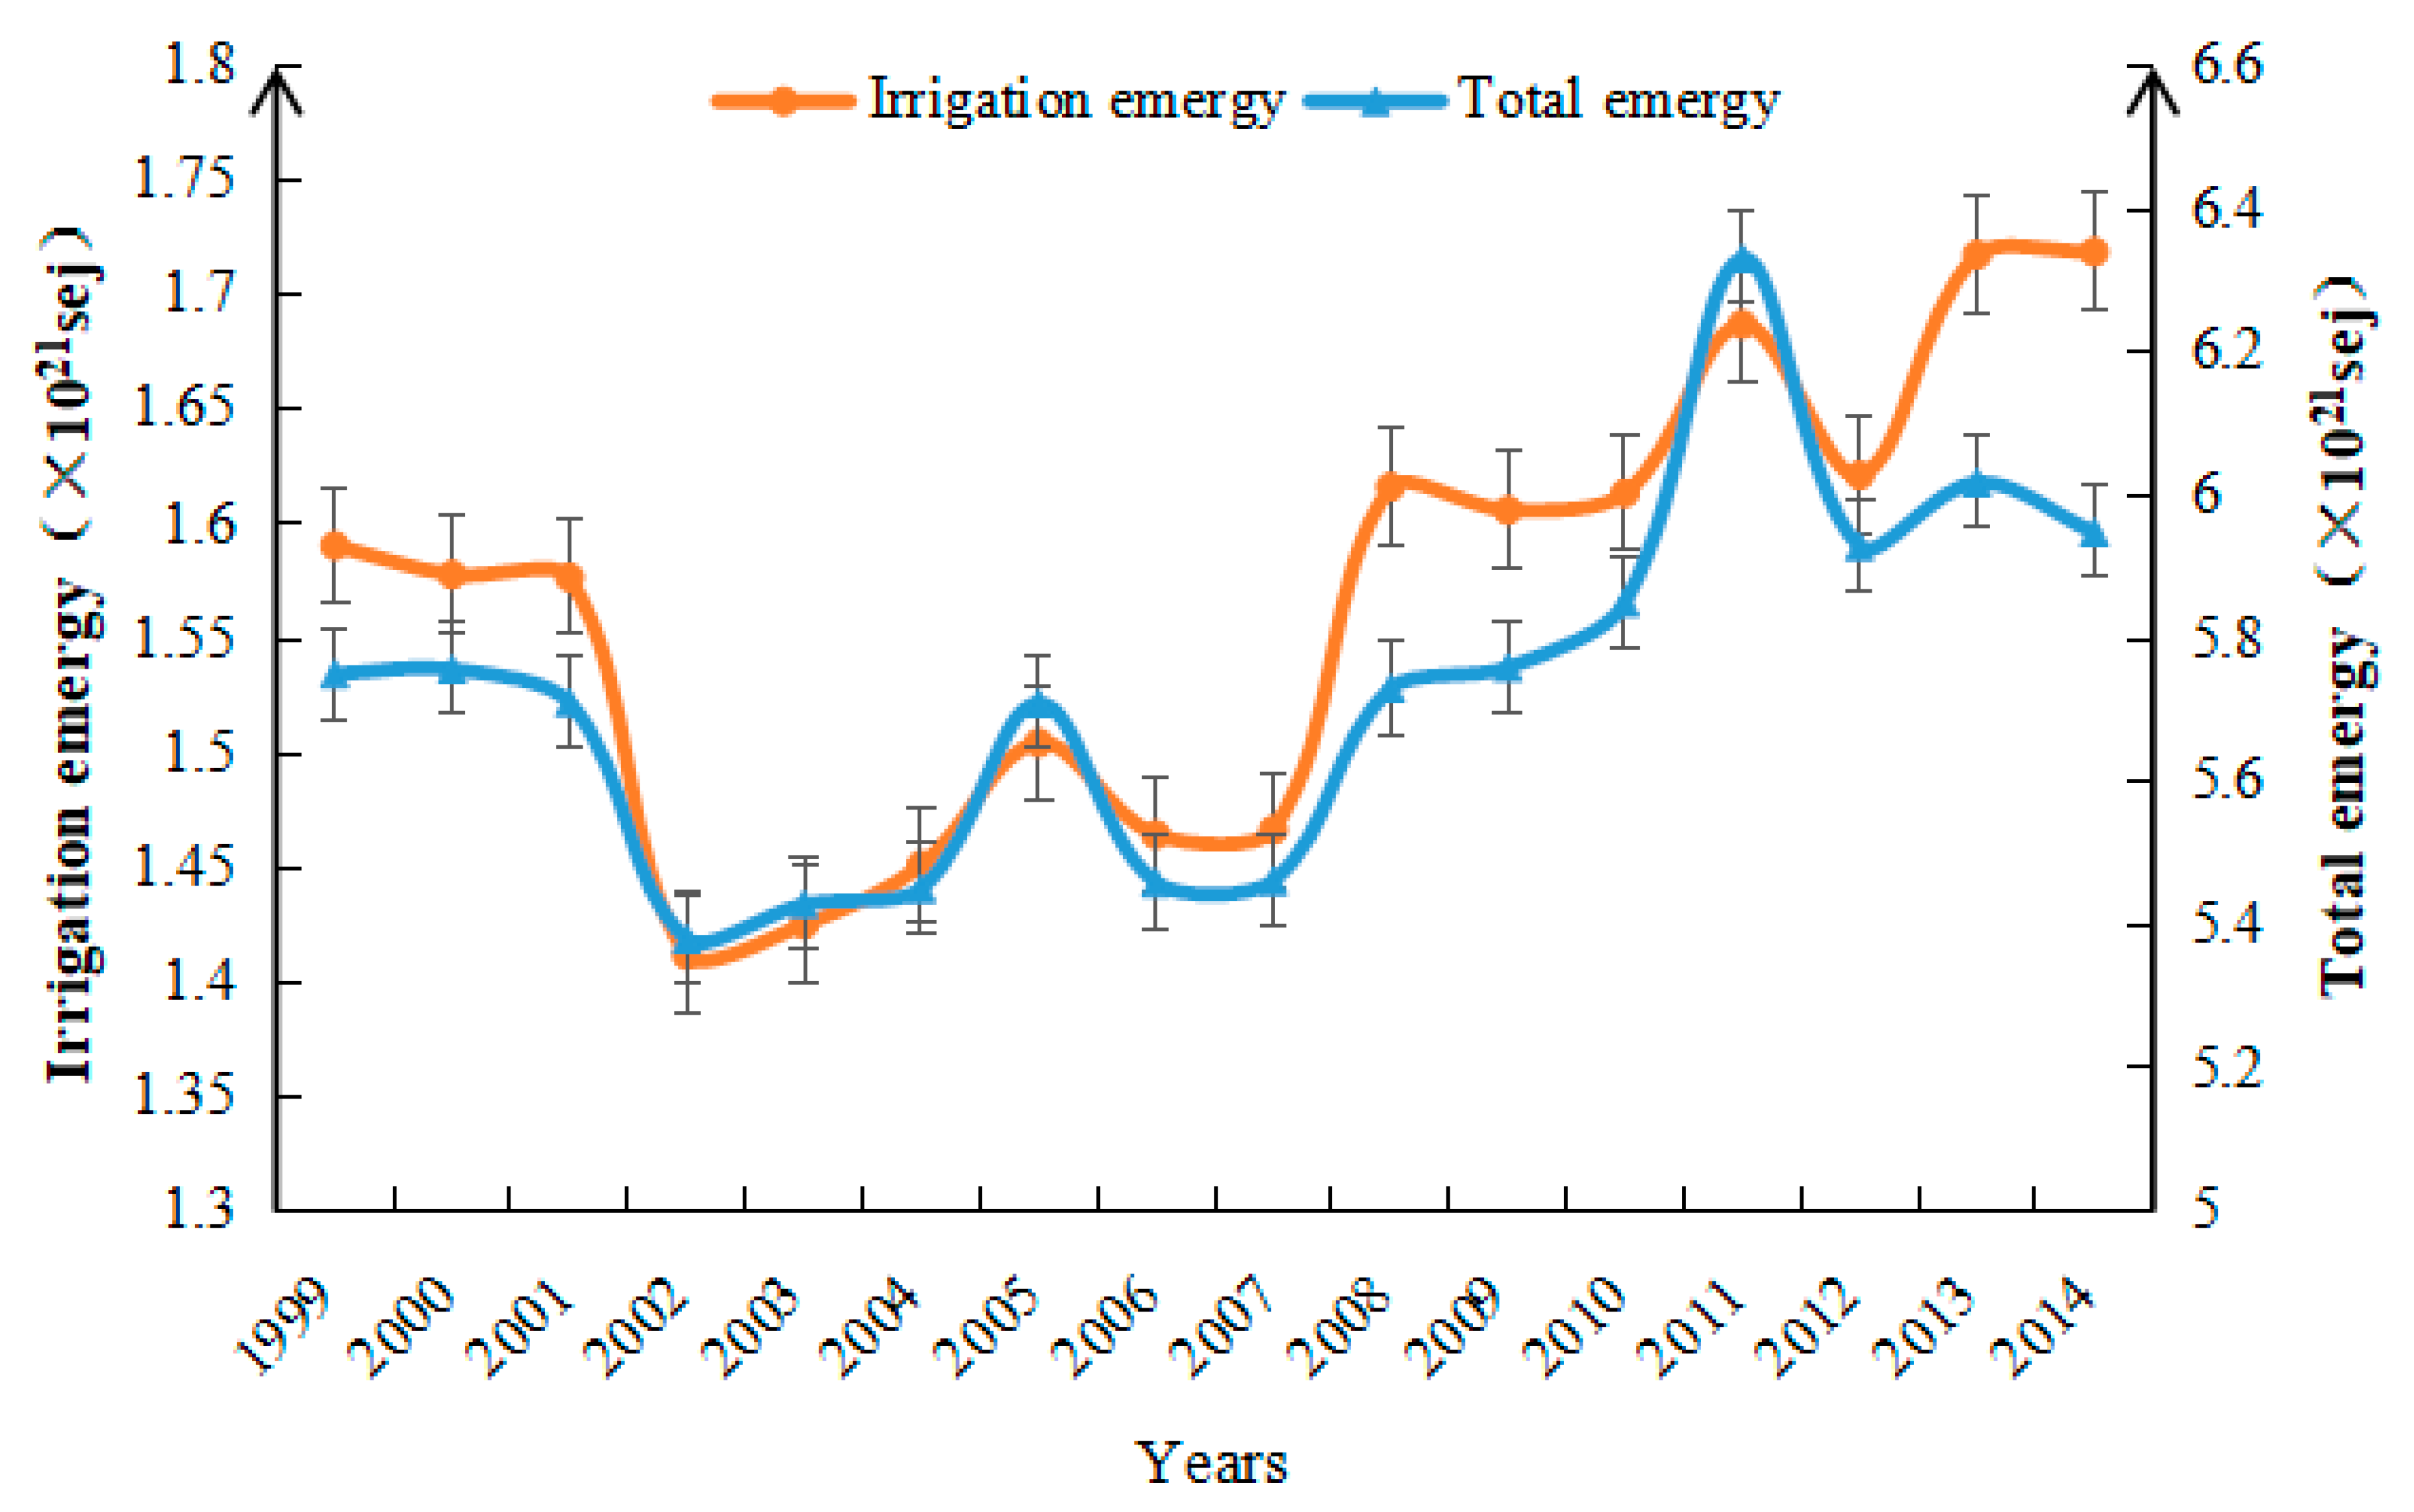
From 1999 to 2014, the Henan irrigation benefit allocation coefficient varied within a relatively steady range of 0.18–0.30, with varying situations in different cities. In 1999, cities in Henan with an irrigation benefit allocation coefficient between 0.28 and 0.30 included Puyang, Kaifeng, Shangqiu, and Xinyang. However, none of the cities was within this coefficient range in 2014. Cities with a high allocation coefficient were mainly concentrated in the Eastern Henan Plain, and they possessed a high degree of agricultural centralization, high irrigation emergy flows, and high irrigation benefit allocation coefficients. In 2014, the irrigation benefit allocation coefficients for all the cities, except Hebi, decreased to less than 0.26. The overall irrigation benefit allocation coefficient of Henan demonstrated a high degree of aggregation. The irrigation benefit allocation coefficient in the mountain region of western Henan was significantly higher than that of the plains in eastern Henan, whereas the coefficient of the mountain area in the north was lower than that of the plains in the south. The spatial distribution of Henan irrigation benefits showed an apparent correlation with the average altitude. Therefore, altitude was another important influencing factor of the emergy flows of the Henan agricultural production system. With regard to Hebi, as shown in Figure 5, the agricultural production system emergy decreased with fluctuations before increasing from 1999 to 2014 and the emergy flow constantly increased. However, the rate of increase in irrigation emergy flow was higher than the rate of increase in total emergy, thereby leading to an annually ascending irrigation benefit allocation coefficient.
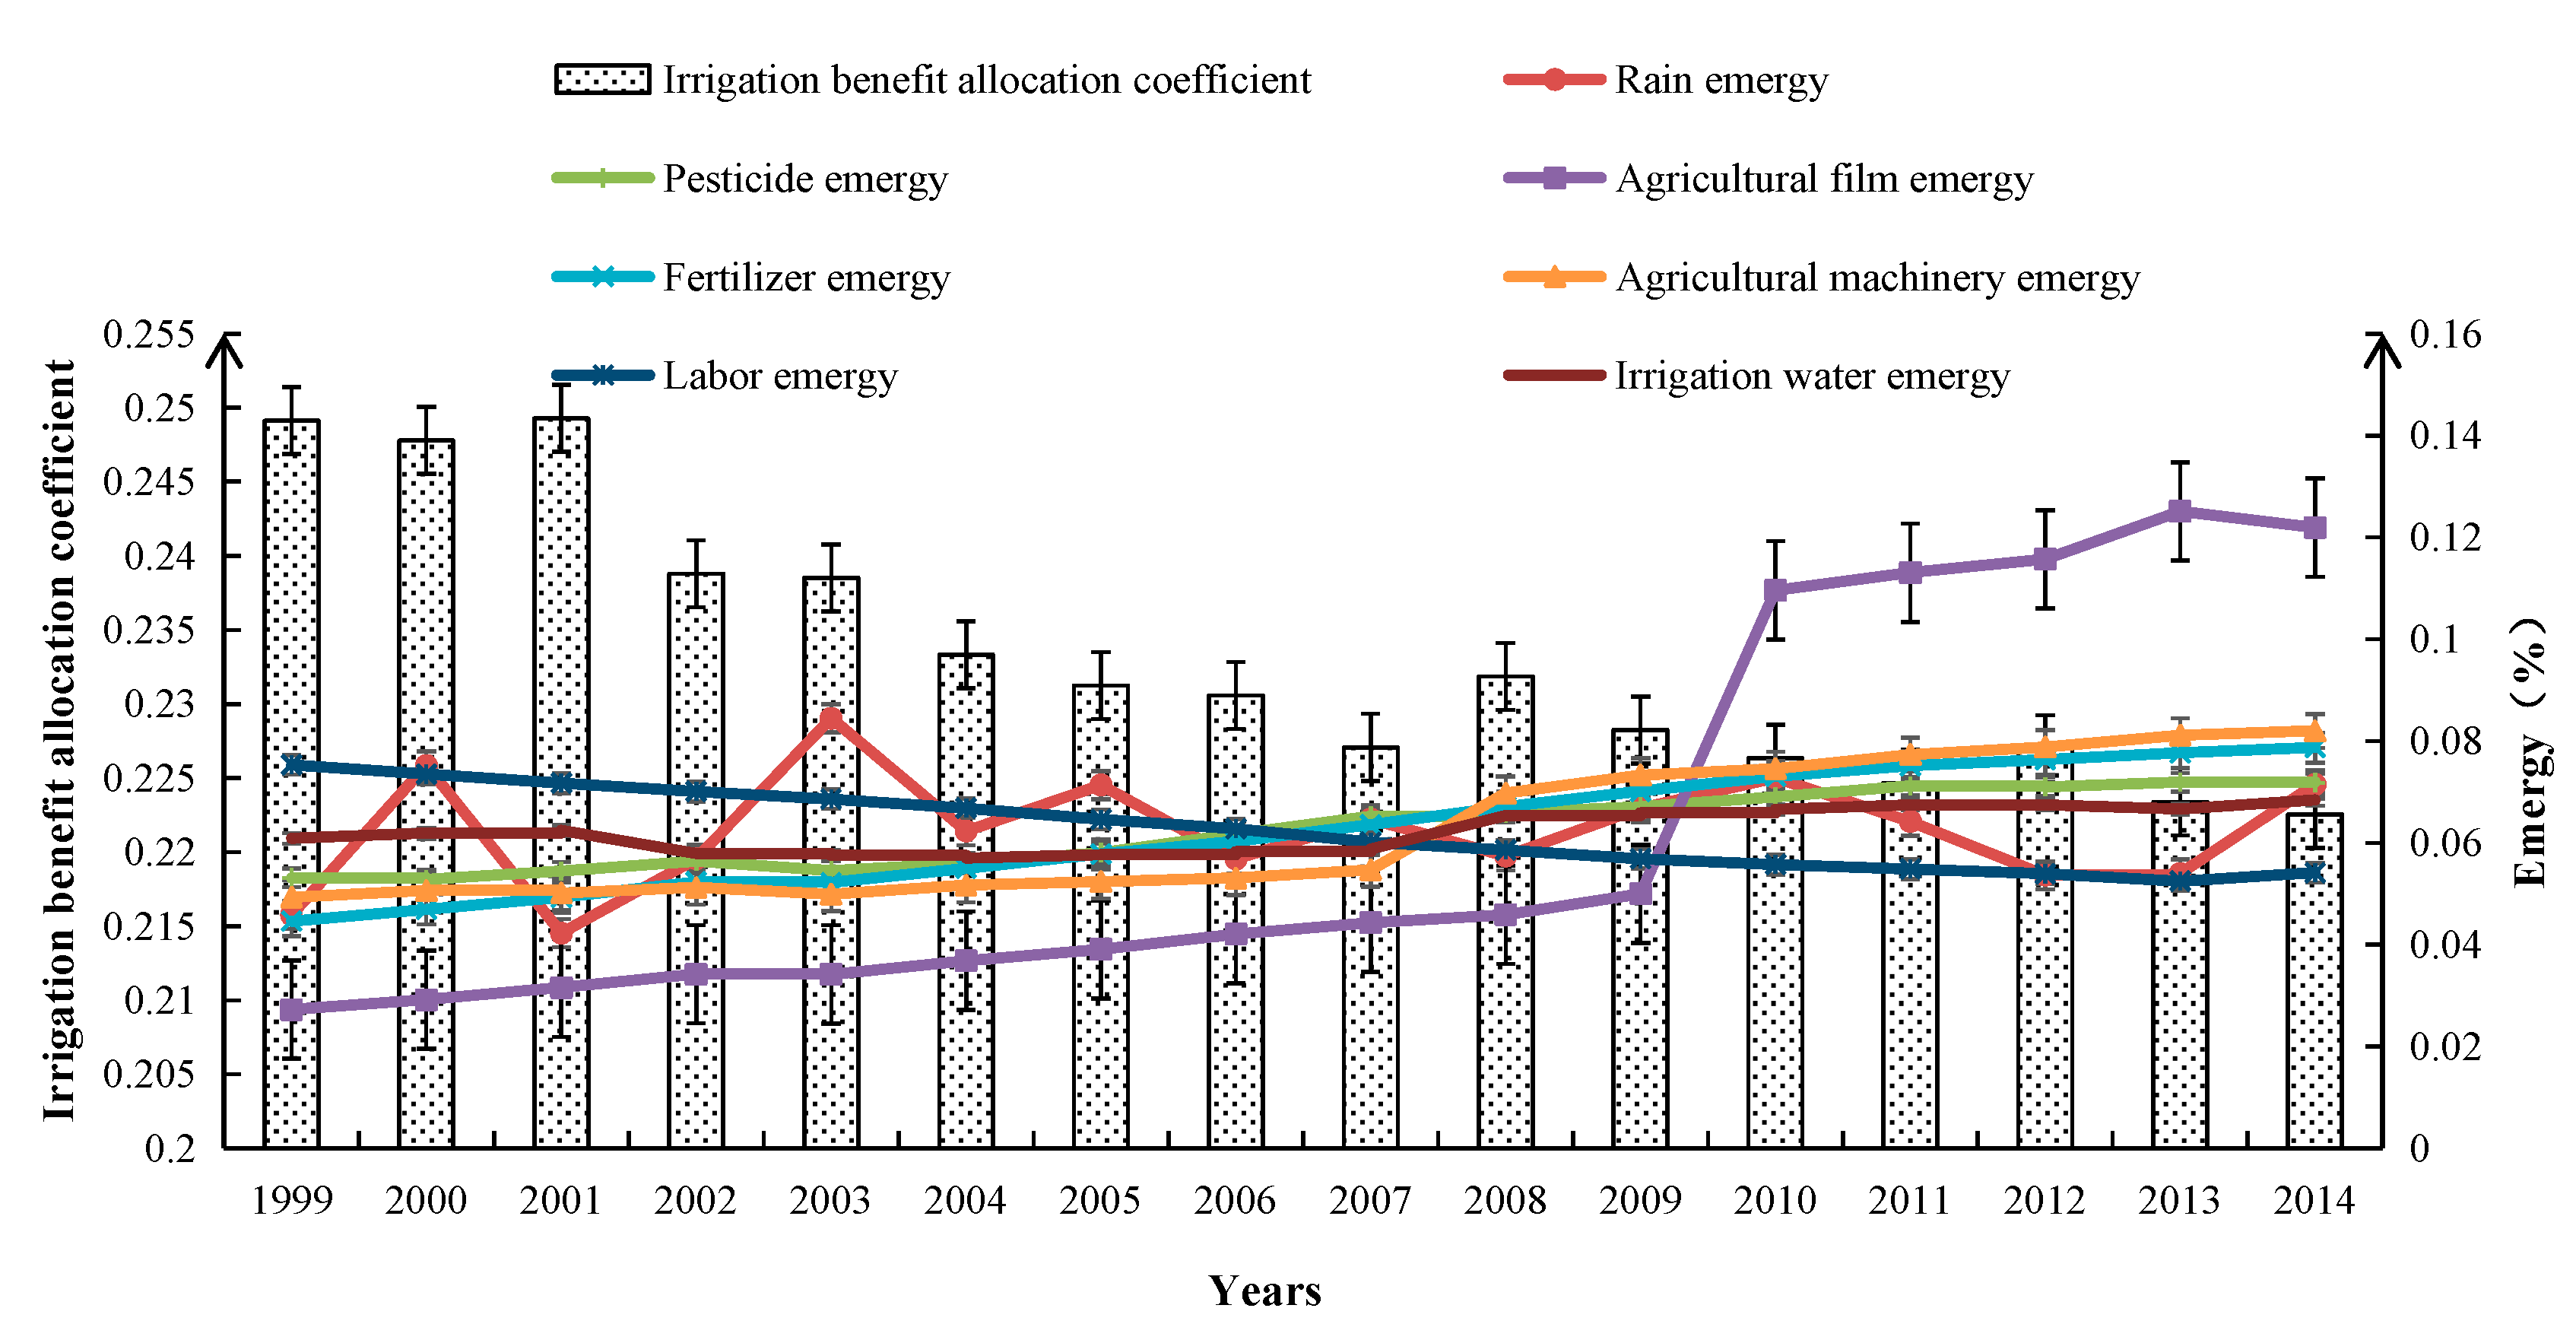
3.3. Variation Mechanism and Influencing Factors of Irrigation Benefit Allocation Coefficient
As shown in Figure 6, agricultural production system emergy had a diversified composition because of the impacts of multiple types of emergy flow. Irrigation emergy investment increased continuously, whereas the overall irrigation benefit allocation coefficient demonstrated a downward trend. This finding indicated that the increase in other emergy investment indexes was substantially higher than that in the agricultural irrigation investment in the agricultural production system. In other words, the emergy investment emphasis of the Henan agricultural production system gradually shifted from 1999 to 2014. The emergy investment of agricultural supplements, such as agricultural films, caused the emergy yield increment in the agricultural production system to remarkably exceed the emergy investment of irrigation water. This significant improvement changed the irrigation benefit allocation coefficient. In this situation, the proportion of supplementary investment factors that could significantly promote emergy yield would certainly increase, whereas the proportion of factors with low production efficiency would be reduced to a certain degree but would not fully replaced.
A correlation analysis was conducted on all the supplementary investment energy factors in the Henan agricultural production system to explore the influencing factors of the Henan irrigation benefit allocation coefficient. The analysis results are presented in Table 5.
The irrigation benefit allocation coefficient showed a negative correlation with pesticides, agricultural film, chemical fertilizers, and agricultural machinery. This relationship indicated that the four indexes exerted a remarkable positive influence on the reduction in the coefficient. Among the four indexes, chemical fertilizers with a correlation coefficient of −0.92 contributed the most to the reduction in the irrigation benefit allocation coefficient. All four indexes exhibited a positive correlation with irrigation water emergy. This finding demonstrated that the indexes in the Henan agricultural production system were mutually complementary. Irrigation water was required in less amounts during wet periods, and vice versa. Therefore, the two indexes were directly affected by each other. However, rainfall had a relatively low effect on the coefficient, and this effect was much lesser than that of the other indexes. Therefore, neither reduction in the irrigation emergy flow investment nor the significant increase in precipitation caused a reduction in the Henan irrigation benefit allocation coefficient for 16 years. The main reason was that the rate of increase in other supplementary emergy investment was higher than that of the increase in irrigation water emergy. Moreover, the effects of the rate of increase in the irrigation benefit allocation coefficient on the increase in the agricultural production system emergy yield were not as significant as those of the other factors. Increasing the irrigation water could promote the minimal increase in the emergy yield of the agricultural production system. The yield-increasing effect was inferior to that of the agricultural machinery and chemical fertilizers. Therefore, the overall rate of increase in yield would be reduced, thereby generating a spinoff effect and lowering the irrigation benefit allocation coefficient.
4. Conclusions
From the study of the Henan agricultural production system and the irrigation benefit allocation coefficient from 1999 to 2014 by using emergy analysis, the following conclusions were obtained.
First, the total emergy investment of the Henan agricultural production system constantly increased with total emergy yield. Agricultural emergy flow investment increased by 53.79% for 16 years, while the emergy yield reached a high rate of 67.56%. Although all emergy investment indexes substantially increased, the increase in agricultural film emergy and electricity emergy were significantly higher than those of the other indexes. This finding indicated that environmental resource emergy could affect emergy yield to a certain extent but could not effectively control it. Therefore, necessary supplementary emergy investment was critical for boosting emergy yield.
Second, the Henan irrigation benefit allocation coefficient demonstrated a downward trend from 1999 to 2014. The total decrease was 0.026 for 16 years. However, the constant increase in irrigation emergy investment showed that the reason for the reduction in the Henan irrigation benefit allocation coefficient for 16 years was the higher rate of increase in other supplementary emergy investment than that of the increase in irrigation emergy, except for investment reduction in irrigation water and equipment.
Multiple factors could impact the variation in the Henan irrigation benefit allocation coefficient. Although the irrigation coefficient increased during dry periods and declined during wet periods, explaining the changes in the irrigation benefit allocation coefficient using precipitation was difficult. Moreover, precipitation exerted a much lower influence on the coefficient than the other investment indexes. The investment indexes exhibited a negative correlation with the coefficient, except for labor emergy investment of a positive correlation. Chemical fertilizers and pesticides had the most significant negative correlation with coefficients of −0.92 and −0.89, respectively.
On the basis of the present work results, future study will focus on the sources of irrigation water in different regions and the indexes that impact the irrigation benefit allocation coefficient on the basis of crucial water resources, such as regional irrigation rivers. The irrigation benefit allocation coefficient showed an annual downward trend. However, the positive influence of irrigation investment on the yield of the agricultural production system could not be denied. Although the irrigation benefit allocation coefficient gradually decreased, irrigation investment was replaced by some other emergy investments with an obvious positive influence to a certain degree. Therefore, our subsequent research will focus on the determination of the optimal ratio of multiple emergy investments and the accurate prediction of the direction of future development.
Author Contributions
All authors conceived, designed, and implemented the study. K.W. and P.Z. designed and carried out the study. B.P. participated in the analysis and presentation of analytic results.
Funding
This research was funded by the National Natural Science Foundation of China (41371178, 41601175). The key scientific research project of Henan province (16A610001), 2018 Young Backbone Teachers Foundation from Henan Province, and supported by Program for Innovative Research Team (in Science and Technology) in University of Henan Province (16IRTSTHN012).
Conflicts of Interest
All authors declare no conflict of interest.
References
- Van Loon, A.F.; Gleeson, T.; Clark, J.; Van Dijk, A.I.; Stahl, K.; Hannaford, J.; Di Baldassarre, G.; Teuling, A.J.; Tallaksen, L.M.; Uijlenhoet, R.; Hannah, D.M.; et al. Drought in the Anthropocene. Nat. Geosci. 2016, 9, 89–91. [Google Scholar] [CrossRef] [Green Version]
- Kummu, M.; Guillaume, J.H.A.; Moel, H.D.; Ward, P.J. The world’s road to water scarcity: Shortage and stress in the 20th century and pathways towards sustainability. Sci. Rep. 2016, 6, 38495–38510. [Google Scholar] [CrossRef] [PubMed]
- Vörösmarty, C.J.; Green, P.; Salisbury, J.; Lammers, R.B. Global water resources: Vulnerability from climate change and population growth. Science 2000, 289, 284–288. [Google Scholar] [CrossRef] [PubMed]
- Oki, T.; Kanae, S. Global hydrological cycles and world water resources. Science 2006, 313, 1068–1072. [Google Scholar] [CrossRef] [PubMed]
- Piao, S.L.; Ciais, P.; Huang, Y.; Shen, Y.H.; Peng, S.S.; Li, J.S.; Zhou, L.P.; Liu, H.Y.; Ma, Y.C.; Ding, Y.H.; et al. The impacts of climate change on water resources and agriculture in China. Nature 2010, 467, 43–51. [Google Scholar] [CrossRef] [PubMed]
- Yang, H.; Wright, J.A.; Gundry, S.W. Water accessibility: Boost water safety in rural China. Nature 2012, 484, 318. [Google Scholar] [CrossRef] [PubMed]
- Falkenmark, M. Growing water scarcity in agriculture: Future challenge to global water security. Philos. Trans. A Math. Phys. Eng. Sci. 2013, 371, 20120410. [Google Scholar] [CrossRef] [PubMed]
- Famiglietti, J.S. The global groundwater crisis. Nat. Clim. Chang. 2014, 4, 945–948. [Google Scholar] [CrossRef]
- Xia, J. An integrated management approach for water quality and quantity: Case studies in North China. Int. J. Water Resour. D 2012, 28, 299–312. [Google Scholar] [CrossRef]
- Fraiture, C.D. Integrated water and food analysis at the global and basin level. An application of WATERSIM. Water Resour. Manag. 2007, 21, 185–198. [Google Scholar] [CrossRef]
- Hu, Z.N.; Chen, Y.Z.; Yao, L.M.; Wei, C.T.; Li, C.Z. Optimal allocation of regional water resources: From a perspective of equity–efficiency tradeoff. Resour. Conserv. Recycl. 2016, 109, 102–113. [Google Scholar] [CrossRef]
- Wang, J.X.; Huang, J.K.; Rozelle, S.; Huang, Q.Q.; Zhang, L.J. Understanding the water crisis in Northern China: What government and farmers are doing? Int. J. Water Resour. D 2009, 25, 141–158. [Google Scholar] [CrossRef]
- Howe, C.W.; Schurmeier, D.R.; Shaw, W.D.J. Innovative approaches to water allocation: The potential for water markets. Water Resour. Res. 1986, 22, 439–445. [Google Scholar] [CrossRef]
- Major, D.C. Benefit-cost ratios for projects in multiple objective investment programs. Water Resour. Res. 1969, 5, 1174–1178. [Google Scholar] [CrossRef]
- Rosegrant, M.W.; Binswanger, H.P. Markets in tradable water rights: Potential for efficiency gains in developing country water resource allocation. World Dev. 1994, 22, 1613–1625. [Google Scholar] [CrossRef]
- Shen, H.; Mcbean, E. Pareto optimality for sensor placements in a water distribution system. J. Water Res. Plan. Manag. 2010, 137, 243–248. [Google Scholar] [CrossRef]
- Nouiri, I. Multi-Objective tool to optimize the water resources management using genetic algorithm and the Pareto optimality concept. Water Resour. Manag. 2014, 28, 2885–2901. [Google Scholar] [CrossRef]
- Read, L.; Madani, K.; Inanloo, B. Optimality versus stability in water resource allocation. J. Environ. Manag. 2014, 133, 343–354. [Google Scholar] [CrossRef] [PubMed]
- Wang, Q.; Guidolin, M.; Savic, D.; Kapelan, Z. Technical papers two-objective design of benchmark problems of a water distribution system via MOEAs: Towards the best-known approximation of the true Pareto front. J. Water Res. Plan. Manag. 2015, 141, 04014060. [Google Scholar] [CrossRef]
- Madani, K. Game theory and water resources. J. Hydrol. 2010, 381, 225–238. [Google Scholar] [CrossRef]
- Wang, L.Z.; Fang, L.; Hipel, K.W. Water resources allocation: A cooperative game theoretic approach. J. Environ. Inform. 2003, 2, 11–22. [Google Scholar] [CrossRef]
- Sechi, G.M.; Zucca, R.; Zuddas, P. Water costs allocation in complex systems using a cooperative game theory approach. Water Resour. Manag. 2013, 27, 1781–1796. [Google Scholar] [CrossRef]
- Nazemi, A.; Wheater, H.S. On inclusion of water resource management in Earth system models—Part 2: Representation of water supply and allocation and opportunities for improved modeling. Hydrol. Earth. Syst. Sci. 2015, 19, 63–90. [Google Scholar] [CrossRef]
- Jafarzadegan, K.; Abed-Elmdoust, A.; Kerachian, R. A stochastic model for optimal operation of inter-basin water allocation systems: A case study. Stoch. Environ. Res. Risk Assess. 2014, 28, 1343–1358. [Google Scholar] [CrossRef]
- Roozbahani, R.; Schreider, S.; Abbasi, B. Optimal water allocation through a multi-objective compromise between environmental, social, and economic preferences. Environ. Model. Softw. 2015, 64, 18–30. [Google Scholar] [CrossRef]
- Álvarez, J.F.O.; Valero, J.A.D.J.; Martín-Benito, J.M.T.; Mata, E.L. MOPECO: An economic optimization model for irrigation water management. Irrigat. Sci. 2004, 23, 61–75. [Google Scholar] [CrossRef]
- Han, Y.; Huang, Y.F.; Wang, G.Q.; Maqsood, I. A Multi-objective linear programming model with interval parameters for water resources allocation in Dalian City. Water Resour. Manag. 2011, 25, 449–463. [Google Scholar] [CrossRef]
- Chen, Z.S.; Wang, H.M.; Qi, X.T. Pricing and water resource allocation scheme for the South-to-North Water Diversion Project in China. Water Resour. Manag. 2013, 27, 1457–1472. [Google Scholar] [CrossRef]
- Hu, X.J.; Xiong, Y.C.; Li, Y.J.; Wang, J.X.; Li, F.M.; Wang, H.Y.; Li, L.L. Integrated water resources management and water users’ associations in the arid region of northwest China: A case study of farmers’ perceptions. J. Environ. Manag. 2014, 145, 162–169. [Google Scholar] [CrossRef] [PubMed]
- Zhao, X.; Liu, J.G.; Liu, Q.Y.; Tillotson, M.R.; Guanc, D.B.; Hubacekd, K. Physical and virtual water transfers for regional water stress alleviation in China. Proc. Natl. Acad. Sci. USA 2014, 112, 1031–1035. [Google Scholar] [CrossRef] [PubMed]
- Nian, Y.Y.; Li, X.; Zhou, J.; Hu, X.L. Impact of land use change on water resource allocation in the middle reaches of the Heihe River Basin in northwestern China. J. Arid Land 2014, 6, 273–286. [Google Scholar] [CrossRef]
- Zhu, X.F.; Li, Y.Z.; Li, M.Y.; Pan, Y.Z.; Shi, P.J. Agricultural irrigation in China. J. Soil Water Conserv. 2013, 68, 147A–154A. [Google Scholar] [CrossRef] [Green Version]
- Wriedt, G.; Velde, M.V.D.; Aloe, A.; Bouraoui, F. Estimating irrigation water requirements in Europe. J. Hydrol. 2009, 373, 527–544. [Google Scholar] [CrossRef]
- Lecinaa, S.; Nealea, C.M.U.; Merkleya, G.P.; Santosb, C.A.C.D. Irrigation evaluation based on performance analysis and water accounting at the Bear River Irrigation Project (U.S.A.). Agric. Water Manag. 2011, 98, 1349–1363. [Google Scholar] [CrossRef] [Green Version]
- Liang, X.; Dijk, M.P.V. Economic and financial analysis on rainwater harvesting for agricultural irrigation in the rural areas of Beijing. Water Resour. Manag. 2011, 55, 1100–1108. [Google Scholar] [CrossRef]
- Kucukmehmetoglu, M.; Guldmann, J.M. International water resources allocation and conflicts—The case of the Euphrates and the Tigris. Environ. Plan. A 2004, 36, 783–801. [Google Scholar] [CrossRef]
- Alcon, F.; Martin-Ortega, J.; Pedrero, F.; Alarcon, J.J.; Miguel, M.D.D. Incorporating Non-market benefits of reclaimed water into cost-benefit analysis: A case study of irrigated mandarin crops in southern Spain. Water Resour. Manag. 2012, 27, 1809–1820. [Google Scholar] [CrossRef]
- Alarcón, J.; Garrido, A.; Juana, L. Managing irrigation water shortage: A comparison between five allocation rules based on crop benefit functions. Water Resour. Manag. 2014, 28, 2315–2329. [Google Scholar] [CrossRef]
- Giordano, M.; Fraiture, C.D. Small private irrigation: Enhancing benefits and managing trade-offs. Agric. Water Manag. 2014, 131, 175–182. [Google Scholar] [CrossRef]
- Fan, M.S.; Shen, J.B.; Yuan, L.X.; Jiang, R.F.; Chen, X.P.; Davies, W.J.; Zhang, F.S. Improving crop productivity and resource use efficiency to ensure food security and environmental quality in China. J. Exp. Bot. 2012, 63, 13–24. [Google Scholar] [CrossRef] [PubMed]
- Wu, Y.N.; Chen, Y. Food safety in China. J. Epidemiol. Commun. H 2012, 67, 476–477. [Google Scholar]
- Hou, Z.; Yu, C.S. Study of divvy coefficient to irrigation benefit in Shandong Province near Yellow River area. J. Shangdong Univ. Technol. 2001, 31, 152–155. (In Chinese) [Google Scholar]
- Zhang, X.L.; Huo, Z.L.; Tong, L. Irrigation benefit evaluation of main crops in Shiyang River basin. Chin. Rural Water Hydropower 2014, 8, 15–17. (In Chinese) [Google Scholar]
- Hau, J.T.; Bakshi, B.R. Promise and problems of emergy analysis. Ecol. Model. 2004, 178, 215–225. [Google Scholar] [CrossRef] [Green Version]
- Odum, H.T. Environmental Accounting: EMERGY and Environmental Decision Making; John Wiley & Sons Inc.: New York, NY, USA, 1996. [Google Scholar]
- Zheng, T.C.; Zhang, X.K.; Yin, G.H.; Wang, L.N.; Han, Y.L.; Chen, L.; Huang, F.; Tang, J.W.; Xia, X.C.; He, Z.H. Genetic gains in grain yield, net photosynthesis and stomatal conductance achieved in Henan Province of China between 1981 and 2008. Field Crops Res. 2011, 122, 225–233. [Google Scholar] [CrossRef]
- Zhang, H.B.; Luo, Y.M.; Li, Q.B. Burden and depth distribution of organochlorine pesticides in the soil profiles of Yangtze River Delta Region, China: Implication for sources and vertical transportation. Geoderma 2009, 153, 69–75. [Google Scholar] [CrossRef]
- Yi, Y.L. Soil nutrient status in Henan Province. Henan Sci. 2012, 30, 882–886. (In Chinese) [Google Scholar]
- Li, L.; Zhang, S.K.; Wu, K.N.; Yang, S.Q.; Du, L.W. Analysis on spatio-temporal variability of soil organic matter in Henan Province based on soil taxonomy. Acta Pedologica Sinica 2015, 52, 979–990. (In Chinese) [Google Scholar]
Figure 1.
Flowchart of the irrigation benefit allocation coefficient.

Figure 2.
Location of the study area.

Figure 3.
Impact of irrigation benefit sharing coefficient and precipitation on the time series of changes.
Figure 3.
Impact of irrigation benefit sharing coefficient and precipitation on the time series of changes.

Figure 4.
Spatial-temporal distribution of the Henan irrigation benefit allocation coefficient from 1999 to 2014.
Figure 4.
Spatial-temporal distribution of the Henan irrigation benefit allocation coefficient from 1999 to 2014.

Figure 5.
Relationship between the irrigation emergy and total emergy of Hebi, Henan from 1999 to 2014.
Figure 5.
Relationship between the irrigation emergy and total emergy of Hebi, Henan from 1999 to 2014.

Figure 6.
Spatial change in emergy investment indexes in the Henan agricultural production system.


Table 1.
Index of energy conversion coefficient and energy conversion.
| Category | Source |
|---|---|
| Grain production | Henan Statistical Yearbook China City Statistical Yearbook Henan Rural Statistical Yearbook China Agriculture Yearbook Government gazettes and internal data |
| Farmland | |
| Effective irrigation area | |
| Agricultural tractor-plowed area | |
| Agricultural resource consumption | |
| Agricultural personnel | |
| Solar radiation | China meteorological data-sharing service system |
| Precipitation | |
| Topsoil loss | Studies by other researchers, experimental calculations |
Table 2.
Index of energy conversion coefficient and energy conversion.
| Item | Emergy Conversion Ratio (seJ/unit) | Crop | Energy Conversion Coefficient (J/kg) | Emergy Conversion Ratio (seJ/unit) |
|---|---|---|---|---|
| Solar energy (J) | 1.00 | Rice (J) | 1.51 × 10⁷ | 8.30 × 10⁴ |
| Chemical energy from rainfall (J) | 1.54 × 10⁴ | Wheat (J) | 1.63 × 10⁷ | 6.80 × 10⁴ |
| Potential energy from rainfall (J) | 8.89 × 10³ | Corn (J) | 1.63 × 10⁷ | 2.70 × 10⁴ |
| Topsoil loss (J) | 6.25 × 10⁴ | Soybean (J) | 2.09 × 10⁷ | 8.30 × 10⁴ |
| Irrigation water (m3) | 4.10 × 10¹² | Green bean (J) | 1.67 × 10⁷ | 8.30 × 10⁴ |
| Fuel (J/kg) | 0.66 × 10⁷ | Yam (J) | 0.42 × 10⁷ | 8.30 × 10⁴ |
| Electricity (J/kwh) | 1.59 × 10⁷ | Peanut (J) | 2.30 × 10⁷ | 8.60 × 10⁴ |
| Agricultural machinery (J) | 7.50 × 10⁷ | Rapeseed (J) | 2.63 × 10⁷ | 8.60 × 10⁴ |
| Labor (J) | 3.80 × 10⁵ | Sesame (J) | 3.00 × 10⁷ | 8.60 × 10⁴ |
| Organic fertilizer (t) | 4.77 × 10¹⁵ | Cotton (J) | 1.67 × 10⁷ | 8.60 × 10⁴ |
| Plastic film (t) | 3.80 × 10¹⁴ | Bast fiber (J) | 1.63 × 10⁷ | 8.30 × 10⁴ |
| Pesticide (t) | 1.60 × 10¹⁵ | Tobacco (J) | 1.75 × 10⁷ | 20.00 × 10⁴ |
| Seeds (J) | 2.00 × 10⁵ | Vegetable (J) | 2.50 × 10⁷ | 2.70 × 10⁴ |
| - | - | Cucurbit (J) | 1.10 × 10⁷ | 4.30 × 10⁴ |
Table 3.
Emergy flow variations in the Henan agricultural production system from 1999 to 2014 (Unit: seJ).
Table 3.
Emergy flow variations in the Henan agricultural production system from 1999 to 2014 (Unit: seJ).
| Item | 1999 | 2000 | 2001 | 2002 | 2003 | 2004 | 2005 | 2006 | 2007 | 2008 | 2009 | 2010 | 2011 | 2012 | 2013 | 2014 | ||
|---|---|---|---|---|---|---|---|---|---|---|---|---|---|---|---|---|---|---|
| Emergy Investment | Renewable environmental resource emergy | Solar energy × 1020 | 3.71 | 3.73 | 3.75 | 3.95 | 3.91 | 3.90 | 3.91 | 3.91 | 3.91 | 3.86 | 4.30 | 4.30 | 4.30 | 4.30 | 4.43 | 4.44 |
| Potential energy from rainfall × 1020 | 3.33 | 5.46 | 3.06 | 4.14 | 6.10 | 4.49 | 5.16 | 4.11 | 4.67 | 4.16 | 4.88 | 5.32 | 4.69 | 3.92 | 3.96 | 5.24 | ||
| Chemical energy from rainfall × 1021 | 3.19 | 5.23 | 2.94 | 3.96 | 5.88 | 4.33 | 4.97 | 3.95 | 4.50 | 3.99 | 4.60 | 5.06 | 4.46 | 3.73 | 3.75 | 4.97 | ||
| Irrigation water × 1022 | 5.88 | 5.98 | 6.03 | 5.59 | 5.56 | 5.51 | 5.58 | 5.63 | 5.68 | 6.31 | 6.37 | 6.43 | 6.52 | 6.52 | 6.44 | 6.61 | ||
| Non-renewable environmental resource emergy | Topsoil loss × 1021 | 1.95 | 1.89 | 1.96 | 2.05 | 2.01 | 2.03 | 2.21 | 2.10 | 2.09 | 1.93 | 2.45 | 2.23 | 2.24 | 2.44 | 2.49 | 2.98 | |
| Non-renewable industrial emergy | Agricultural machinery × 1023 | 1.71 | 1.75 | 1.73 | 1.77 | 1.73 | 1.79 | 1.81 | 1.84 | 1.89 | 2.41 | 2.53 | 2.58 | 2.67 | 2.73 | 2.81 | 2.83 | |
| Chemical fertilizers × 1022 | 1.91 | 2.01 | 2.11 | 2.23 | 2.23 | 2.35 | 2.47 | 2.58 | 2.72 | 2.87 | 3.00 | 3.13 | 3.21 | 3.26 | 3.32 | 3.37 | ||
| Agricultural film × 1019 | 1.39 | 1.49 | 1.61 | 1.74 | 1.74 | 1.88 | 1.99 | 2.14 | 2.26 | 2.34 | 2.55 | 5.59 | 5.76 | 5.90 | 6.38 | 6.21 | ||
| Pesticides × 1020 | 1.54 | 1.53 | 1.58 | 1.63 | 1.58 | 1.62 | 1.68 | 1.78 | 1.88 | 1.91 | 1.94 | 2.00 | 2.06 | 2.05 | 2.08 | 2.08 | ||
| Fuel × 1014 | 2.30 | 2.31 | 2.43 | 2.47 | 2.46 | 2.52 | 2.61 | 2.70 | 2.80 | 2.88 | 3.02 | 3.13 | 3.23 | 3.26 | 3.29 | 3.36 | ||
| Agricultural electricity × 1022 | 2.44 | 2.50 | 2.68 | 2.81 | 2.88 | 3.13 | 3.42 | 3.75 | 4.45 | 4.72 | 5.12 | 5.35 | 5.60 | 5.76 | 6.07 | 6.23 | ||
| Renewable organic emergy | Agricultural labor × 1022 | 5.24 | 5.11 | 4.99 | 4.88 | 4.77 | 4.65 | 4.49 | 4.37 | 4.18 | 4.08 | 3.96 | 3.88 | 3.81 | 3.75 | 3.65 | 3.76 | |
| Seeds × 1021 | 5.77 | 6.19 | 6.45 | 6.34 | 5.88 | 6.85 | 7.41 | 8.19 | 8.28 | 8.35 | 8.58 | 8.79 | 8.97 | 9.78 | 9.94 | 9.99 | ||
| Emergy Yield | Organic emergy yield | Crop production × 1022 | 7.46 | 7.98 | 8.20 | 8.29 | 7.70 | 8.92 | 9.58 | 10.6 | 10.7 | 10.8 | 11.1 | 11.3 | 11.5 | 12.2 | 12.4 | 12.5 |
Table 4.
Changes in the municipal irrigation benefit allocation coefficient of Henan along the time series from 1999 to 2014.
Table 4.
Changes in the municipal irrigation benefit allocation coefficient of Henan along the time series from 1999 to 2014.
| Cities | 1999 | 2000 | 2001 | 2002 | 2003 | 2004 | 2005 | 2006 | 2007 | 2008 | 2009 | 2010 | 2011 | 2012 | 2013 | 2014 |
|---|---|---|---|---|---|---|---|---|---|---|---|---|---|---|---|---|
| Anyang | 0.26 | 0.26 | 0.26 | 0.26 | 0.25 | 0.25 | 0.24 | 0.24 | 0.22 | 0.22 | 0.22 | 0.22 | 0.22 | 0.22 | 0.21 | 0.21 |
| Hebi | 0.28 | 0.27 | 0.28 | 0.26 | 0.26 | 0.27 | 0.26 | 0.27 | 0.27 | 0.28 | 0.28 | 0.28 | 0.27 | 0.27 | 0.29 | 0.29 |
| Jiyuan | 0.23 | 0.23 | 0.22 | 0.22 | 0.21 | 0.21 | 0.21 | 0.21 | 0.21 | 0.22 | 0.21 | 0.21 | 0.22 | 0.21 | 0.24 | 0.23 |
| Jiaozuo | 0.25 | 0.25 | 0.25 | 0.24 | 0.24 | 0.24 | 0.24 | 0.24 | 0.24 | 0.24 | 0.23 | 0.23 | 0.22 | 0.23 | 0.24 | 0.24 |
| Kaifeng | 0.28 | 0.28 | 0.28 | 0.27 | 0.27 | 0.27 | 0.26 | 0.26 | 0.26 | 0.26 | 0.25 | 0.25 | 0.25 | 0.25 | 0.25 | 0.25 |
| Luoyang | 0.19 | 0.19 | 0.19 | 0.18 | 0.17 | 0.17 | 0.17 | 0.17 | 0.17 | 0.17 | 0.17 | 0.17 | 0.17 | 0.17 | 0.17 | 0.17 |
| Luohe | 0.27 | 0.28 | 0.27 | 0.27 | 0.27 | 0.21 | 0.21 | 0.20 | 0.20 | 0.27 | 0.27 | 0.26 | 0.26 | 0.25 | 0.24 | 0.23 |
| Nanyang | 0.22 | 0.22 | 0.22 | 0.20 | 0.20 | 0.20 | 0.20 | 0.20 | 0.20 | 0.20 | 0.20 | 0.20 | 0.20 | 0.20 | 0.20 | 0.20 |
| Pingdingshan | 0.24 | 0.23 | 0.24 | 0.23 | 0.23 | 0.23 | 0.23 | 0.23 | 0.23 | 0.23 | 0.23 | 0.23 | 0.23 | 0.22 | 0.21 | 0.22 |
| Puyang | 0.28 | 0.28 | 0.28 | 0.27 | 0.27 | 0.27 | 0.26 | 0.26 | 0.26 | 0.25 | 0.25 | 0.25 | 0.25 | 0.25 | 0.25 | 0.25 |
| Sanmenxia | 0.19 | 0.19 | 0.19 | 0.19 | 0.19 | 0.19 | 0.19 | 0.19 | 0.19 | 0.19 | 0.19 | 0.19 | 0.19 | 0.19 | 0.18 | 0.18 |
| Shangqiu | 0.30 | 0.30 | 0.29 | 0.27 | 0.27 | 0.27 | 0.26 | 0.26 | 0.26 | 0.28 | 0.27 | 0.27 | 0.26 | 0.26 | 0.25 | 0.25 |
| Xinxiang | 0.27 | 0.26 | 0.27 | 0.26 | 0.26 | 0.25 | 0.24 | 0.23 | 0.20 | 0.21 | 0.19 | 0.19 | 0.19 | 0.19 | 0.19 | 0.19 |
| Xinyang | 0.30 | 0.30 | 0.31 | 0.28 | 0.28 | 0.28 | 0.28 | 0.28 | 0.27 | 0.24 | 0.24 | 0.24 | 0.23 | 0.23 | 0.23 | 0.23 |
| Xuchang | 0.26 | 0.26 | 0.26 | 0.25 | 0.25 | 0.26 | 0.25 | 0.26 | 0.26 | 0.25 | 0.25 | 0.25 | 0.24 | 0.31 | 0.25 | 0.24 |
| Zhengzhou | 0.19 | 0.19 | 0.18 | 0.17 | 0.17 | 0.16 | 0.16 | 0.17 | 0.16 | 0.18 | 0.17 | 0.18 | 0.18 | 0.18 | 0.18 | 0.18 |
| Zhoukou | 0.26 | 0.26 | 0.26 | 0.26 | 0.26 | 0.26 | 0.25 | 0.25 | 0.25 | 0.25 | 0.25 | 0.25 | 0.25 | 0.24 | 0.22 | 0.23 |
| Zhumadian | 0.23 | 0.23 | 0.23 | 0.23 | 0.22 | 0.23 | 0.23 | 0.24 | 0.24 | 0.22 | 0.22 | 0.22 | 0.22 | 0.22 | 0.21 | 0.22 |
Table 5.
Correlation matrix of the emergy investment indexes in the Henan agricultural production system.
Table 5.
Correlation matrix of the emergy investment indexes in the Henan agricultural production system.
| Type | IBAC | RE | PE | AFE | CFE | AME | LE | IWE |
|---|---|---|---|---|---|---|---|---|
| IBAC | 1.00 | −0.26 | −0.89 | −0.74 | −0.92 | −0.77 | 0.94 | −0.47 |
| RE | −0.26 | 1.00 | 0.03 | 0.05 | 0.12 | 0.04 | −0.12 | −0.09 |
| PE | −0.89 | 0.03 | 1.00 | 0.88 | 0.99 | 0.94 | −0.98 | 0.79 |
| AFE | −0.74 | 0.05 | 0.88 | 1.00 | 0.90 | 0.91 | −0.84 | 0.81 |
| CFE | −0.92 | 0.11 | 0.99 | 0.90 | 1.00 | 0.95 | −0.99 | 0.77 |
| AME | −0.77 | 0.04 | 0.94 | 0.91 | 0.95 | 1.00 | −0.91 | 0.91 |
| LE | 0.94 | −0.12 | −0.98 | −0.84 | −0.99 | −0.91 | 1.00 | −0.71 |
| IWE | −0.47 | −0.09 | 0.79 | 0.81 | 0.77 | 0.91 | −0.71 | 1.00 |
Note: IBAC (irrigation benefit allocation coefficient); RE (rainfall emergy); PE (pesticide emergy); AFE (agricultural film emergy); CFE (chemical fertilizer emergy); AME (agricultural machinery emergy); LE (labor emergy); IWE (irrigation water emergy).
© 2018 by the authors. Licensee MDPI, Basel, Switzerland. This article is an open access article distributed under the terms and conditions of the Creative Commons Attribution (CC BY) license (http://creativecommons.org/licenses/by/4.0/).
Share and Cite
MDPI and ACS Style
Wang, K.; Zhang, P.; Pang, B. Process and Mechanism of Agricultural Irrigation Benefit Allocation Coefficient Based on Emergy Analysis—A Case Study of Henan, China. Sustainability 2018, 10, 4436. https://doi.org/10.3390/su10124436
AMA Style
Wang K, Zhang P, Pang B. Process and Mechanism of Agricultural Irrigation Benefit Allocation Coefficient Based on Emergy Analysis—A Case Study of Henan, China. Sustainability. 2018; 10(12):4436. https://doi.org/10.3390/su10124436
Chicago/Turabian StyleWang, Kaiyong, Pengyan Zhang, and Bo Pang. 2018. "Process and Mechanism of Agricultural Irrigation Benefit Allocation Coefficient Based on Emergy Analysis—A Case Study of Henan, China" Sustainability 10, no. 12: 4436. https://doi.org/10.3390/su10124436
Note that from the first issue of 2016, this journal uses article numbers instead of page numbers. See further details here.