Application of Biochar to the Remediation of Pb-Contaminated Solutions


Abstract
1. Introduction
2. Materials and Methods
2.1. Biochar
2.2. Analytical Methods
2.3. Chemical Solutions
2.4. Batch Tests
2.5. Column Tests
3. Results
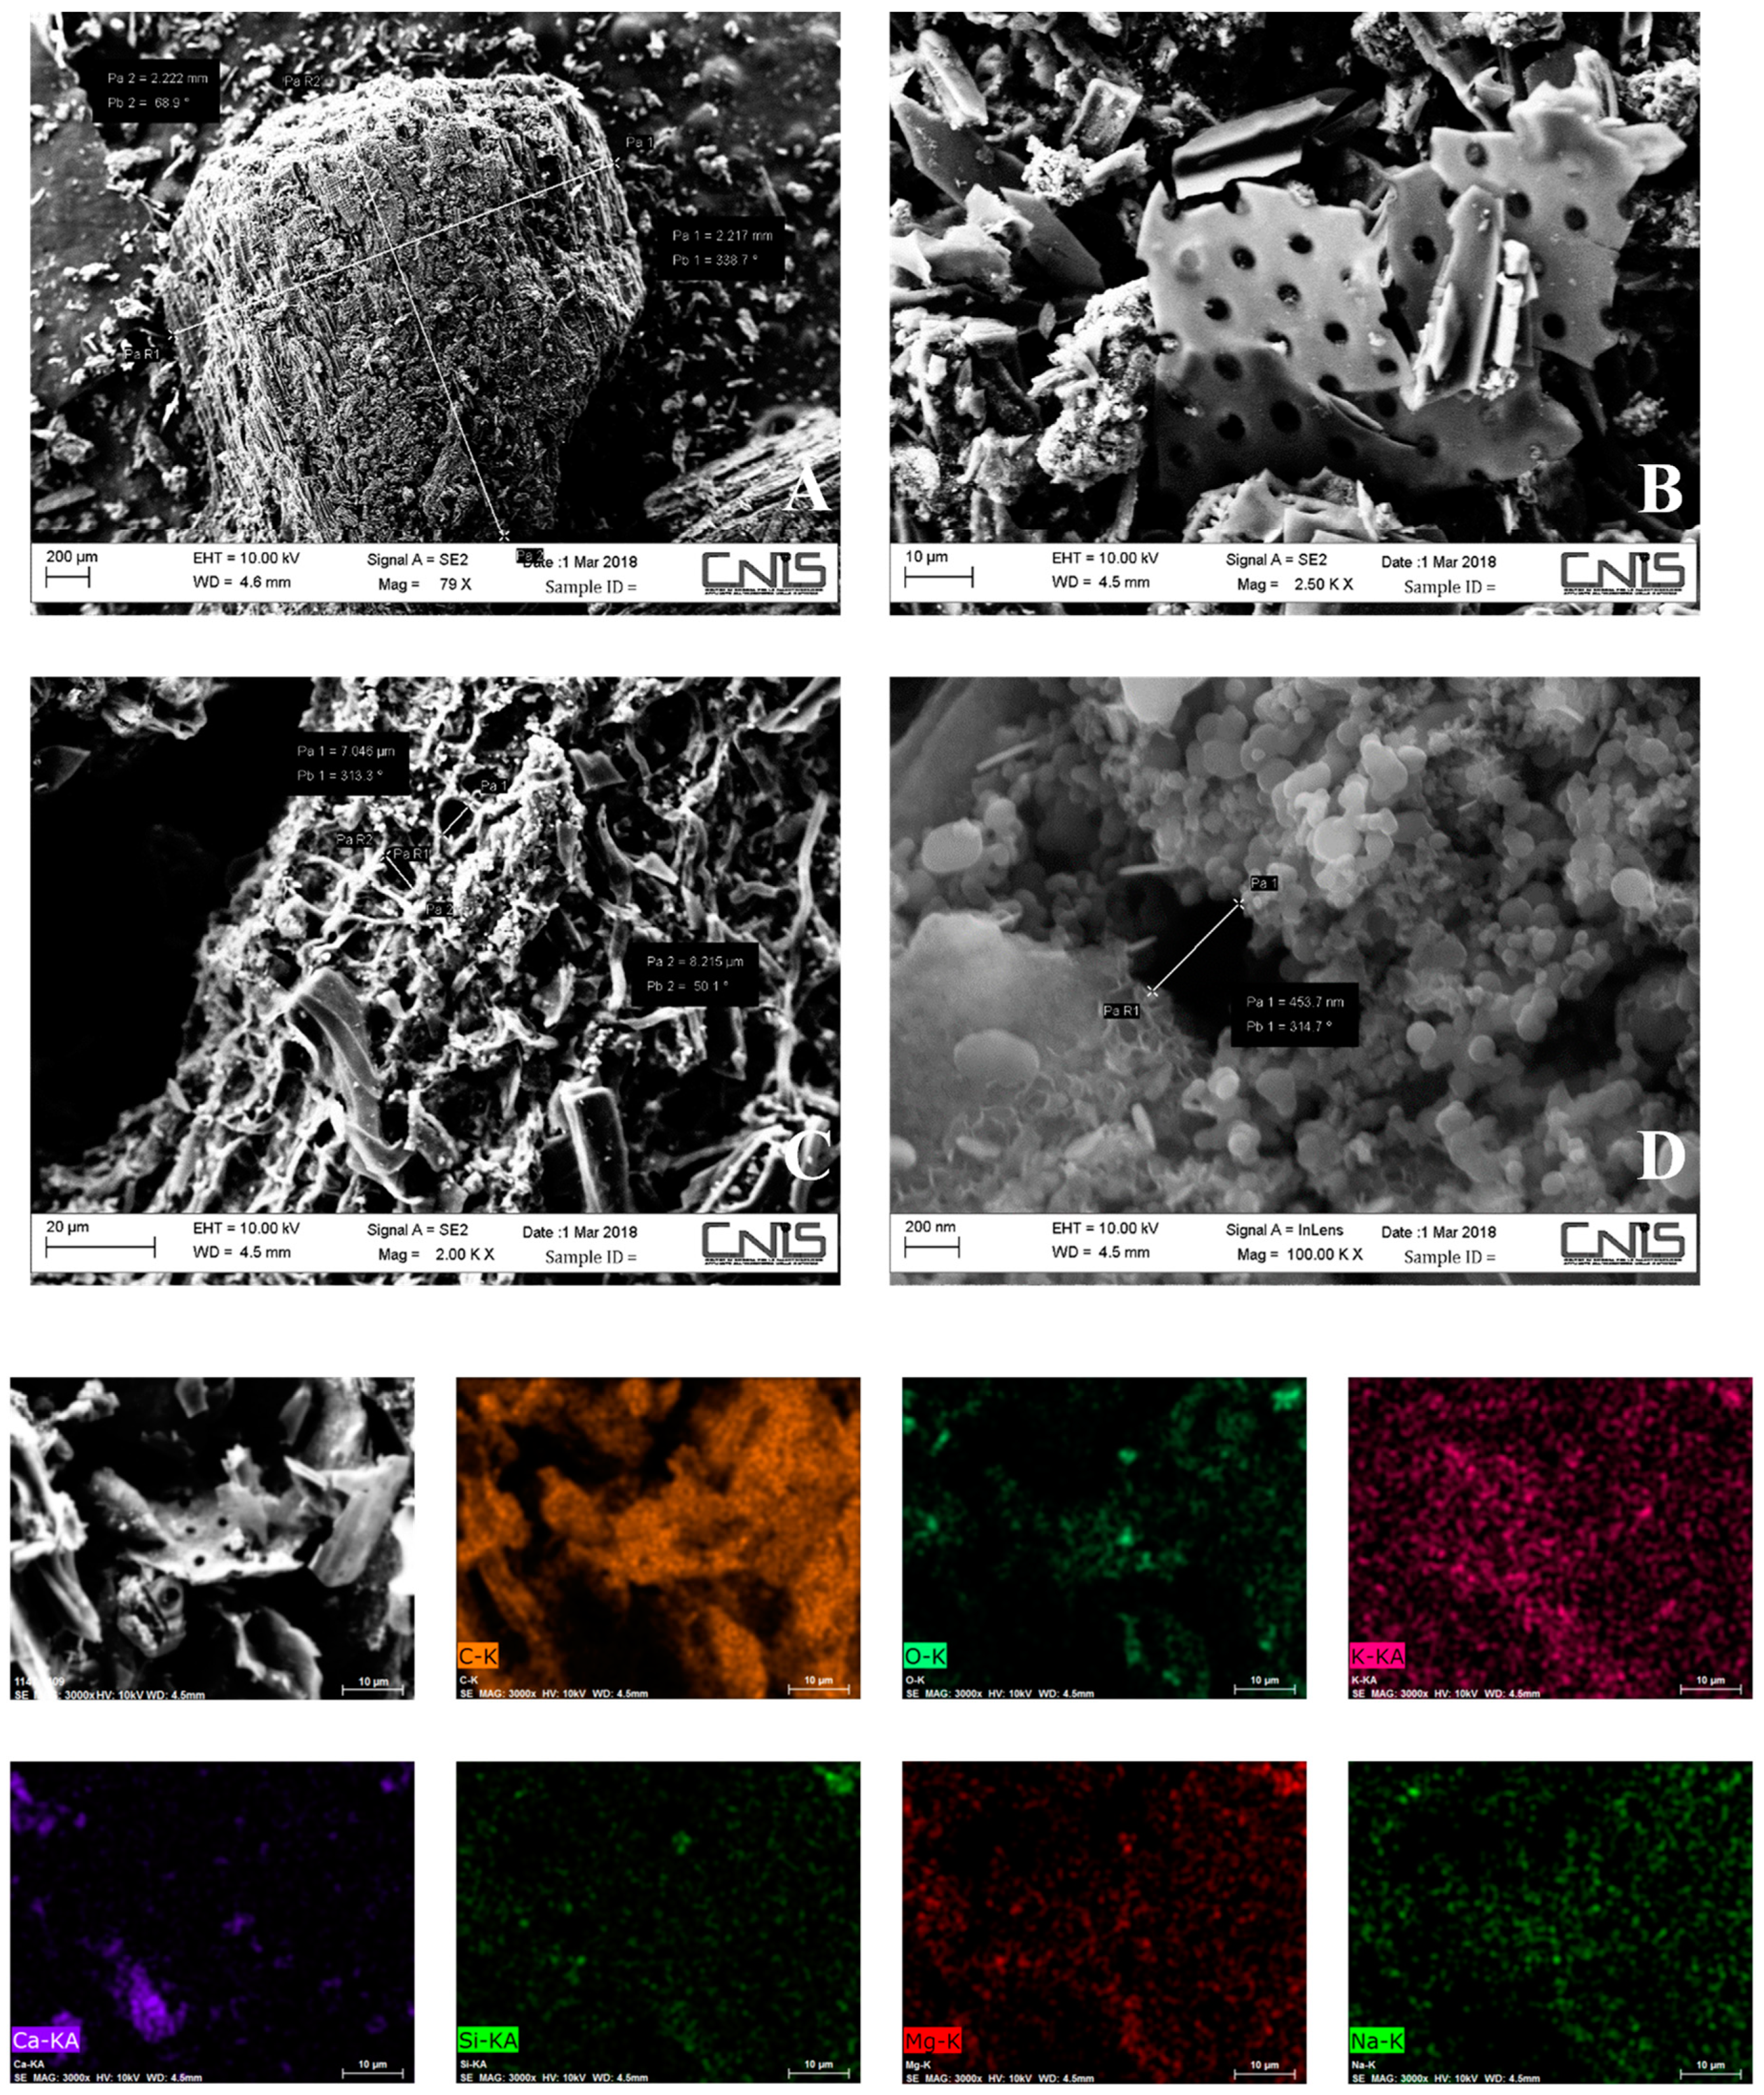
3.1. Biochar Characterization
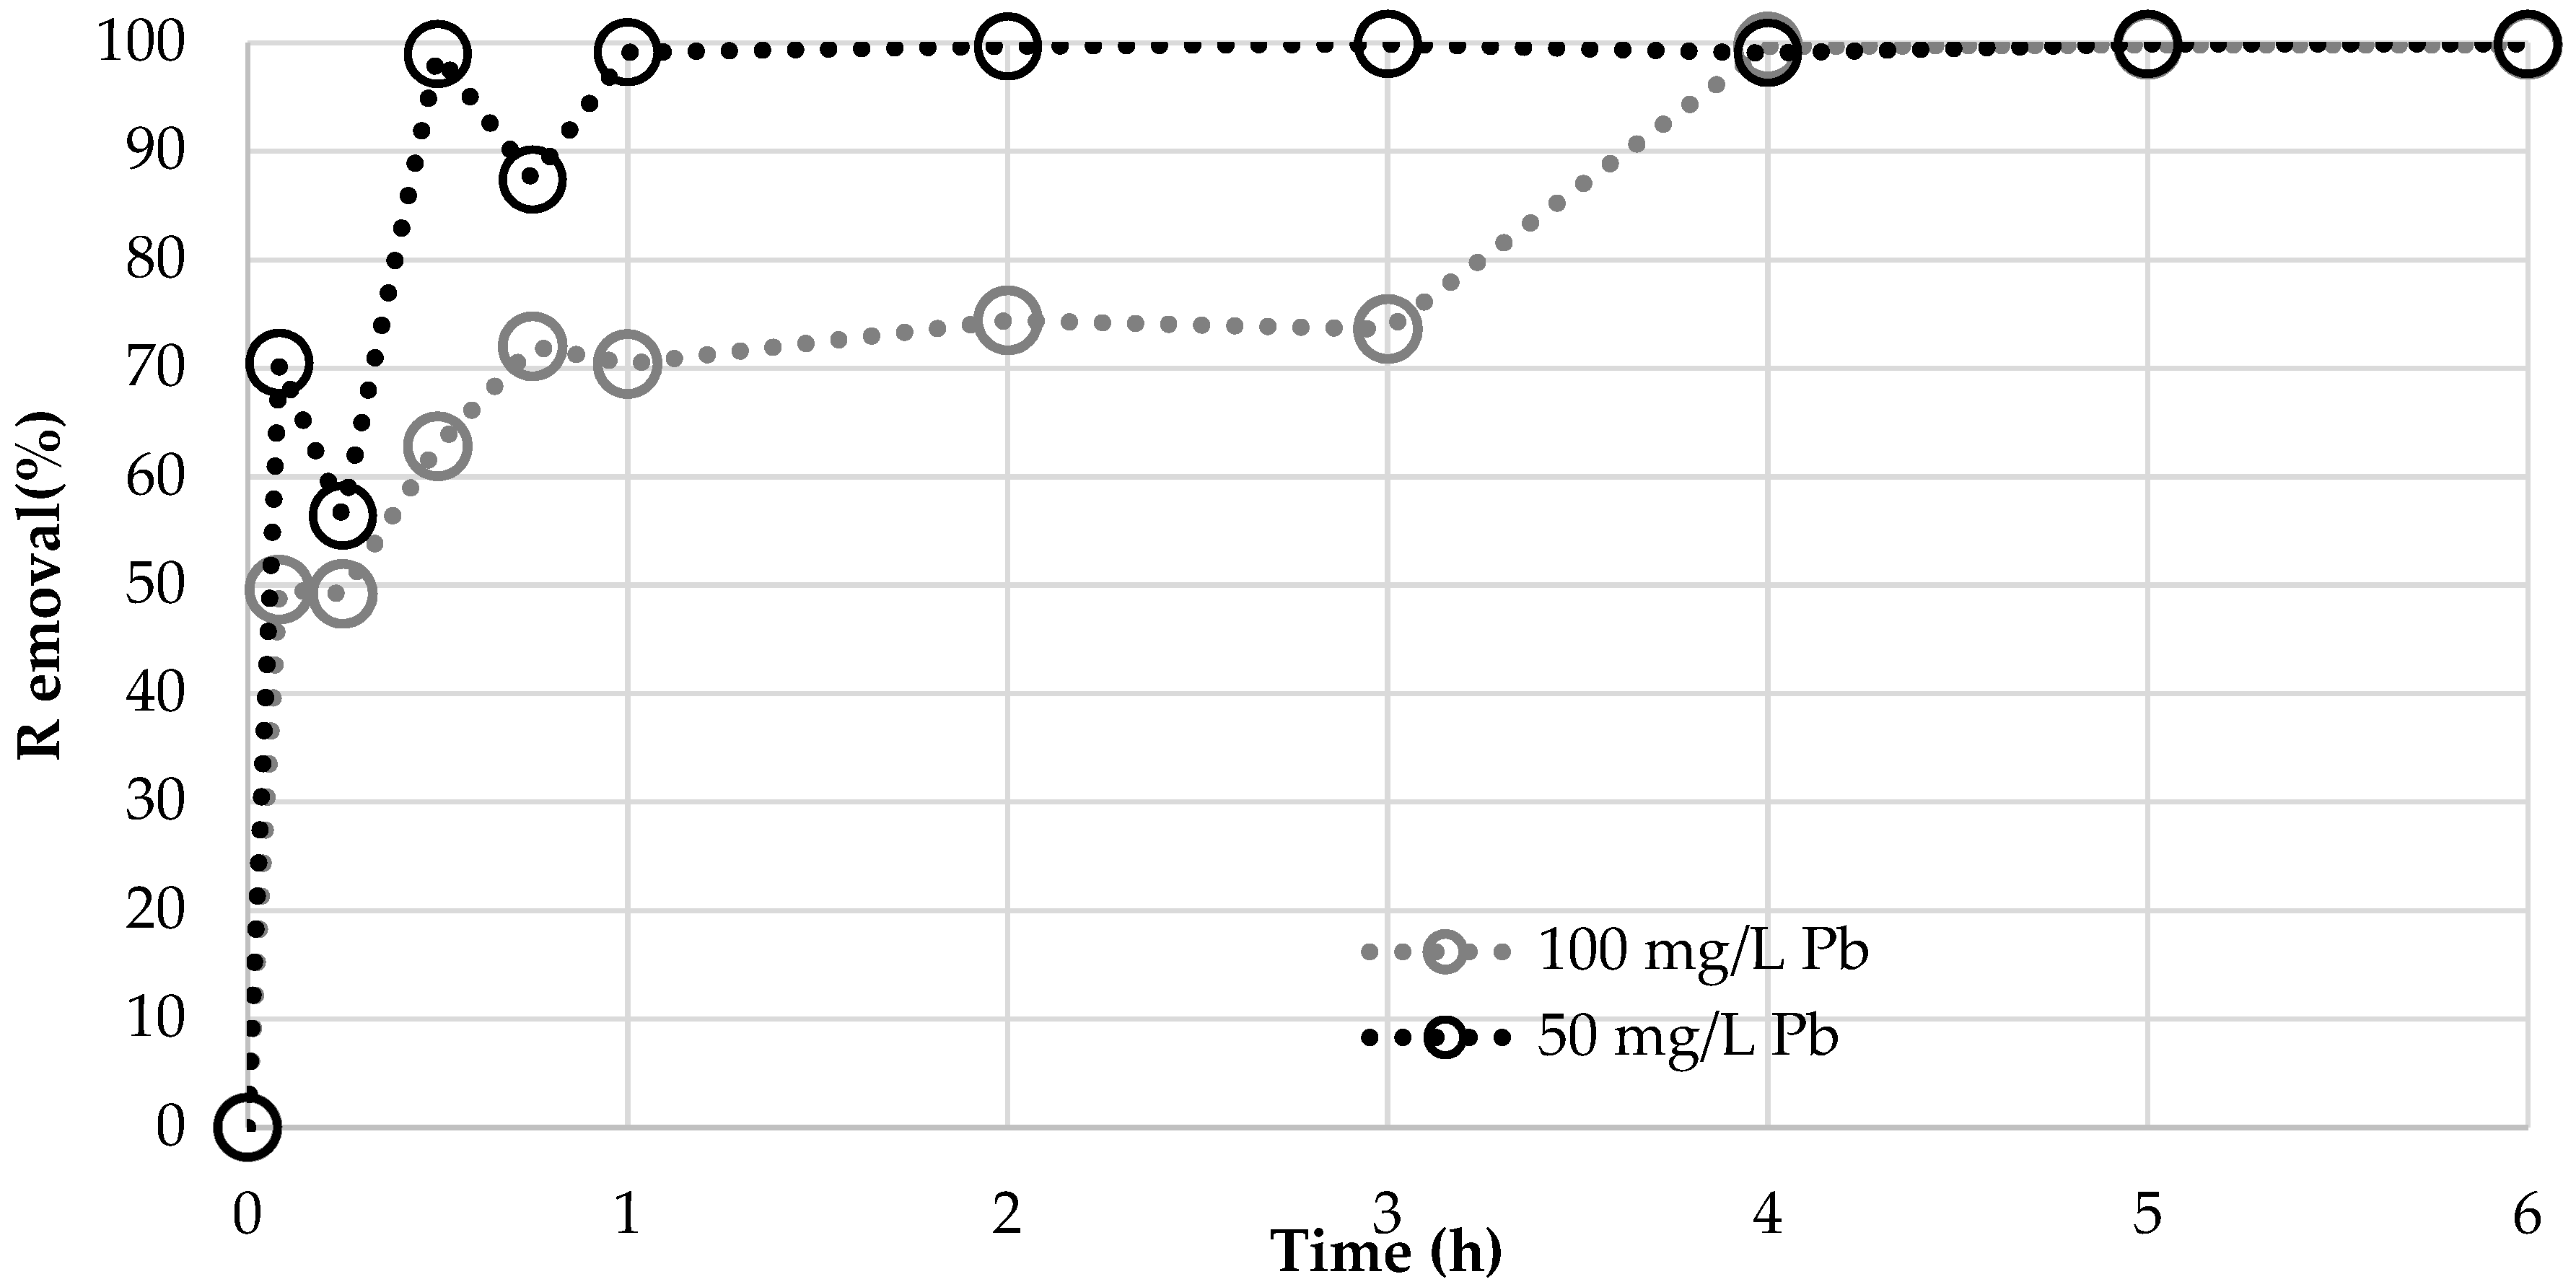
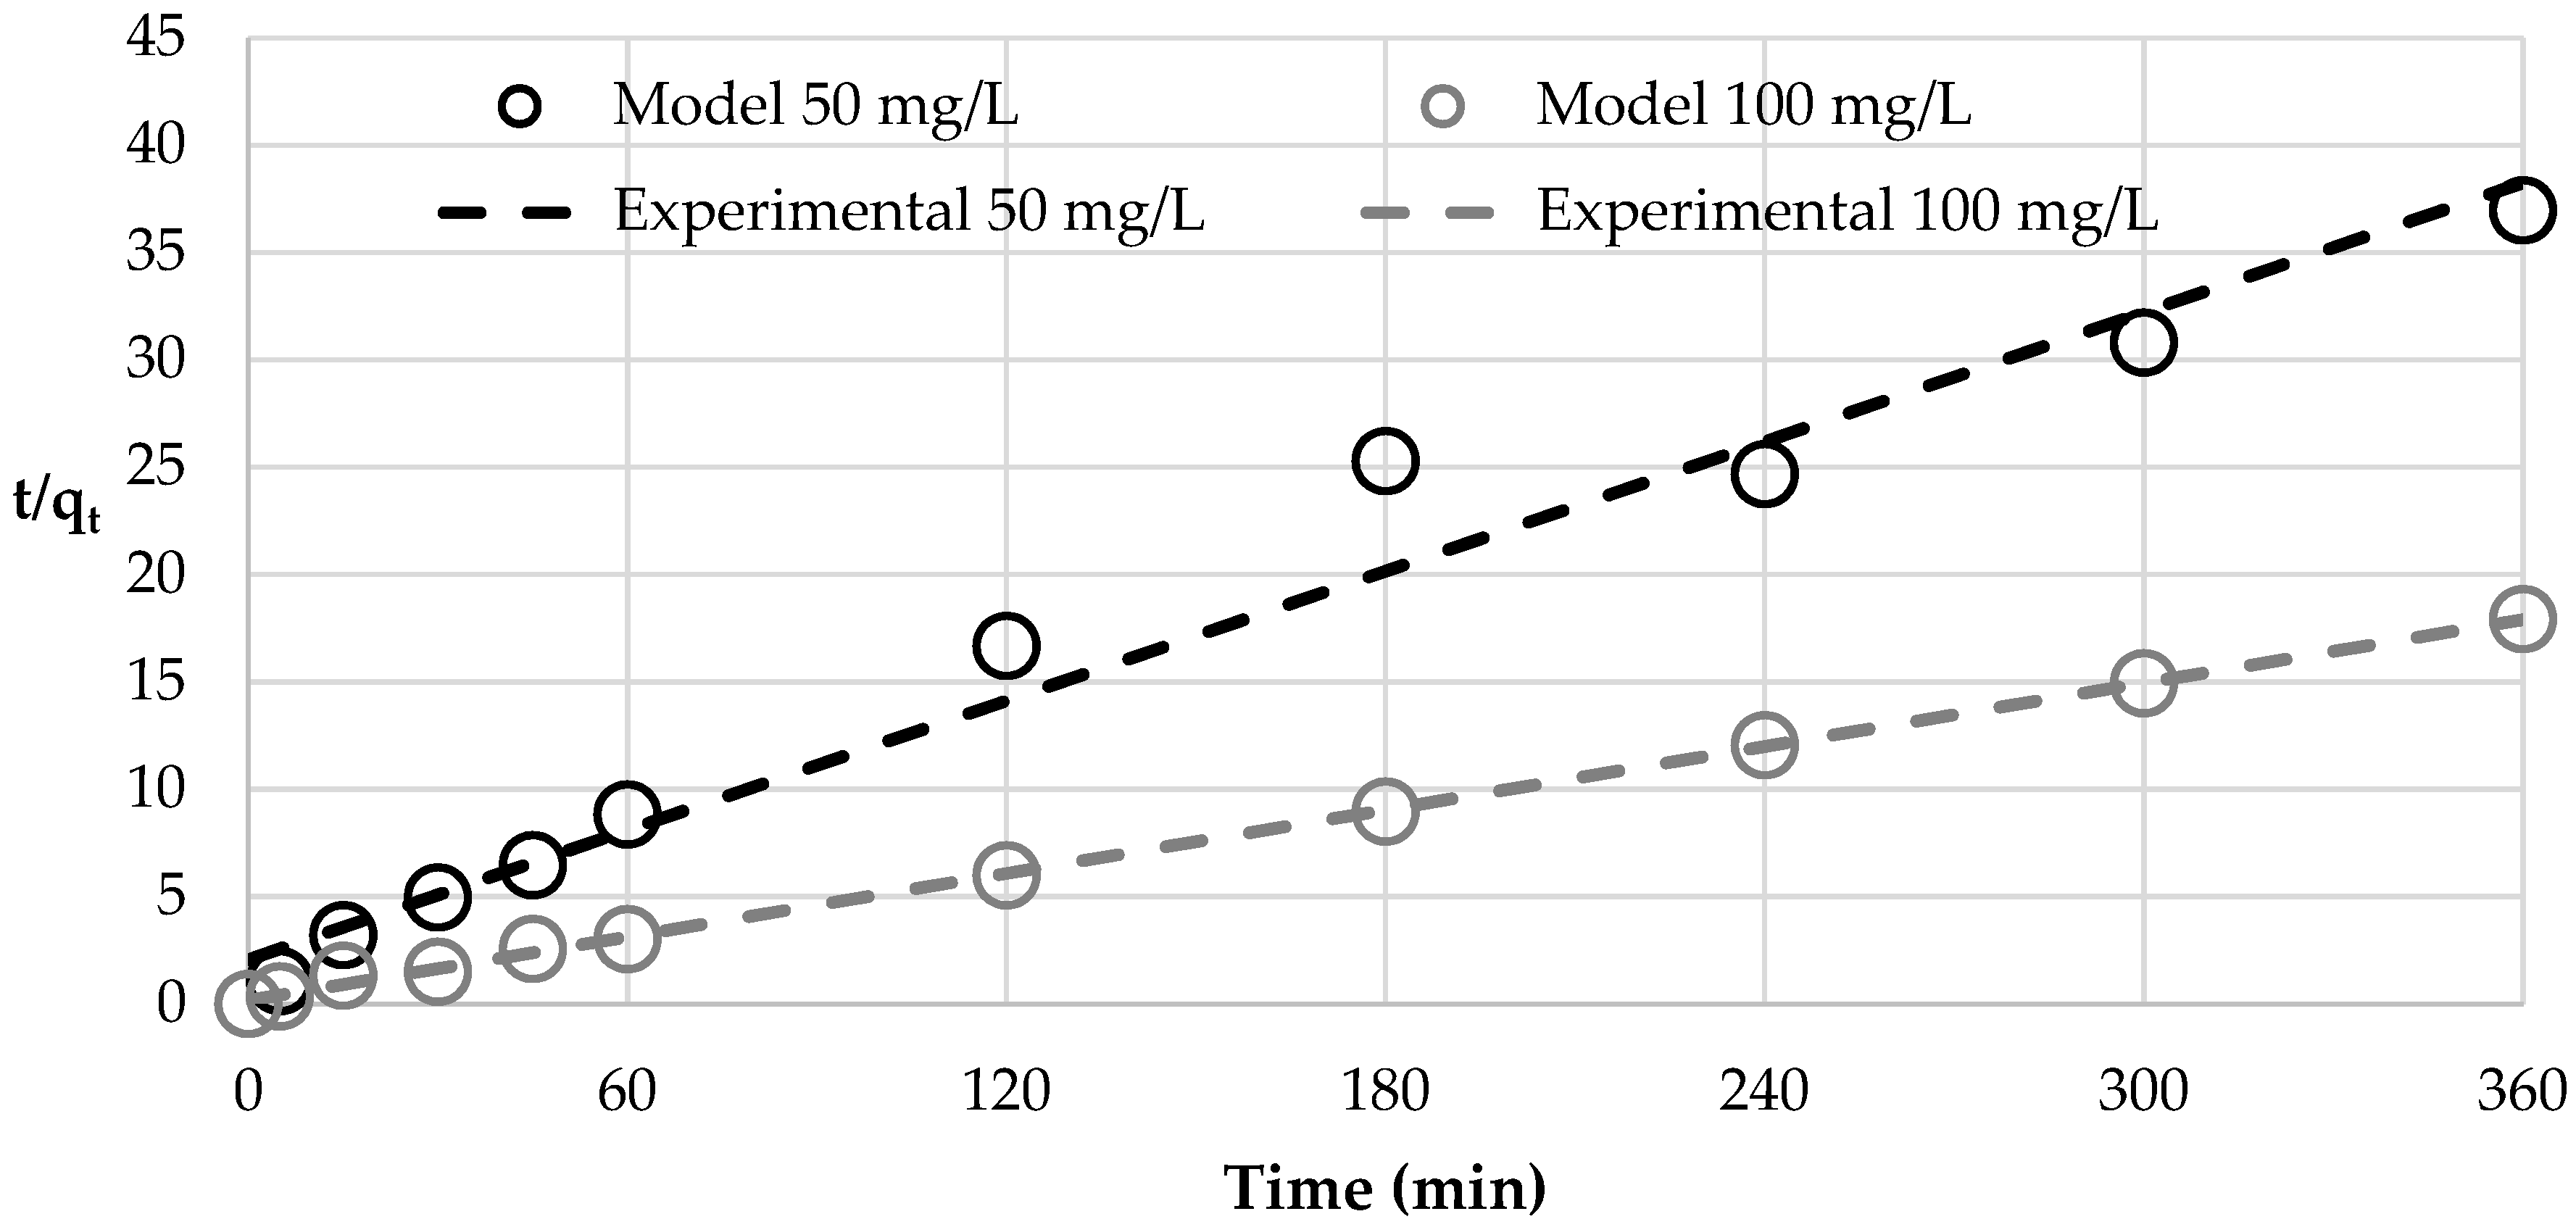
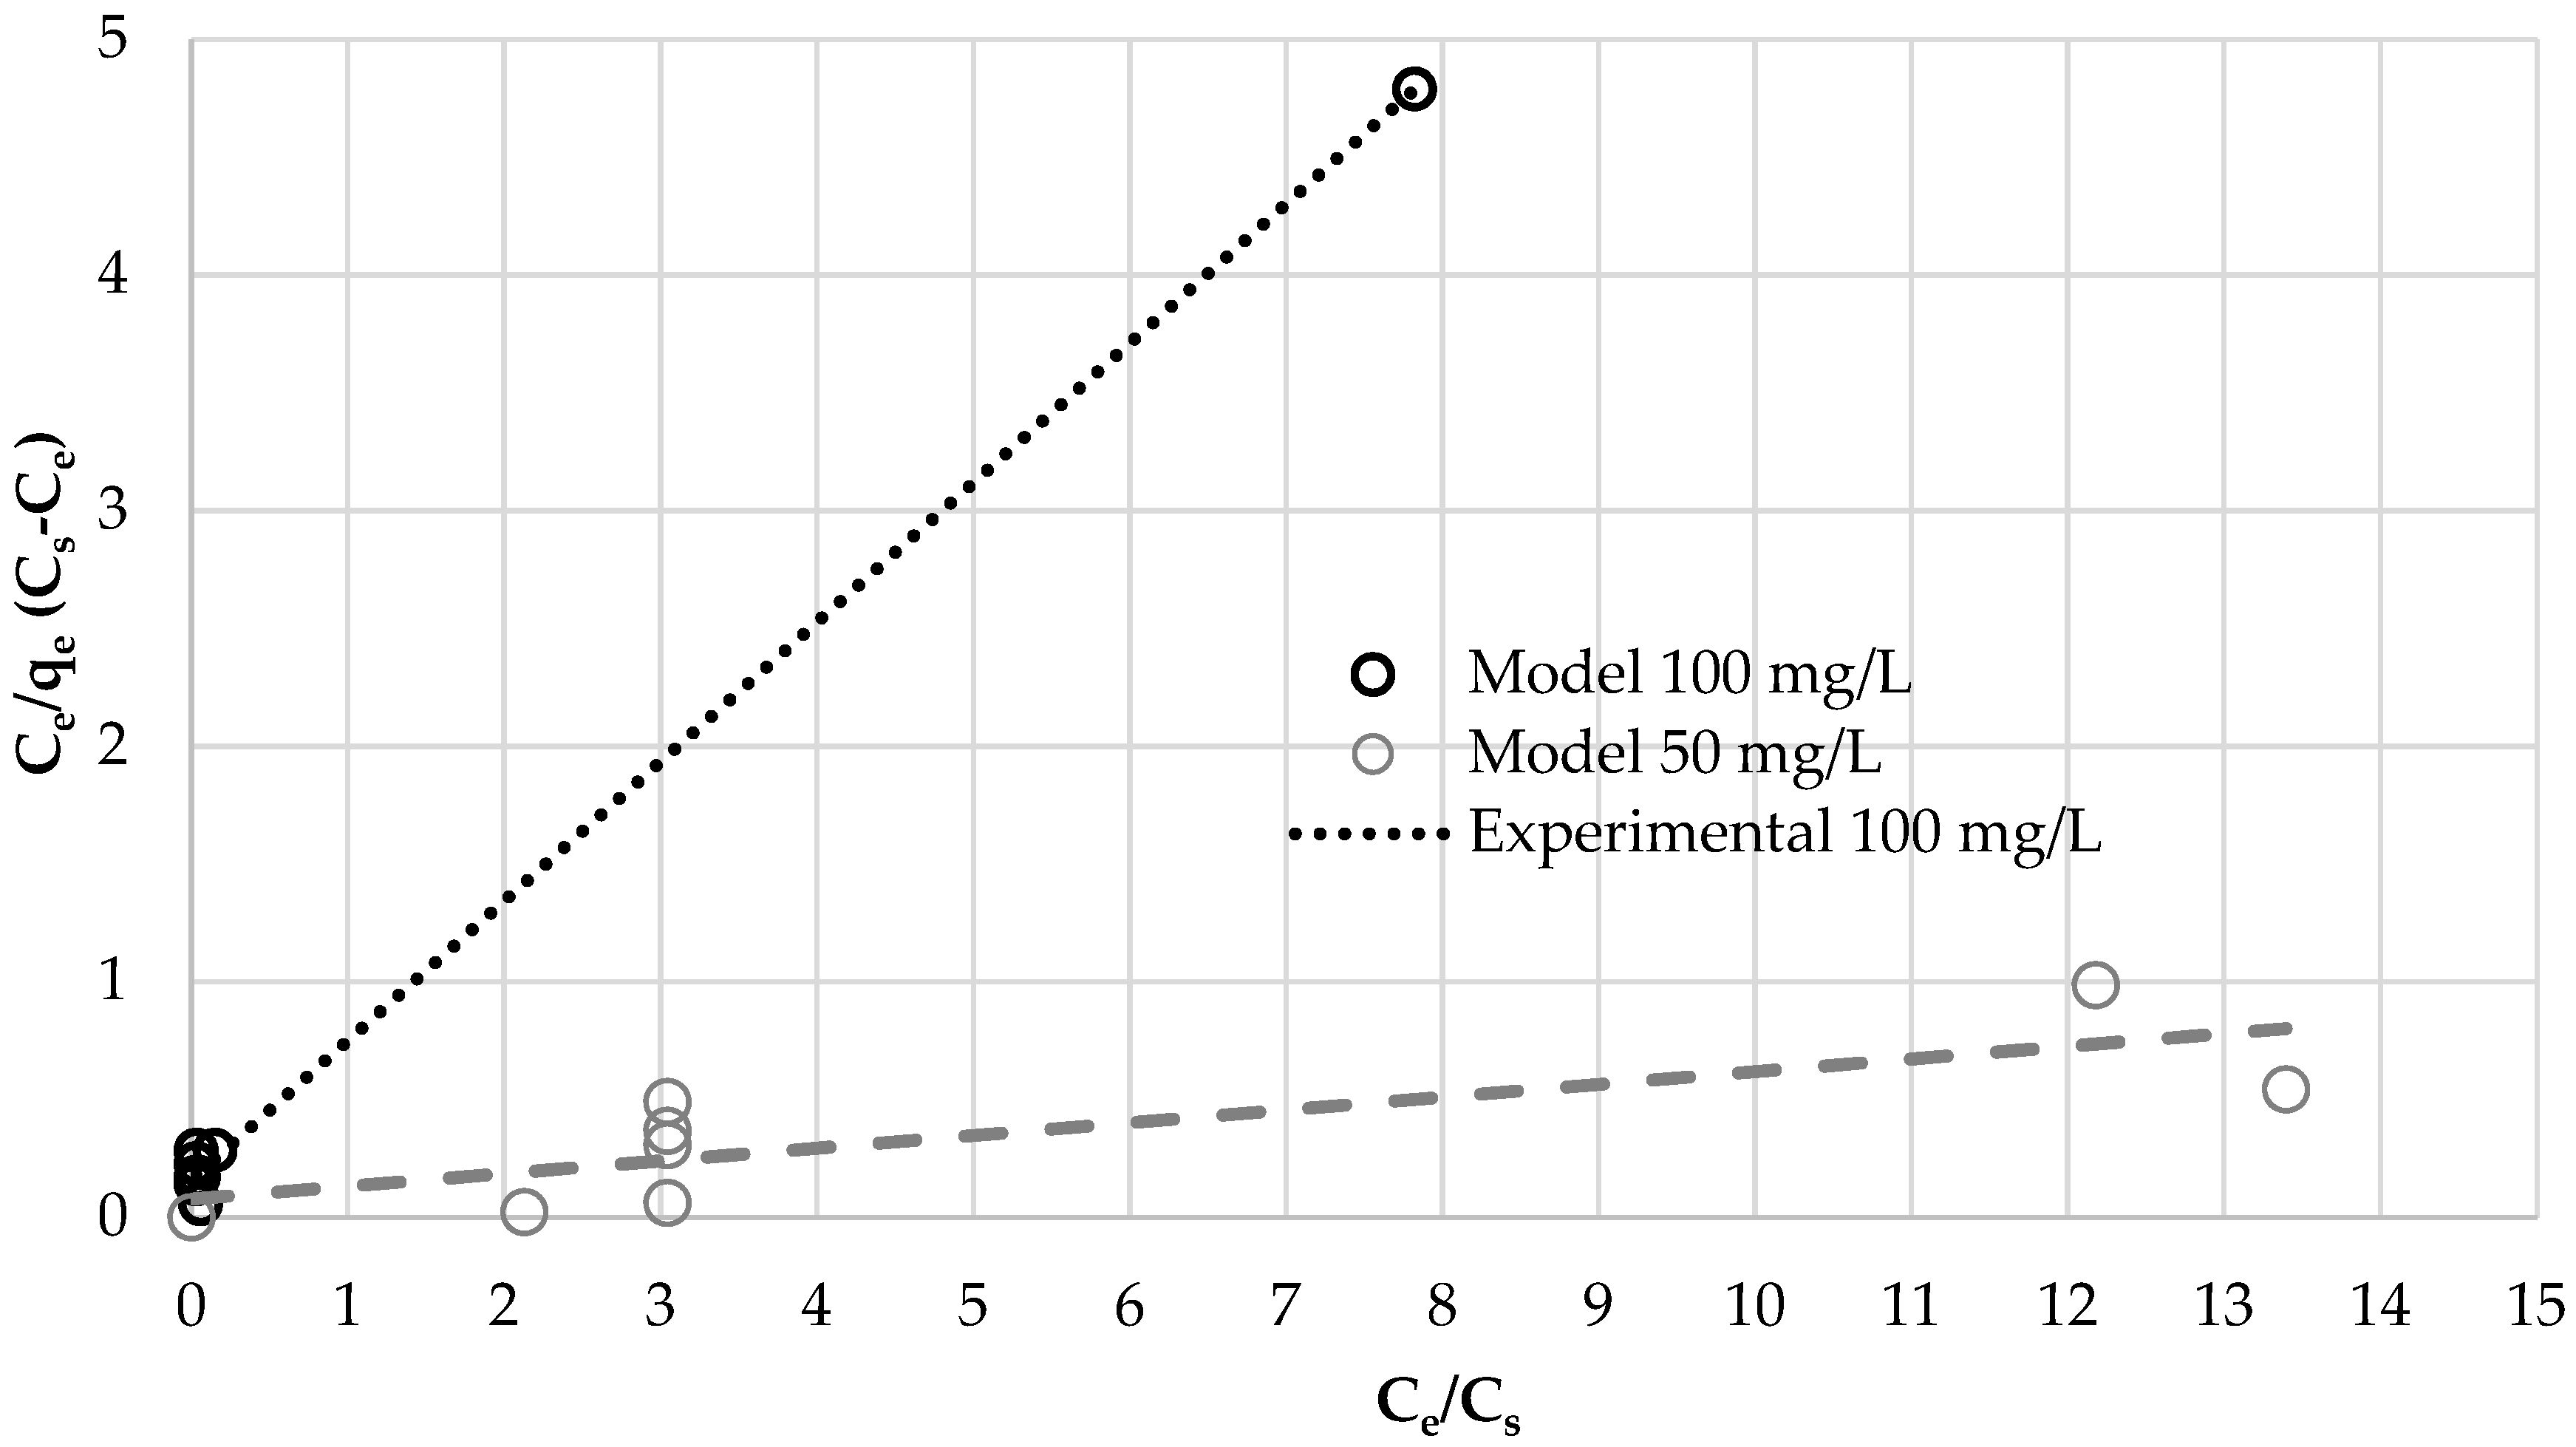
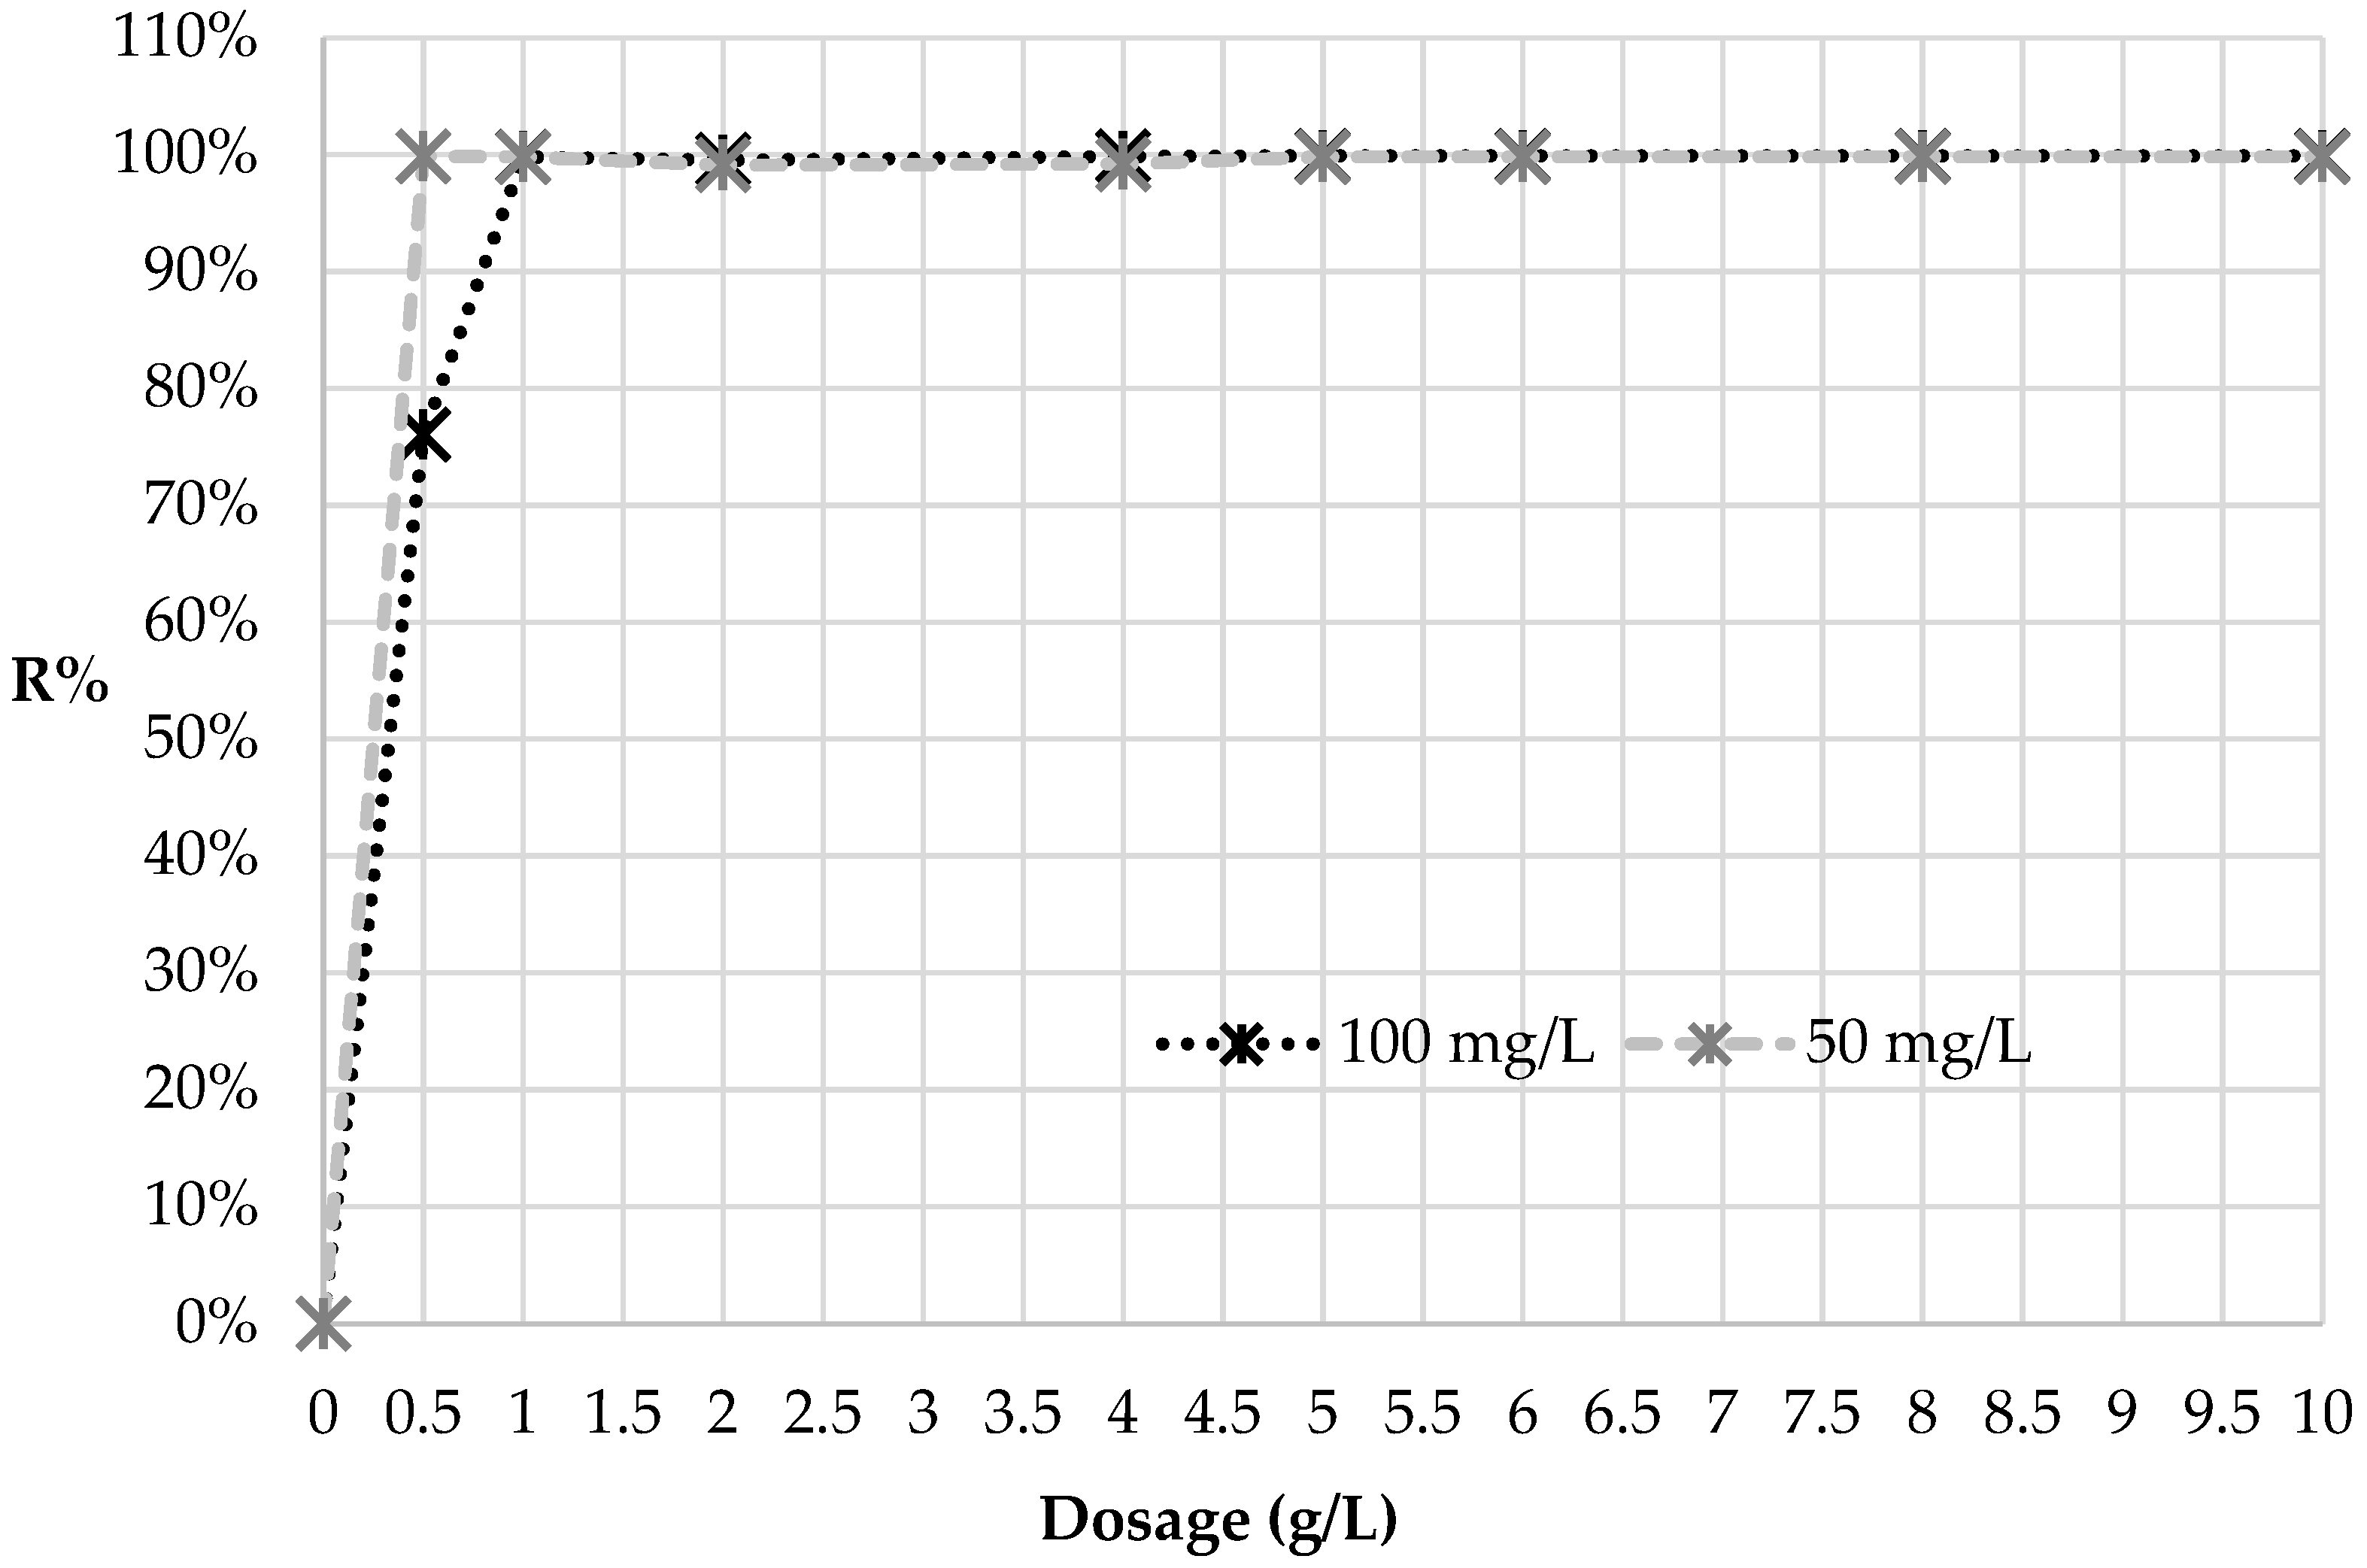
3.2. Batch Tests
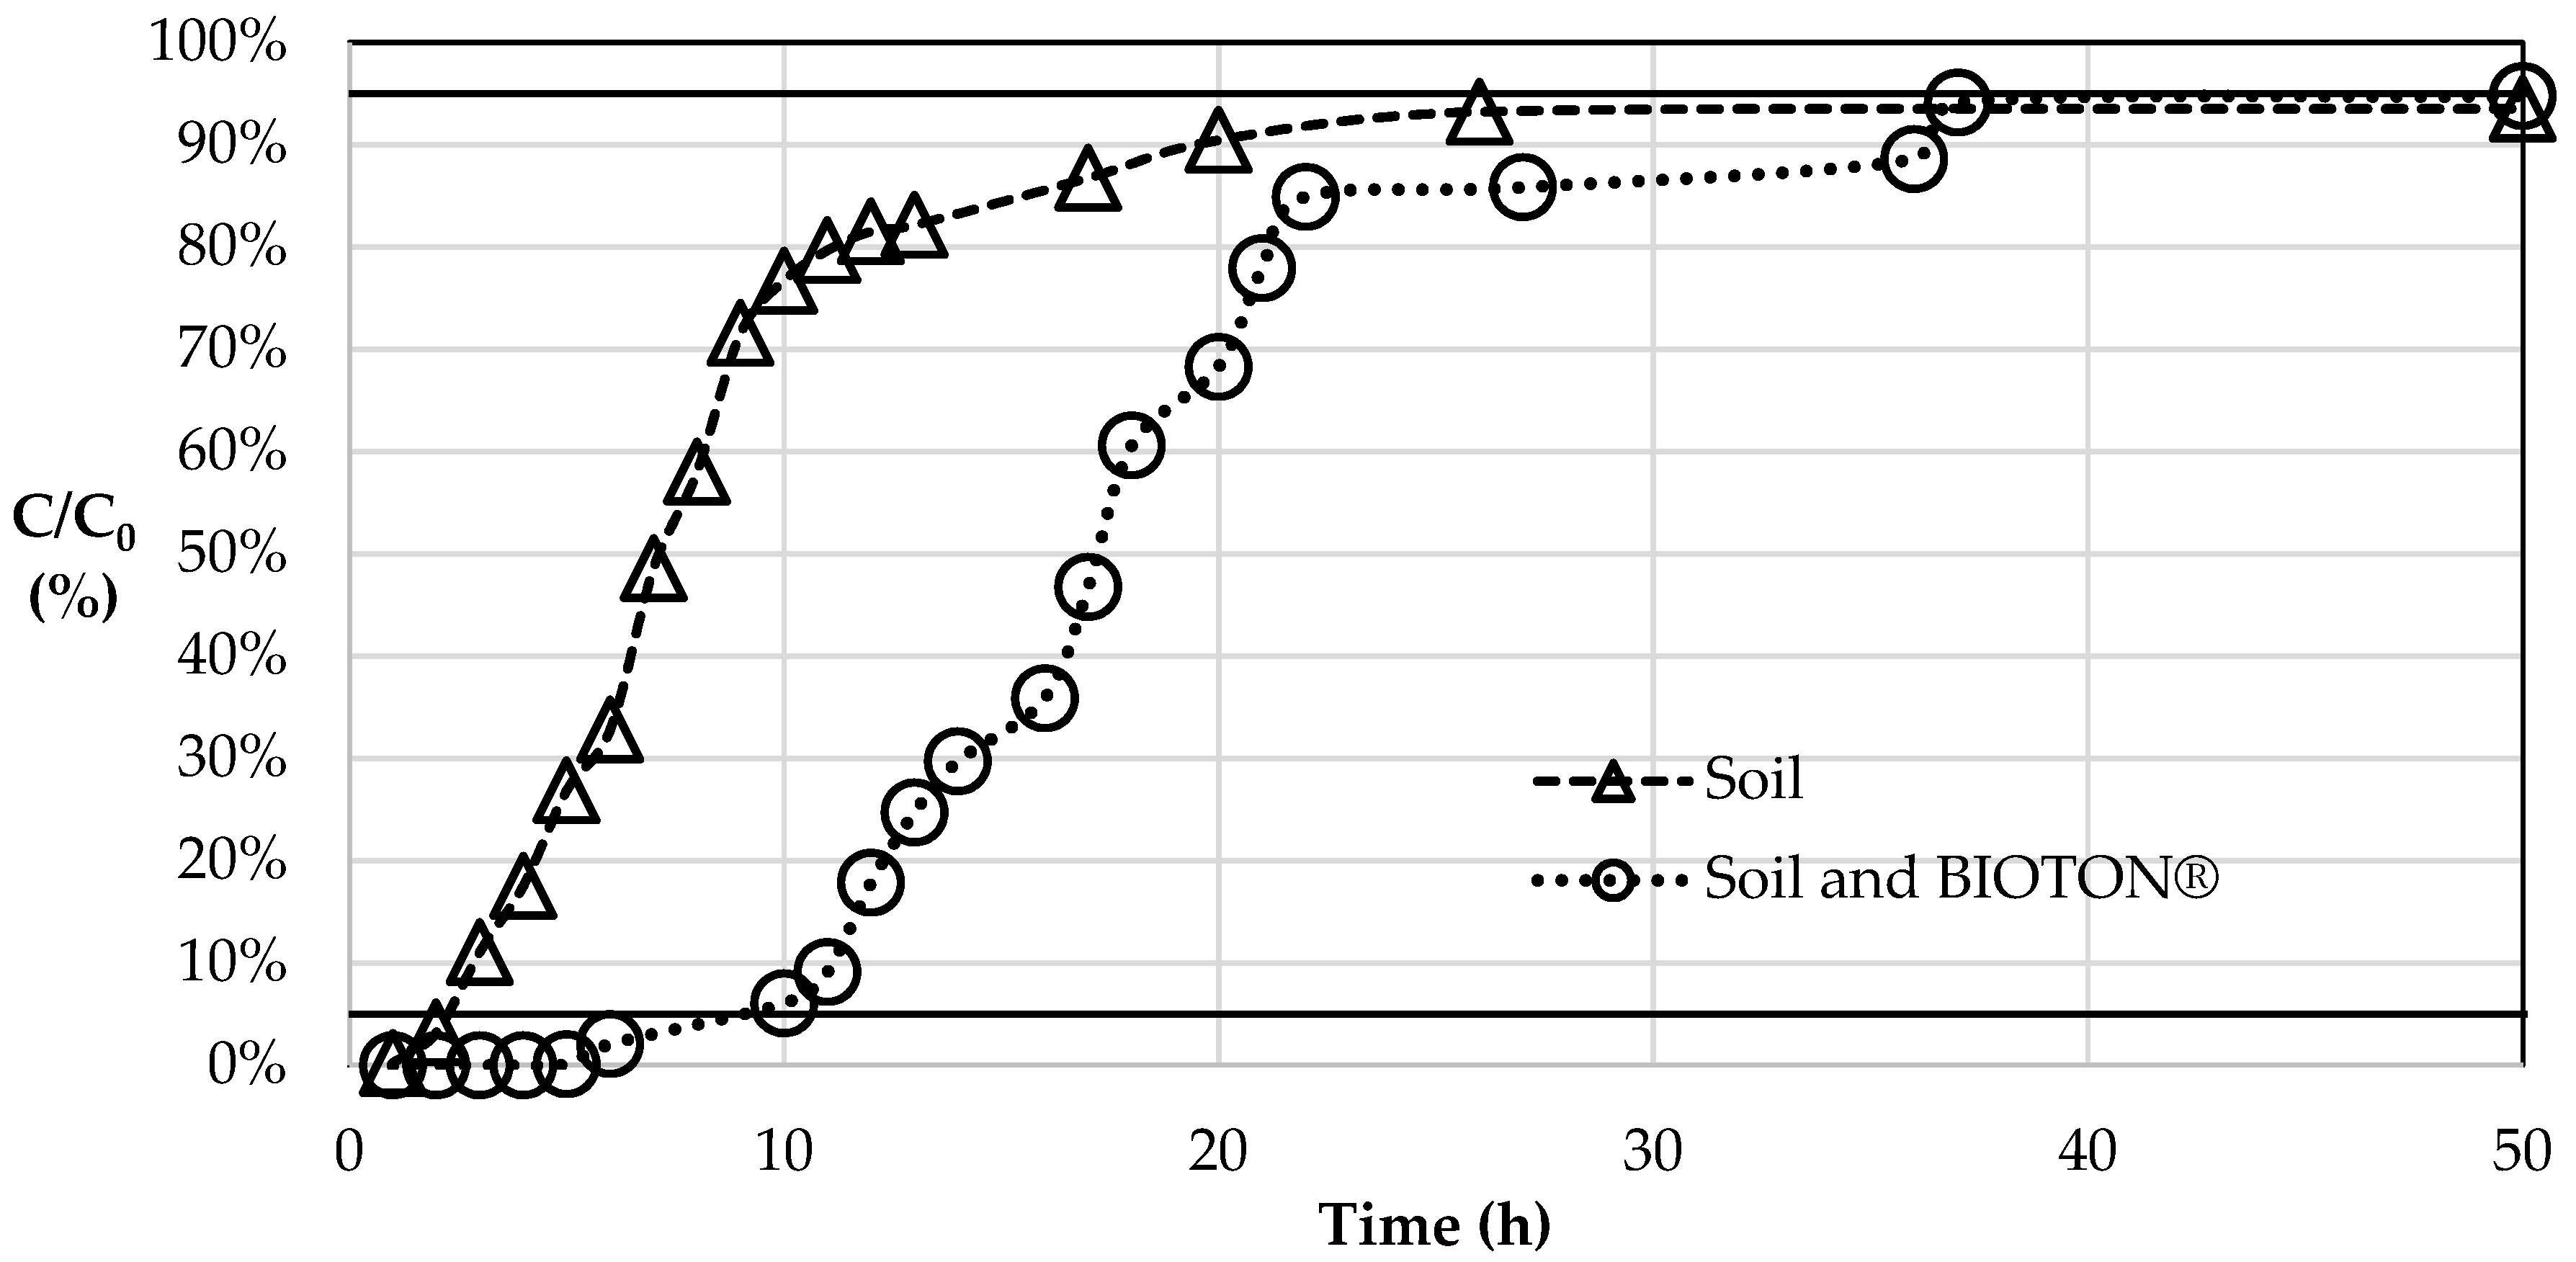
3.3. Column Tests
4. Discussion
5. Conclusions
Author Contributions
Funding
Acknowledgments
Conflicts of Interest
References
- Xie, T.; Reddy, K.R.; Wang, C.; Yargicoglu, E.; Spokas, K. Characteristics and applications of biochar for environmental remediation: A review. Crit. Rev. Environ. Sci. Technol. 2015, 45, 939–969. [Google Scholar] [CrossRef]
- Agegnehu, G.; Bass, A.M.; Nelson, P.N.; Bird, M.I. Benefits of biochar, compost and biochar-compost for soil quality, maize yield and greenhouse gas emissions in a tropical agricultural soil. Sci. Total Environ. 2016, 543, 295–306. [Google Scholar] [CrossRef] [PubMed]
- Qian, K.; Kumar, A.; Zhang, H.; Bellmer, D.; Huhnke, R. Recent advances in utilization of biochar. Renew. Sustain. Energy Rev. 2015, 42, 1055–1064. [Google Scholar] [CrossRef]
- Lehmann, J.; Joseph, S. Biochar for environmental management: An introduction. Biochar Environ. Manag. Sci. Technol. 2009, 1, 33–46. [Google Scholar] [CrossRef]
- Ahmad, M.; Rajapaksha, A.U.; Lim, J.E.; Zhang, M.; Bolan, N.; Mohan, D.; Vithanage, M.; Lee, S.S.; Ok, Y.S. Biochar as a sorbent for contaminant management in soil and water: A review. Chemosphere 2014, 99, 19–23. [Google Scholar] [CrossRef] [PubMed]
- Cha, J.S.; Park, S.H.; Jung, S.C.; Ryu, C.; Jeon, J.K.; Shin, M.C.; Park, Y.K. Production and utilization of biochar: A review. J. Ind. Eng. Chem. 2016, 40, 1–15. [Google Scholar] [CrossRef]
- Inyang, M.I.; Gao, B.; Yao, Y.; Xue, Y.; Zimmerman, A.; Mosa, A.; Pullammanappallil, P.; Ok, Y.S.; Cao, X. A review of biochar as a low-cost adsorbent for aqueous heavy metal removal. Crit. Rev. Environ. Sci. Technol. 2016, 46, 406–433. [Google Scholar] [CrossRef]
- Gwenzi, W.; Chaukura, N.; Noubactep, C.; Mukome, F.N.D. Biochar-based water treatment systems as a potential low-cost and sustainable technology for clean water provision. J. Environ. Manag. 2017, 197, 732–749. [Google Scholar] [CrossRef] [PubMed]
- Rosales, E.; Meijide, J.; Pazos, M.; Sanromán, M.A. Challenges and recent advances in biochar as low-cost biosorbent: From batch assays to continuous-flow systems. Bioresour. Technol. 2017, 246, 176–192. [Google Scholar] [CrossRef] [PubMed]
- De Gisi, S.; Lofrano, G.; Grassi, M.; Notarnicola, M. Characteristics and adsorption capacities of low-cost sorbents for wastewater treatment: A review. Sustain. Mater. Technol. 2016, 9, 10–40. [Google Scholar] [CrossRef]
- Agegnehu, G.; Srivastava, A.K.; Bird, M.I. The role of biochar and biochar-compost in improving soil quality and crop performance: A review. Appl. Soil Ecol. 2017, 119, 156–170. [Google Scholar] [CrossRef]
- Jien, S.H.; Chen, W.C.; Ok, Y.S.; Awad, Y.M.; Liao, C. Sen Short-term biochar application induced variations in C and N mineralization in a compost-amended tropical soil. Environ. Sci. Pollut. Res. 2018, 25, 25715–25725. [Google Scholar] [CrossRef] [PubMed]
- Luo, S.; Wang, S.; Tian, L.; Li, S.; Li, X.; Shen, Y.; Tian, C. Long-term biochar application influences soil microbial community and its potential roles in semiarid farmland. Appl. Soil Ecol. 2017, 117–118, 10–15. [Google Scholar] [CrossRef]
- Suliman, W.; Harsh, J.B.; Abu-Lail, N.I.; Fortuna, A.M.; Dallmeyer, I.; Garcia-Pérez, M.; Garcia-Perez, M. The role of biochar porosity and surface functionality in augmenting hydrologic properties of a sandy soil. Sci. Total Environ. 2017, 574, 139–147. [Google Scholar] [CrossRef] [PubMed]
- Hagemann, N.; Joseph, S.; Schmidt, H.P.; Kammann, C.I.; Harter, J.; Borch, T.; Young, R.B.; Varga, K.; Taherymoosavi, S.; Elliott, K.W.; et al. Organic coating on biochar explains its nutrient retention and stimulation of soil fertility. Nat. Commun. 2017, 8, 1089. [Google Scholar] [CrossRef] [PubMed]
- Burrell, L.D.; Zehetner, F.; Rampazzo, N.; Wimmer, B.; Soja, G. Long-term effects of biochar on soil physical properties. Geoderma 2016, 282, 96–102. [Google Scholar] [CrossRef]
- Blanco-Canqui, H. Biochar and Soil Physical Properties. Soil Sci. Soc. Am. J. 2017, 84, 687–711. [Google Scholar] [CrossRef]
- Zong, Y.; Wang, Y.; Sheng, Y.; Wu, C.; Lu, S. Ameliorating soil acidity and physical properties of two contrasting texture Ultisols with wastewater sludge biochar. Environ. Sci. Pollut. Res. 2018, 25, 25726–25733. [Google Scholar] [CrossRef] [PubMed]
- Lomaglio, T.; Hattab-Hambli, N.; Miard, F.; Lebrun, M.; Nandillon, R.; Trupiano, D.; Scippa, G.S.; Gauthier, A.; Motelica-Heino, M.; Bourgerie, S.; et al. Cd, Pb, and Zn mobility and (bio)availability in contaminated soils from a former smelting site amended with biochar. Environ. Sci. Pollut. Res. 2018, 25, 25744–25756. [Google Scholar] [CrossRef] [PubMed]
- Haider, G.; Steffens, D.; Moser, G.; Müller, C.; Kammann, C.I. Biochar reduced nitrate leaching and improved soil moisture content without yield improvements in a four-year field study. Agric. Ecosyst. Environ. 2017, 237, 80–94. [Google Scholar] [CrossRef]
- Yin, D.; Wang, X.; Chen, C.; Peng, B.; Tan, C.; Li, H. Varying effect of biochar on Cd, Pb and As mobility in a multi-metal contaminated paddy soil. Chemosphere 2016, 152, 196–206. [Google Scholar] [CrossRef] [PubMed]
- Puga, A.P.; Abreu, C.A.; Melo, L.C.A.; Beesley, L. Biochar application to a contaminated soil reduces the availability and plant uptake of zinc, lead and cadmium. J. Environ. Manag. 2015, 159, 86–93. [Google Scholar] [CrossRef] [PubMed]
- Tang, J.; Zhu, W.; Kookana, R.; Katayama, A. Characteristics of biochar and its application in remediation of contaminated soil. J. Biosci. Bioeng. 2013, 116, 653–659. [Google Scholar] [CrossRef] [PubMed]
- Ifthikar, J.; Wang, T.; Khan, A.; Jawad, A.; Sun, T.; Jiao, X.; Chen, Z.; Wang, J.; Wang, Q.; Wang, H.; et al. Highly Efficient Lead Distribution by Magnetic Sewage Sludge Biochar: Sorption Mechanisms and Bench Applications. Bioresour. Technol. 2017, 238, 399–406. [Google Scholar] [CrossRef] [PubMed]
- Ding, Z.; Hu, X.; Wan, Y.; Wang, S.; Gao, B. Removal of lead, copper, cadmium, zinc, and nickel from aqueous solutions by alkali-modified biochar: Batch and column tests. J. Ind. Eng. Chem. 2016, 33, 239–245. [Google Scholar] [CrossRef]
- Lu, H.; Zhang, W.; Yang, Y.; Huang, X.; Wang, S.; Qiu, R. Relative distribution of Pb2+sorption mechanisms by sludge-derived biochar. Water Res. 2012, 46, 854–862. [Google Scholar] [CrossRef] [PubMed]
- Abadin, H.; Ashizawa, A.; Stevens, Y.-W.; Llados, F.; Diamond, G.; Sage, G.; Citra, M.; Quinones, A.; Bosch, S.J.; Swarts, S.G. Toxicological Profile for Lead; US Department of Health and Human Services: Washington, DC, USA, 2007; p. 582.
- Wuana, R.A.; Okieimen, F.E. Heavy Metals in Contaminated Soils: A Review of Sources, Chemistry, Risks and Best Available Strategies for Remediation. ISRN Ecol. 2011, 2011, 402647. [Google Scholar] [CrossRef]
- Vodyanitskii, Y.N. Standards for the contents of heavy metals in soils of some states. Ann. Agrar. Sci. 2016, 14, 257–263. [Google Scholar] [CrossRef]
- Tóth, G.; Hermann, T.; Szatmári, G.; Pásztor, L. Maps of heavy metals in the soils of the European Union and proposed priority areas for detailed assessment. Sci. Total Environ. 2016, 565, 1054–1062. [Google Scholar] [CrossRef] [PubMed]
- Tóth, G.; Hermann, T.; Da Silva, M.R.; Montanarella, L. Heavy metals in agricultural soils of the European Union with implications for food safety. Environ. Int. 2016, 88, 299–309. [Google Scholar] [CrossRef] [PubMed]
- Gloag, D. Sources of lead pollution. Br. Med. J. Clin. Res. Ed. 1981, 282, 41–44. [Google Scholar] [CrossRef] [PubMed]
- Bashir, S.; Hussain, Q.; Akmal, M.; Riaz, M.; Hu, H.; Ijaz, S.S.; Iqbal, M.; Abro, S.; Mehmood, S.; Ahmad, M. Sugarcane bagasse-derived biochar reduces the cadmium and chromium bioavailability to mash bean and enhances the microbial activity in contaminated soil. J. Soils Sediments 2018, 18, 874–886. [Google Scholar] [CrossRef]
- Park, J.H.; Lamb, D.; Paneerselvam, P.; Choppala, G.; Bolan, N.; Chung, J.W. Role of organic amendments on enhanced bioremediation of heavy metal(loid) contaminated soils. J. Hazard. Mater. 2011, 185, 549–574. [Google Scholar] [CrossRef] [PubMed]
- Lu, K.; Yang, X.; Shen, J.; Robinson, B.; Huang, H.; Liu, D.; Bolan, N.; Pei, J.; Wang, H. Effect of bamboo and rice straw biochars on the bioavailability of Cd, Cu, Pb and Zn to Sedum plumbizincicola. Agric. Ecosyst. Environ. 2014, 191, 124–132. [Google Scholar] [CrossRef]
- Bian, R.; Joseph, S.; Cui, L.; Pan, G.; Li, L.; Liu, X.; Zhang, A.; Rutlidge, H.; Wong, S.; Chia, C.; et al. A three-year experiment confirms continuous immobilization of cadmium and lead in contaminated paddy field with biochar amendment. J. Hazard. Mater. 2014, 272, 121–128. [Google Scholar] [CrossRef] [PubMed]
- Kan, T.; Strezov, V.; Evans, T.J. Lignocellulosic biomass pyrolysis: A review of product properties and effects of pyrolysis parameters. Renew. Sustain. Energy Rev. 2016, 57, 126–1140. [Google Scholar] [CrossRef]
- Li, J.; Dai, J.; Liu, G.; Zhang, H.; Gao, Z.; Fu, J.; He, Y.; Huang, Y. Biochar from microwave pyrolysis of biomass: A review. Biomass Bioenergy 2016, 94, 228–244. [Google Scholar] [CrossRef]
- Glaser, B.; Lehmann, J.; Zech, W. Ameliorating physical and chemical properties of highly weathered soils in the tropics with charcoal—A review. Biol. Fertil. Soils 2002, 35, 219–230. [Google Scholar] [CrossRef]
- Ahmad, M.; Soo Lee, S.; Yang, J.E.; Ro, H.M.; Han Lee, Y.; Sik Ok, Y. Effects of soil dilution and amendments (mussel shell, cow bone, and biochar) on Pb availability and phytotoxicity in military shooting range soil. Ecotoxicol. Environ. Saf. 2012, 79, 225–231. [Google Scholar] [CrossRef] [PubMed]
- Zhang, R.-H.; Li, Z.-G.; Liu, X.-D.; Wang, B.-C.; Zhou, G.-L.; Huang, X.-X.; Lin, C.-F.; Wang, A.-H.; Brooks, M. Immobilization and bioavailability of heavy metals in greenhouse soils amended with rice straw-derived biochar. Ecol. Eng. 2017, 98, 183–188. [Google Scholar] [CrossRef]
- Mohan, D.; Sarswat, A.; Ok, Y.S.; Pittman, C.U. Organic and inorganic contaminants removal from water with biochar, a renewable, low cost and sustainable adsorbent—A critical review. Bioresour. Technol. 2014, 160, 191–202. [Google Scholar] [CrossRef] [PubMed]
- Tan, X.; Liu, Y.; Zeng, G.; Wang, X.; Hu, X.; Gu, Y.; Yang, Z. Application of biochar for the removal of pollutants from aqueous solutions. Chemosphere 2015, 125, 70–85. [Google Scholar] [CrossRef] [PubMed]
- Kołodyńska, D.; Krukowska, J.; Thomas, P. Comparison of sorption and desorption studies of heavy metal ions from biochar and commercial active carbon. Chem. Eng. J. 2017, 307, 353–363. [Google Scholar] [CrossRef]
- Li, H.; Dong, X.; da Silva, E.B.; de Oliveira, L.M.; Chen, Y.; Ma, L.Q. Mechanisms of metal sorption by biochars: Biochar characteristics and modifications. Chemosphere 2017, 178, 466–478. [Google Scholar] [CrossRef] [PubMed]
- Oliveira, F.R.; Patel, A.K.; Jaisi, D.P.; Adhikari, S.; Lu, H.; Khanal, S.K. Environmental application of biochar: Current status and perspectives. Bioresour. Technol. 2017, 246, 110–122. [Google Scholar] [CrossRef] [PubMed]
- Zhang, C.; Liu, L.; Zhao, M.; Rong, H.; Xu, Y. The environmental characteristics and applications of biochar. Environ. Sci. Pollut. Res. 2018, 21525–21534. [Google Scholar] [CrossRef] [PubMed]
- Kasozi, G.N.; Zimmerman, A.R.; Nkedi-Kizza, P.; Gao, B. Catechol and Humic Acid Sorption onto a Range of Laboratory Produced Black Carbons (Biochars). Environ. Sci. Technol. 2010, 44, 6189–6195. [Google Scholar] [CrossRef] [PubMed]
- Mukherjee, A.; Zimmerman, A.R.; Harris, W. Surface chemistry variations among a series of laboratory-produced biochars. Geoderma 2011, 163, 247–255. [Google Scholar] [CrossRef]
- APAT; IRSA/CNR. Metodi analitici per le acque; Belli, M., Centioli, D., De Zorzi, P., Sansone, U., Capri, S., Pagnotta, R., Pettine, M., Eds.; APAT: Rome, Italy, 2003; ISBN 88-448-0083-7. [Google Scholar]
- Allaire, S.E.; Lange, S.F.; Auclair, I.K.; Quinche, M.; Greffard, L. Analyses of Biochar Properties; Centre de Recherche sur les Matériaux Renouvelables, Université Lavall: Québec, QC, Canada, 2015. [Google Scholar]
- Pituello, C.; Francioso, O.; Simonetti, G.; Pisi, A.; Torreggiani, A.; Berti, A.; Morari, F. Characterization of chemical–physical, structural and morphological properties of biochars from biowastes produced at different temperatures. J. Soils Sediments 2015, 15, 792–804. [Google Scholar] [CrossRef]
- Qambrani, N.A.; Rahman, M.M.; Won, S.; Shim, S.; Ra, C. Biochar properties and eco-friendly applications for climate change mitigation, waste management, and wastewater treatment: A review. Renew. Sustain. Energy Rev. 2017, 79, 255–273. [Google Scholar] [CrossRef]
- Foo, K.Y.; Hameed, B.H. Insights into the modeling of adsorption isotherm systems. Chem. Eng. J. 2010, 156, 2–10. [Google Scholar] [CrossRef]
- Agarwal, A.K.; Kadu, M.S.; Pandhurnekar, C.P.; Muthreja, I.L. Langmuir, Freundlich and BET Adsorption Isotherm Studies for Zinc ions onto coal fly ash. Int. J. Appl. Innov. Eng. Manag. 2014, 3, 64–71. [Google Scholar]
- Fan, S.; Tang, J.; Wang, Y.; Li, H.; Zhang, H.; Tang, J.; Wang, Z.; Li, X. Biochar prepared from co-pyrolysis of municipal sewage sludge and tea waste for the adsorption of methylene blue from aqueous solutions: Kinetics, isotherm, thermodynamic and mechanism. J. Mol. Liq. 2016, 220, 432–441. [Google Scholar] [CrossRef]
- Ho, Y.S.; McKay, G. Pseudo-second order model for sorption processes. Process Biochem. 1999, 34, 451–465. [Google Scholar] [CrossRef]
- Boni, M.R.; Chiavola, A.; Antonucci, A.; Di Mattia, E.; Marzeddu, S. A novel treatment for Cd-contaminated solution through adsorption on beech charcoal: The effect of bioactivation. Desalin. Water Treat. 2018, 127, 104–110. [Google Scholar] [CrossRef]
- Perry, R.H.; Green, D.W.; Maloney, J.O. Chemical Engineers’ Handbook Seventh; McGraw-Hill: New York, NY, USA, 1997; Volume 27, ISBN 0070498415. [Google Scholar]
- Perry, R.H.; Green, D.W. Perry’s Chemical Engineers’ Handbook; McGraw-Hill: New York, NY, USA, 2008; ISBN 9780071422949. [Google Scholar]
- Yoon, Y.H.; Nelson, J.H. Application of Gas Adsorption Kinetics I. A Theoretical Model for Respirator Cartridge Service Life. Am. Ind. Hyg. Assoc. J. 1984, 45, 509–516. [Google Scholar] [CrossRef] [PubMed]
- Thomas, H.C. Heterogeneous Ion Exchange in a Flowing System. J. Am. Chem. Soc. 1944, 66, 1664–1666. [Google Scholar] [CrossRef]
- Bohart, G.S.; Adams, E.Q. Some aspects of the behavior of charcoal with respect to chlorine. J. Am. Chem. Soc. 1920, 42, 523–544. [Google Scholar] [CrossRef]
- Bhaumik, M.; Setshedi, K.; Maity, A.; Onyango, M.S. Chromium(VI) removal from water using fixed bed column of polypyrrole/Fe3O4 nanocomposite. Sep. Purif. Technol. 2013, 110, 11–19. [Google Scholar] [CrossRef]
- Ahmed, M.B.; Zhou, J.L.; Ngo, H.H.; Guo, W.; Chen, M. Progress in the preparation and application of modified biochar for improved contaminant removal from water and wastewater. Bioresour. Technol. 2016, 214, 836–851. [Google Scholar] [CrossRef] [PubMed]
- Noh, J.S.; Schwarz, J.A. Effect of HNO3 treatment on the surface acidity of activated carbons. Carbon N. Y. 1990, 28, 675–682. [Google Scholar] [CrossRef]
- Tag, A.T.; Duman, G.; Ucar, S.; Yanik, J. Effects of feedstock type and pyrolysis temperature on potential applications of biochar. J. Anal. Appl. Pyrolysis 2016, 120, 200–206. [Google Scholar] [CrossRef]
- Kołodyńska, D.; Wnetrzak, R.; Leahy, J.J.; Hayes, M.H.B.; Kwapiński, W.; Hubicki, Z. Kinetic and adsorptive characterization of biochar in metal ions removal. Chem. Eng. J. 2012, 197, 295–305. [Google Scholar] [CrossRef]
- Karunanayake, A.G.; Todd, O.A.; Crowley, M.; Ricchetti, L.; Pittman, C.U.; Anderson, R.; Mohan, D.; Mlsna, T. Lead and cadmium remediation using magnetized and non magnetized biochar from Douglas fir. Chem. Eng. J. 2018, 331, 480–491. [Google Scholar] [CrossRef]
- Rouquerol, J.; Llewellyn, P.; Rouquerol, F. Is the bet equation applicable to microporous adsorbents? Stud. Surf. Sci. Catal. 2007, 160, 49–56. [Google Scholar] [CrossRef]
- Inyang, M.; Gao, B.; Ding, W.; Pullammanappallil, P.; Zimmerman, A.R.; Cao, X. Enhanced lead sorption by biochar derived from anaerobically digested sugarcane bagasse. Sep. Sci. Technol. 2011, 46, 1950–1956. [Google Scholar] [CrossRef]
- Uchimiya, M.; Lima, I.M.; Thomas Klasson, K.; Chang, S.; Wartelle, L.H.; Rodgers, J.E. Immobilization of heavy metal ions (CuII, CdII, NiII, and PbII) by broiler litter-derived biochars in water and soil. J. Agric. Food Chem. 2010, 58, 5538–5544. [Google Scholar] [CrossRef] [PubMed]
- Mohan, D.; Pittman, C.U.; Bricka, M.; Smith, F.; Yancey, B.; Mohammad, J.; Steele, P.H.; Alexandre-Franco, M.F.; Gómez-Serrano, V.; Gong, H. Sorption of arsenic, cadmium, and lead by chars produced from fast pyrolysis of wood and bark during bio-oil production. J. Colloid Interface Sci. 2007, 310, 57–73. [Google Scholar] [CrossRef] [PubMed]
- Harris, W. Dairy-Manure Derived Biochar Effectively Sorbs Lead and Atrazine. Environ. Sci. Technol. 2009, 1, 3285–3291. [Google Scholar] [CrossRef]
- Liu, Z.; Zhang, F.S. Removal of lead from water using biochars prepared from hydrothermal liquefaction of biomass. J. Hazard. Mater. 2009, 167, 933–939. [Google Scholar] [CrossRef] [PubMed]
- Li, Y.-H.; Ding, J.; Luan, Z.; Di, Z.; Zhu, Y.; Xu, C.; Wu, D.; Wei, B. Competitive adsorption of Pb2+, Cu2+ and Cd2+ ions from aqueous solutions by multiwalled carbon nanotubes. Carbon N. Y. 2003, 41, 2787–2792. [Google Scholar] [CrossRef]
- Xue, Y.; Gao, B.; Yao, Y.; Inyang, M.; Zhang, M.; Zimmerman, A.R.; Ro, K.S. Hydrogen peroxide modification enhances the ability of biochar (hydrochar) produced from hydrothermal carbonization of peanut hull to remove aqueous heavy metals: Batch and column tests. Chem. Eng. J. 2012, 200–202, 673–680. [Google Scholar] [CrossRef]


| Physical and Chemical Properties | Symbol | Unit | Values | Methods and Instruments |
|---|---|---|---|---|
| Bulk density | γs | g/cm3 | 1.98 | [51,52] |
| Specific weight | γd | g/cm3 | 0.235 | [51,52] |
| Field capacity | ωc | g in 100 g | 650 | [51,52] |
| Porosity | N | % | 88.14 | [51,52] |
| Carbon | C | % | 89.25 | Zeiss Auriga |
| Oxygen | O | % | 7.46 | Zeiss Auriga |
| Potassium | K | % | 1.22 | Zeiss Auriga |
| Calcium | Ca | % | 1.01 | Zeiss Auriga |
| Magnesium | Mg | 0.37 | Zeiss Auriga | |
| Silicon | Si | 0.26 | Zeiss Auriga | |
| Sodium | Na | 0.20 | Zeiss Auriga | |
| Moisture content | ω | % | 29.11 | [51,52] |
| Ash content | cc | % | 60.91 | [51,52] |
| Potential of Hydrogen | pH | - | 10.4 | [51,52] |
| Point of zero charge | pHPZC | - | 10.5 | [66] |
| Pseudo Second-Order Kinetic Model | BET Isotherm | ||||||
|---|---|---|---|---|---|---|---|
| C0 | qe,exp | qe | ks | R2 | qmax | CBET | R2 |
| (mg/L) | (mg/g) | (mg/g) | (g/min) | - | (mg/g) | (L/mg) | - |
| 50 | 9.95 | 9.74 | 0.0049 | 0.9730 | 22.00 | 2,530,403.46 | 0.6952 |
| 100 | 20.30 | 20.08 | 0.0141 | 0.9993 | 168.98 | 373,280.22 | 0.9981 |
© 2018 by the authors. Licensee MDPI, Basel, Switzerland. This article is an open access article distributed under the terms and conditions of the Creative Commons Attribution (CC BY) license (http://creativecommons.org/licenses/by/4.0/).
Share and Cite
Boni, M.R.; Chiavola, A.; Marzeddu, S. Application of Biochar to the Remediation of Pb-Contaminated Solutions. Sustainability 2018, 10, 4440. https://doi.org/10.3390/su10124440
Boni MR, Chiavola A, Marzeddu S. Application of Biochar to the Remediation of Pb-Contaminated Solutions. Sustainability. 2018; 10(12):4440. https://doi.org/10.3390/su10124440
Chicago/Turabian StyleBoni, Maria Rosaria, Agostina Chiavola, and Simone Marzeddu. 2018. "Application of Biochar to the Remediation of Pb-Contaminated Solutions" Sustainability 10, no. 12: 4440. https://doi.org/10.3390/su10124440
APA StyleBoni, M. R., Chiavola, A., & Marzeddu, S. (2018). Application of Biochar to the Remediation of Pb-Contaminated Solutions. Sustainability, 10(12), 4440. https://doi.org/10.3390/su10124440