1. Introduction
For developing countries, mega projects (including infrastructure construction projects), which require an enormous amount of resources, have difficulty in attracting the required finances (investment costs) [
1]. As developing countries generally have low credit ratings, it is difficult for them to acquire large-scale funding in international capital markets. As a result, developing countries receive long-term loans at low interest rates to support funding for securing infrastructure. This makes it difficult for developing countries to promote infrastructure projects through government finances alone [
2]. In particular, as most developing countries lack public funds, project finances for infrastructure construction projects for roads, harbors, railways, power generation, etc., are very risky. For this reason, infrastructure construction projects of developing countries are usually conducted through ODA. Accordingly, the scale of ODA is related to the success of the infrastructure construction project.
In addition, the efficient allocation of a limited ODA budget may be connected to the sustainability of infrastructure construction projects in developing countries with different economies and development stages.
From the perspective of the donor countries, direct investment in recipient countries is a kind of reciprocal benefit situation based on the anticipation of improving their endowment with infrastructure in roads, railroads, ports, and finance [
3].
In 2017, the Export-Import Bank of Korea, which manages the economic development cooperation fund, held a joint seminar with the Export-Import Bank of China, JICA (Japan International Cooperation Agency), and NEDA (Neighboring Countries Economic Development Cooperation Agency), all of which are aid organizations for infrastructures in Southeast Asian countries. The four organizations discussed financial cooperation to intensively assist Southeast Asian countries where the demand for large-scale infrastructure development is on the rise. As a consequence, the South Korean government has expanded the budget for ODA.
As the paradigm of ODA is currently changing, some donor countries including South Korea are gradually increasing the amount of ODA, and are utilizing ODA to win overseas construction contracts [
4].
For instance, Chinese companies have increased their market shares through China’s ODA. For projects in which Japanese companies have participated, the Japanese government has supported a portion of the construction project fund since 2014 [
5]. Various studies have been conducted to explore the correlations between the ODA from donor countries and the national economic growth of developing countries. However, the scope of these studies is limited to the correlations between the ODA from the donor countries and the GDP, GNI, and FDI originating from the developing countries. In case a donor country intends to establish strategies for expanding its contribution to the economic growth of a developing country, it may be necessary to predict demands for ODA in the budgets.
Therefore, several questions have been raised regarding the effects of ODA on both parties (developing and donor countries): (1) Does ODA influence the general economic status of developing countries? If so, then (2) does an infrastructure construction project of a developing country have a correlation to the amount of ODA? Finally, (3) can ODA be continuously influential in gaining and implementing infrastructure construction projects in developing countries?
This study analyzes the relationship between ODA and the number of infrastructure construction project orders awarded by developing countries to a donor country. Several studies have focused on ODA and its impact on the economic development of developing countries [
3]. However, only a few studies have paid attention to the impact of ODA, which is the investment cost of infrastructure construction projects in a developing country on the number of project orders awarded to the donor country [
6]. In the existing literature, most studies focus on economic indicators from the viewpoint of recipient countries (developing countries). Therefore, studies on willingness to advance infrastructure construction project of developing countries and decision-making for ODA budget allocation need to be conducted from the viewpoint of donor countries.
Of course, ODA reflects the policy stances of each government. As the budget of ODA is limited, it is difficult to statistically show the political relationship between a donor country and a recipient country. However, it is necessary to predict the requirements for ODA in terms of budget, which can help the governments of donor country in assigning financial resources. In this regard, the performance of a mega construction project can indicate the trend of demand for ODA and serve as the basis of budgeting ODA in a donor country.
The objective of this research is to present an analytical model that considers the correlations between the competitiveness of ODA donor countries in the construction markets of developing countries, and the general economic fluctuations of developing countries.
The model is validated by analyzing the performance of South Korea in terms of infrastructure project orders awarded by them, and the variables representing economic fluctuations of developing countries where South Korea has provided ODA. A model to explore the relations is established by introducing the vector error correction modeling method. To evaluate and verify the characteristics of the time-series data obtained, a unit root test, Granger causality test, time-lag test, and co-integration test are conducted.
2. Research Background
2.1. Status of South Korean Overseas Infrastructure Construction Business
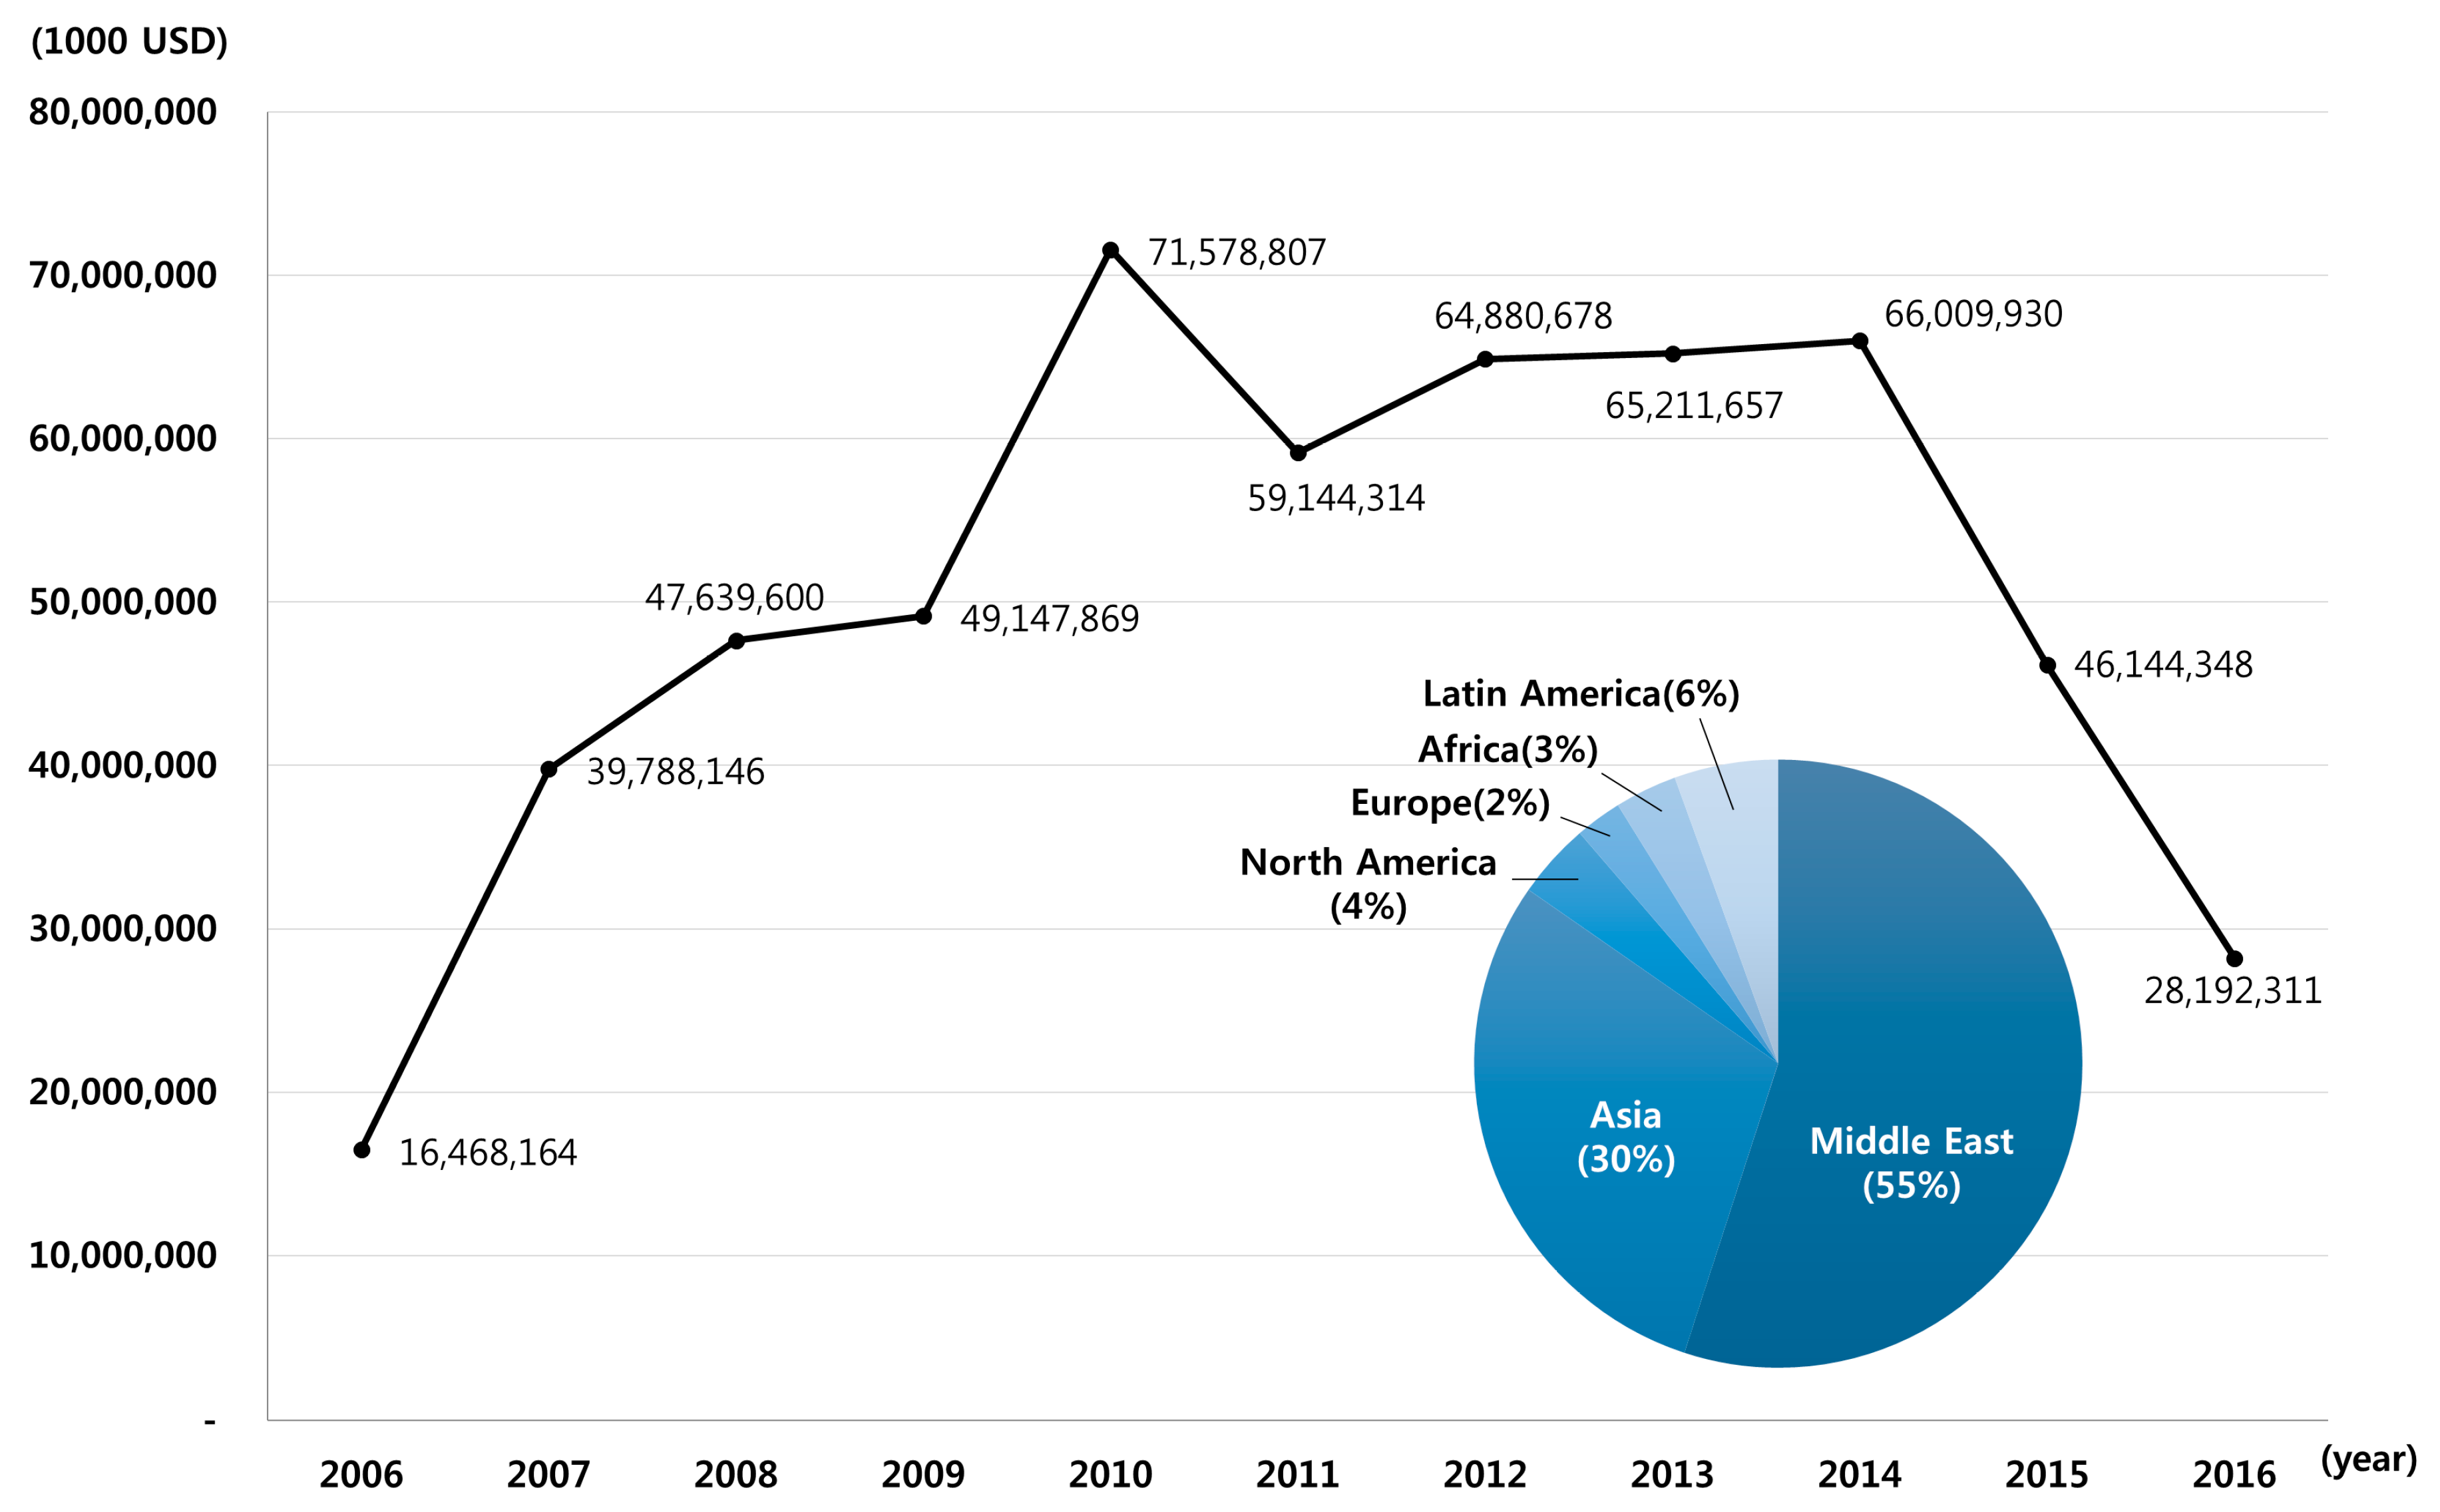
The number of overseas construction project orders received by South Korea reached about US
$71.60 million in 2010, and has continued to decrease. This is far below the annual average growth rate of 10% of the global construction market for the same period [
7].
Figure 1 illustrates the values of overseas construction project orders awarded to South Korean companies during the last 10 years.
However, the rate of increase of project orders awarded by South Korean construction companies after 2011 is 3.7%, which is significantly lower than the annual growth rate of the international construction business, which is estimated to be 10% [
9]. In the first half of 2017, the total value of overseas construction project orders awarded to South Korean companies increased by 7.2% over the same period last year. As the global economy tended to recover, infrastructure investments increased and the oil prices were lowered in the Middle East. Thus, South Korean construction companies moved forward, and the number of overseas construction project orders increased.
However, according to Global Insight (2015), since Middle Eastern countries are sensitive to fluctuations in oil prices, the dependence on Asian countries in the global construction market will increase [
10]. In this situation, the ASEAN Connectivity Forum (2013), which was organized by the International Contractors Association of Korea and the ASEAN-Korea Centre, explored the possibility of connecting businesses to the infrastructure markets of ASEAN countries, where many direct investments of South Korea have been made.
Figure 2 illustrates the total value of infrastructure construction project orders received by South Korean companies in ASEAN countries over the last 10 years. It turns out that South Korean companies’ performance in the infrastructure construction business in these countries continues to improve. Since 2006, the total value of infrastructure construction project orders received by South Korean companies has not decreased below US
$4 billion. The majority of the orders have been concentrated in public construction projects such as bridges, harbors, power plants, and dams in developing countries.
Until recently, South Korean companies experienced difficulty in the overseas construction business, which included a lack of financial support, manpower shortages, cultural differences, and uncertainty in local countries. Accordingly, strategies for gaining construction project orders in each target country need to be seriously discussed at the national level.
2.2. Status of South Korean Official Development Assistance
In 1987, South Korea cancelled its status as a recipient of the World Bank, and began to raise an economic development cooperation fund. KOICA (Korea International Cooperation Agency) was founded in 1991, and South Korea became the first donor country among OECD members in the 2000s, where it used to be a recipient country [
12]. The global financial crisis of 2008 made OECD members reduce the budget of international aid. However, South Korea continued to increase its aid budget in order to support the growth of developing countries. In 2010, it joined the OECD DAC (Development Assistance Committee).
South Korea continuously increased its ODA budget, recording an annual rate of increase of 21.7% from 2006 to 2011. As for types of South Korea’s ODA, bilateral aid continues to account for over 70% of the total ODA except in 2008. In other words, South Korea tends to focus its ODA on bilateral relationships. South Korea’s bilateral grant aid occupied only about 20% of the total ODA in the 1990s but increased to 58.1–73.1% between 2006 and 2015. This change seemed to be affected by transparency and evaluation criteria of South Korea’s ODA [
13].
According to OECD statistics, the ODA/GNI ratio of South Korea, which indicates the proportion of ODA to the economy of each donor country that is also an OECD member, was 0.14% in 2015, ranking South Korea at 16th among 29 members. The South Korean government continues to increase its aid budget in order to raise the ODA/GNI ratio to 0.20% by 2020.
The regional allocation of South Korea’s ODA over the last 10 years shows that ASIA has received about 64% of the total ODA, thereby being the most benefited (see
Figure 3). Moreover, the amount of ODA for Southeast Asia continues to increase.
2.3. Previous Research on Official Development Assistance in Developing Countries, and Its Effects
A literature review was conducted to extract variables for establishing a model. This model was established to explore the relationship between the performance of the international infrastructure construction business (form ODA donor countries) and the economic status of developing countries.
Blaise (2005) [
15] analyzed the effect of Japan’s ODA in order to promote the introduction of FDI into China. Based on the analysis result, the Chinese government concentrated ODA projects in infrastructures to solve serious bottlenecks in economic development. In other words, Japan’s ODA was effective in promoting direct investments of Japanese companies in China. Driffield (2013) [
16] analyzed the relative contributions of FDI, ODA, and immigrant remittances to the economic growth of developing countries. It turned out that FDI, ODA, and immigrant remittances had a positive effect on the economic growth of developing countries. However, as each recipient had a restrictive FDI, the relationship between FDI and ODA was shown to be negative.
Won (2013) [
17] examined the impact of infrastructure ODA projects on the urbanization and economic growth of developing countries. The analysis showed that when the ODA budget for one economically active person increased by 1%, the GDP per capita increased by 0.0105%. This indicated that infrastructure ODA projects can promote the economic growth of developing countries. Isabel (2016) [
18] analyzed the relationship between ODA and social capital and economic development in Latin American countries. It was revealed that the reliability of social capital determined the effect of ODA on economic growth. The development of social capital was important to attract ODA, thereby escaping poverty.
Hong (2016) [
19] focused on the effect of ODA on the economic growth of Asian countries with respect to changes in public investment and government revenue. It turned out that the effect of ODA was maximized when ODA was 19–56% of the GDP. Suphian (2017) [
20] analyzed the effect of ODA on trade conditions, FDI, education, and economic growth in East African countries such as Tanzania, Uganda, and Kenya, which benefited from a large-scale ODA. In the long term, ODA had a positive impact on the economic development of these three countries.
Choi (2007) [
21] clarified the role of ODA as a method to support overseas construction business. However, only the ODA donations by South Korea are analyzed, and the target markets or companies are not investigated.
Suh (2011) [
22] analyzed the correlation between the economic growth and ODA of Indonesia, the Philippines, and Vietnam, recipient countries of ODA from South Korea. According to the results, ODA had a positive relationship with per capita GDP at a 10% significance level.
Our literature review revealed that ODA affected the economic growth of recipient countries, and both ODA and FDI influenced infrastructure development. Accordingly, the amount of ODA needs to continuously increase for economic growth and infrastructure development in developing countries.
It is practical to assume that the effects of ODA on each recipient country’s economic growth vary. Such variety indicates that the economic fluctuations of a recipient country owing to ODA may affect the number of infrastructure construction project orders received by a donor country.
On the basis of the above results, this study selected analysis variables that indicate the economic situation of South Korea’s recipient (developing) countries (see
Table 1).
The impact of ODA on the economic fluctuations of a developing country can be measured by using the GDP, GNI, exchange rate, and interest rate. In addition, the impact of ODA on the infrastructure construction projects of a developing country can be measured based on the FDI.
Review of theory and previous literature has confirmed that ODA has a positive impact on the economic growth of recipient countries (i.e., ASEAN developing countries). This study formulated the following hypotheses: (1) The economic fluctuations of the developing country affects infrastructure construction projects. (2) Increase in ODA of the developing country has a positive impact on the continued promotion and acquisition of infrastructure construction projects.
4. Data Analysis and Interpretation
4.1. Data Collection
The purpose of this study is to examine the correlations between the infrastructure construction project orders awarded by South Korean companies in ASEAN (the recipient countries of its ODA), the variation of ODA donations, and economic fluctuations in these recipient countries. For the variables selected in this study, time-series data from between 1987 and 2016 were used. The time-series data on the total amount of ODA donations from South Korea were collected from the OECD/DAC. Further, the time-series data on the number of infrastructure construction projects orders awarded by its companies were collected from the International Contractors Association of Korea, while data on the economic variables (GDP, GNI, FDI, interest rate, and official exchange rate) were collected from the data bank of the World Bank.
The impact variations of a developing country’s economic and infrastructure construction project status according to ODA can be assessed by means of the time series data described in
Figure 5.
The GDP, GNI, FDI, interest rate, and official exchange rate, which are the basic indicators of economic growth, are variables for analyzing the economic status of each recipient country. Variables relevant to the donor country are the amount of ODA and number of infrastructure construction project orders awarded to its companies by ASEAN developing countries (Cambodia, Indonesia, Laos, Malaysia, Myanmar, the Philippines, Thailand, and Vietnam).
4.2. Results of Unit Root Test
In this study, the null hypothesis “a unit root exists” was judged at a significance level of 5% or 10% in order to judge the existence of the unit root [
32]. Accordingly, an Augmented Dickey-Fuller test was conducted to see whether a unit root existed in the time series of variables in each developing country of ASEAN. The results are presented in
Table 2.
In the unit root test, p-values of the time series of variables in each developing country of ASEAN could not reject the null hypothesis that the “unit roots exists at a significance level of 5% or 10%.” For this reason, a primary difference was determined. Among ASEAN countries, Laos, Malaysia, and Myanmar were excluded from the analysis since the number of infrastructure construction project orders received by South Korean companies in ASEAN developing countries, which is one of the key variables of this study, did not reject the null hypothesis. This is because the performance of South Korean companies in gaining infrastructure construction project orders was discontinuous in these three countries. Cambodia was also excluded since the interest rate did not reject the null hypothesis.
4.3. Results of Granger Causality Test
In this study, a Granger causality test was conducted to identify the causality between variables in Cambodia, Indonesia, the Philippines, Thailand, and Vietnam, excluding the above three countries for which a stable time series was obtained by the unit root test. The results are presented in
Table 3.
The causal relations rejected the null hypothesis that “there is no causality with the amount of infrastructure construction project orders received” within a significance level of 5% or 10%. According to the test results, there was causality with FDI, GDP, GNI, ODA, the official exchange rate, and the interest rate in Cambodia, with GNI and ODA in Indonesia, with FDI and ODA in the Philippines, with the interest rate and ODA in Thailand, and with FDI, GNI, the interest rate, and ODA in Vietnam. Consequently, the amount of South Korea’s ODA in ASEAN developing countries was causally related to the number of infrastructure construction project orders received by South Korean companies in those countries.
4.4. Results of Time-Lag Test
This study also conducted a time-lag test to construct a VECM including difference variables obtained by the unit root test. The results are presented in
Table 4.
Based on the SIC criteria, the appropriate time lags were 2 for Cambodia and Vietnam and 1 for Indonesia, the Philippines, and Thailand. We applied the appropriate time lags of each country to the VECM.
4.5. Results of Co-Integration Test
In this study, the unit root test showed that Cambodia, Indonesia, the Philippines, Thailand, and Vietnam had unstable time series variables. Accordingly, a co-integration test was performed to confirm the long-term balance of unstable time series variables for each country. The Johansen test, which was most widely used, was conducted as the co-integration test. The results are presented in
Table 5.
The co-integration test revealed that Cambodia had four co-integration relations between variables. Indonesia, Thailand, and Vietnam had three co-integration relations, and the Philippines had two co-integration relations. Based on this result, we constructed a VECM and performed a variance decomposition analysis and impulse response analysis.
4.6. Results of Variance Decomposition Analysis
After basic testing for a time series of variables, a VECM was constructed. The relative influence of marginal variables on key variables of each country were measured by a variance decomposition analysis. Accordingly, the relative influence of South Korea’s ODA support and the economic variables on the variations of the number of orders by South Korea’s infrastructure construction projects in Cambodia, Indonesia, the Philippines, Thailand, and Vietnam was measured. The results are presented in
Table 6,
Table 7,
Table 8,
Table 9 and
Table 10.
For Cambodia, ODA showed a higher relative influence than other variables during each period. In addition, the influence of the initial variation continued to increase until the end of the period. In other words, the change in South Korea’s ODA was more influential on the number of infrastructure construction project orders received by South Korean companies than the economic fluctuations of Cambodia (see
Table 6).
Additionally, in the case of Indonesia, the influence of ODA on the initial variation continued to increase until the end of the period. However, FDI had the highest relative influence during the period. In other words, the change in FDI was more influential on the number of infrastructure construction project orders received by South Korean companies than the change in South Korea’s ODA in Indonesia (see
Table 7).
Moreover, in the case of the Philippines, ODA was most influential among the variables during the period. However, the amount of ODA tended to decrease over time. In other words, the change in South Korea’s ODA was more influential on the number of infrastructure construction project orders received by South Korean companies than the economic fluctuation of the Philippines (see
Table 8).
In addition, in the case of Thailand, FDI had the highest relative influence during the period. In addition, ODA had the second highest relative influence among the variables. Accordingly, FDI was most influential on the number of infrastructure construction project orders received by South Korean companies (see
Table 9).
Further, in the case of Vietnam, ODA had a significantly higher relative influence than the other variables in the beginning. However, the influence of ODA tended to decrease over time. In other words, the change in South Korea’s ODA was very influential on the number of infrastructure construction project orders received by South Korean companies (see
Table 10).
4.7. Results of Impulse Response Analysis
In this study, considering the amount of ODA support by South Korea to Cambodia, Indonesia, Philippines, Thailand and Vietnam, as well as the impact of economic variables, the dynamic response results of the number of infrastructure construction project orders awarded to the South Korea were measured. The results are presented in
Figure 6.
In the case of Cambodia, for the change in the amount of South Korea’s ODA, the number of infrastructure construction project orders received by South Korean companies increased in the positive (+) direction from the beginning, and a rate of increase of about 0.48% was maintained in the final period. In addition, for the change in FDI, the number of infrastructure construction project orders received by South Korean companies increased in the negative (−) direction from the beginning, and a rate of increase of about 0.08% occurred in the final period. Consequently, the amount of South Korea’s ODA had a positive (+) correlation with the number of infrastructure construction project orders received by South Korean companies. These two variables produced a synergistic effect.
Moreover, in the case of Indonesia, for the change in FDI, the number of infrastructure construction project orders received by South Korean companies showed a positive (+) response of 0.41% in the beginning. The change rate was maintained at about 0.60% over time. In addition, for the change in the amount of South Korea’s ODA, the number of infrastructure construction project orders received by South Korean companies continued to increase in the positive direction (+) from the beginning. Accordingly, both the FDI and South Korea’s ODA had a positive (+) correlation with the number of infrastructure construction project orders received by South Korean companies, indicating a synergistic effect between variables.
In addition, in the case of the Philippines, for the change in the amount of South Korea’s ODA, the number of infrastructure construction project orders received by South Korean companies gradually increased in the positive (+) direction from the beginning, and a rate of increase of about 1.41% was maintained in the final period. On the other hand, for the change in FDI, the number of infrastructure construction project orders received by South Korean companies increased in the negative (−) direction over time, and a change rate of about 1.89% occurred in the final period. Consequently, the amount of South Korea’s ODA had a positive (+) correlation with the number of infrastructure construction project orders received by South Korean companies. These two variables produced a synergistic effect.
Additionally, in the case of Thailand, for the change in FDI, the number of infrastructure construction project orders received by South Korean companies changed by about 0.13% in the negative (−) direction in the beginning, and then gradually increased in the positive (+) direction. The final period showed a rate of change of about 0.91%. In addition, for the change in the amount of South Korea’s ODA, the number of infrastructure construction project orders received by South Korean companies gradually increased in the positive (+) direction from the beginning, and the final period showed a change rate of about 0.66%. Consequently, both the FDI and South Korea’s ODA showed a positive (+) correlation with the number of infrastructure construction project orders received by South Korean companies, indicating a synergistic effect between variables.
Further, in the case of Vietnam, for the change in the amount of South Korea’s ODA, the number of infrastructure construction project orders received by South Korean companies increased in the positive (+) direction from the beginning, and the final period showed a change rate of about 0.32%. In addition, for the change in FDI, the number of infrastructure construction project orders received by South Korean companies changed in the positive (+) direction from the beginning, but decreased over time. The final period showed a change rate of about 0.03%. Consequently, both the FDI and South Korea’s ODA showed a positive (+) correlation with the number of infrastructure construction project orders received by South Korean companies, indicating a remarkable synergistic effect between the variables in the beginning.
4.8. Interpretation
The dynamic relationship between the number of infrastructure construction project orders received by South Korean companies and South Korea’s ODA in ASEAN developing countries such as Cambodia, Indonesia, the Philippines, Thailand, and Vietnam was analyzed. It turned out that these two variables had a positive (+) correlation with each other (see
Table 11).
The analysis indicated that the number of infrastructure construction project orders received by South Korean companies was most sensitive to changes in the amount of South Korea’s ODA. The positive (+) correlation between these two variables was seen in Cambodia, the Philippines, and Vietnam. This indicates that a simple increase in the amount of South Korea’s ODA can increase the number of infrastructure construction project orders received by South Korean companies in those developing countries. In other words, South Korea may consider the improvement of the number of infrastructure construction project orders awarded to South Korean companies and the long-term continuity of those projects from the standpoint of a donor country. In this regard, the above countries can be selected as attractive places into which South Korea can advance in the area of mega projects of infrastructure construction.
In the case of Indonesia and Thailand, which are more sensitive to the influence of and changes in the FDI, the number of infrastructure construction project orders received by South Korean companies depends on economic fluctuations. For this reason, a mere increase in ODA is not sufficient to conclude that South Korean companies need to advance into the infrastructure construction markets of these countries. Of course, the amount of South Korea’s ODA increases in ASEAN developing countries. However, since the ODA/GNI ratio of this region is still lower than the average value of ODA/GNI, such a simple increase in the amount of ODA can be a strategy. Nevertheless, as the above analysis result indicates, an increase in the amount of ODA does not guarantee an increase in the number of infrastructure construction project orders received by South Korean companies in Indonesia and Thailand. It seems that the economic fluctuations of these countries will have the same effect on other donor countries that provide a large amount of ODA.
As for the relationship between variables, the analysis revealed that the change in South Korea’s ODA was positively (+) proportional to that of the GDP or GNI in Cambodia, Indonesia, Thailand, and Vietnam. This means that the infrastructure construction projects implemented by South Korean companies in those countries were connected to major industries for which ODA funds were used. Accordingly, donor countries advance into these countries through ODA projects that have a strong characteristic of investment development. On the other hand, in the case of the Philippines, the change in South Korea’s ODA was inversely (−) proportional to the major economic indicators.
In other words, the infrastructure construction projects implemented by South Korean companies in this country were not significantly connected to major industries, but were literally national infrastructure development projects supported by ODA funds. Consequently, donor countries advance into such a developing country through ODA projects that have a strong characteristic of aid for developing national infrastructures.
5. Discussion
In this study, a VECM was used to analyze the relationship between ODA and infrastructure construction projects in developing countries. South Korea, which is experiencing continuously expanding ODA and a growing ASEAN construction market entry, is deemed to be significant to other donor and recipient countries [
33]. Continuous future demand for infrastructure projects through ODA is expected in developing countries and infrastructure projects appear to be essential for their economic growth [
34]. ODA refers to non-profit aid projects as basic purposes. Mutual growth between the donor and recipient country is necessary for the continued success of these projects.
The study results indicate that an increase in the ODA of South Korea would have a positive impact on the promotion of infrastructure construction projects in developing ASEAN countries. In other words, the performance of South Korea’s overseas construction businesses can also be improved. Based on the results, we confirmed the hypotheses of this study (i.e.,
Section 2.3) that (1) the economic fluctuations of the developing country affect infrastructure construction projects, and (2) an increase in the ODA of the developing country has a positive impact on the continued promotion and acquisition of infrastructure construction projects.
However, the countries delivering more aid than South Korea, including China, Japan, and top OECD DAC donors, will be similarly impacted. Therefore, it is necessary to identify economic variables that have a greater impact on infrastructure construction project orders than ODA.
For developing countries in which the impact of FDI is larger than that of ODA, the orders for infrastructure construction projects will be more responsive to economic fluctuations, even with a simple increase in ODA. From the perspective of the donor country, increasing ODA to enter the market of the developing country is deemed an unreasonable strategy. ODA-related policy directions, economic scale, and industry trends based on the developing country should be considered [
35].
In case of the developing country, it is necessary to establish partnerships or consortiums between the ODA support institutions of donor countries and companies through ODA projects based on international agreements. These partnerships or consortiums will be able to facilitate the progress of infrastructure construction projects of the developing county through funding [
36]. In addition, the donor country’s companies can reduce risk through the project’s stable earnings.
6. Summary and Conclusions
This study represents basic research for continuing infrastructure construction projects that are mega projects in developing countries benefiting from ODA and for helping donor countries select which countries are attractive enough to be integrated into the global construction market. To achieve these goals, we analyzed the dynamic relationships between ODA and economic fluctuations with respect to the number of infrastructure project orders awarded to donor countries. South Korea was selected as the target to be analyzed since it is a member of OECD DAC, which continuously increases the amount of ODA and attempts to advance into overseas markets owing to unstable domestic markets.
Among the ODA recipient countries, Cambodia, Indonesia, the Philippines, Thailand, Vietnam, Laos, Malaysia, and Myanmar were selected for analysis. Time-series data from 1987 to 2016, obtained from the OECD/DAC, International Constructors Association of Korea, and World Bank were selected as variables representing variations of the economic status of ASEAN developing countries. Laos, Malaysia, and Myanmar were excluded at the general testing stage for time-series data.
After conducting variance decomposition and impulse response analyses, ASEAN developing countries (Cambodia, Indonesia, the Philippines, Thailand, and Vietnam) showed that the amount of infrastructure construction project orders received by South Korean companies was positively (+) proportional to the change in South Korea’s ODA. In addition, except for the Philippines, the amount of ODA was positively (+) proportional to the GDP or GNI in all of the other developing countries. This means that infrastructure construction projects that are considered to be “mega projects” were closely related to major industries in these developing countries, and were also significantly supported by ODA funds. In other words, as the increase in the amount of ODA was related to the economic growth and the development of major industries, this not only has a long-term positive impact, but also ensures stable short-term funds for infrastructure construction projects. Such a cycle seems to enable mega projects, which aim for self-sustained development of developing countries, to be continuously and actively implemented.
On the other hand, an increase in the amount of ODA may result in the improvement of a donor country’s gaining orders for mega projects in a developing country. In practice, ODA is greatly influenced by political and diplomatic relations between countries. There are limitations to quantitatively analyzing this impact. Accordingly, in competition for infrastructure construction projects, there is a need to consider the political and diplomatic relations between developing countries and top OECD DAC donor countries with larger ODA than South Korea. For this reason, the participation of donor countries in infrastructure construction projects of developing countries may be restricted. Accordingly, it is absolutely necessary to increase the proportion of grant aid. Thus, an improvement of the quality of ODA will enhance the image of the donor country, which can increase the probability of gaining subsequent mega project orders. Also, it will be necessary for donor countries to establish cooperative measures between countries at an early stage by contributing to the development of infrastructure in the recipient countries (developing countries) through ODA projects, wherein free and paid support measures are interconnected. As a result, donor countries can expect to increase contributions to the international community and improve the efficiencies of ODA projects.
Future comparative analyses among top ODA donor countries regarding the developing countries’ awarded infrastructure projects based on type of construction will be required.


