Development of a Building Information Modeling-Parametric Workflow Based Renovation Strategy for an Exemplary Apartment Building in Seoul, Korea


Abstract
:1. Introduction
2. Tools and Methods
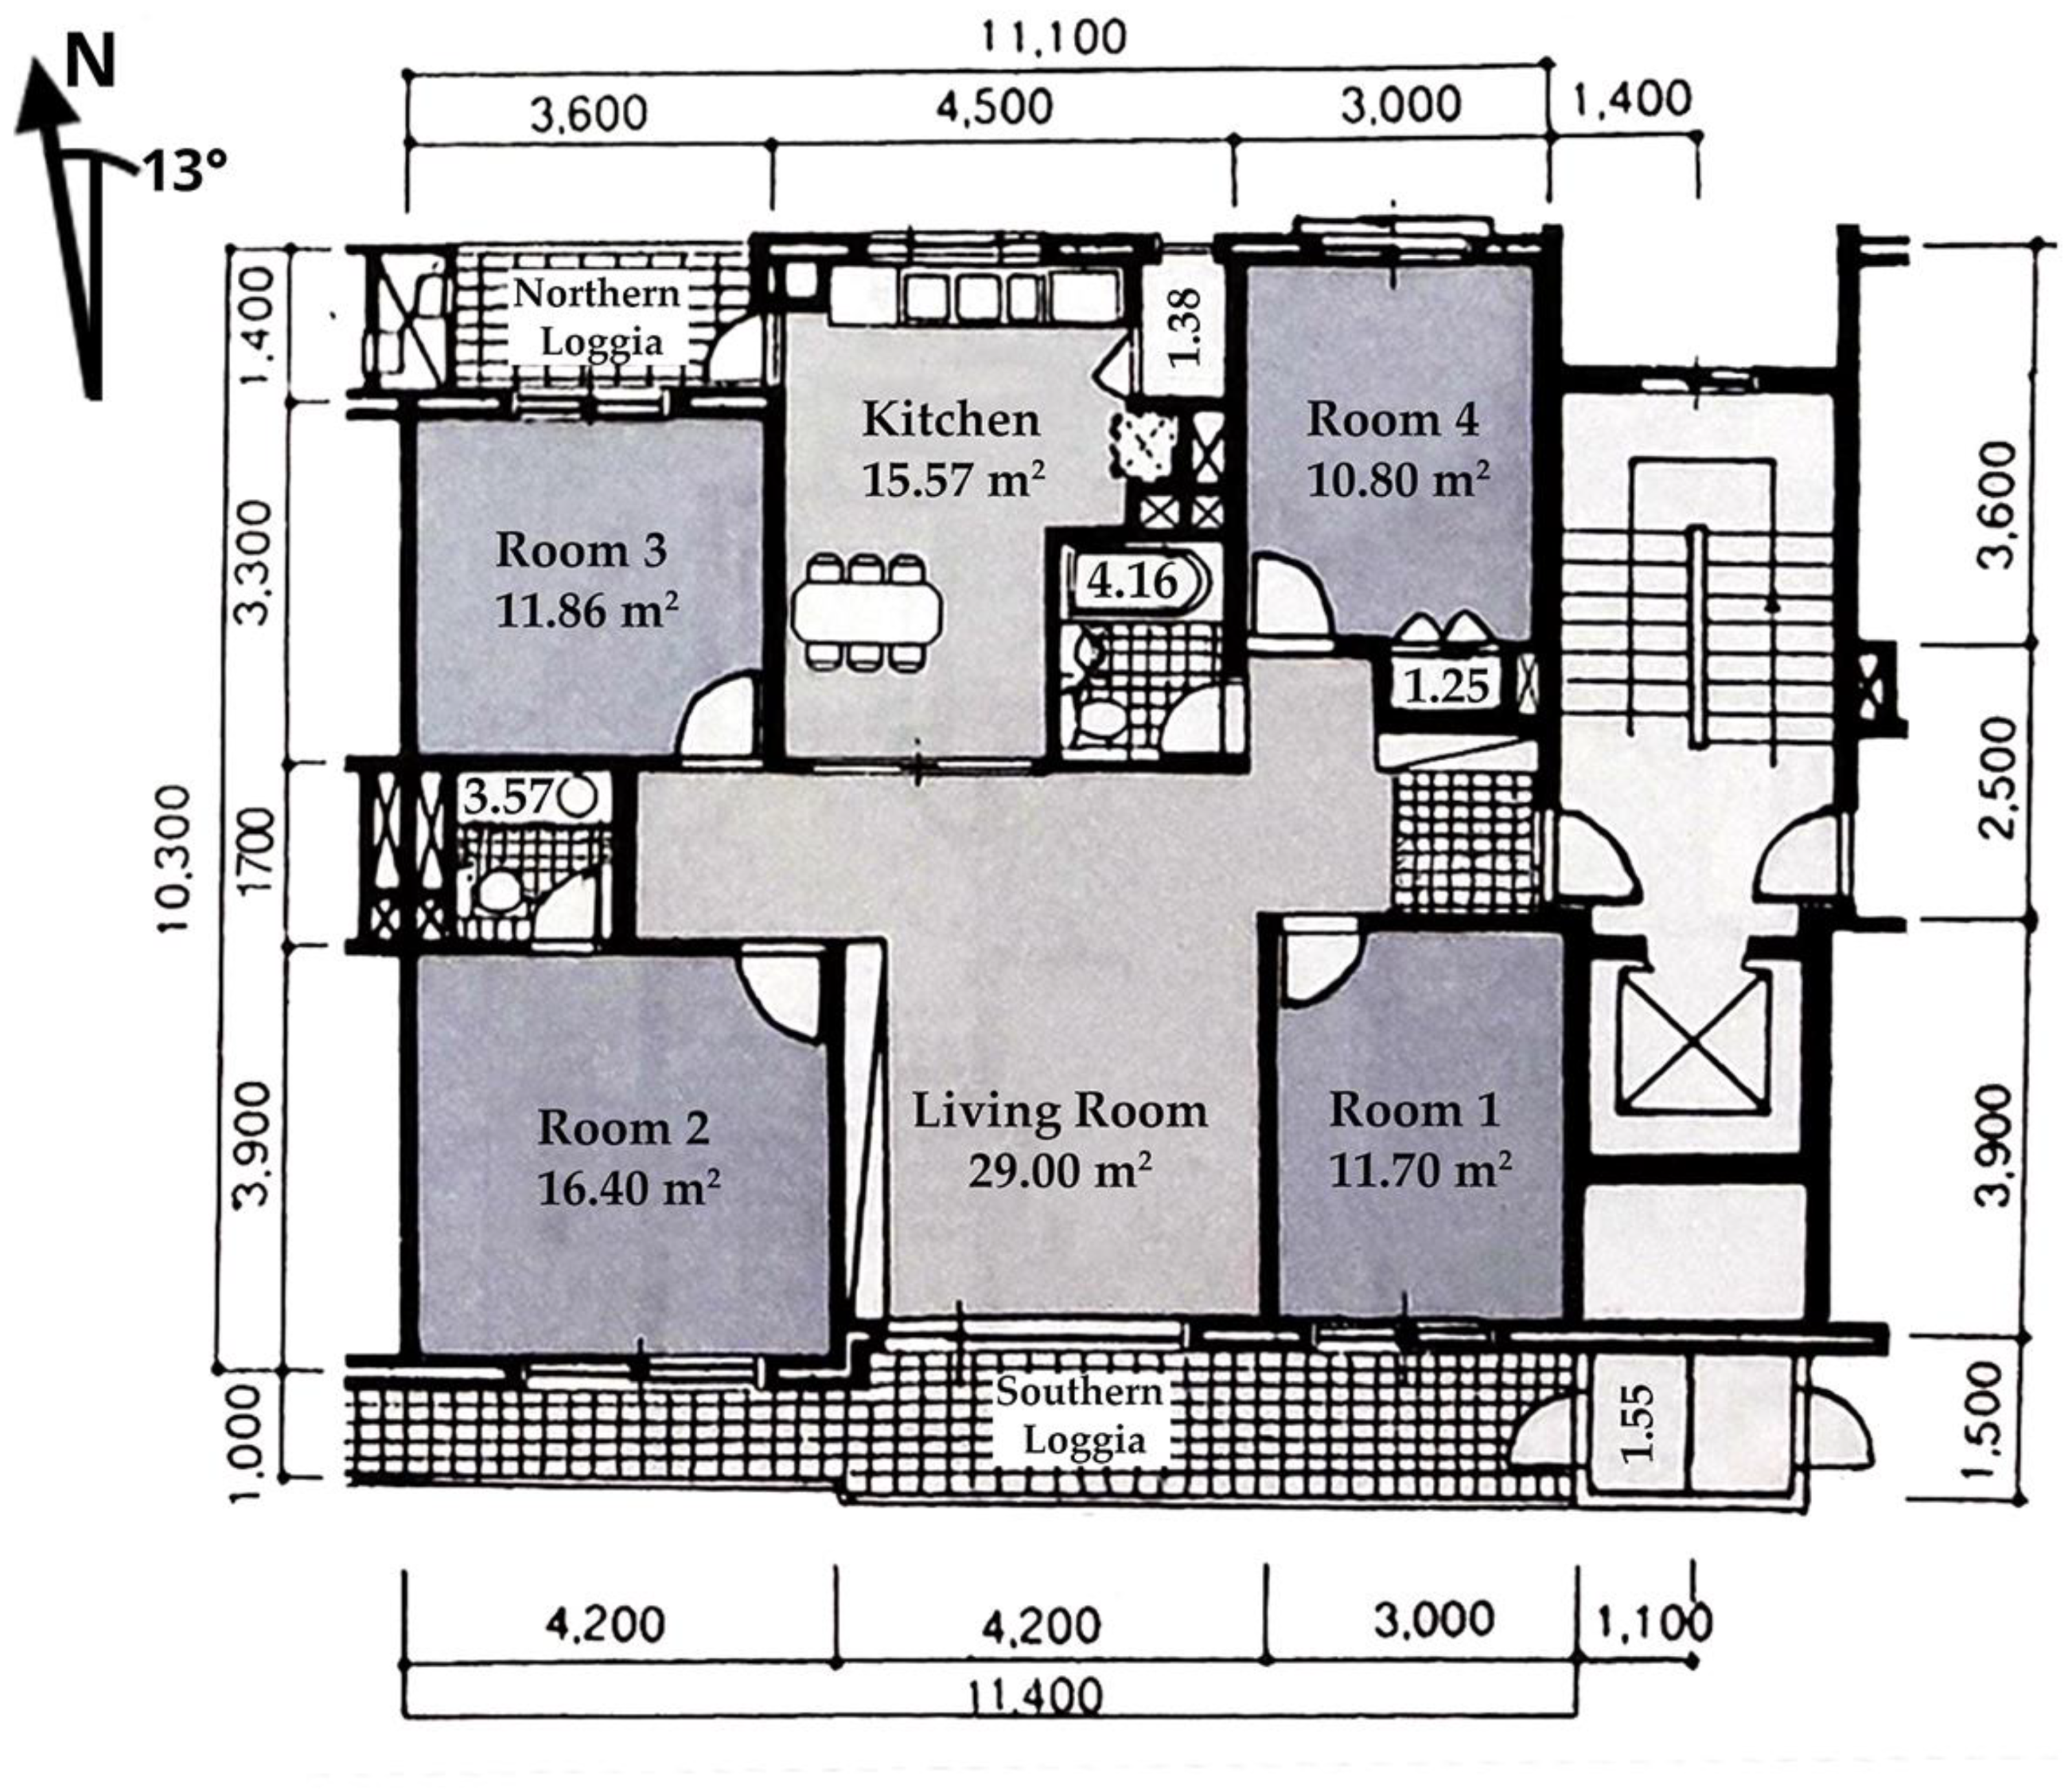
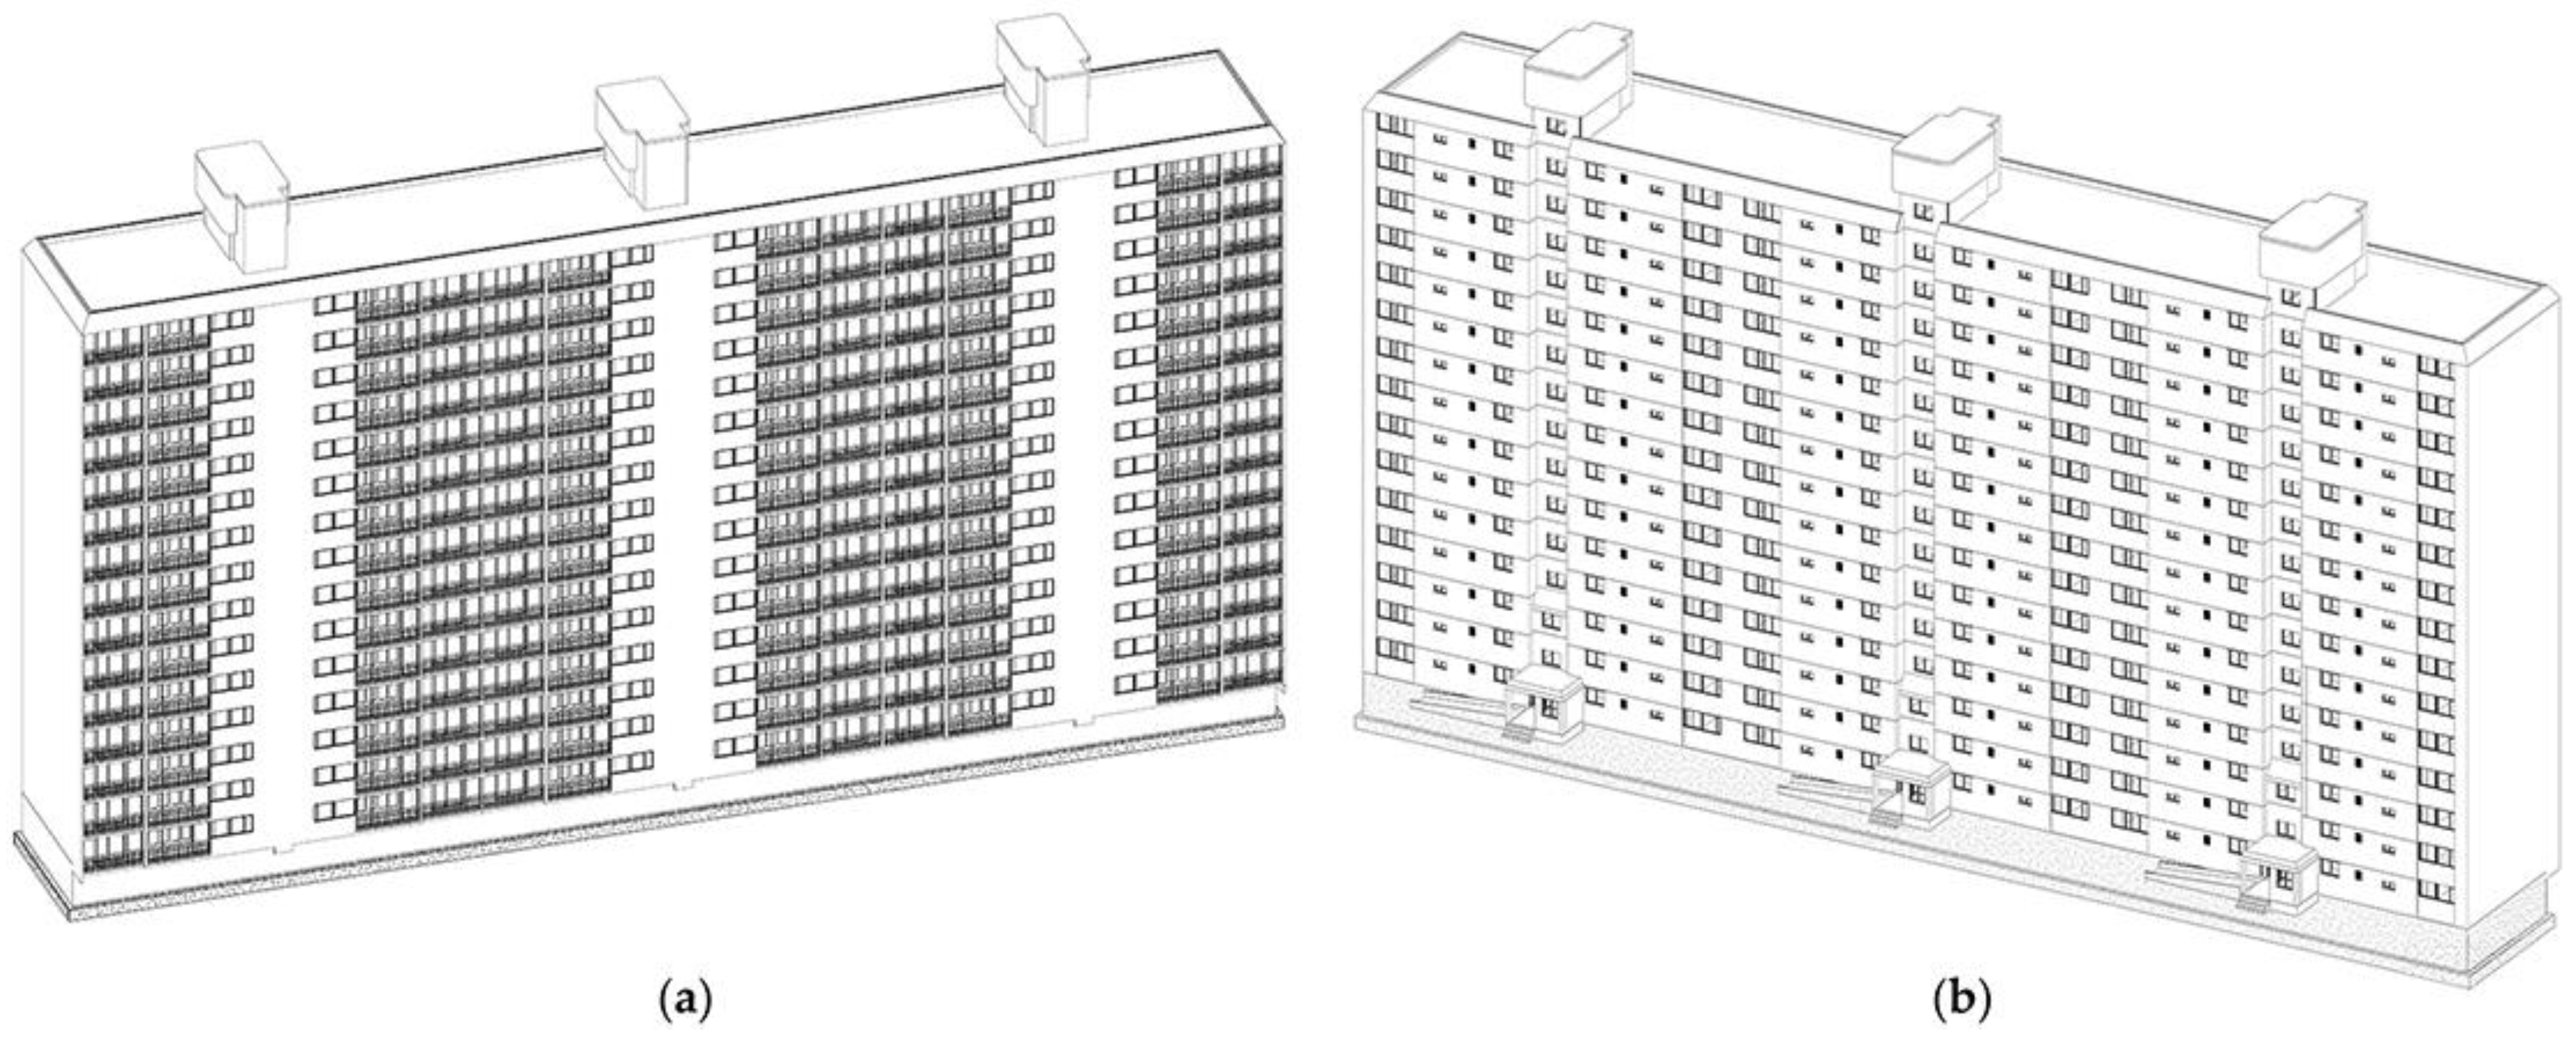
- Virtual building reconstruction using BIM: Virtual reconstruction of the existing apartment building and the surrounding basic conditions using the BIM software Revit. The building consisted of the horizontal and vertical repetition of a single apartment unit.
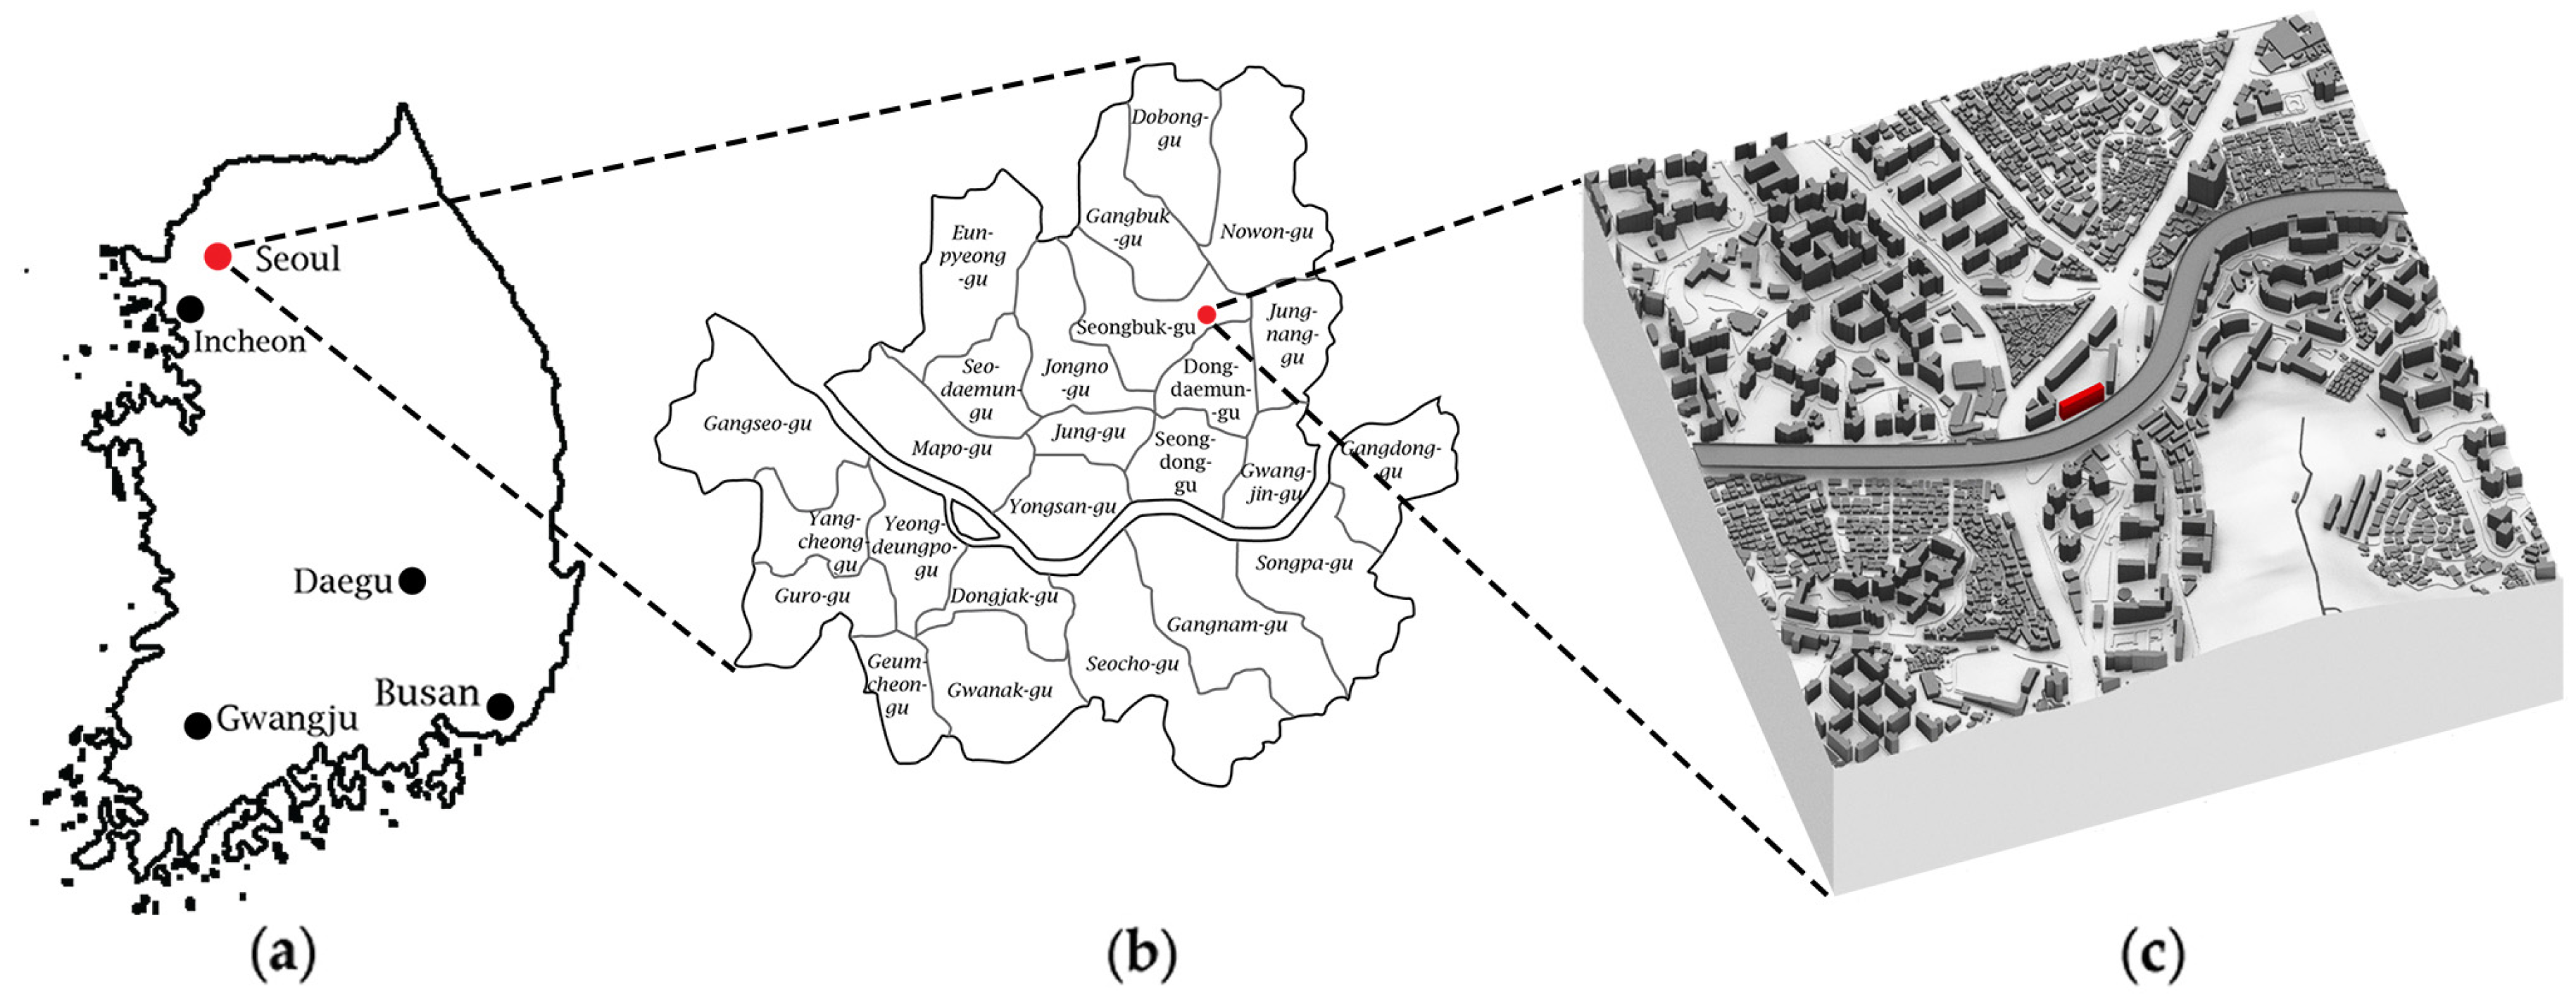
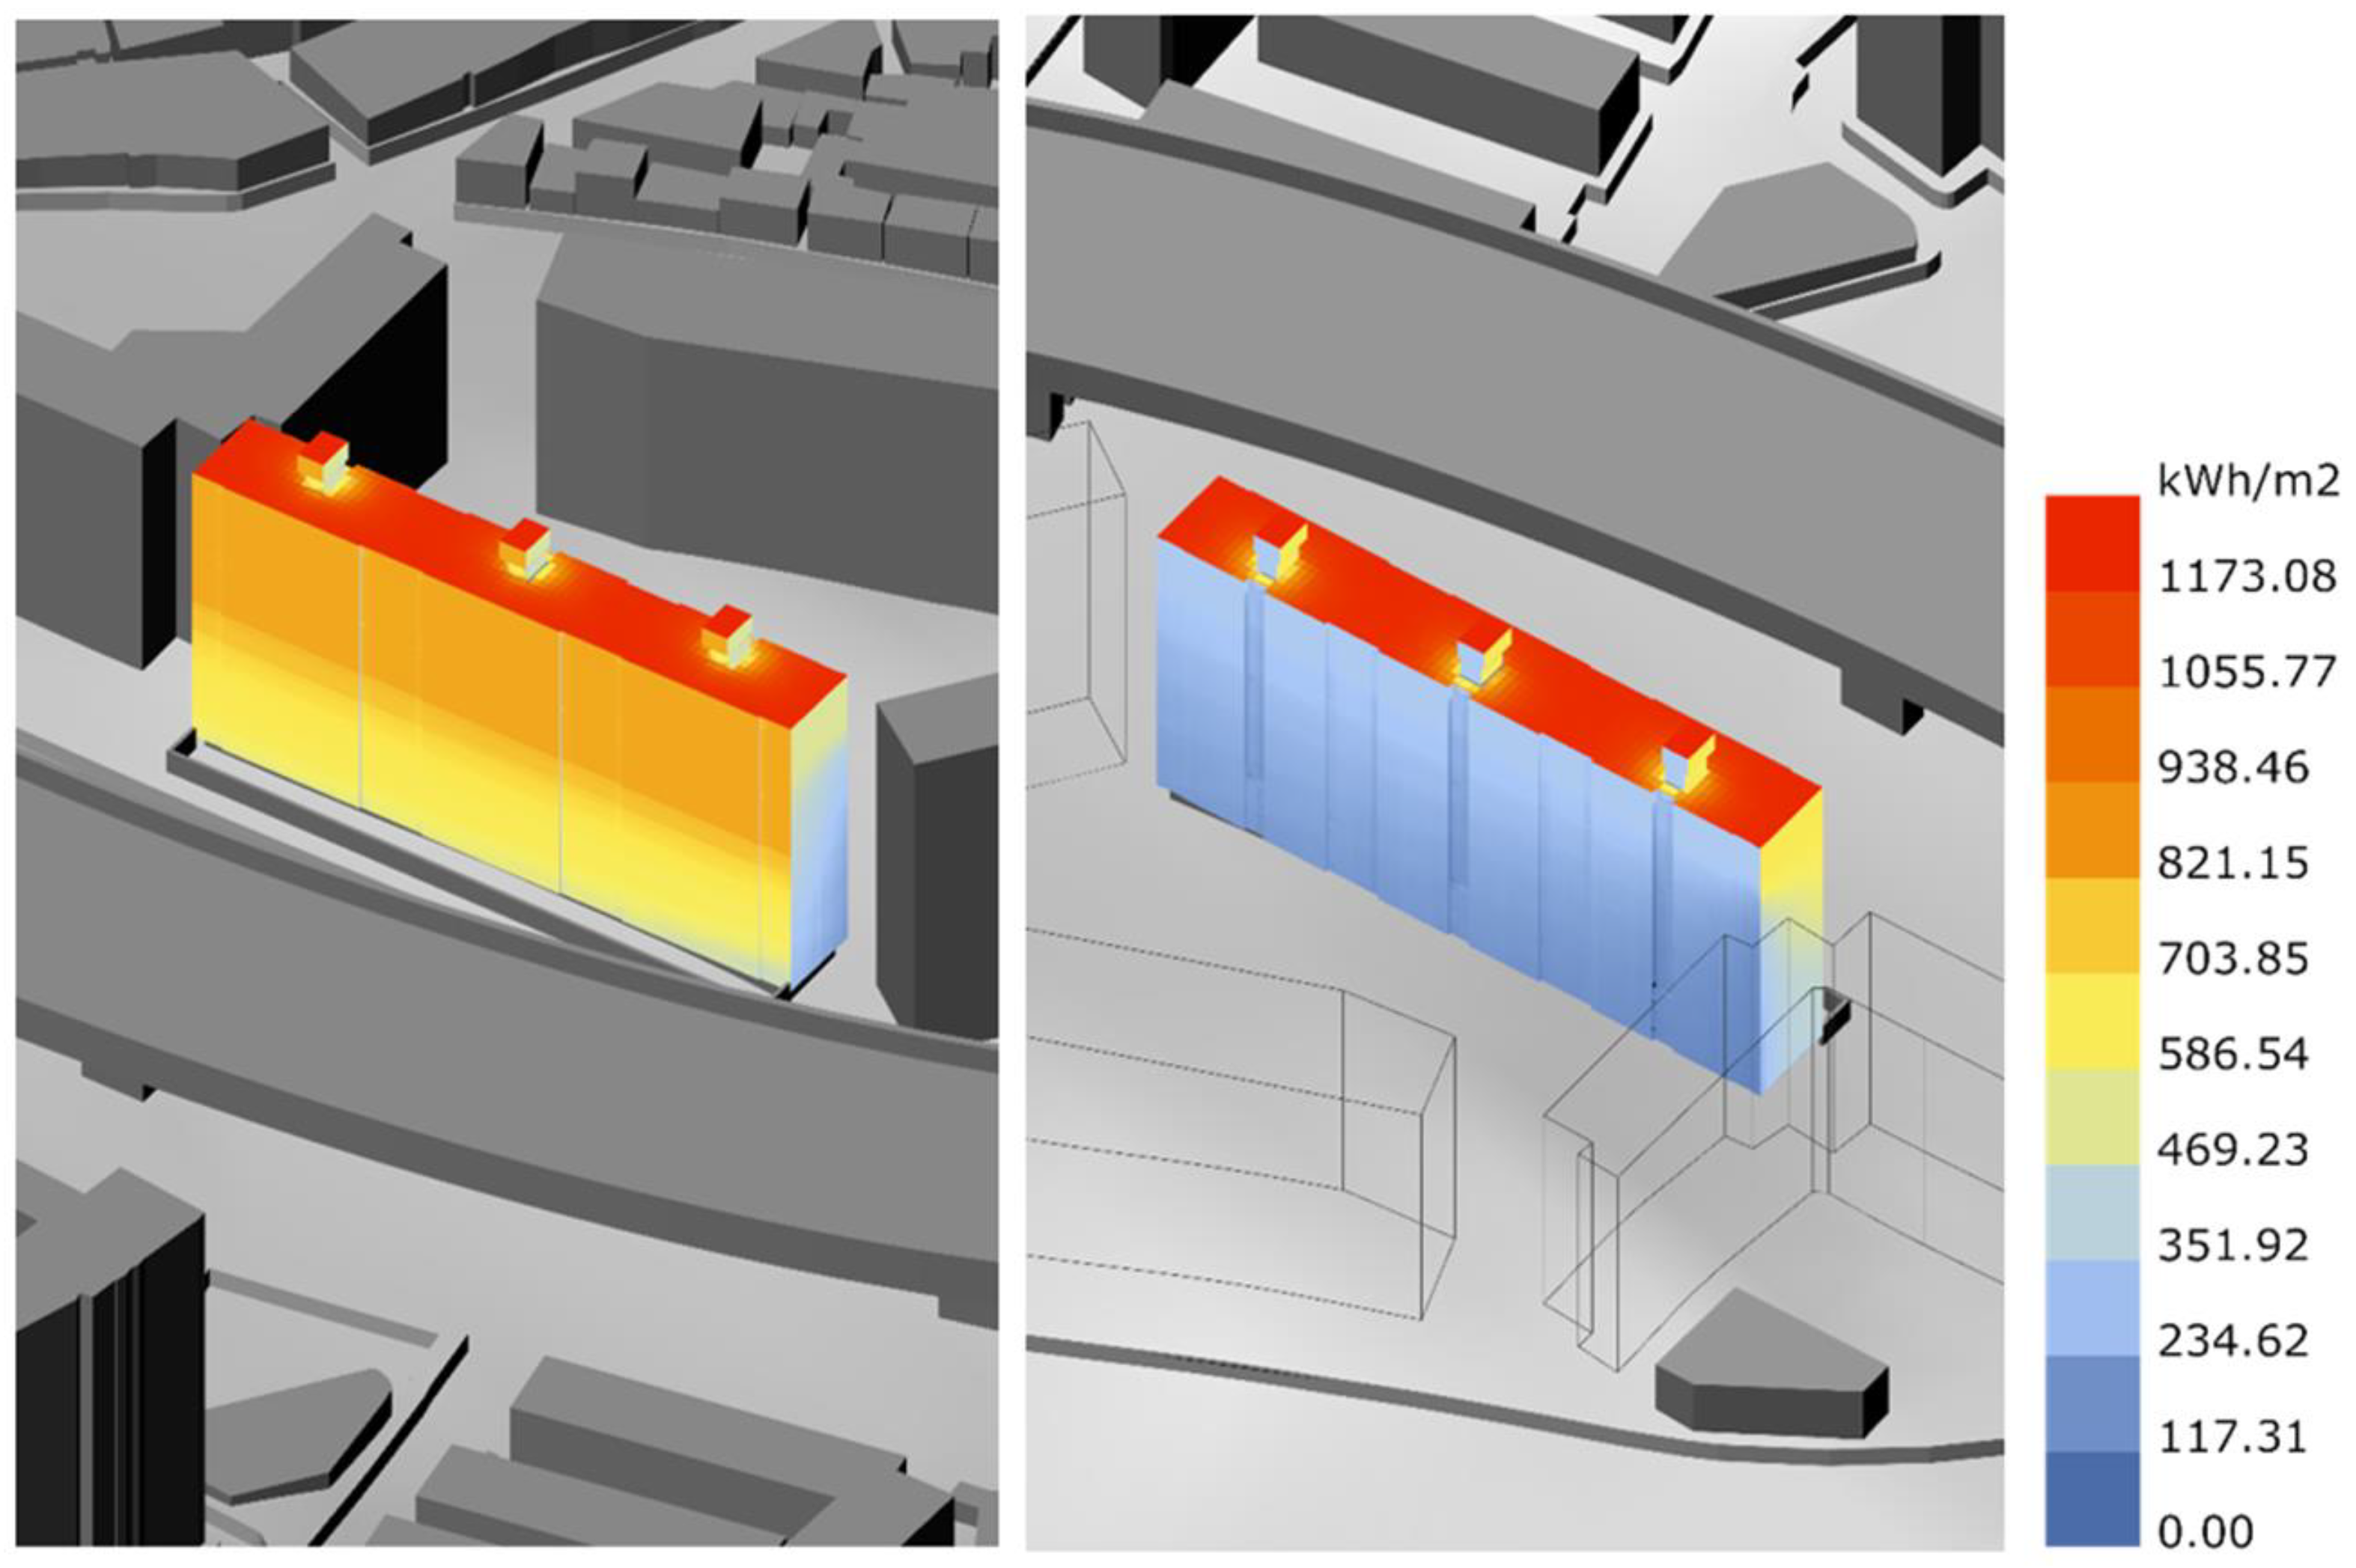
- Climate and solar radiation analysis of the building site: The analysis of the sun path for the climate zone of Seoul and calculation of incident solar radiation on the envelope of building 103 were executed by subdividing the building envelope in sensor areas of maximum 1 × 1 m.
- Building envelope analysis: Calculation of U-values for single material layers and opaque constructions with Energyplus; calculation of glazing g-values and cumulative U-values for window frames and glass panels with WINDOW.
- Energy analysis: Using the parametric interface for the software Energyplus, a zone-based energy analysis of a reference apartment unit in the building was conducted to provide an assessment of the energy demand for heating and cooling. Internal and external heat gains and losses due to infiltration and ventilation based on the existing building conditions were included in the analysis. Occupation, ventilation, heating and cooling set points schedules for the apartment were defined based on apartment users’ behaviour and occupation modeling.
- Thermal comfort analysis: Calculation of the indoor comfort conditions were executed according to the adaptive comfort model (EN 15251 comfort class II [64]) on the basis of temperature results from the Energyplus simulation and climate data for Seoul. The Energyplus simulation results included zoned air and mean radiant temperatures, as well as relative humidity. The adaptive model was adjusted in order to take into account technical heating and cooling, and natural ventilation in the thermal balance of the apartment. For the adjustment of the adaptive model a hybrid evaluation method was defined, with a ratio of 0.3/0.7 between technical heating and cooling and natural ventilation. The use of mixed adaptive comfort models [63] is currently not specified in the adaptive comfort standards (ASHRAE 55 2007 and EN 15251 2007). However, different studies have approached the problem of including both active and passive means of heating and cooling in building simulation modeling. Accordingly, hybrid adaptive comfort models have been recently proposed [65,66]. The parametric tool Ladybug automatically adjusted comfort thresholds in relation to the introduction of active heating and cooling systems in the adaptive model. The defined ratio represented the respective influence in terms of internal temperature change between passive and active means of heating and cooling, accounting for the use of variable heating and cooling set points and defining a non-linear indoor comfortable temperature range that varied depending on the outside temperatures. To evaluate the level of comfort for apartment indoors, a constant metabolic rate of 1.2 met and different levels for occupants ‘clothing, ranging from 0.45 (light t-shirt and short pants for summer) to 1 (three-pieces suit for winter), were determined by hourly temperatures. The time threshold for the annual comfort analysis was defined by users’ satisfaction during 90% of hours. An overall comfort map that quantifies the amount of comfort hours per year for each room was calculated for different periods of the year. The calculation was based on simulations that were executed for 50 × 50 cm subdivisions of a horizontal grid that covers all rooms of the apartment unit.
- Development of improvement strategies: Based on the results from previous simulations, different strategies for the improvement of the building envelope, indoor comfort and energy efficiency were developed. Potential measures associated with the renovation and optimization of the building envelope include:
- The extension of rooms adjacent to existing loggia spaces into the loggia spaces by removal of separating windows.
- Addition of new storage rooms in the middle interior zones of the apartment in order to compensate for the storage space previously provided on the loggias.
- Improvement of the building envelope’s thermal insulation.
- Improvement of the building envelope’s window-to-wall ratio.
- Improvement of the building envelope’s windows and doors.
- Integration of external shading systems for transparent building envelope components.
- Integration of BIPV modules in the building envelope for renewable electricity production.
- Quantification of improvements: The comparison of simulation results from the existing apartment building and simulation results from the renovated apartment building with optimized building envelope facilitated the quantification of energy demand reduction improvement of indoor comfort for the following indicators:
- Energy demand for heating and cooling
- Comfort hours according to the adaptive comfort model
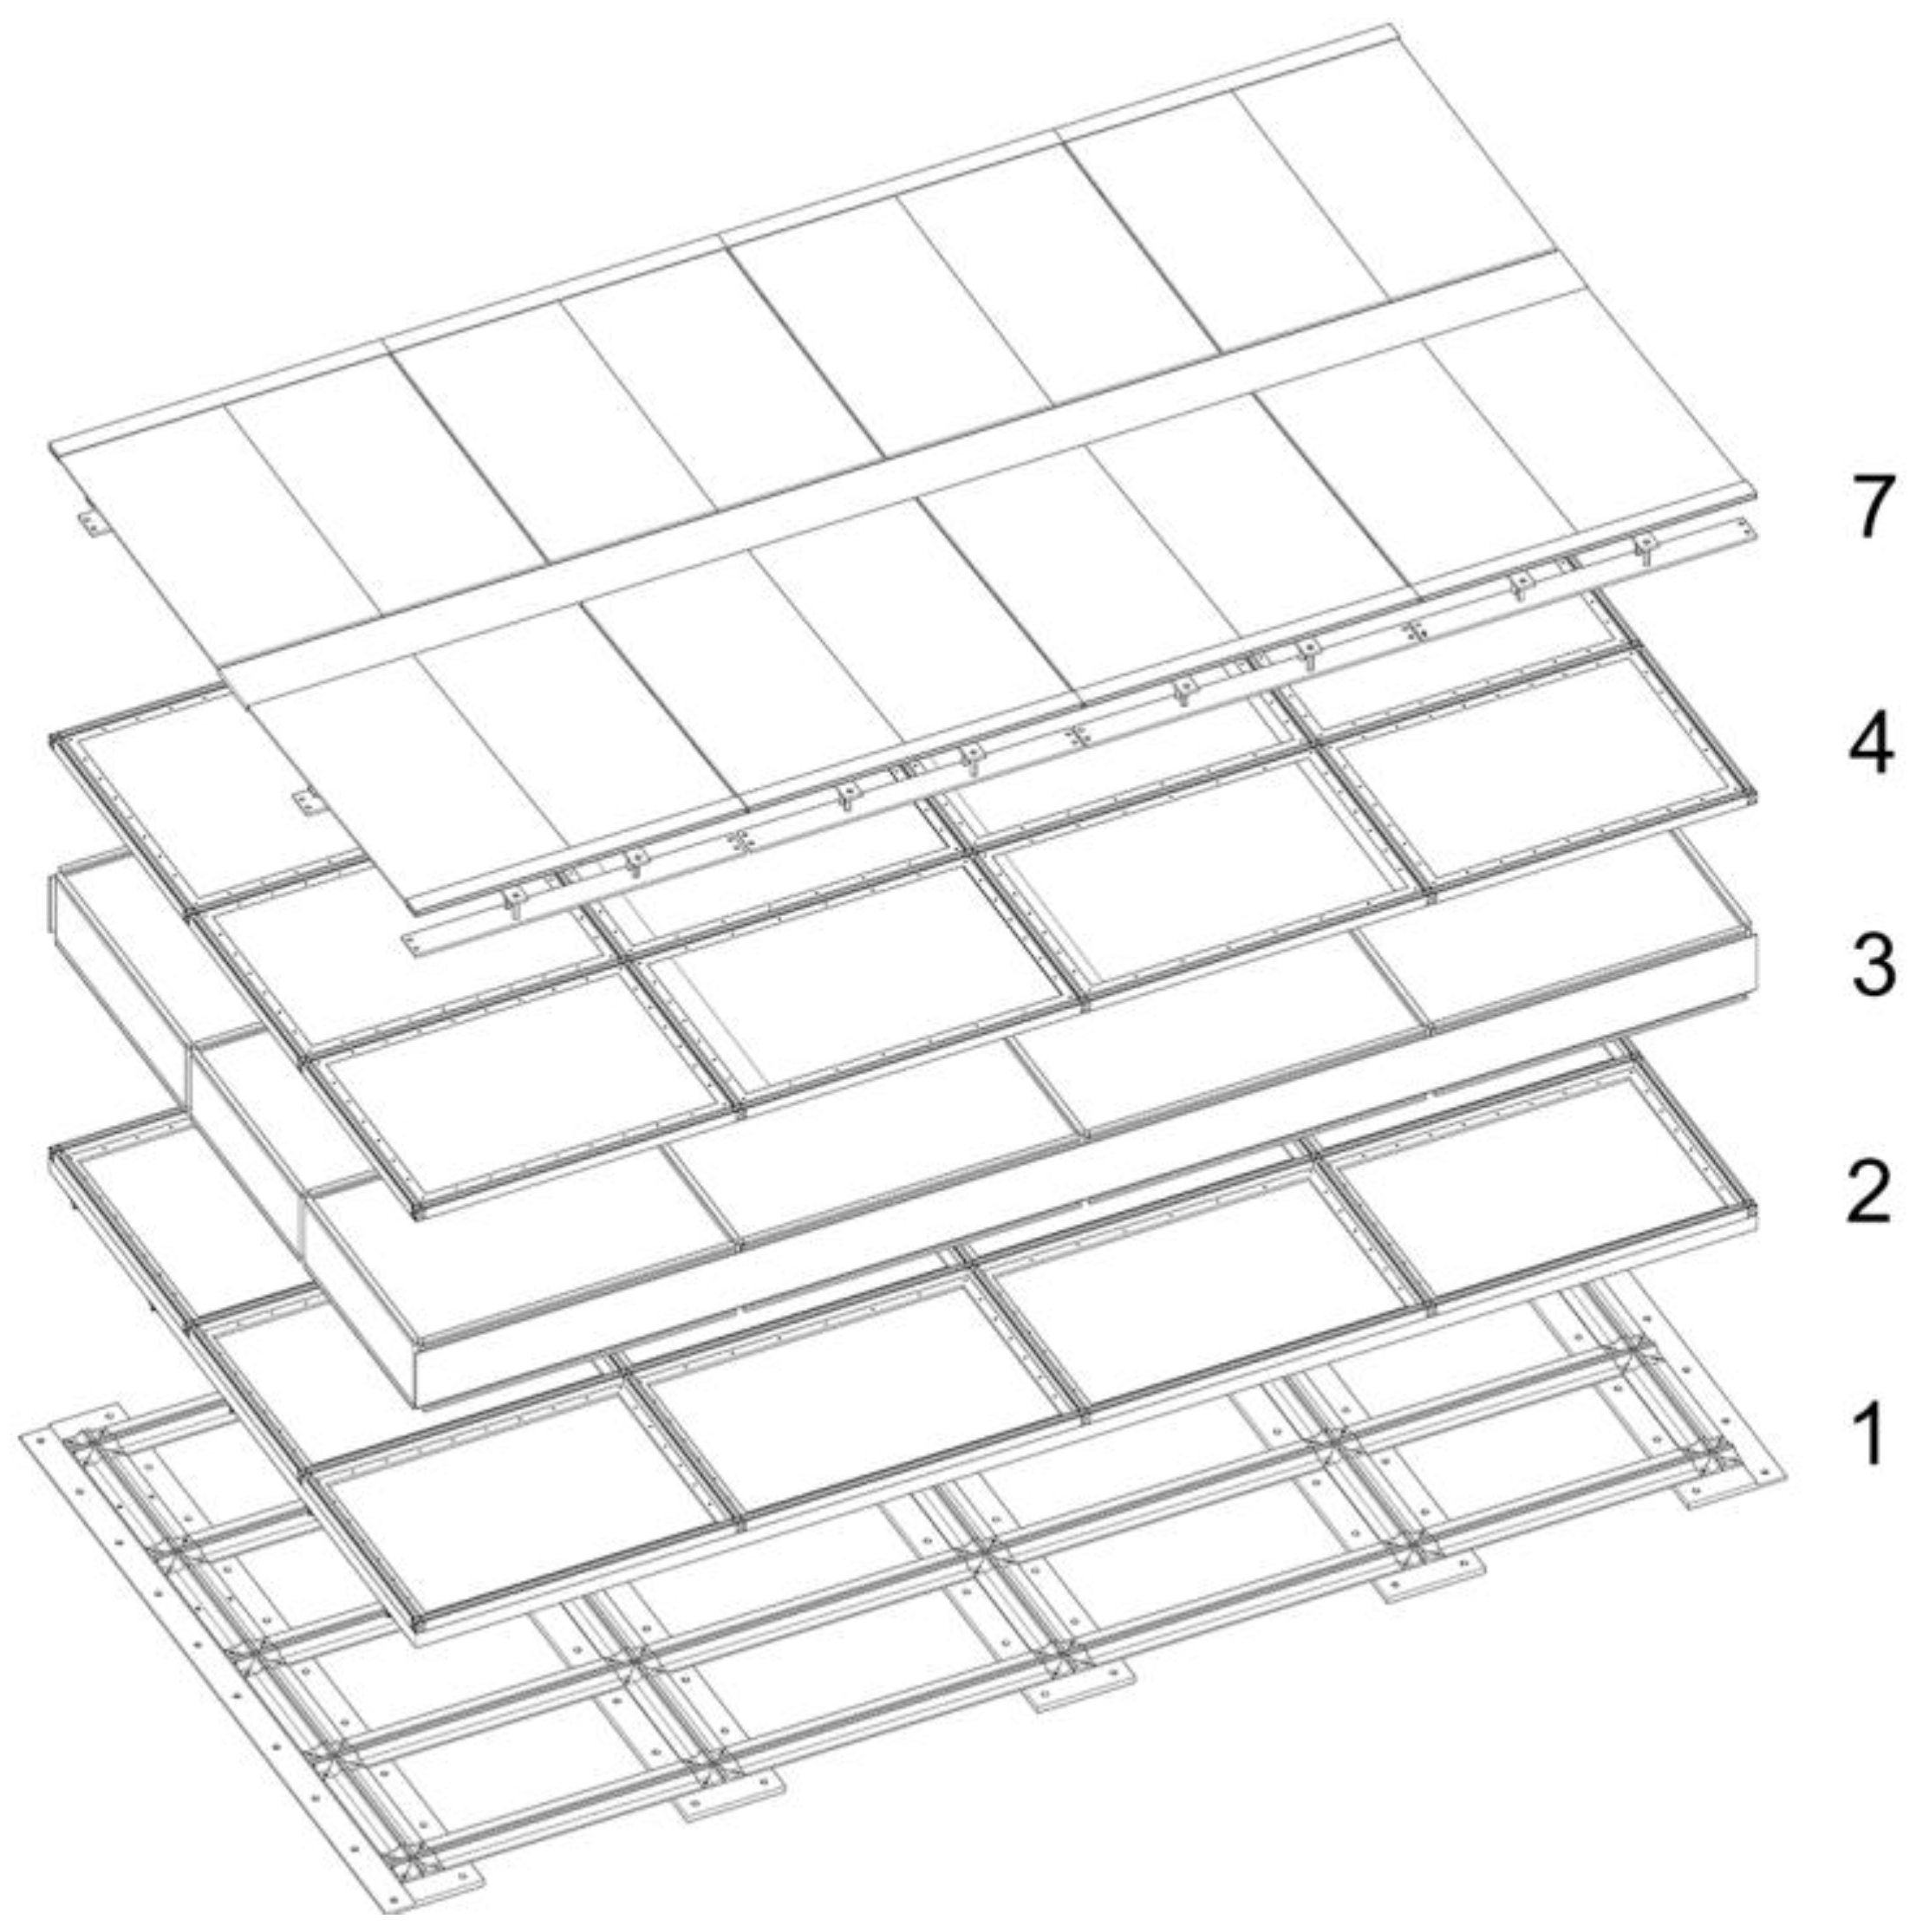
For the existing apartment and the renovated apartment building the same basic conditions, such as operation schedules (occupation, ventilation, heating and cooling) and users’ behaviour were assumed. - Virtual building renovation construction using BIM: The BIM model of the existing building was modified and updated in order to create a virtual building renovation model that was based on selected previously described and quantified building renovation measures. The new building envelope components were determined, constructed and assembled in the virtual BIM model using exported geometries parametrically generated in Rhinoceros according to the improved building envelope construction layers defined with the Ladybug tools. The result was a complete BIM model of the renovated apartment building.
- Quantification of renewable electricity production: The potential renewable electricity production with BIPV was calculated in average over the period of one year with a dedicated parametric component from Ladybug. The result was balanced with the yearly average final energy demand for heating and cooling of the renovated apartment building.
3. Results
3.1. Existing Apartment Building Description
3.2. BIM Model of Apartment Building 103
3.3. Climate and Solar Radiation Analysis
3.4. Existing Building Envelope Analysis
3.5. Energy and Thermal Comfort Analysis of Existing Apartment Layout
3.5.1. Building Energy Simulation Operation Schedules
3.5.2. Simulation Model
3.5.3. Heating Energy Demand Simulation
3.5.4. Cooling Energy Demand Simulation
3.5.5. Adaptive Comfort Map of the Apartment Unit
3.6. Definition of Building Envelope Improvement Measures
3.7. Energy and Thermal Comfort Analysis of Renovated Apartment Layout with Improved Envelope
3.7.1. Heating Energy Demand Simulation
3.7.2. Cooling Energy Demand Simulation
3.7.3. Adaptive Comfort Map of the Renovated Reference Apartment Unit
3.8. BIM Model of Renovated Apartment Building 103
- (i)
- 7 component types were developed for the north and south façade component category, both with and without windows. In the south façade, components with BIPV modules sound refraction elements were applied. In the north façade, panels made of recycled plastic were uses instead of BIPV modules. Panels of this category were also applied to the staircases of the three apartment core units and included access doors for the rooftop. The total number of applied components was 585.
- (ii)
- 3 component types were developed for the roof components that were also equipped with BIPV panels. The total number of applied components was 211.
- (iii)
- 6 component types were developed for the east and west façade and connection component category. The components were installed on the east and west facades of the building, as well as in the connecting areas. The concerned connections were between façades with different orientation, between the façades and the roof and between the basement wall extension and the first floor. The total number of applied components was 632.
3.9. Photovoltaic Energy Production Simulation
4. Discussion
5. Conclusions
Author Contributions
Funding
Acknowledgments
Conflicts of Interest
References
- Statistics Korea (KOSTAT). Complete Enumeration Results of the 2016 Population and Housing Census; Statistics Korea (KOSTAT): Seoul, Korea, 2016. [Google Scholar]
- Chung, I.-U. The Current Status of Old Apartments and the Remodeling Policies in Korea; Land & Housing Corporation: Seoul, Korea, 2014.
- Koh, C. Overview of Housing Policies & Programs in Korea; Korea Housing Institute: Seoul, Korea, 2004. [Google Scholar]
- Park, D.; Xiao, Q. Housing Prices and the Role of Speculation: The Case of Seoul; Asian Development Bank: Manila, Philippines, 2009. [Google Scholar]
- Kim, S.-H. A Study on the Kumhwa District Apartment Life-Changes by Daily Newspaper in Korea. J. Archit. Inst. Korea Plan. Des. 2013, 29, 99–106. [Google Scholar]
- Kim, S.A. Policy and Technology of Housing Remodeling in Korea; Korea Institute of Construction Technology: Ilsan, Korea, 2003. [Google Scholar]
- Ha, S.-K. Housing poverty and the role of urban governance in Korea. Environ. Urban. 2004, 16, 139–154. [Google Scholar] [CrossRef]
- Ha, S.K. Housing Policy and Practice in Korea; Croom Helm: London, UK, 1987. [Google Scholar]
- Smith, N. Gentrification and the rent gap. Ann. Assoc. Am. Geogr. 1987, 77, 462–465. [Google Scholar] [CrossRef]
- Shin, H.B. Property-based redevelopment and gentrification: The case of Seoul, South Korea. Geoforum 2009, 40, 906–917. [Google Scholar] [CrossRef]
- Ha, S.-K. New shantytowns and the urban marginalized in Seoul Metropolitan Region. Habitat Int. 2004, 28, 123–141. [Google Scholar] [CrossRef]
- Lee, J.Y. The Practice of Urban Renewal in Seoul, Korea: Mode, Governance, and Sustainability. In Proceedings of the 2nd International Critical Geography Conference, Taegu, Korea, 9–13 August 2000; p. 22. [Google Scholar]
- Kim, J.; Meulder, B.D. Speculative self-destruction, gateways for hyper-redevelopment in Seoul, South Korea. In Trends and Issues in Housing in Asia: Coming of an Age; Sengupta, U., Shaw, A., Eds.; Taylor & Francis: Abingdon, UK, 2017. [Google Scholar]
- Kang, H.L.; Chang, U.C.; Park, G.S. A Study on the Maintenance Cost Elasticity of the Apartment Housing. J. Korean Hous. Assoc. 2011, 22, 51–60. [Google Scholar]
- Bang Shin, H. Living on the edge: Financing post-displacement housing in urban redevelopment projects in Seoul. Environ. Urban. 2008, 20, 411–426. [Google Scholar] [CrossRef]
- Lee, S. Urban Housing Policy in Korea according to Paradigm Shift; Korea Research Institute for Human Settlements: Seoul, Korea, 2016. [Google Scholar]
- Kim, K. Housing Redevelopment and Neighborhood Change as A Gentrification Process in Seoul, Korea: A Case Study of the Wolgok-4 Dong Redevelopment District; Florida State University: Tallahassee, FL, USA, 2006. [Google Scholar]
- Kyoung, S.; Kim, K.-J. State-Facilitated Gentrification’in Seoul, South Korea for Whom, by Whom and with What Result; Research Committee 21: Amsterdam, The Netherlands, 2011. [Google Scholar]
- Lee, M.-K.; Kim, Y.-S.; Kang, S.-J.; Ryu, J.-C.; Kim, W.-D.; Han, K.-J.; Balmes, C.; Lee, Y.-H.; Kim, S.-J. Korea’s Green Growth Experience: Process, Outcomes and Lessons Learned; Global Green Growth Instittue: Seoul, Korea, 2015. [Google Scholar]
- Jänicke, M. “Green growth”: From a growing eco-industry to economic sustainability. Energy Policy 2012, 48, 13–21. [Google Scholar] [CrossRef]
- Jones, R.S.; Yoo, B. Achieving the “Low Carbon, Green Growth” Vision in Korea; OECD: Paris, France, 2012.
- Jacobs, M. The Green Economy; Pluto Press: London, UK, 1991. [Google Scholar]
- Olivier, J.; Jannsens-Maenhout, G.; Peters, J. Trends in Global CO2 Emissions; Publications Office: Luxembourg, 2012. [Google Scholar]
- Jeong, H. Sustainability Policy and Green Growth of the South Korean Construction Industry. Master’ Thesis, Texas A & M University, College Station, TX, USA, 2011. [Google Scholar]
- Schuetze, T. Zero Emission Buildings in Korea—History, Status Quo, and Future Prospects. Sustainability 2015, 7, 2745–2767. [Google Scholar] [CrossRef] [Green Version]
- Kang, H. Korean Green Building Code. Samsung Econ. Res. Inst. Q. 2010, 3, 7. [Google Scholar]
- Yoon, Y.S. Zero Energy Buildings in Korea-Korea Energy Policies for Sustainable Building. In Zero Energy Building Workshop 2012; Fraunhofer Representative Office Korea, Energy Dream Center: Seoul, Korea, 2012; Volume 1. [Google Scholar]
- Schuetze, T.; Chelleri, L. Urban Sustainability Versus Green-Washing—Fallacy and Reality of Urban Regeneration in Downtown Seoul. Sustainability 2016, 8, 33. [Google Scholar] [CrossRef]
- Park, M.; Tae, S. Suggestions of Policy Direction to Improve the Housing Quality in South Korea. Sustainability 2016, 8, 438. [Google Scholar] [CrossRef]
- Ko, Y.; Schubert, D.K.; Hester, R.T. A Conflict of Greens: Green Development versus Habitat Preservation—The Case of Incheon, South Korea. Environ. Sci. Policy Sustain. Dev. 2011, 53, 3–17. [Google Scholar] [CrossRef]
- Ko, Y.; Schubert, D.K. “Green” New Deal Projects Threaten Korea’s Rivers and Tidal Flats. In International Rivers-People-Water-Life; International Rivers: Oakland, CA, USA, 2011. [Google Scholar]
- Lee, B.S.; Chung, E.-C.; Kim, Y.H. Dwelling Age, Redevelopment, and Housing Prices: The Case of Apartment Complexes in Seoul. J. Real Estate Financ. Econ. 2005, 30, 55–80. [Google Scholar] [CrossRef]
- Cha, H.S.; Kim, K.H.; Kim, C.K. Case Study on Selective Demolition Method for Refurbishing Deteriorated Residential Apartments. J. Constr. Eng. Manag. 2012, 138, 294–303. [Google Scholar] [CrossRef]
- Jeong, Y.-S.; Lee, S.-E.; Huh, J.-H. Estimation of CO2 emission of apartment buildings due to major construction materials in the Republic of Korea. Energy Build. 2012, 49, 437–442. [Google Scholar] [CrossRef]
- Shin, H.B.; Kim, S.-H. The developmental state, speculative urbanisation and the politics of displacement in gentrifying Seoul. Urban Stud. 2015, 53, 540–559. [Google Scholar] [CrossRef] [Green Version]
- Kim, J.-H.; Kim, H.-J.; Yoo, S.-H. Consumers’ Willingness to Pay for Net-Zero Energy Apartment in South Korea. Sustainability 2018, 10, 1564. [Google Scholar] [CrossRef]
- Park, W.-J.; Kim, H.-M. Study on the Improvement of Expected Energy Savings and Actual Energy Savings in Apartments. Sustainability 2018, 10, 1089. [Google Scholar] [CrossRef]
- Bucoń, R.; Tomczak, M. Decision-making model supporting the process of planning expenditures for residential building renovation. Technol. Econ. Dev. Econ. 2018, 24, 1200–1214. [Google Scholar] [CrossRef]
- Hyun Hong, J.; Jun Yeom, D.; Ji Choi, S.; Suk Kim, Y. A Study of the Decision Support Model to Select an Appropriate Alternative Plan in Apartment Remodeling. J. Archit. Inst. Korea Struct. Constr. 2017, 33, 41–50. [Google Scholar] [CrossRef]
- Shin, H.-I. A Study on the Energy Consumption and their Patterns in Apartment Housing Units Size and Orientation. J. Archit. Inst. Korea Plan. Des. 2016, 32, 231–240. [Google Scholar] [CrossRef]
- Choi, I.Y.; Cho, S.H.; Kim, J.T. Energy consumption characteristics of high-rise apartment buildings according to building shape and mixed-use development. Energy Build. 2012, 46, 123–131. [Google Scholar] [CrossRef]
- Kim, Y.-I.; Song, S.-Y. Energy Consumption status of Apartment Buildings and Influence of Various Factors on Energy Consumption. J. Korean Sol. Energy Soc. 2014, 34, 93–102. [Google Scholar] [CrossRef] [Green Version]
- Jeong, Y.-S.; Jung, H.-K.; Yu, K.-H. Energy Consumption Assessment of Reference Apartment House Using Simulation. J. Archit. Inst. Korea 2014, 34, 407–408. [Google Scholar]
- Lee, W.-J.; Kang, E.-C.; Lee, E.-J.; Oh, B.-C.; Shin, U.-C. Case Study on the Energy Consumption Unit of District Apartments. Korean J. Air-Cond. Refrig. Eng. 2014, 26, 474–480. [Google Scholar] [Green Version]
- Yeo, M.-S.; Yang, I.-H.; Kim, K.-W. Historical changes and recent energy saving potential of residential heating in Korea. Energy Build. 2003, 35, 715–727. [Google Scholar] [CrossRef]
- Kim, S.; Lee, D.; Hong, H. An Energy Saving Technique Using Ondol Heating Schedule Control of Housing Units in Korea. Indoor Built Environ. 2010, 19, 88–93. [Google Scholar] [CrossRef]
- Park, S.-H.; Lee, S.-H.; Park, J.-C.; Rhee, E.-K.; Cho, K.-H. A Survey on Energy Consumption through Operational Level in Apartment Buildings. J. Archit. Inst. Korea Plan. Des. 2014, 30, 233–240. [Google Scholar] [CrossRef]
- Cho, S.-H.; Kang, J.-S.K.; Choi, G.-S. Energy Performance Evaluation of External Insulation System for Post Remodeling in Apartment Buildings. In Proceedings of the SAREK 2016 Summer Annual Conference, Seoul, Korea, 5–7 July 2016; pp. 176–178. [Google Scholar]
- Kim, D.S.; Yoon, J.H.; Shin, C.U.; Kwak, H.Y. A study on the annual energy performance of apartment building with the equivalent U-value of envelope considering the effect of thermal bridges. KIEAE J. 2012, 12, 41–46. [Google Scholar]
- Kim, S.-H.; Lee, J.-G.; Kim, Y.-T.; Lee, K.-H. Energy Load according to the Units of Apartment House. J. Korean Soc. Power Syst. Eng. 2015, 19, 78–83. [Google Scholar] [CrossRef] [Green Version]
- Hye-Soo, S.; Byung-Seo, K. A Comparative Analysis of Energy Simulation Results and Actual Energy Consumption on Super High-rise Apartments. J. Korean Sol. Energy Soc. 2011, 31, 34–40. [Google Scholar] [Green Version]
- Kim, J.; Ryu, J.; Choo, S. An Analysis on Effectiveness of BIM-based Area Calculation Method for Improving Quality of Korean Apartment Housing. J. Korean Hous. Assoc. 2013, 24, 45–52. [Google Scholar]
- Kim, H.; Lee, J.K. BIM-Enabled Evaluation of Design Alternatives in Design Phase for Remodeling Project-Based on an Actual Apartment Case in Yeongwol. Available online: http://www.dbpia.co.kr/Article/NODE06554747 (accessed on 20 November 2018).
- Khemlani, L. Autodesk Revit: Implementation in Practice; White Paper; Autodesk: San Rafael, CA, USA, 2004. [Google Scholar]
- McNeel, R. Grasshopper Generative Modeling for Rhino. Computer Software (2011b). Available online: http://www.grasshopper3d.com (accessed on 20 November 2018).
- Fylstra, D.; Lasdon, L.; Watson, J.; Waren, A. Design and Use of the Microsoft Excel Solver. Interfaces 1998, 28, 29–55. [Google Scholar] [CrossRef]
- Mans, D.B. Bumblebee. Available online: https://www.grasshopper3d.com/group/bumblebee (accessed on 21 September 2018).
- Roudsari, M.S.; Pak, M. Ladybug: A parametric environmental plugin for grasshopper to help designers create an environmentally conscious design. In Proceedings of the 13th International IBPSA Conference, Lyon, France, 25–30 August 2013. [Google Scholar]
- LBNL. LBNL, WINDOW 7beta: PC Program for Analyzing Window Thermal Per-Formance; LBNL: Berkeley, CA, USA, 2012.
- Finlayson, E.; Mitchell, R.; Arasteh, D.; Huizenga, C.; Curcija, D. THERM 2.0: Program Description. A PC Program for Analyzing the Two-Dimensional Heat Transfer through Building Products; LBL-37371 Rev.; Lawrence Berkeley National Laboratory: Berkeley, CA, USA, 1998.
- Larson, G.W.; Shakespeare, R. Rendering With Radiance: The Art and Science of Lighting Visualization; Booksurge LLC: Charleston, SC, USA, 2004. [Google Scholar]
- Crawley, D.B.; Lawrie, L.K.; Winkelmann, F.C.; Buhl, W.F.; Huang, Y.J.; Pedersen, C.O.; Strand, R.K.; Liesen, R.J.; Fisher, D.E.; Witte, M.J.; et al. EnergyPlus: Creating a new-generation building energy simulation program. Energy Build. 2001, 33, 319–331. [Google Scholar] [CrossRef]
- De Dear, R. Recent enhancements to the adaptive comfort standard in ASHRAE 55-2010. In Proceedings of the 45th Annual Conference of the Architectural Science Association, Sydney, Australia, 16–19 November 2011. [Google Scholar]
- CEN. EN 15251-Indoor Environmental Input Parameters for Design and Assessment of Energy Performance of Buildingsaddressing Indoor Air Quality, Thermal Environment, Lighting and Acoustics; CEN: Brussels, Belgium, 2007. [Google Scholar]
- Deuble, M.P.; de Dear, R.J. Mixed-mode buildings: A double standard in occupants’ comfort expectations. Build. Environ. 2012, 54, 53–60. [Google Scholar] [CrossRef]
- Van der Linden, A.C.; Boerstra, A.C.; Raue, A.K.; Kurvers, S.R.; de Dear, R.J. Adaptive temperature limits: A new guideline in The Netherlands: A new approach for the assessment of building performance with respect to thermal indoor climate. Energy Build. 2006, 38, 8–17. [Google Scholar] [CrossRef]
- Han, S.; Lee, G. A Quantitative Analysis of the Apartment Unit types in South Korea. J. Hous. Sci. 2010, 34, 8. [Google Scholar]
- VV., A. Apartment Encyclopedia (Seoul and Bundang/Ilsan); Seijn Planning: Seoul, Korea, 1998; Volume 2, p. 259. [Google Scholar]
- Park, B.-I.; Seok, H.-T.; Kim, K.-W. The historical changes of ONDOL. Mag. Soc. Air-Cond. Refrig. Eng. Korea 1995, 24, 613–627. [Google Scholar]
- Jeon, N. Spatial History of Housing in South Korea (Hangukjugeogonggansa); Dolbaegae: Paju, Korea, 2008. [Google Scholar]
- Tae, S.; Shin, S. Current work and future trends for sustainable buildings in South Korea. Renew. Sustain. Energy Rev. 2009, 13, 1910–1921. [Google Scholar] [CrossRef]
- Il, I.K. A comparative Study on Apartment Unit Plans of SH Corporation and Private Construction Company in the Housing Development District; Seoul City University: Seoul, Korea, 2013. [Google Scholar]
- Schuetze, T. Passive Houses in Korea; Sungkyunkwan University: Seoul, Korea, 2017. [Google Scholar]
- Kim, J.; Chun, J.; Lee, B. Study about Change of Insulation Standard in Apartment in Its Effect. J. Archit. Inst. Korea 2009, 11, 125–132. [Google Scholar]
- Yoon, S.; Jang, H.; Kim, Y. Analysis on the Characteristics of Thermal Load classified by the Household Location in Apartment House. J. Archit. Inst. Korea Plan. Des. 2009, 25, 289–296. [Google Scholar]
- ASHRAE. ANSI/ASHRAE Standard 62.1-2010. Ventilation for Acceptable Indoor Air Quality; American Society of Heating, Refrigerating, and Air-Conditioning Engineers, Inc.: Altanta, GA, USA, 2010. [Google Scholar]
- Maddalena, R.; Mendell, M.J.; Eliseeva, K.; Chan, W.R.; Sullivan, D.P.; Russell, M.; Satish, U.; Fisk, W.J. Effects of ventilation rate per person and per floor area on perceived air quality, sick building syndrome symptoms, and decision-making. Indoor Air 2015, 25, 362–370. [Google Scholar] [CrossRef] [PubMed]
- O’Neill, Z.; Narayanan, S.; Brahme, R. Model-based thermal load estimation in buildings. In Proceedings of the Fourth National Conference of IBPSA-US, New York, NY, USA, 11–13 August 2010. [Google Scholar]
- Choi, Y.J.; Shim, H.S.; Jeong, Y.H. Elements and Actual Condition of Apartment Unit Remodeling-By In-depth Interviews on Residents and Specialists of Interior Design Companies. J. Korean Hous. Assoc. 2007, 18, 57–67. [Google Scholar]
- Seo, B.K.; Choi, J.O. A Study on Tendency of Extended Balcony Unit Plans of LH Corp. J. Korean Inst. Inter. Des. 2011, 20, 146–153. [Google Scholar]
- Seong, B.M.; Kim, W.P. A Study on Residential Satisfaction with Diversion of Expanded Balcony Area at Multi-family Housing through Residents’ Survey. J. Archit. Inst. Korea Plan. Des. 2011, 27, 317–324. [Google Scholar]
- Park, C.-S. Emerging from Customary Design for Balcony Space in Apartment. J. Archit. Inst. Korea Plan. Des. 2004, 20, 67–76. [Google Scholar]
- VV., A. The Current Situation of Improved Regulation and Remodeling System; MOLIT-Housing Redevelopment Division: Seoul, Korea, 2014.
- Breheny, M. Superglass Cavity Wall Insulation BRA Technical Approval Certificate; Superglass Insulation Ltd.: Stirling, UK, 2017. [Google Scholar]
- Smile Plastics. Available online: https://smile-plastics.com/ (accessed on 23 July 2018).
- Wecobis.de. Available online: https://www.wecobis.de/ (accessed on 15 July 2018).
- Oekobaudat.de. Available online: https://www.oekobaudat.de/ (accessed on 20 July 2018).
- DGNB. DNGB Kriterienuebersicht-Sanierung Büro- und Verwaltungsgebäude, Version 2016; DGNB: Stuttgart, Germany, 2016. [Google Scholar]
- Green, M.A.; Emery, K.; Hishikawa, Y.; Warta, W. Solar cell efficiency tables (version 37). Prog. Photovolt. Res. Appl. 2011, 19, 84–92. [Google Scholar] [CrossRef]
- Mejia, F.; Kleissl, J.; Bosch, J.L. The Effect of Dust on Solar Photovoltaic Systems. Energy Procedia 2014, 49, 2370–2376. [Google Scholar] [CrossRef]
- Seoul Monthly Climate Averages. Available online: https://www.worldweatheronline.com/seoul-weather-averages/kr.aspx (accessed on 20 August 2018).
- Jang, H. Modelling of Existing High-Rise Apartment Buildings for Energy-Efficient Refurbishment in South Korea. Ph.D. Thesis, University of Sheffield, Sheffield, UK, 2016. [Google Scholar]
- Jang, H.; Jones, L.; Kang, J. Prioritisation of old apartment buildings for energy-efficient refurbishment based on the effects of building features on energy consumption in South Korea. Energy Build. 2015, 96, 319–328. [Google Scholar] [CrossRef] [Green Version]
- Sanyal, J.; New, J. Simulation and big data challenges in tuning building energy models. In Proceedings of the 2013 Workshop on Modeling and Simulation of Cyber-Physical Energy Systems (MSCPES), Berkeley, CA, USA, 20–23 May 2013; pp. 1–6. [Google Scholar]
- Keough, I. Dynamo: Designing a Visual Scripting Interface for the Revit API (Notes). More Inf. about Coding Dynamo 2011. Available online: https://github.com/ikeough/Dynamo/wiki (accessed on 26 August 2018).


| Index | Value |
|---|---|
| Land plot area | 1386.66 m2 |
| Gross building area | 886.33 m2 |
| Floor number | 15 |
| Floor height | 2.50 m |
| Room height | 2.30 m |
| Floor-to-Area Ratio (FAR) | 9.60 |
| Usable area of one apartment unit | 108.04 m2 |
| Building Component | Thickness (cm) | U-Value (W/m2K) |
|---|---|---|
| Insulated load bearing wall (northern exterior wall/southern wall between loggia and interior rooms) | 34.50 | 0.63 |
| Exterior loggia wall | 11.50 | 1.63 |
| Roof | 35.00 | 0.46 |
| Basement slab | 56.50 | 0.45 |
| Interior wall (non-structural) | 12.00 | 1.57 |
| Interior wall (structural) | 25.00 | 2.63 |
| Interior slab (ceiling and floor) | 23.00 | 1.09 |
| Window Type | Dimensions (l × h) in cm) | U-Value (W/m2K) | g-Value |
|---|---|---|---|
| Loggia | 380 × 210 | 3.163 | 0.65 |
| Glass door | 200 × 200 | 3.224 | 0.65 |
| Bedroom Southeast | 250 × 110 | 3.019 | 0.65 |
| Bedroom Northwest | 250 × 110 | 3.019 | 0.72 |
| Bedroom Northeast | 130 × 100 | 3.153 | 0.72 |
| Kitchen | 90 × 50 | 3.432 | 0.72 |
| Room Name | Total | Jan | Feb | Mar | Apr | May | Jun | Jul | Aug | Sep | Oct | Nov | Dec |
|---|---|---|---|---|---|---|---|---|---|---|---|---|---|
| Kitchen | 3542.52 | 796.21 | 651.24 | 510.86 | 273.97 | 93.62 | 0.00 | 0.00 | 0.00 | 0.00 | 152.24 | 393.89 | 670.49 |
| Closet N | 582.45 | 127.73 | 105.31 | 84.44 | 46.24 | 16.02 | 0.00 | 0.00 | 0.00 | 0.00 | 28.00 | 65.66 | 109.04 |
| Room NE | 1442.25 | 340.60 | 275.22 | 209.31 | 100.01 | 21.41 | 0.00 | 0.00 | 0.00 | 0.00 | 51.96 | 160.34 | 283.40 |
| Room NW | 2234.16 | 531.58 | 429.40 | 323.04 | 155.57 | 39.79 | 0.00 | 0.00 | 0.00 | 0.00 | 75.29 | 244.88 | 434.60 |
| Bathroom W | 470.58 | 102.70 | 85.42 | 70.17 | 39.63 | 13.26 | 0.00 | 0.00 | 0.00 | 0.00 | 18.34 | 50.84 | 90.22 |
| Corridor | 2872.04 | 656.81 | 537.21 | 422.83 | 223.21 | 67.74 | 0.00 | 0.00 | 0.00 | 0.00 | 95.88 | 309.26 | 559.10 |
| Bathroom N | 595.26 | 128.19 | 106.88 | 87.13 | 49.86 | 18.15 | 0.00 | 0.00 | 0.00 | 0.00 | 27.87 | 65.87 | 111.30 |
| Room SW | 1813.74 | 465.32 | 362.09 | 267.35 | 111.95 | 14.90 | 0.00 | 0.00 | 0.00 | 0.00 | 19.25 | 172.59 | 400.30 |
| Living Room | 2533.95 | 614.65 | 492.44 | 372.89 | 174.33 | 44.05 | 0.00 | 0.00 | 0.00 | 0.00 | 58.75 | 258.51 | 518.33 |
| Room SE | 1980.60 | 480.83 | 388.57 | 298.21 | 138.02 | 29.79 | 0.00 | 0.00 | 0.00 | 0.00 | 41.17 | 200.55 | 403.47 |
| Room Name | Total | Jan | Feb | Mar | Apr | May | Jun | Jul | Aug | Sep | Oct | Nov | Dec |
|---|---|---|---|---|---|---|---|---|---|---|---|---|---|
| Kitchen | 331.03 | 0.00 | 0.00 | 0.00 | 0.00 | 0.00 | 2.08 | 128.05 | 195.62 | 5.28 | 0.00 | 0.00 | 0.00 |
| Closet N | 35.77 | 0.00 | 0.00 | 0.00 | 0.00 | 0.00 | 0.14 | 12.80 | 21.90 | 0.94 | 0.00 | 0.00 | 0.00 |
| Room NE | 205.06 | 0.00 | 0.00 | 0.00 | 0.00 | 0.00 | 3.13 | 72.94 | 120.13 | 8.87 | 0.00 | 0.00 | 0.00 |
| Room NW | 307.79 | 0.00 | 0.00 | 0.00 | 0.00 | 0.00 | 3.61 | 118.44 | 177.04 | 8.70 | 0.00 | 0.00 | 0.00 |
| Bathroom W | 23.70 | 0.00 | 0.00 | 0.00 | 0.00 | 0.00 | 0.00 | 7.21 | 15.88 | 0.60 | 0.00 | 0.00 | 0.00 |
| Corridor | 321.94 | 0.00 | 0.00 | 0.00 | 0.00 | 0.00 | 2.40 | 122.37 | 189.53 | 7.65 | 0.00 | 0.00 | 0.00 |
| Bathroom N | 31.05 | 0.00 | 0.00 | 0.00 | 0.00 | 0.00 | 0.00 | 9.97 | 20.28 | 0.80 | 0.00 | 0.00 | 0.00 |
| Room SW | 452.02 | 0.00 | 0.00 | 0.00 | 0.00 | 0.00 | 7.78 | 160.90 | 256.92 | 26.41 | 0.00 | 0.00 | 0.00 |
| Living Room | 475.54 | 0.00 | 0.00 | 0.00 | 0.00 | 0.00 | 6.59 | 180.24 | 271.18 | 17.53 | 0.00 | 0.00 | 0.00 |
| Room SE | 335.12 | 0.00 | 0.00 | 0.00 | 0.00 | 0.00 | 3.75 | 125.04 | 194.91 | 11.42 | 0.00 | 0.00 | 0.00 |
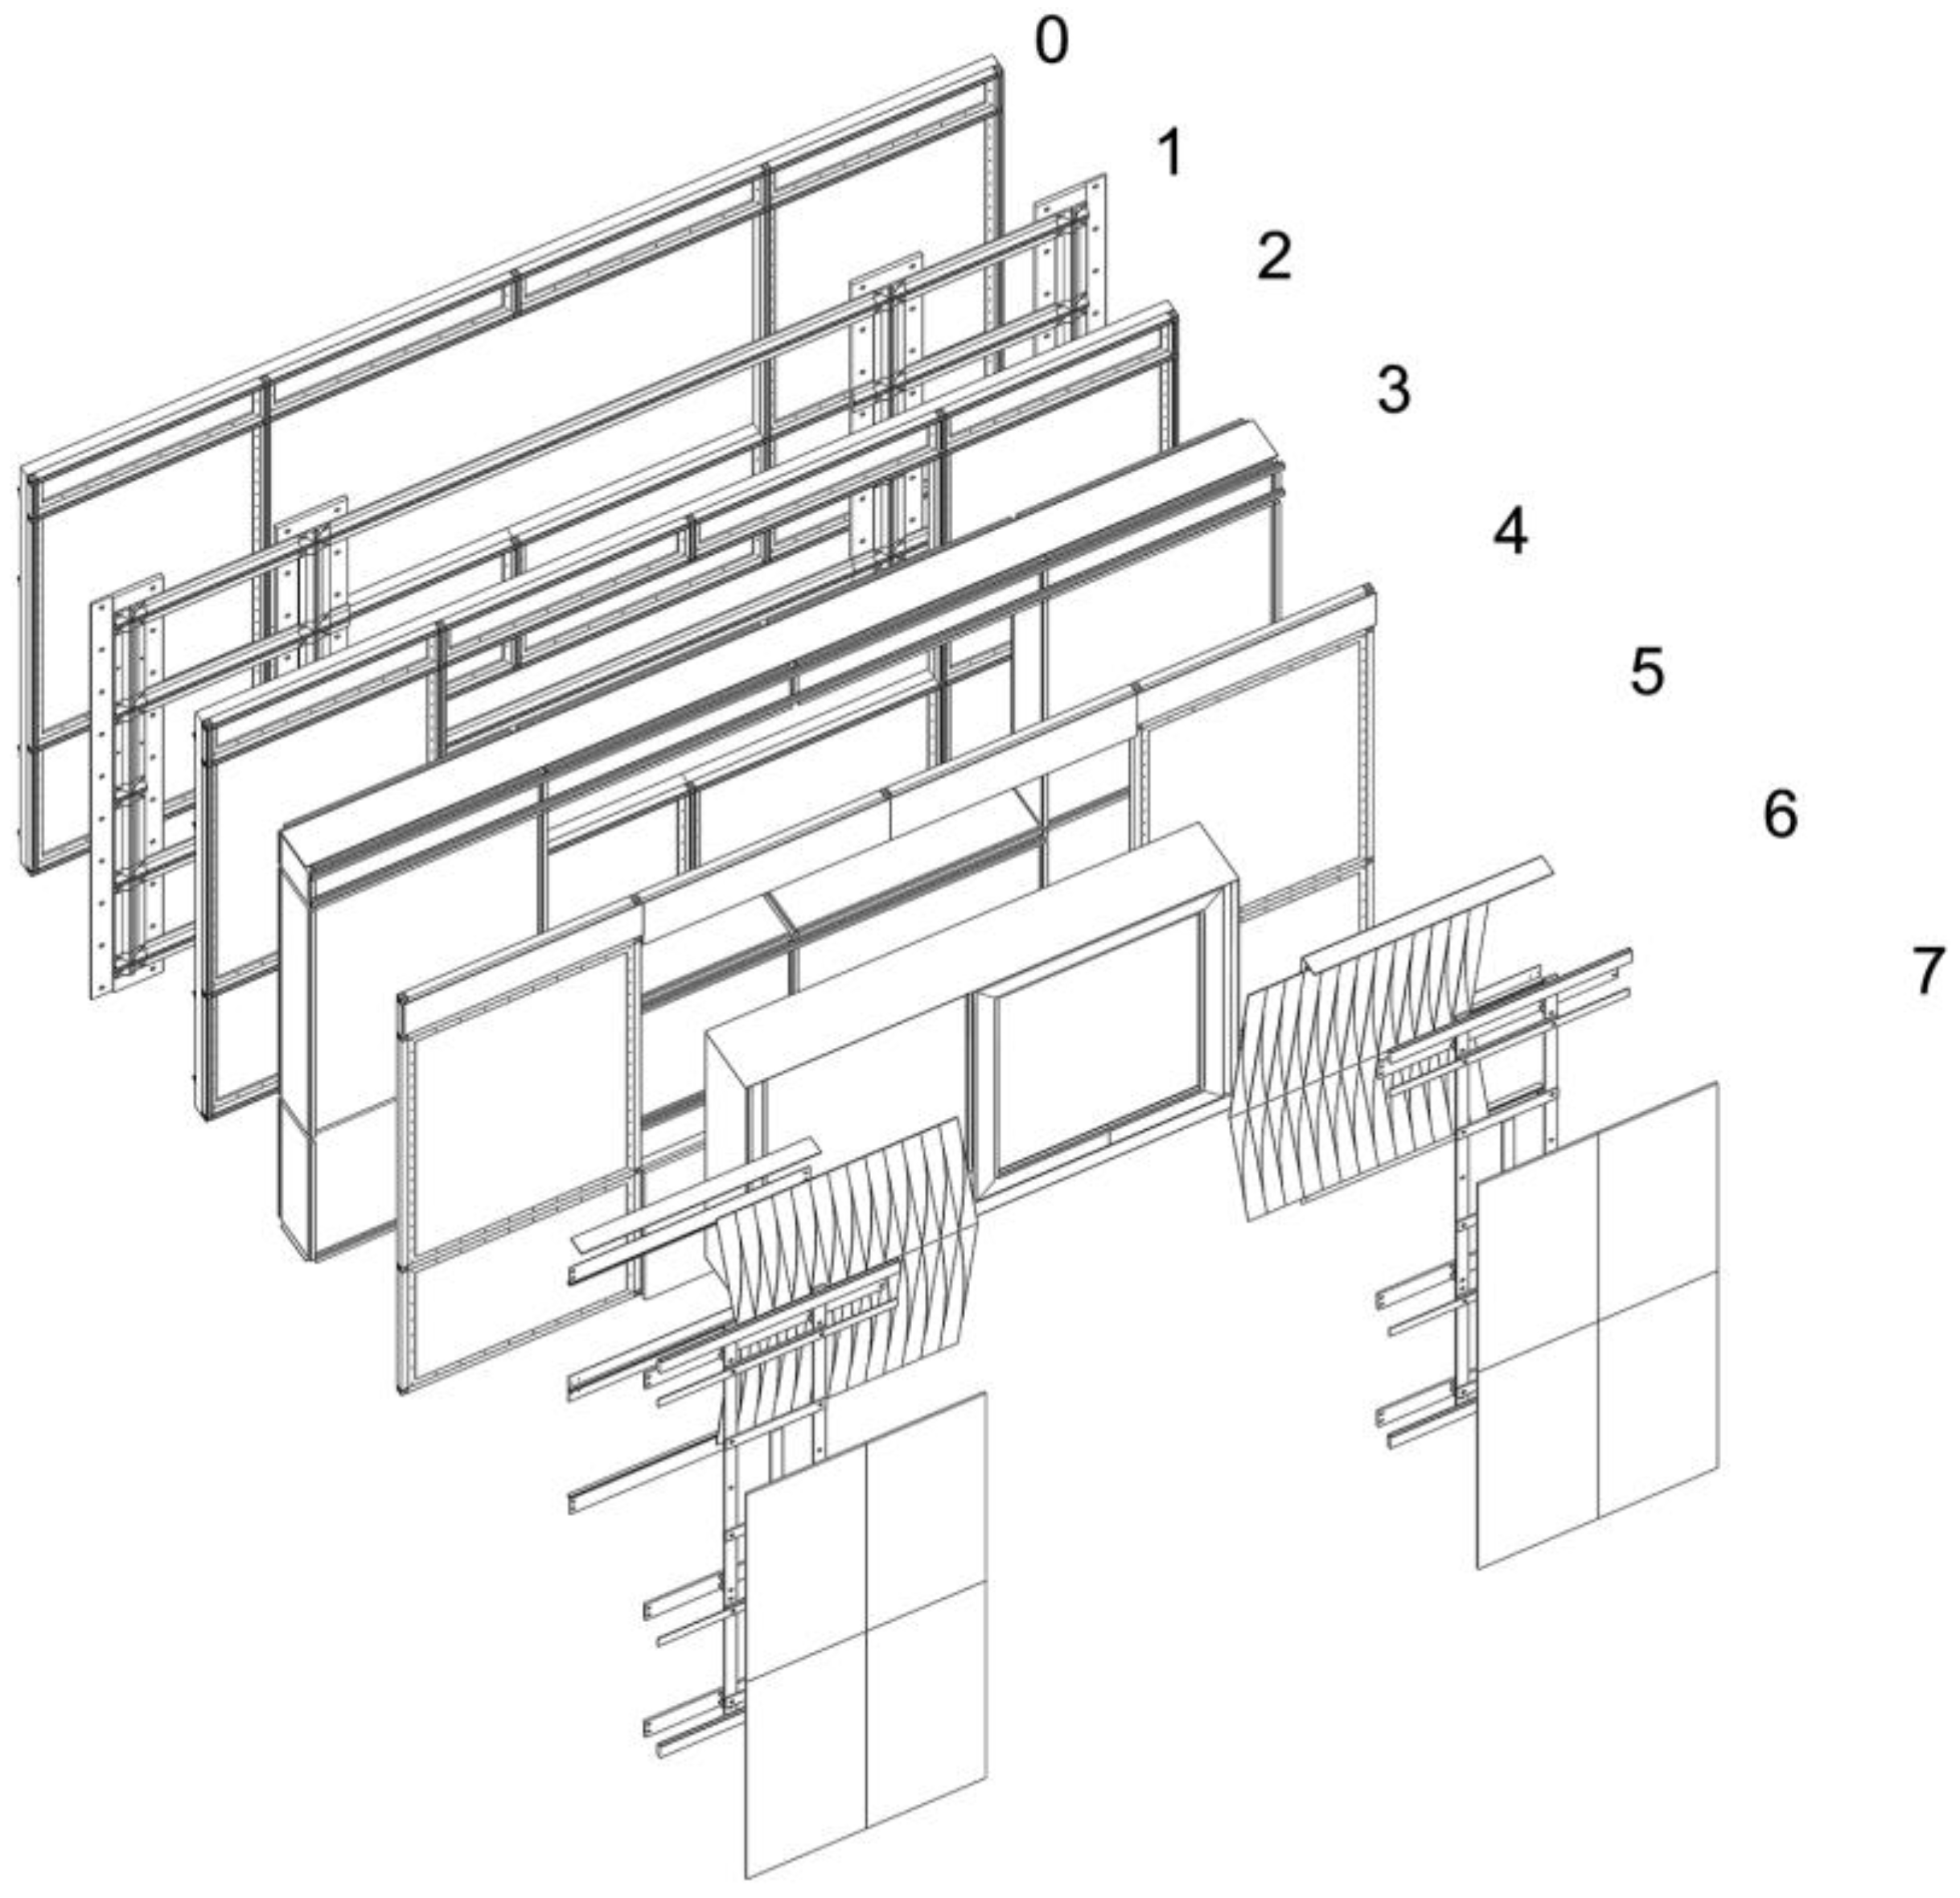
| Layer No. | Name | Component Configuration and Materials | Depth |
|---|---|---|---|
| 0 | Indoors building envelope layer | Gypsum boards & wood frame | Depth: 8–10 cm |
| 1 | Support structure | Stainless steel frames | Depth: 4–6 cm |
| 2 | Construction support frame | Timber frame & stainless steel rail connectors to layers 1 & 3 | Depth: 6–8 cm |
| 3 | Thermal insulation panel | Mineral glass wool [84], timber frame & aluminium foil (vapor barrier) | Depth: 20 cm |
| 4 | Construction support frame | Timber frame, stainless steel connectors & plastic membrane (waterproof barrier) | Depth: 6–8 cm |
| 5 | Window component | Timber frame, double glazing & rubber gasket | Depth: 10–15 cm |
| 6 | Solar blind system | Recycled plastic & stainless steel | Depth: 8 cm |
| 7 | Mounting System & 1. Cladding 2. Cladding | Stainless steel 1. Glass, plastic film, multi crystalline silicon (PV) & aluminium frame 2. Recycled plastic panels [85] | Depth: 10 cm 1. Depth: 2 cm 2. Depth 0.5 cm |
| Σ | Complete component window 1. Complete component cladding 1 2. Complete component cladding 2 | Multiple (see above) Multiple (see above) Multiple (see above) | Depth: 42.5 cm 1. Depth: 55 cm 2. Depth: 43 cm |
| Window | Amount | Dimensions (l × h in cm) | Opening Type | U-value (W/m2K) | WWR |
|---|---|---|---|---|---|
| Southern bedrooms | 2 | 200 × 125 | Sliding | 1.99 | 28% (SE/SW) |
| Living room | 3 | 90 × 145 | Tilt | 2.00 | 35% |
| Northern bedrooms | 4 | 90 × 125 | Flush/Tilt | 2.02 | 22%(NE) 23%(NW) |
| Kitchen | 2 | 90 × 50 | Sliding | 2.28 | 10% |
| Room Name | Total | Jan | Feb | Mar | Apr | May | Jun | Jul | Aug | Sep | Oct | Nov | Dec |
|---|---|---|---|---|---|---|---|---|---|---|---|---|---|
| Kitchen | 1215.44 | 313.97 | 248.33 | 179.91 | 71.73 | 2.45 | 0.00 | 0.00 | 0.00 | 0.00 | 19.03 | 129.81 | 250.22 |
| Closet N | 165.44 | 40.17 | 32.74 | 26.57 | 12.28 | 0.23 | 0.00 | 0.00 | 0.00 | 0.00 | 3.53 | 17.65 | 32.28 |
| Room NE | 990.16 | 257.31 | 202.57 | 146.22 | 55.70 | 1.17 | 0.00 | 0.00 | 0.00 | 0.00 | 15.87 | 106.46 | 204.87 |
| Room NW | 940.15 | 250.41 | 195.39 | 136.32 | 47.12 | 0.48 | 0.00 | 0.00 | 0.00 | 0.00 | 11.91 | 99.82 | 198.69 |
| Bathroom W | 142.05 | 36.21 | 29.21 | 22.93 | 9.05 | 0.00 | 0.00 | 0.00 | 0.00 | 0.00 | 0.54 | 14.46 | 29.66 |
| Corridor | 1013.60 | 270.93 | 214.78 | 154.22 | 46.59 | 0.20 | 0.00 | 0.00 | 0.00 | 0.00 | 4.11 | 105.42 | 217.35 |
| Bathroom N | 188.16 | 47.28 | 38.23 | 29.78 | 12.62 | 0.00 | 0.00 | 0.00 | 0.00 | 0.00 | 1.90 | 19.92 | 38.43 |
| Room SW | 801.47 | 227.17 | 175.54 | 116.63 | 26.22 | 0.01 | 0.00 | 0.00 | 0.00 | 0.00 | 1.27 | 73.15 | 181.48 |
| Living Room | 1417.53 | 388.57 | 306.74 | 210.61 | 53.97 | 0.23 | 0.00 | 0.00 | 0.00 | 0.00 | 5.38 | 143.49 | 308.55 |
| Room SE | 899.01 | 253.84 | 196.83 | 131.64 | 29.64 | 0.01 | 0.00 | 0.00 | 0.00 | 0.00 | 1.36 | 82.32 | 203.37 |
| Room Name | Total | Jan | Feb | Mar | Apr | May | Jun | Jul | Aug | Sep | Oct | Nov | Dec |
|---|---|---|---|---|---|---|---|---|---|---|---|---|---|
| Kitchen | 268.37 | 0.00 | 0.00 | 0.00 | 0.00 | 0.00 | 2.39 | 97.46 | 160.95 | 7.56 | 0.00 | 0.00 | 0.00 |
| Closet N | 16.04 | 0.00 | 0.00 | 0.00 | 0.00 | 0.00 | 0.01 | 4.16 | 11.15 | 0.72 | 0.00 | 0.00 | 0.00 |
| Room NE | 228.61 | 0.00 | 0.00 | 0.00 | 0.00 | 0.00 | 3.30 | 81.44 | 134.61 | 9.26 | 0.00 | 0.00 | 0.00 |
| Room NW | 258.21 | 0.00 | 0.00 | 0.00 | 0.00 | 0.00 | 3.91 | 92.04 | 151.84 | 10.42 | 0.00 | 0.00 | 0.00 |
| Bathroom W | 21.10 | 0.00 | 0.00 | 0.00 | 0.00 | 0.00 | 0.07 | 5.81 | 13.78 | 1.44 | 0.00 | 0.00 | 0.00 |
| Corridor | 254.20 | 0.00 | 0.00 | 0.00 | 0.00 | 0.00 | 2.49 | 89.31 | 152.98 | 9.41 | 0.00 | 0.00 | 0.00 |
| Bathroom N | 28.71 | 0.00 | 0.00 | 0.00 | 0.00 | 0.00 | 0.07 | 8.05 | 19.01 | 1.58 | 0.00 | 0.00 | 0.00 |
| Room SW | 323.09 | 0.00 | 0.00 | 0.00 | 0.00 | 0.00 | 5.90 | 109.17 | 184.78 | 23.25 | 0.00 | 0.00 | 0.00 |
| Living Room | 484.56 | 0.00 | 0.00 | 0.00 | 0.00 | 0.00 | 7.41 | 167.80 | 280.65 | 28.71 | 0.00 | 0.00 | 0.00 |
| Room SE | 349.85 | 0.00 | 0.00 | 0.00 | 0.00 | 0.00 | 6.18 | 117.24 | 201.81 | 24.62 | 0.00 | 0.00 | 0.00 |
| Room | Comfortable Hours in % of Total Hours (Existing) | Comfortable Hours in % of Total Hours (Renovated) | Improvement of Comfortable Hours in % of Total Hours (Renovated) | Too Warm Uncomfortable Hours in % of Total Hours (Renovated) | Too Cold Uncomfortable Hours in % of Total Hours (Renovated) |
|---|---|---|---|---|---|
| North-eastern room | 90.19% | 90.45% | +0.26% | 0.00% | 9.54% |
| Kitchen | 82.48% | 87.73% | +5.25% | 0.00% | 12.26% |
| Living room | 85.71% | 91.31% | +5.60% | 0.00% | 8.68% |
| Southwestern room | 89.74% | 93.57% | +4.36% | 0.00% | 6.42% |
© 2018 by the authors. Licensee MDPI, Basel, Switzerland. This article is an open access article distributed under the terms and conditions of the Creative Commons Attribution (CC BY) license (http://creativecommons.org/licenses/by/4.0/).
Share and Cite
Amoruso, F.M.; Dietrich, U.; Schuetze, T. Development of a Building Information Modeling-Parametric Workflow Based Renovation Strategy for an Exemplary Apartment Building in Seoul, Korea. Sustainability 2018, 10, 4494. https://doi.org/10.3390/su10124494
Amoruso FM, Dietrich U, Schuetze T. Development of a Building Information Modeling-Parametric Workflow Based Renovation Strategy for an Exemplary Apartment Building in Seoul, Korea. Sustainability. 2018; 10(12):4494. https://doi.org/10.3390/su10124494
Chicago/Turabian StyleAmoruso, Fabrizio Maria, Udo Dietrich, and Thorsten Schuetze. 2018. "Development of a Building Information Modeling-Parametric Workflow Based Renovation Strategy for an Exemplary Apartment Building in Seoul, Korea" Sustainability 10, no. 12: 4494. https://doi.org/10.3390/su10124494