The Design and Analysis of Internally Stiffened GFRP Tubular Decks—A Sustainable Solution


Department of Civil Engineering, National Taipei University of Technology, Taipei 106, Taiwan
*
Author to whom correspondence should be addressed.
Sustainability 2018, 10(12), 4538; https://doi.org/10.3390/su10124538
Submission received: 28 October 2018
/
Revised: 27 November 2018
/
Accepted: 30 November 2018
/
Published: 1 December 2018
(This article belongs to the Special Issue Sustainable Civil Engineering Materials)
Abstract
:The aim of this paper was to find an optimal stiffener configuration of thin-wall tubular panels made by glass fiber reinforced polymer (GFRP) composite material, which is a low carbon emission, low life cycle cost, and sustainable material. Finite-element analysis (FEA) was used to investigate the flexural and torsional stiffness of various internally stiffened sections of thin-wall GFRP decks. These decks consist of internally stiffened tubular profiles laid side by side and bonded together with epoxy to ensure the panel acts as an assembly. Three-dimensional models of the seven proposed decks were assembled with tubular profiles of different stiffener patterns. First, the non-stiffened tube profile was tested experimentally to validate the parameters used in the subsequent numerical analysis. Then, the finite element software, ANSYS, was used to simulate the flexural and torsional behavior of the decks with different stiffener patterns under bending and torsional loads. The decks with stiffener patterns such as “O” type, “V” type, and “D” type were found to be the most effective in bending. For torsion, there was a distinct tendency for deck panels with closed shaped stiffener patterns to perform better than their counterparts. Overall, the “O” type deck panel was an optimal stiffener configuration.
1. Introduction
With exposure to saline conditions in coastal areas, the use of de-icing chemicals in cold regions, and the frequent occurrence of earthquakes in some regions, the aging process of infrastructures accelerates. As a result, the loading capacities of reinforced concrete bridges often are not sufficient to carry the loads imposed upon them. In the last two decades, civil engineers have considered the use of alternative materials, such as fiber reinforced polymer (FRP) composite materials, to rehabilitate existing infrastructures or rebuild new ones. FRP composite materials are noted for their anti-corrosion, lightweight, low carbon emissions, low thermal conductivity, and excellent weather resistance. Additionally, they are also attractive for their other beneficial mechanical properties, such as high strength-to-weight ratio, and high modulus of elasticity. In the meantime, FRP composite materials can offer a longer maintenance-free service life and low life cycle cost. Due to the lightweight nature of FRP material, the modular FRP components could be shipped to the field for assembling; the time and cost for field construction can thus be significantly reduced.
Regarding carbon emission, Li et al. [1] calculated that the all-GFRP pedestrian bridge reduced total carbon emission by about 43% and 19% compared to a reinforced concrete pedestrian bridge and a steel pedestrian bridge, respectively. Another study showed that for a GFRP composite superstructure of a 12-m long road bridge, carbon emissions were reduced by 48% and 57% compared with a concrete bridge and steel bridge [2]. The FRP composite materials have a lower environmental cost than concrete and steel materials. Furthermore, FRP composite materials can be recyclable and reusable, and therefore it is a sustainable material for civil engineering usage.
The use of modular FRP bridge decks to replace damaged existing decks can minimize the time required for construction and further reduce impact on the traffic. Because of these advantages, FRP bridge decks have been widely used in North America as well as in Europe and Asia to replace dysfunctional reinforced concrete bridge decks and to build new bridges [3,4,5,6,7].
Many studies have been conducted on the performance as well as the economic and environmental viability of modular FRP decks. In a study by Valbona et al. [8,9], a functionally obsolete existing bridge deck in northern Sweden was replaced with an FRP deck. As a result, it reduced the closure time of the bridge under consideration to 15 h. Also the analysis revealed that minimum deflection, load-carrying capacity, and fatigue strength requirements could all be met if an FRP deck option were to be implemented. Recently, a project report published by the U.S. Federal Highway Administration (FHWA) [10] presented the final design of an FRP tubular deck made of stiffened trapezoidal tubes bonded with epoxy installed on a bridge in Allegany County, New York. A cellular FRP composite deck was examined using finite element analysis and the analysis results were compared with laboratory experiments of the bridge deck. The results show that local deformation behavior must be considered. The strength, failure mode, and fatigue life prediction methodologies for a cellular FRP bridge deck were discussed by Majumdar [11].
Other researchers focused on the experimental and numerical analysis of FRP decks, such as the experimental and analytical study of Wu et al. [12], which assessed a deck consisting of a series of pultruded FRP tubes with post-tensioning between each two stringers. The results show that the pre-stressing provided redundancy and reserved strength to the deck system. Volz et al. [13] proposed polyurethane foams to replace the honeycomb in FRP bridge deck panels. The small-scale and mid-scale sandwich panels were tested, including static, fatigue, and durability testing. Zi et al. [14,15] investigated the static behaviors of a modular bridge deck, which was filled with low-density polyurethane foams. The structural performance of the deck was significantly improved. Mostafa et al. [16] presented the results of a numerical and experimental investigation on the flexural behavior and failure mode of composite sandwich panels. The sandwich deck panels were made of GFRP, and polyvinylchloride foam was used as core material. Finite element analysis and a four-point bending test were conducted to investigate the flexural behavior of the sandwich panel. In 2006, Alagusundaramoorthy et al. [17] evaluated the force-deformation responses of FRP composite bridge deck panels under AASHTO MS 22.5 (HS25) truck wheel load. The force-deformation test results of the FRP composite deck were compared with the flexural, shear, and deflection performance criteria. The response of all panels under service load, cyclic loading, factored load, and the mode of failure were reported. The safety factor for the FRP composite deck panels varied from 3 to 8.
The design, construction, inspection, and maintenance stages of FRP decks are very important issues. Hong and Hastak [18] identified the fabrication, construction methods, quality, man-hour requirements, cost, and productivity issues. The data were collected by personal interviews with manufacturers of FRP bridge deck panels, and the project candidates for FRP bridge deck construction. Brown and Berman [19] studied the fatigue and strength of two types of GFRP decks. The fatigue test results showed degradation of the stiffness of both deck types. It was found that the degradation of the composite behavior between the deck and girders under fatigue loading should be accounted for. Srivastava et al. [20] proposed a technique for analysis and design of FRP web core decks for highway culverts. The technique was based on finite-element modeling and an iterative optimization scheme. Li et al. [5] added diaphragms in the girder-deck system configuration to help resist torsion. The results of classical beam theory analysis were compared with finite element analysis for the flexural behavior of an 8-m pedestrian bridge.
Although many have successfully applied different stiffeners to FRP decks, none have discussed the best arrangement for the stiffeners. This paper, therefore, concentrates on determining the optimum stiffener configuration by proposing and testing seven different stiffener configurations for thin-wall GFRP tubular panels. In this study, the finite-element analysis (FEA) software, ANSYS, was used to simulate the bending and torsional behaviors of the different proposed deck panels under static loading, and then to evaluate the bending and torsional performance of these deck panels. The paper begins with an introduction of the material properties of FRP composites. Then, the procedures towards the finite element simulation are discussed. Finally, the paper summarizes the findings of the finite element analysis.
2. Materials and Geometries of Tubular Decks
2.1. FRP Composite Material
FRP is a composite material which mainly owes it properties to the nature of the resin, the type and orientation of the reinforcing fibers, the fiber-to-matrix ratio, the fiber-matrix interface properties, and the manufacturing process used to produce the profiles. The rule of mixture is usually used to evaluate the physical properties of the FRP material. Assuming the fibers are aligned regularly in one direction and perfect bonds exists between the fibers and the matrix, the longitudinal (along the direction of the fibers) Young’s modulus can be evaluated as follows:
where Ez is the longitudinal Young’s modulus of the composite material, Vf and Vm are the volume fractions of the fiber and the matrix respectively, and Ef, Em are the Young’s moduli of the fiber and the matrix, respectively. Similarly, the major Poisson’s ratio is evaluated as:
where νf and νm are the Poisson’s ratio of the fiber and the matrix, respectively. However, the same rule does not apply to the material properties in the transverse direction given that the material is orthotropic. The Young’s modulus in the transverse and the shear modulus in the X–Y direction of the composite are simply taken as the corresponding values for the matrix itself. In fact, the FRP composites are anisotropic with the Young’s moduli and Poisson’s ratio at different directions in each orientation.
The pultruded orthotropic thin-wall GFRP tube profiles made with glass fiber and epoxy resin are considered and were used to simulate the behavior of the proposed deck panels. When force is applied in the same direction as that of the fibers (i.e., the longitudinal direction), the stress–strain diagram can be represented by Figure 1. When force is applied perpendicular to the direction of the fibers (i.e., the transverse direction), the stress–strain diagram can be represented by Figure 2. Table 1 lists the material properties provided by GFRP manufacturer.
2.2. Geometries of Tubular Decks
Seven proposed tubular decks were considered in this study. Each consisted of three 7.5 × 7.5 cm pultruded square tube profiles with thickness ×0.6 cm featuring different stiffener configurations that are assumed to be flawlessly bonded together to form tubular decks. The stiffened tubes were generated by adding various stiffener patterns including “Plus” type (+ type), “V” type, “X” type, “Diamond” type (D type), “Y” type, “H” type, and “O” type to the square tube profile. The square tube is shown in Figure 3a. The three square tube assembly shown in Figure 3b was used as a benchmark deck to evaluate the flexural and torsional stiffness. Figure 4 and Table 2 present the cross sections and dimensions of the proposed tubular decks.
3. Theory and Validation
3.1. Finite-Element Model of the GFRP Tube
The geometric models of the proposed panels were first generated with CAD software, then exported to ANSYS workbench to conduct finite-element analysis. The material properties in the finite element analysis are defined in Table 1. The deck panels were modeled as being perfectly glued together. Such an assumption is even more valid if the deck panels are intended to be covered up with an outer wrap of FRP using vacuum-assisted resin transfer molding (VARTM) or if pre-stressing is to be used to enhance the panel action of the tube assemblies as suggested by Wu et al. [12]. Moreover, Li [21] also mentioned that the observed failure mode of similar tubular decks was not localized in the adhesive joint region but rather at the tube section flange, which justifies the assumption made above. A SOLID186 element type was used, which is a 20-noded brick element.
3.2. Experimental Validation of the Finite-Element Model
To ensure the accuracy of the finite element model presented in the previous section, a validation test was performed in which a 7.5 × 7.5 cm square tube profile with thickness 0.5 cm was subjected to a three-point bending test performed on the thin-wall GFRP tube. The three-point test was performed according to the ASTM D790 test method [22]. The illustration figure of the three-point bending test is shown in Figure 5. The geometry of the profile utilized in the validation test was similar to that of the non-stiffened tube profile. Figure 6 shows a picture of the experimental setup of the three-point bending test performed on the GFRP tube profile. The dial gauge (DDP-30A, Tokyo Sokki Kenkyujo Co., Ltd., Tokyo, Japan) was placed below the specimen to measure mid-span displacement of the specimen and a load cell (WF 17120, Wykeham Farrance, Milan, Italy) with 50 tons capacity was utilized. In the meantime, a high precision data logger (KL-10, Geomaster Group, Tianjin, China) was used to record the force and displacement data and a sampling rate of 1 data/sec was set to record the force–displacement information.
The material properties of the specimen employed in the validation test are identical to those presented in Table 1. The load–displacement relationship obtained from the experiment was approximately linear throughout the earlier stage. The maximum load recorded shortly before failure was 12.40 kN with a corresponding deflection of 11.4 mm at mid-span of the specimen. The experiment was then simulated by finite element analysis. The geometry of the specimen was first generated and the finite element model was properly restricted from translation along the y axis (vertical direction) at the supports. Figure 7 illustrates the y-direction displacement contour for the first selected load value namely 1.24 kN while Figure 8 compares load–displacement relationships of the experiment and finite-element analysis. The finite-element numerical results were in good agreement with the experimental data.
To further confirm the accuracy of the finite element model, the numerical and analytical results of the three-point bending test for an applied load of 9.045 kN at mid-span of the profile were examined. The Euler–Bernoulli Beam Theory (EBT) and the Timoshenko Beam Theory (TBT) shown in Equations (3) and (4) were utilized. The TBT was also used to account for the influence of the shear deformation on deflection.
In Equations (3) and (4), δmax represents the maximum deflection of the square tube profile, while P is the concentrated load at mid-span (7.485 kN), L is the clear span length (100 cm), I is the section moment of inertia (119.9 cm4), G is the shear modulus (3150 MPa), A is the cross sectional area (14.2 cm2), and ν is the Poisson’s ratio (0.33). A value of 29,584 MPa was computed from the experimental results and used for the Young’s modulus E. The shear coefficient, κ =0.437, for a thin-walled tube was obtained by Cowper [23] as:
Table 3 features the maximum deflection obtained from the experiment for a central load of 7.485 kN and those obtained from the finite element analysis, the EBT and TBT. It was shown that the deflection values calculated from the TBT and FEA are much closer to the experimental data than that of the EBT.
4. Finite-Element Analysis of Internally Stiffened GFRP Tubular Decks
Decks are subject to various types of loads, including dead load, traffic loads, earthquake loads, and wind loads. The combination of these loads induces bending and torsional loads on the decks. Bending and flexural rigidities are therefore important considerations during the design process of the decks. The bending and torsional deformability of a GFRP deck is mainly dependent on its bending and torsional stiffness. This, in turn, depends on the material properties, the cross section, and the length of the component. To increase the stiffness while maintaining the economic feasibility, choosing an efficient cross section is one of the best ways to proceed, and hence is the main object of this study.
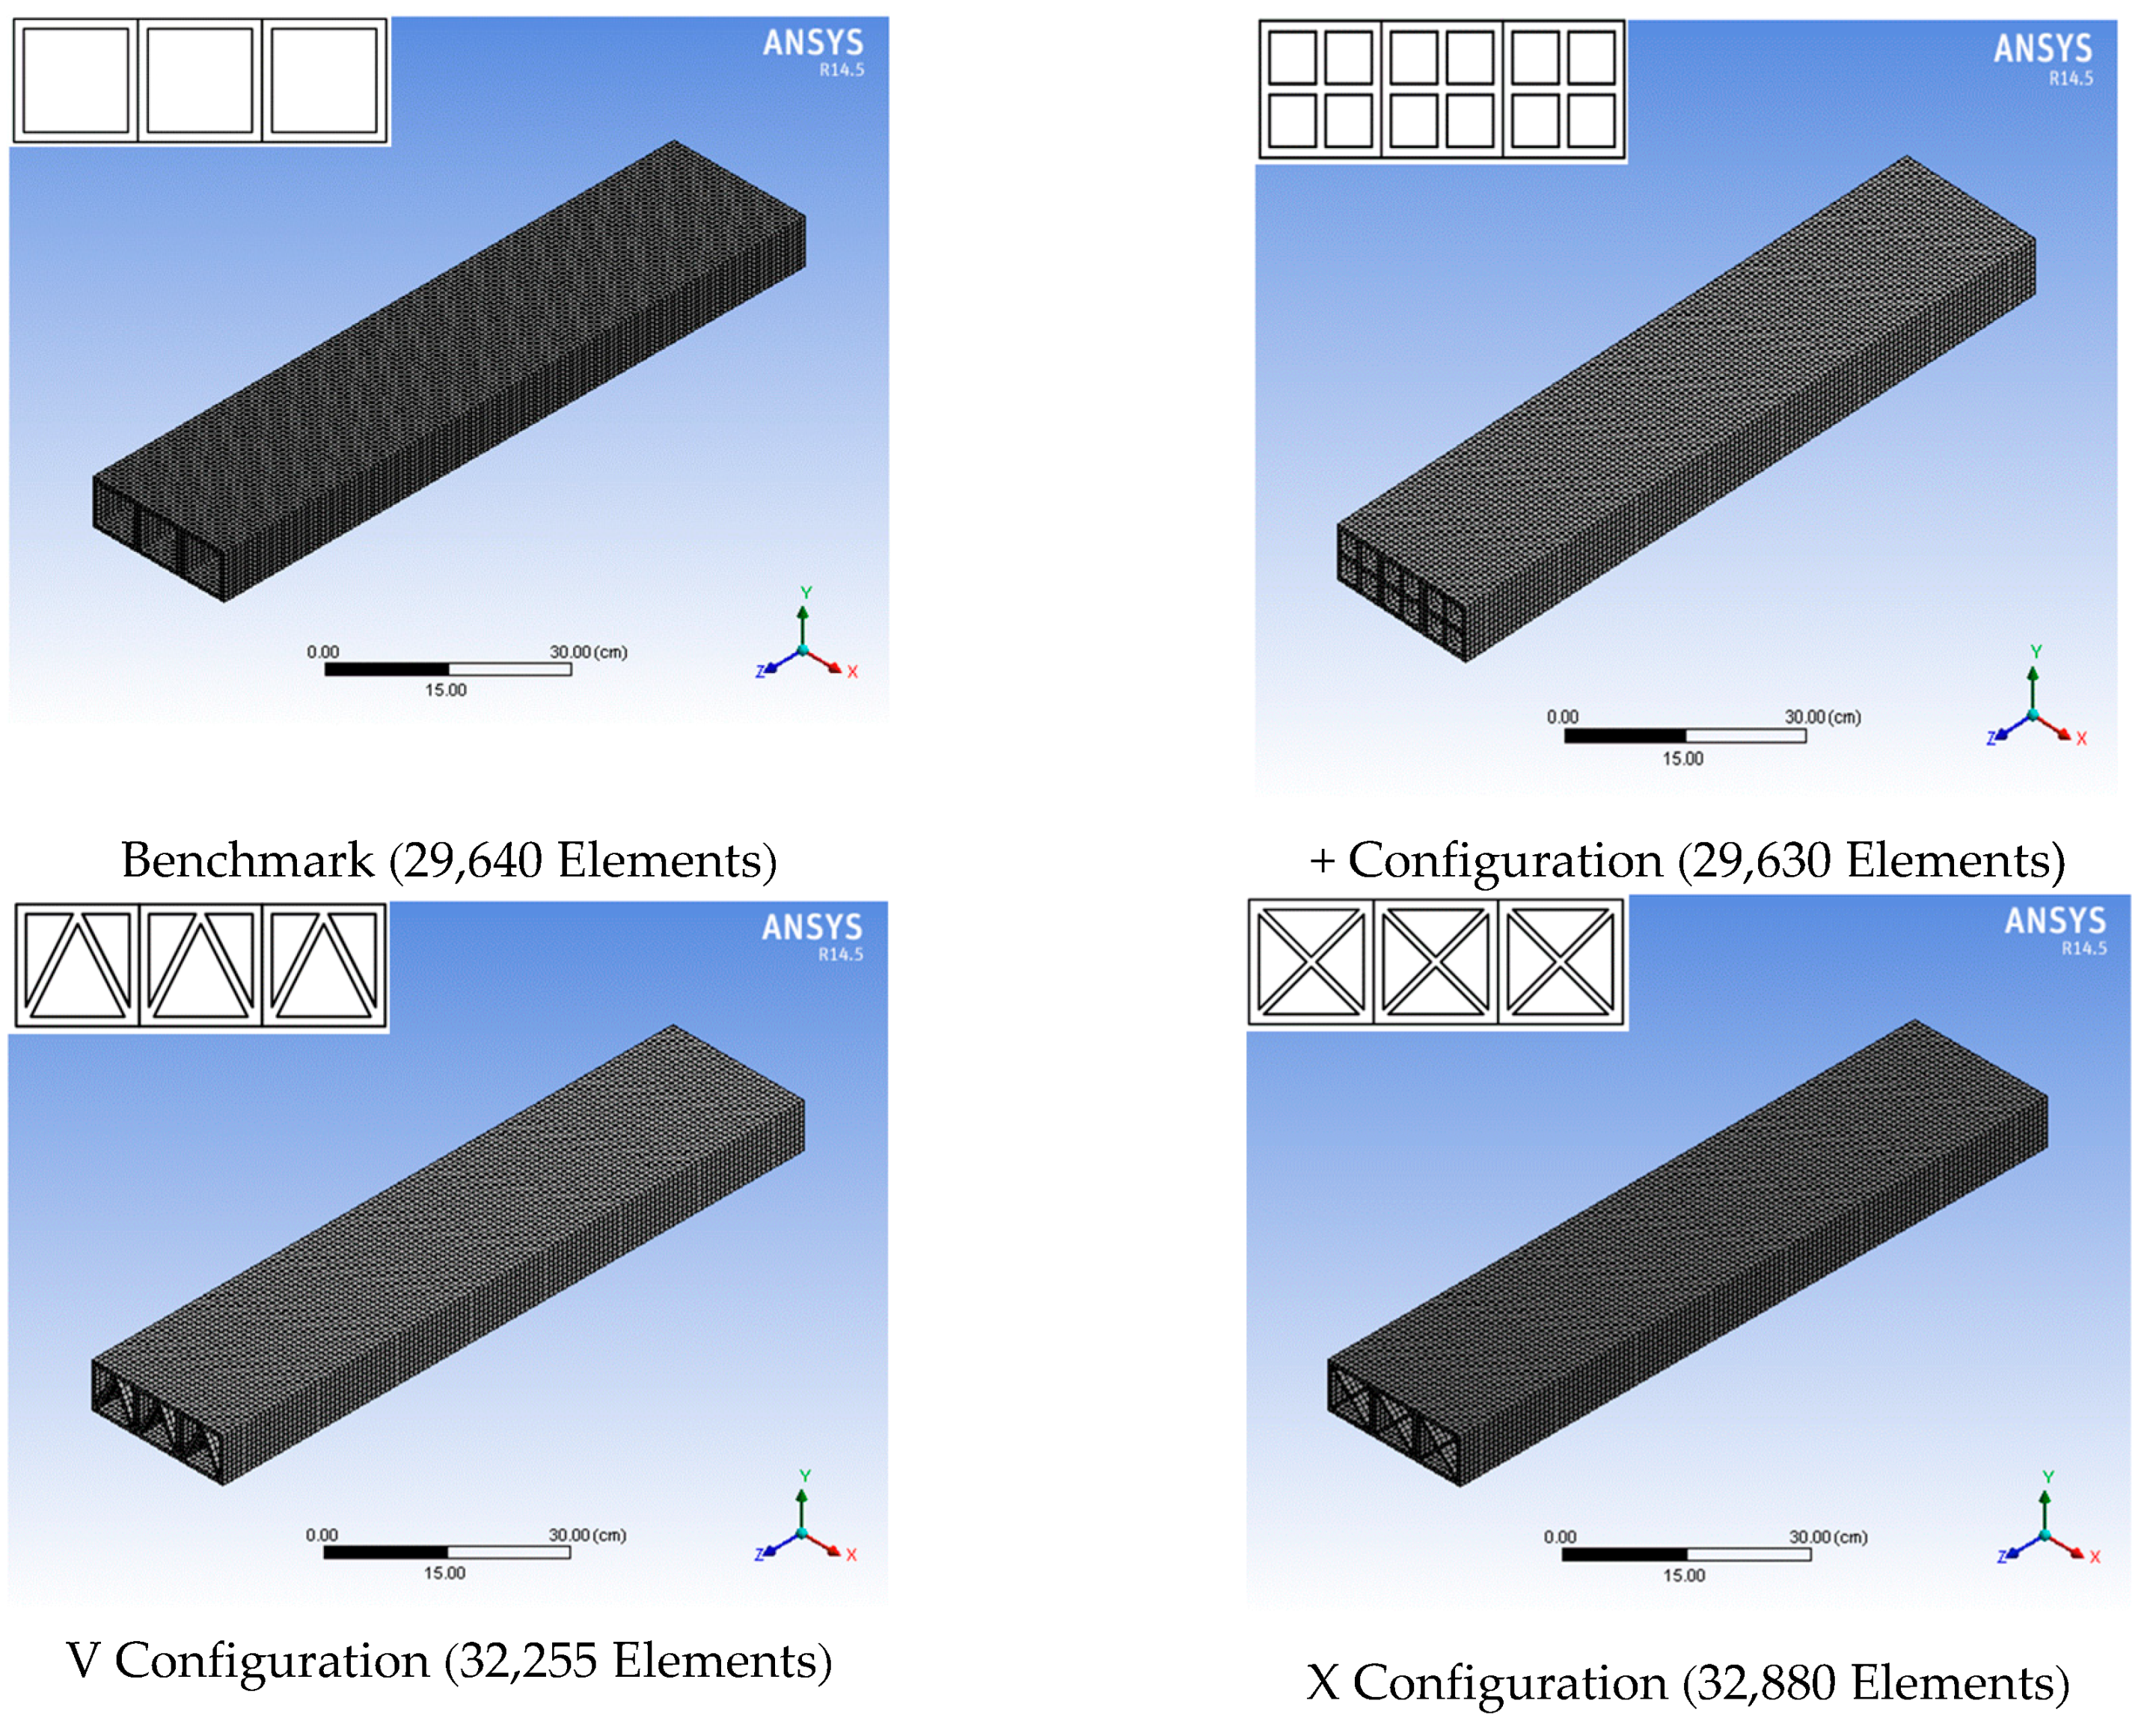
After the validation of the finite element model established in the previous section, a mesh convergence study with the deflection as the criterion was performed on each of the specimens. Also, an appropriate number of elements was selected to model each deck panel to manage accuracy and computational efficiency. Figure 9 shows the result of one mesh convergence study (representative of the others) that was performed on the benchmark deck panel. For this case, based on evidence of the slope of the convergence curve being less than 5 × 10⁻⁸, the selected number of 29,640 elements was deemed sufficient to model the deck panel. The same process was followed to determine a suitable number of elements for each of the seven other deck panels. Figure 10 illustrates the discretization of each deck panel with the corresponding number of elements used, based on the results of each mesh convergence study.
After the accuracy of the finite element model was ensured through the convergence study performed on the benchmark deck panel, each of the seven proposed tube assemblies was then used to simulate the actual behavior of each of the tubular decks. The specimen was first tested in bending under the same experimental setting as the one in the validation test. The tubular decks were simply supported and subjected to three-point bending. A length of the tubular decks of 110 cm was used for the validation test specimen and the distance between the supports was 90 cm. The finite element models were properly restrained from translation in the y-direction at the supports. Then, a concentrated load was applied at the mid-span. Figure 11 illustrates the analysis setting for the bending test of the FRP deck. The resulting deflection values at the mid-span of each deck panel were recorded with the help of a y-direction deformation probe fitted at the center of the bottom face of the finite element models.
The specimens were then tested in torsion. The span of the tubular decks was again set to 100 cm, the tubular decks assemblies were cantilevered at one end and moments of increasing values were applied to the other end. Figure 12 illustrates the analysis setting for the torsion test of the GFRP tubular deck. The average rotation values were obtained by calculating the average values of the rotation about the z axis.
5. Numerical Analysis Results and Discussion
Based on the finite-element numerical analysis results, we are able to distinguish which internally stiffened sections have better bending or torsional rigidity. Then, we can incorporate these GFRP deck sections in the engineering design and applications.
5.1. Numerical Analysis of the Bending Stiffness
In this analysis, eight tubular decks were evaluated including the non-stiffened tubular deck and seven proposed tubular decks with stiffeners. The loads applied to each tubular deck ranged from 0 to 46 kN. Figure 13 shows the plot of the applied loads against the corresponding deflection values recorded at the mid-span of each tubular deck. The bending stiffness was defined as the force divided by the displacement, i.e., the slopes of the curves shown in Figure 13; and the values are listed in Table 4. Table 4 lists the moment of inertia about the x axis as well as the increase of bending stiffness in each tubular deck, defined as the percentage increase of the stiffness of the tubular deck above the stiffness of the non-stiffened tubular deck.
An analysis of the results revealed that the tubular deck with the “O” type stiffener pattern performed the best in the bending test with an increase in bending stiffness of 44.39%. It is worth mentioning that other tubular decks, namely the “V” type and the “D” type tubular deck, share the characteristics of vertical support at their midsection and also possess diagonal components that enhance the overall diagonal rigidity of the structure. These performed much better than other tubular decks that only have either one of the two characteristics just mentioned. A previous study of the load transfer between the flanges and the webs, conducted by Valbona [24] on a deck with similar characteristics, revealed that due to the triangular configuration of the deck, the forces were mainly transferred through the web by truss action. This load transfer mechanism, contributing to reducing the global deflection of the tubular deck, could be a rational reason to explain the superior performances in the bending of the three best performing tubular decks compared to the four others. It is moreover important to notice that despite its significantly high moment of inertia, the “H” type tubular deck performed poorly as shown in Table 4.
5.2. Numerical Analysis of the Torsional Stiffness
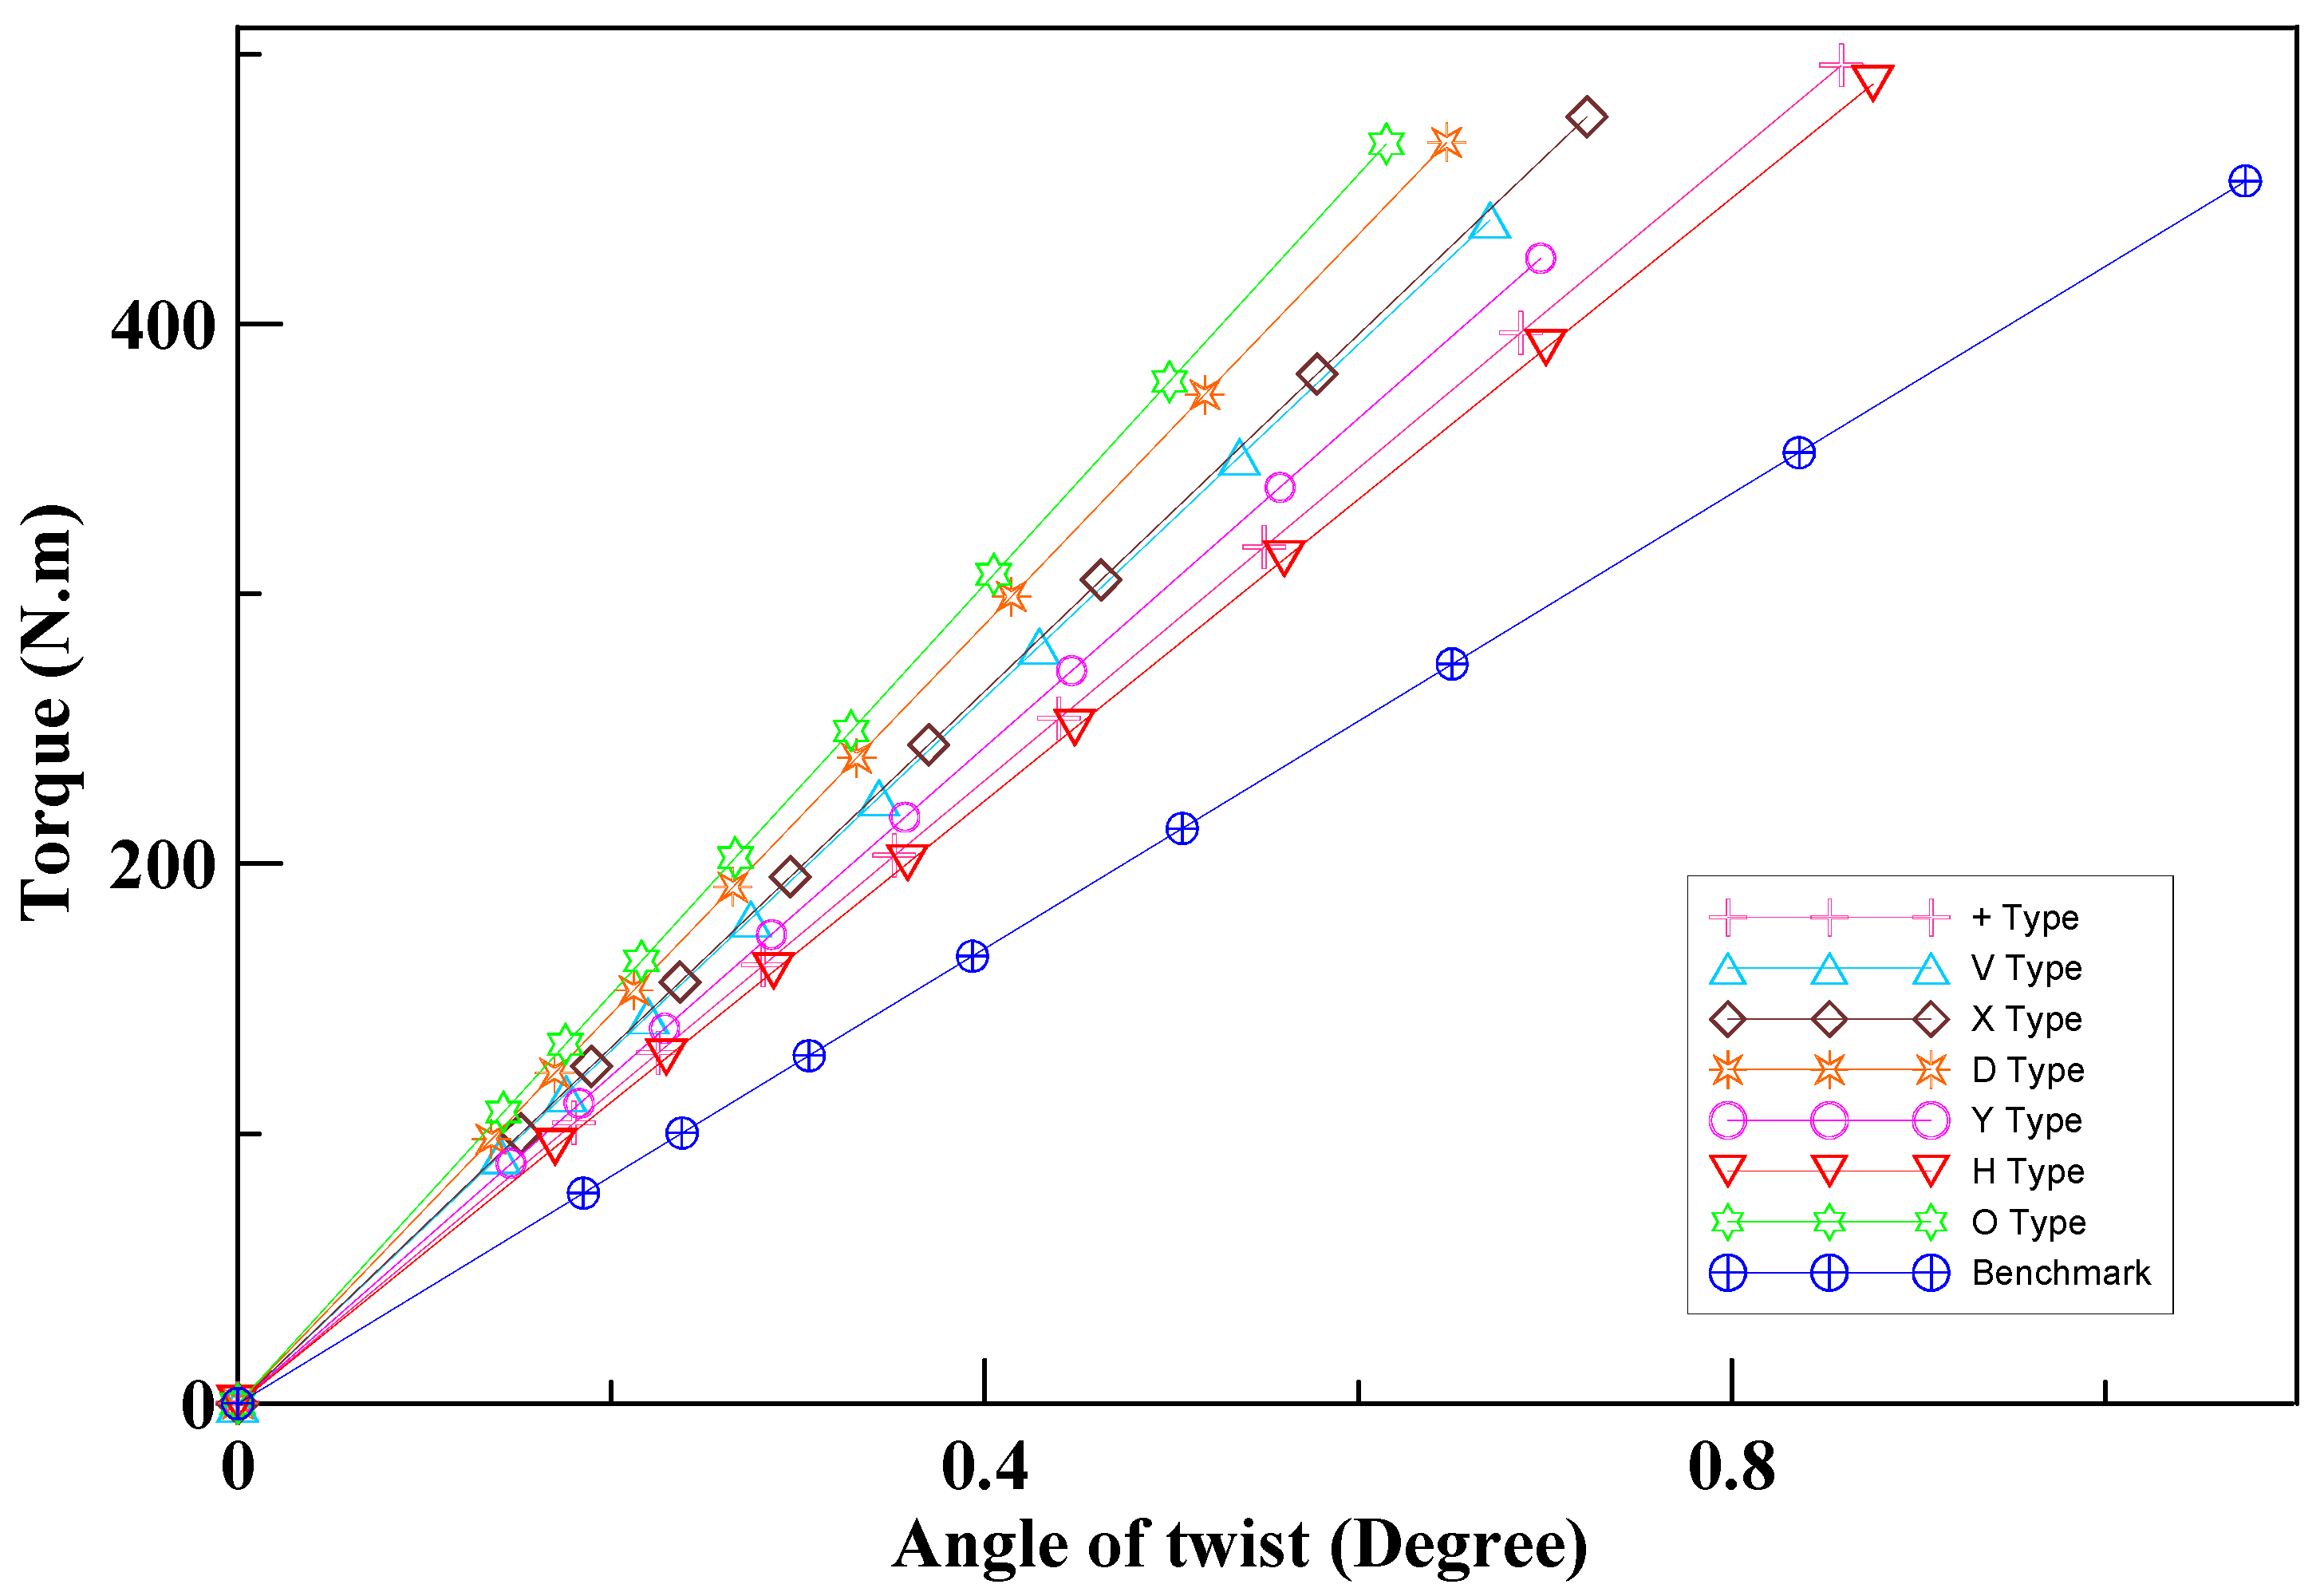
The same eight FRP tubular decks were then evaluated in torsion by fixing them at one end and applying pure moments varying in magnitude from 0 to 500 N-m at the free end. Figure 14 shows the plot of the applied twisting moments versus the corresponding rotation angle values recorded at the free end of each tubular deck. The torsional stiffness was defined as the twisting moment divided by the corresponding rotation angle; and the values are listed in Table 5. Table 5 lists the polar moment of inertia about the z-axis together with the torsional stiffness increase of each tubular deck.
As was the case for the bending analysis, the “O” type deck panel demonstrated a superior performance as compared to other tubular decks considered in this study. This was evident by a torsional stiffness increase of about 80.08%. Aside from the “O” type deck panel, another tubular deck that stood out in terms of performance was the “D” type tubular deck, which also offered a torsional stiffness increase of around 71.29%. The superior performance of the “O” type and “D” type tubular deck in torsion can be ascribed to the circular pattern or closed shape, which allows a smooth shear flow through the section of the tubular deck.
Furthermore, the same observation in the bending analysis was made for the “H” type tubular deck concerning the disproportion that existed between its polar moment of inertia, which is the highest, and its relative torsional stiffness increase. The performance was the worst among the seven stiffened tubular decks considered in this study. The polar moment of inertia was a factor in the torsional rigidity of a panel, defined as the product of the polar moment of inertia (also referred to as torsion constant, J) and the modulus of rigidity (also called the shear modulus, G). The low shear stiffness of the section could most likely be the main contributor to the poor performance of the “H” type tubular deck as compared to the other stiffened tubular decks.
6. Conclusions
From the above results, the following conclusions could be drawn:
- (1)
- For the 7.5 × 7.5 cm square tube profile with thickness 0.5 cm subjected to the three-point bending test, the finite-element numerical results were in good agreement with the experimental results. The deflection values of various tubular decks calculated from the TBT are much closer to the experimental data than that of the EBT. Therefore, the shear deformation needs to be considered.
- (2)
- For the bending analysis, the tubular decks with stiffener patterns of the “O” type, “V” type, and “D” type show superior performance compared to others. Their bending stiffness compared to the non-stiffened benchmark tubular deck increased by 44.39%, 33.29%, and 33.26%, respectively.
- (3)
- For the torsional analysis, the tubular decks with stiffener patterns that form circular patterns or closed shapes inside each profile performed better than their counterparts. The tubular decks with stiffener patterns of the “O” type, and “D” type show superior performance compared to others. Their torsional stiffness compared to the non-stiffened benchmark tubular deck increased by 80.08%, 71.29%, and 33.26%, respectively.
- (4)
- The “O” type tubular deck clearly showed excellent performance under the bending and torsional loadings. Compared to the non-stiffened benchmark tubular deck, the “O” type tubular deck showed an increase of 44.39% and 80.08% in bending and torsional stiffness, respectively.
- (5)
- Based on the finite-element numerical analysis results, it is possible to distinguish which internally stiffened sections have better bending or torsional rigidity. However, before extensively using the internally stiffened sections in engineering applications, these finite-element models should be carefully checked.
Author Contributions
Conceptualization: Y.F.L. and W.C.; Methodology: Y.F.L. and W.C.; Software: H.A.M.; Writing-Original Draft Preparation: H.A.M.; Writing-Review & Editing: Y.F.L. and W.C.; Supervision: Y.F.L.; Project Administration: Y.F.L.
Funding
This research was funded by National Science Council of Taiwan, under contract No. NSC 101-2221-E-027-122, and the “Research Center of Energy Conservation for New Generation of Residential, Commercial, and Industrial Sectors” from the Ministry of Education in Taiwan.
Conflicts of Interest
The authors declare no conflict of interest.
References
- Li, Y.F.; Yu, C.C.; Chen, S.Y.; Badjie, S. The carbon footprint calculation of the GFRP pedestrian bridge at Tai-Jiang National Park. Int. Rev. Spat. Plan. Sustain. Dev. 2013, 1, 13–28. [Google Scholar] [CrossRef]
- Zhang, C.; Amaduddin, M.; Canning, L. Carbon dioxide evaluation in a typical bridge deck replacement project. Proc. Inst. Civ. Eng. 2011, 164, 183–194. [Google Scholar] [CrossRef]
- Knippers, J.; Pelke, E.; Gabler, M.; Berger, D. Bridges with glass fiber-reinforced polymer decks: The road bridge in Friedberg, Germany. Struct. Eng. Int. 2010, 20, 400–404. [Google Scholar] [CrossRef]
- Areiza-Hurtado, M.; Bansal, A.; Paulotto, C.; Primi, S. FRP girder bridges: Lessons learned in Spain in the last decade. In Proceedings of the 6th International Conference on FRP Composites in Civil Engineering, Rome, Italy, 13–15 June 2012. [Google Scholar]
- Li, Y.F.; Badjie, S.; Chen, W.W.; Chiu, Y.T. Case study of first all-GFRP pedestrian bridge in Taiwan. Case Stud. Constr. Mater. 2014, 1, 83–95. [Google Scholar] [CrossRef]
- Li, Y.F.; Badjie, S.; Chiu, Y.T.; Chen, W. Placing an FRP bridge in Taijiang national park and in virtual reality. Case Stud. Constr. Mater. 2018, 8, 226–237. [Google Scholar] [CrossRef]
- Bakis, C.E.; Bank, L.C.; Brown, V.L.; Cosenza, E.; Davalos, J.F.; Lesko, J.J.; Machida, A.; Rizkalla, S.H.; Triantafillou, T.C. Fiber-reinforced polymer composites for construction—State-of-the-art review. J. Compos. Constr. 2002, 6, 73–87. [Google Scholar] [CrossRef]
- Valbona, M.; Reza, H.; Peter, H. Bridge decks of fibre reinforced polymer (FRP): A sustainable solution. J. Constr. Build. Mater. 2014, 50, 190–199. [Google Scholar]
- Valbona, M.; Al-Emrani, M.; Kliger, R. Upgrading of an existing concrete–steel bridge using fibre reinforced polymer deck—A feasibility study. In Proceedings of the FRP Bridges Conference, London, UK, 13–14 September 2012. [Google Scholar]
- Federal Highway Administration. Composite Bridge Decking: Final Project Report, Publication No. FHWA-HIF-13-029; Federal Highway Administration: Washington, DC, USA, 2013.
- Majumdar, P.K. Strength and Life Prediction of FRP Composite Bridge Deck. Ph.D. Thesis, Virginia Polytechnic Institute and State University, Blackburg, VA, USA, 2008. [Google Scholar]
- Wu, Z.H.; Mirmiran, A.; Zhu, Z.Y.; Swanson, J. Flexural behavior of prestressed FRP tubular bridge deck. Compos. Part B 2009, 40, 125–133. [Google Scholar] [CrossRef]
- Volz, J.S.; Chandrashekhara, K.; Birman, V.; Hawkins, S.; Hopkins, M.; Huo, Z.; Mohamed, M.; Tuwair, H. Polyurethane Foam Infill for Fiber-Reinforced Polymer (FRP) Bridge Deck Panels; Missouri Department of Transportation: Jefferson, MO, USA, 2014.
- Zi, G.; Kim, B.M.; Hwang, Y.K.; Lee, Y.H. The static behavior of a modular foam-filled GFRP bridge deck with a strong web-flange joint. Compos. Struct. 2008, 85, 155–163. [Google Scholar] [CrossRef]
- Zi, G.; Kim, B.M.; Hwang, Y.K.; Lee, Y.H. An experimental study on static behavior of a GFRP bridge deck filled with a polyurethane foam. Compos. Struct. 2008, 82, 257–268. [Google Scholar] [CrossRef]
- Mostafa, A.; Shankar, K.; Morozov, E.V. Experimental, theoretical and numerical investigation of the flexural behaviour of the composite sandwich panels with PVC foam core. Appl. Compos. Mater. 2014, 21, 661–675. [Google Scholar] [CrossRef]
- Alagusundaramoorthy, P.; Harik, I.E.; Choo, C.C. Structural behavior of FRP composite bridge deck panels. J. Bridge Eng. 2006, 11, 384–393. [Google Scholar] [CrossRef]
- Hong, T.H.; Hastak, M. Construction, inspection, and maintenance of FRP deck panels. J. Compos. Constr. 2006, 10, 561–572. [Google Scholar] [CrossRef]
- Brown, D.L.; Berman, J.W. Fatigue and strength evaluation of two glass fiber-reinforced polymer bridge decks. J. Bridge Eng. 2010, 15, 290–301. [Google Scholar] [CrossRef]
- Srivastava, I.; Dey, T.; Chakrabarti, A.; Bhargava, P. Structural optimization of FRP web core decks. J. Compos. Constr. 2013, 17, 395–405. [Google Scholar] [CrossRef]
- Li, Z. Testing and Analysis of a Fiber-Reinforced Polymer (FRP) Bridge Deck. Ph.D. Thesis, Virginia Polytechnic Institute and State University, Blackburg, VA, USA, 2008. [Google Scholar]
- ASTM International. ASTM D790: Standard Test Methods for Flexural Properties of Unreinforced and Reinforced Plastics and Electrical Insulating Materials; ASTM International: West Conshohocken, PA, USA, 2017. [Google Scholar]
- Cowper, G.R. The Shear Coefficient in Timoshenko’s Beam Theory. J. Appl. Mech. 1996, 33, 335–340. [Google Scholar] [CrossRef]
- Valbona, M. Fibre Reinforced Polymer Bridge Decks—A Feasibility Study on Upgrading Existing Concrete-Steel Bridges. Master’s Thesis, Chalmers University of Technology, Göteborg, Sweden, 2011. [Google Scholar]
Figure 1.
The stress–strain diagram of composite material under longitudinal loading.

Figure 2.
The stress–strain diagram of loading perpendicular to the direction of the fibers.

Figure 3.
(a) Cross section of a square tube; (b) Cross section of three square tube assembly.
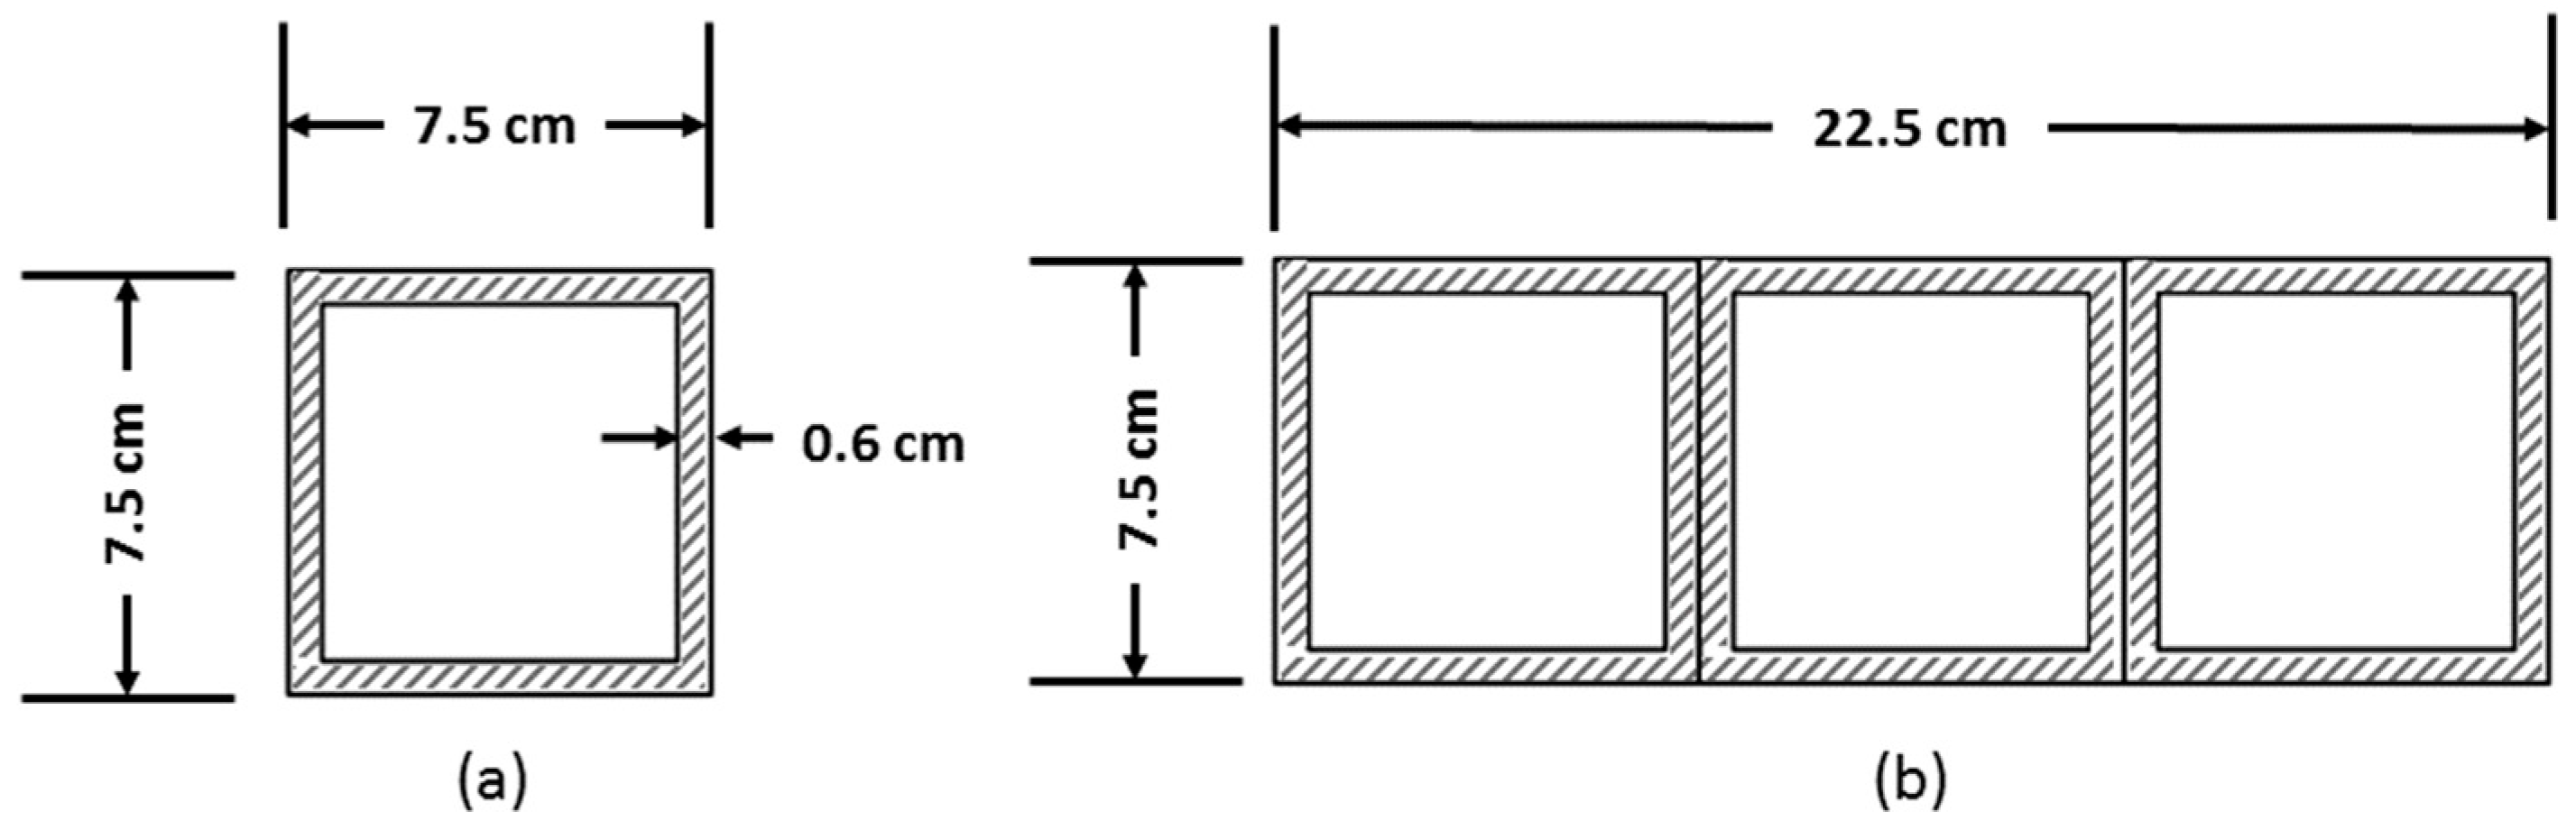
Figure 4.
Cross sections of the seven proposed stiffened tubular decks.
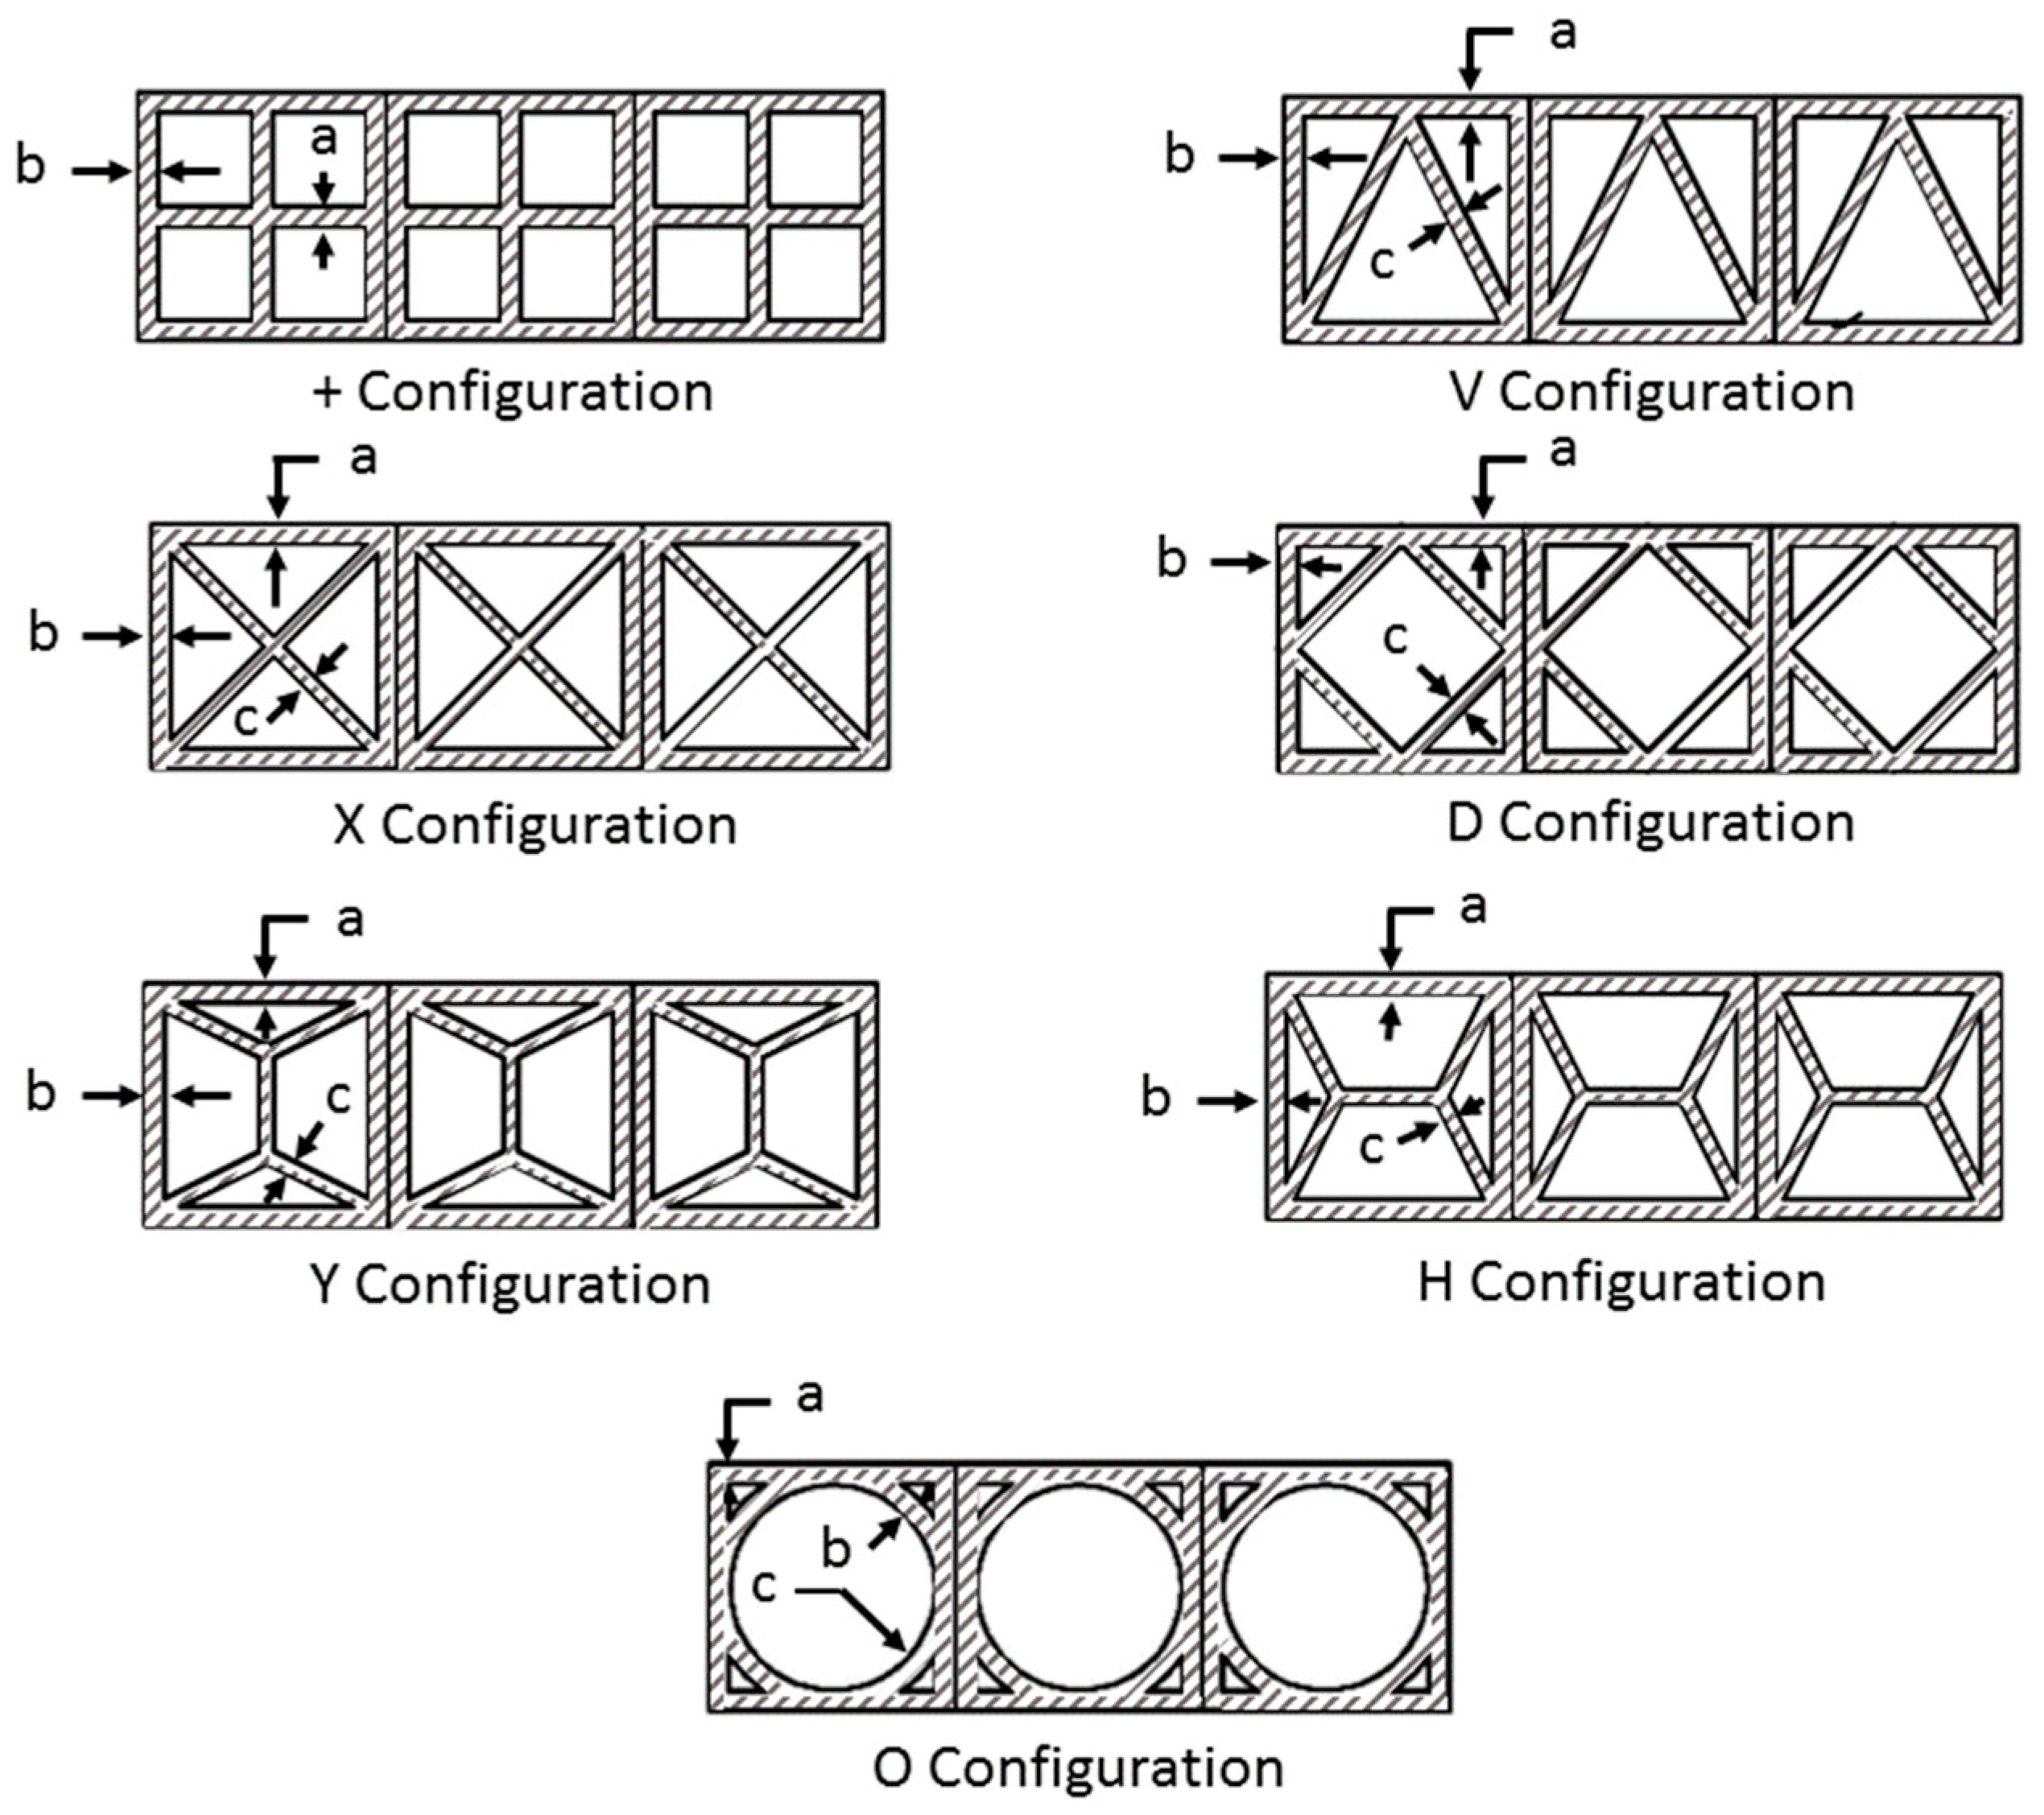
Figure 5.
The illustration diagram of the three-point bending test.
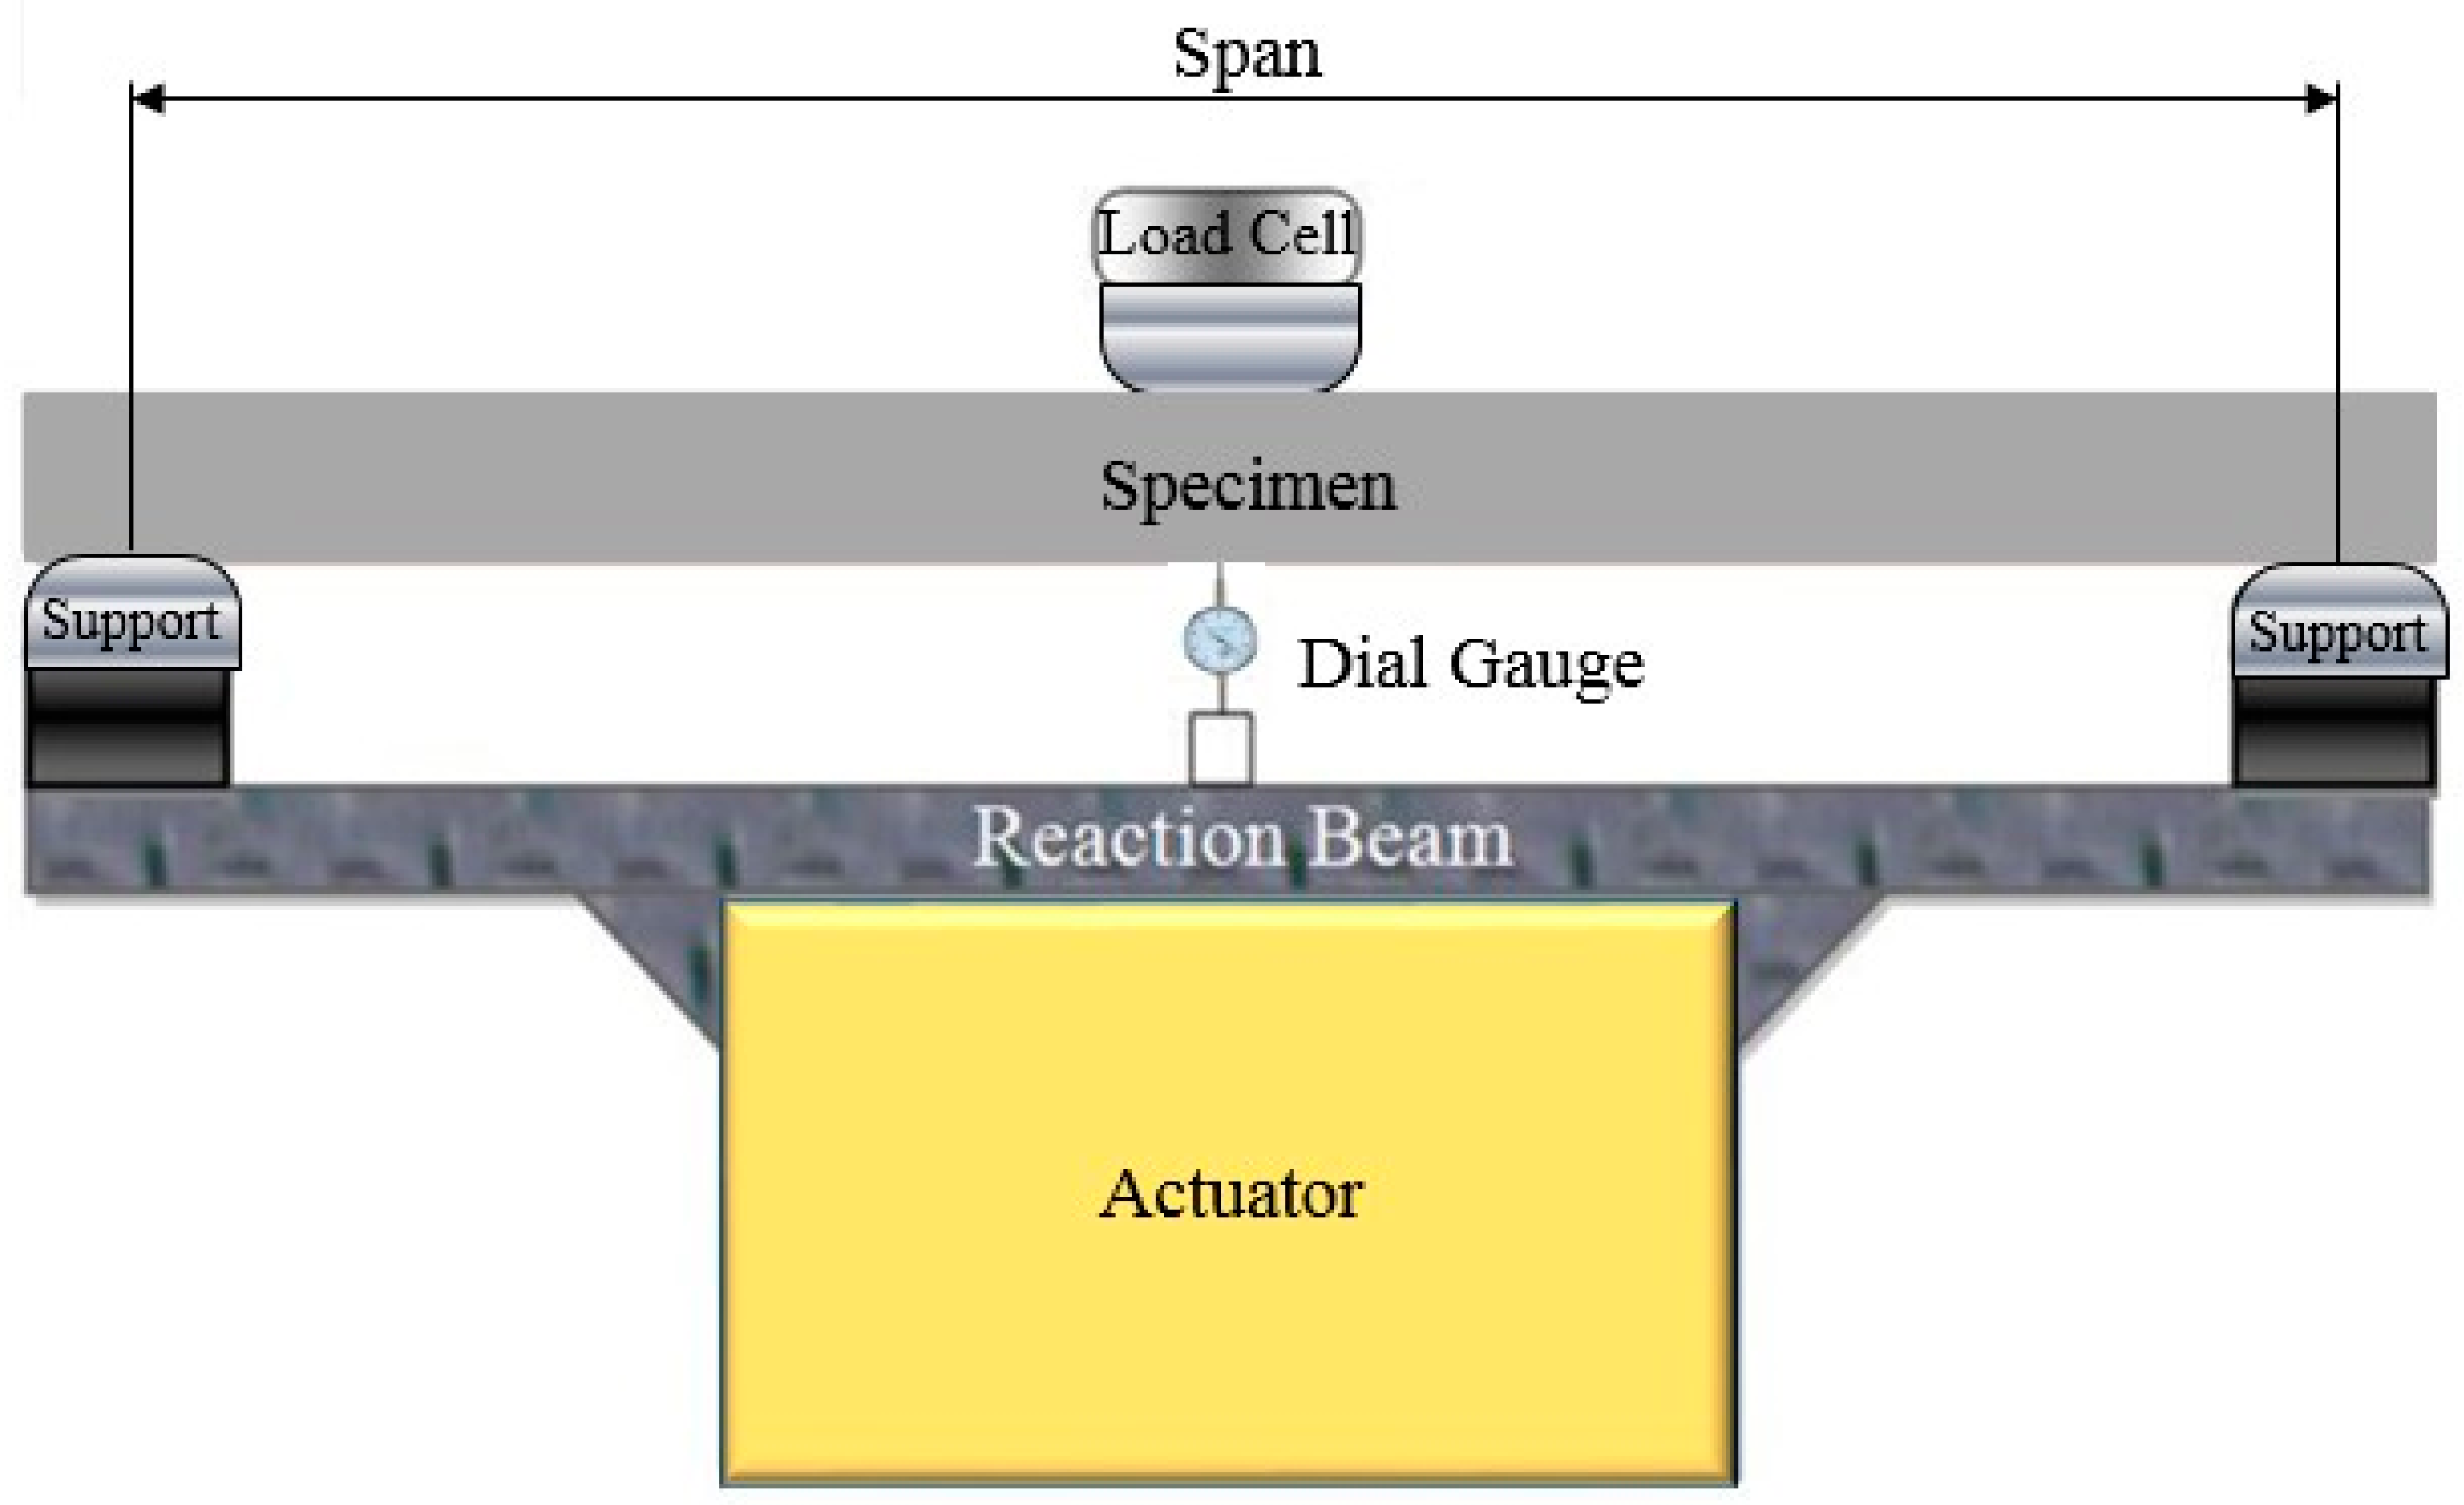
Figure 6.
Three-point bending test of GFRP tube.

Figure 7.
Displacement contour in the y-direction for a bending load of 1.24 kN.
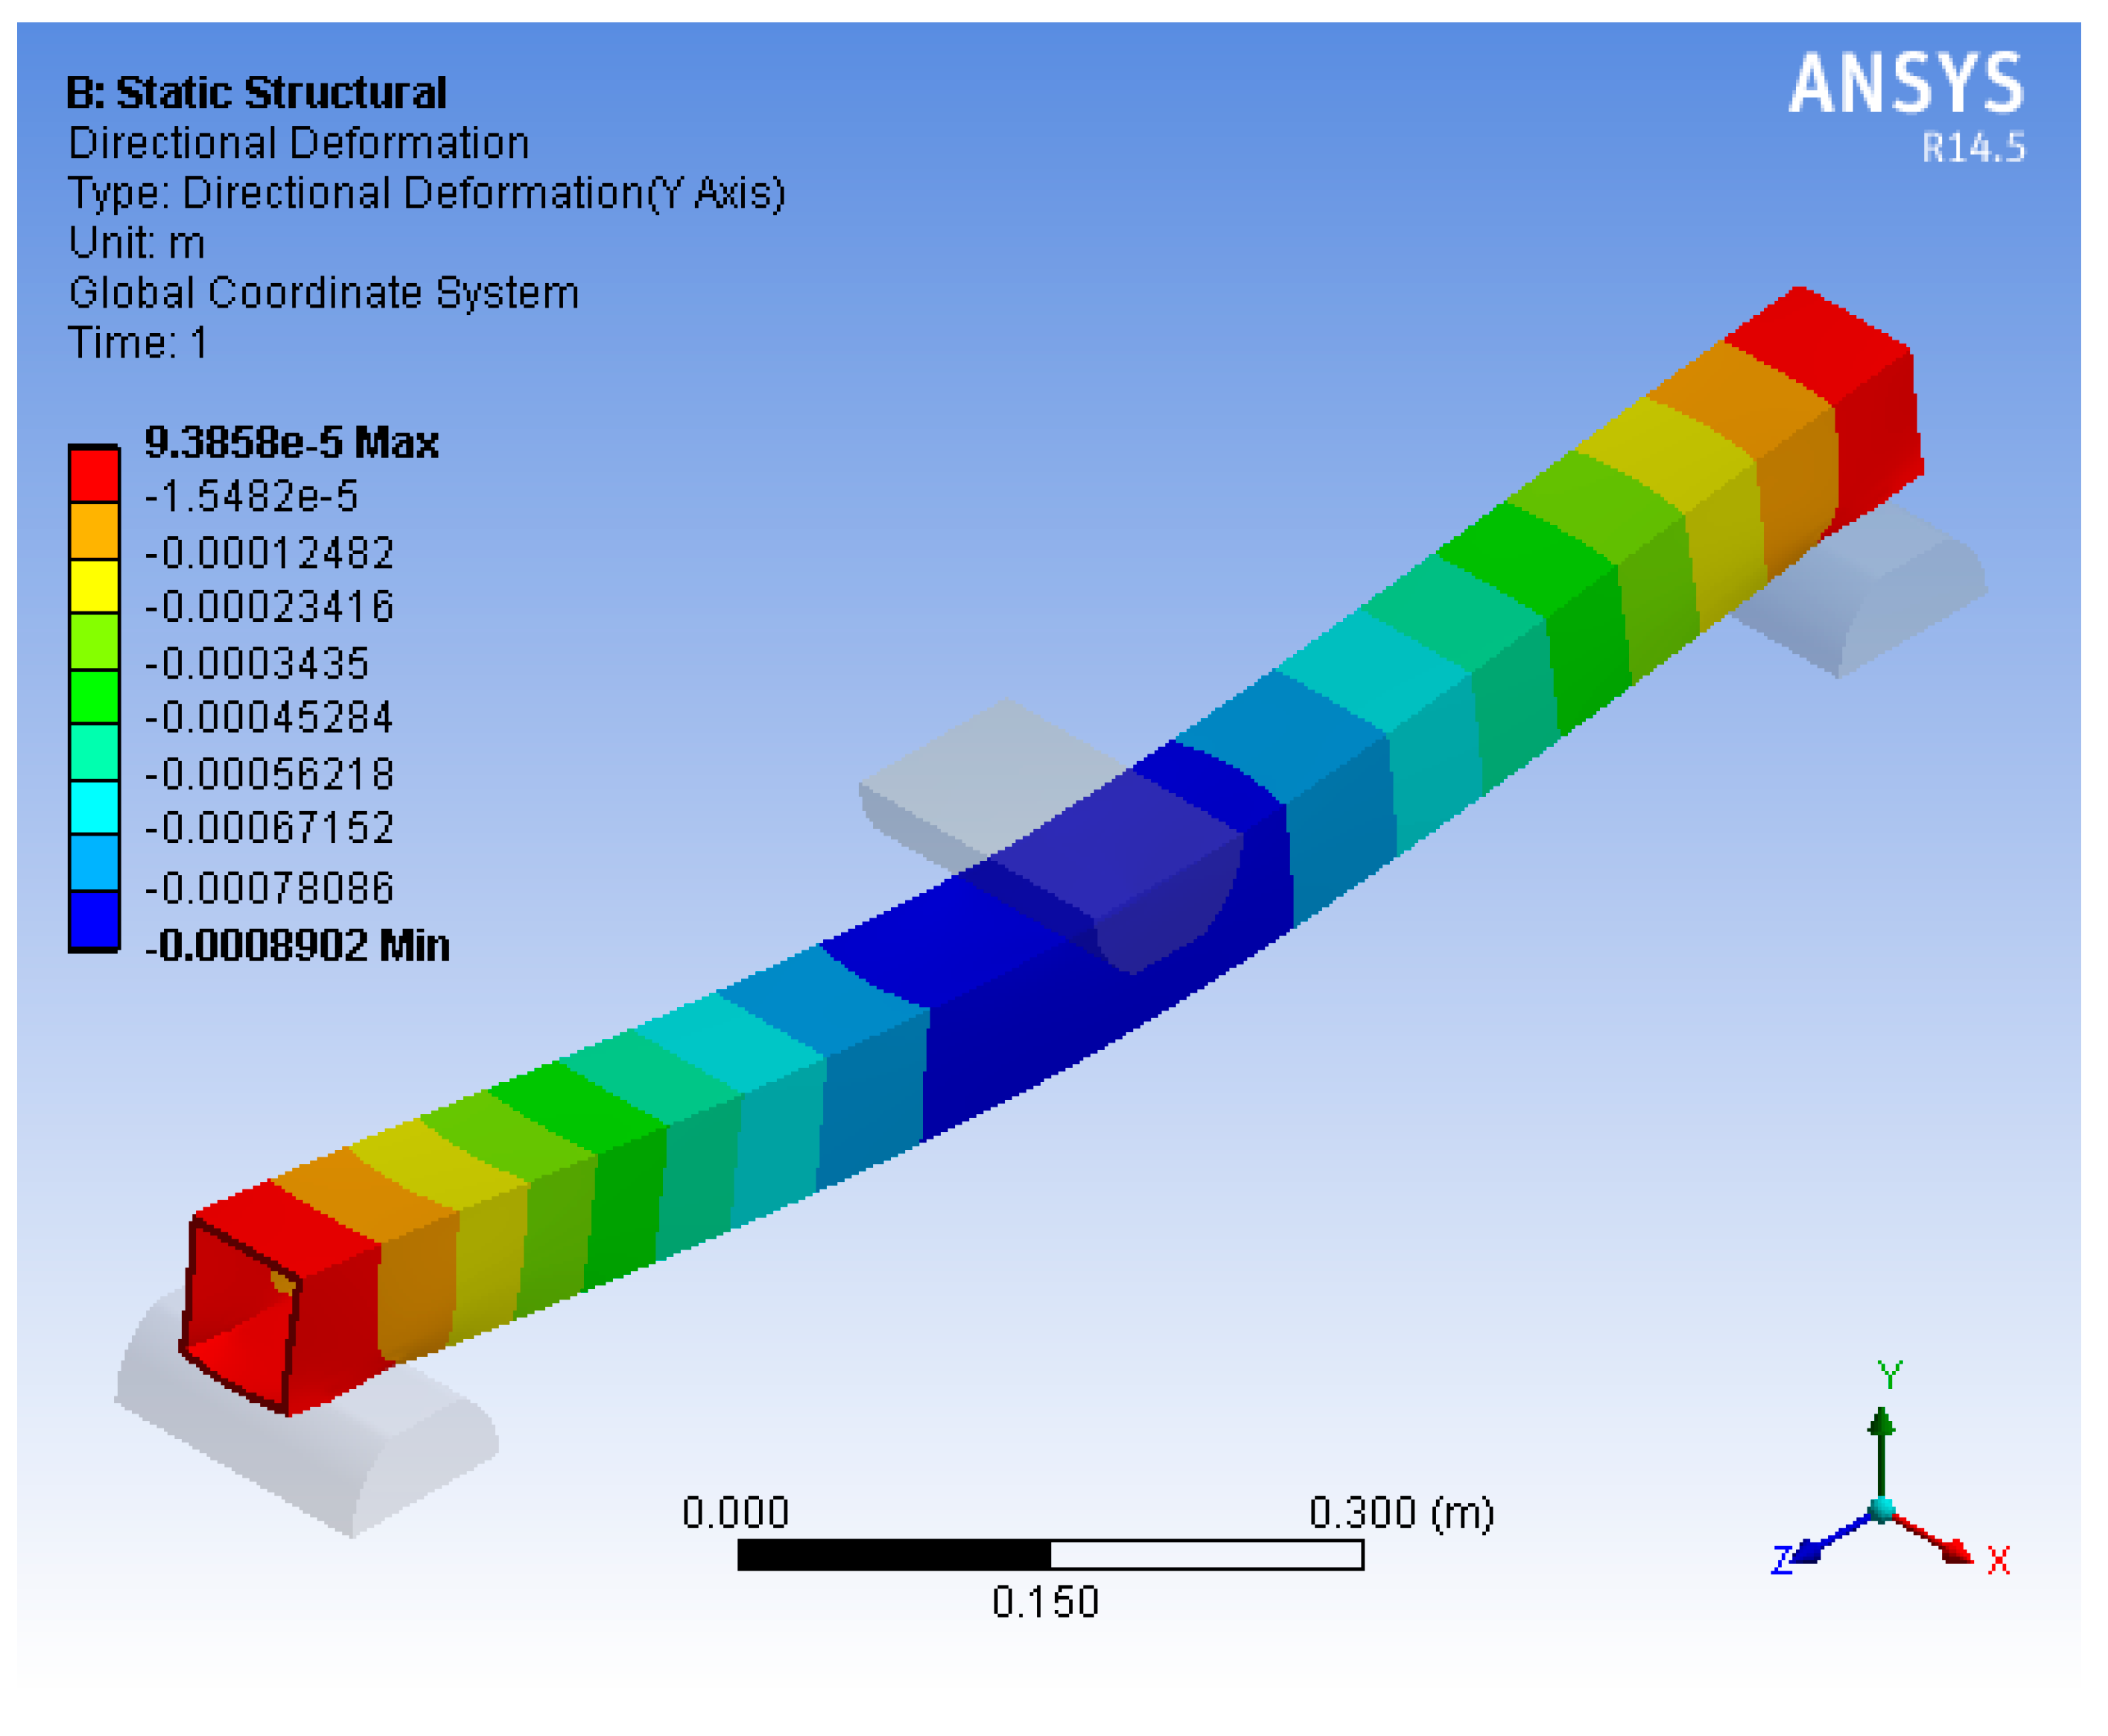
Figure 8.
Experimental and finite-element analysis (FEA) load–displacement relationships.

Figure 9.
Convergence test for the benchmark GFRP deck.
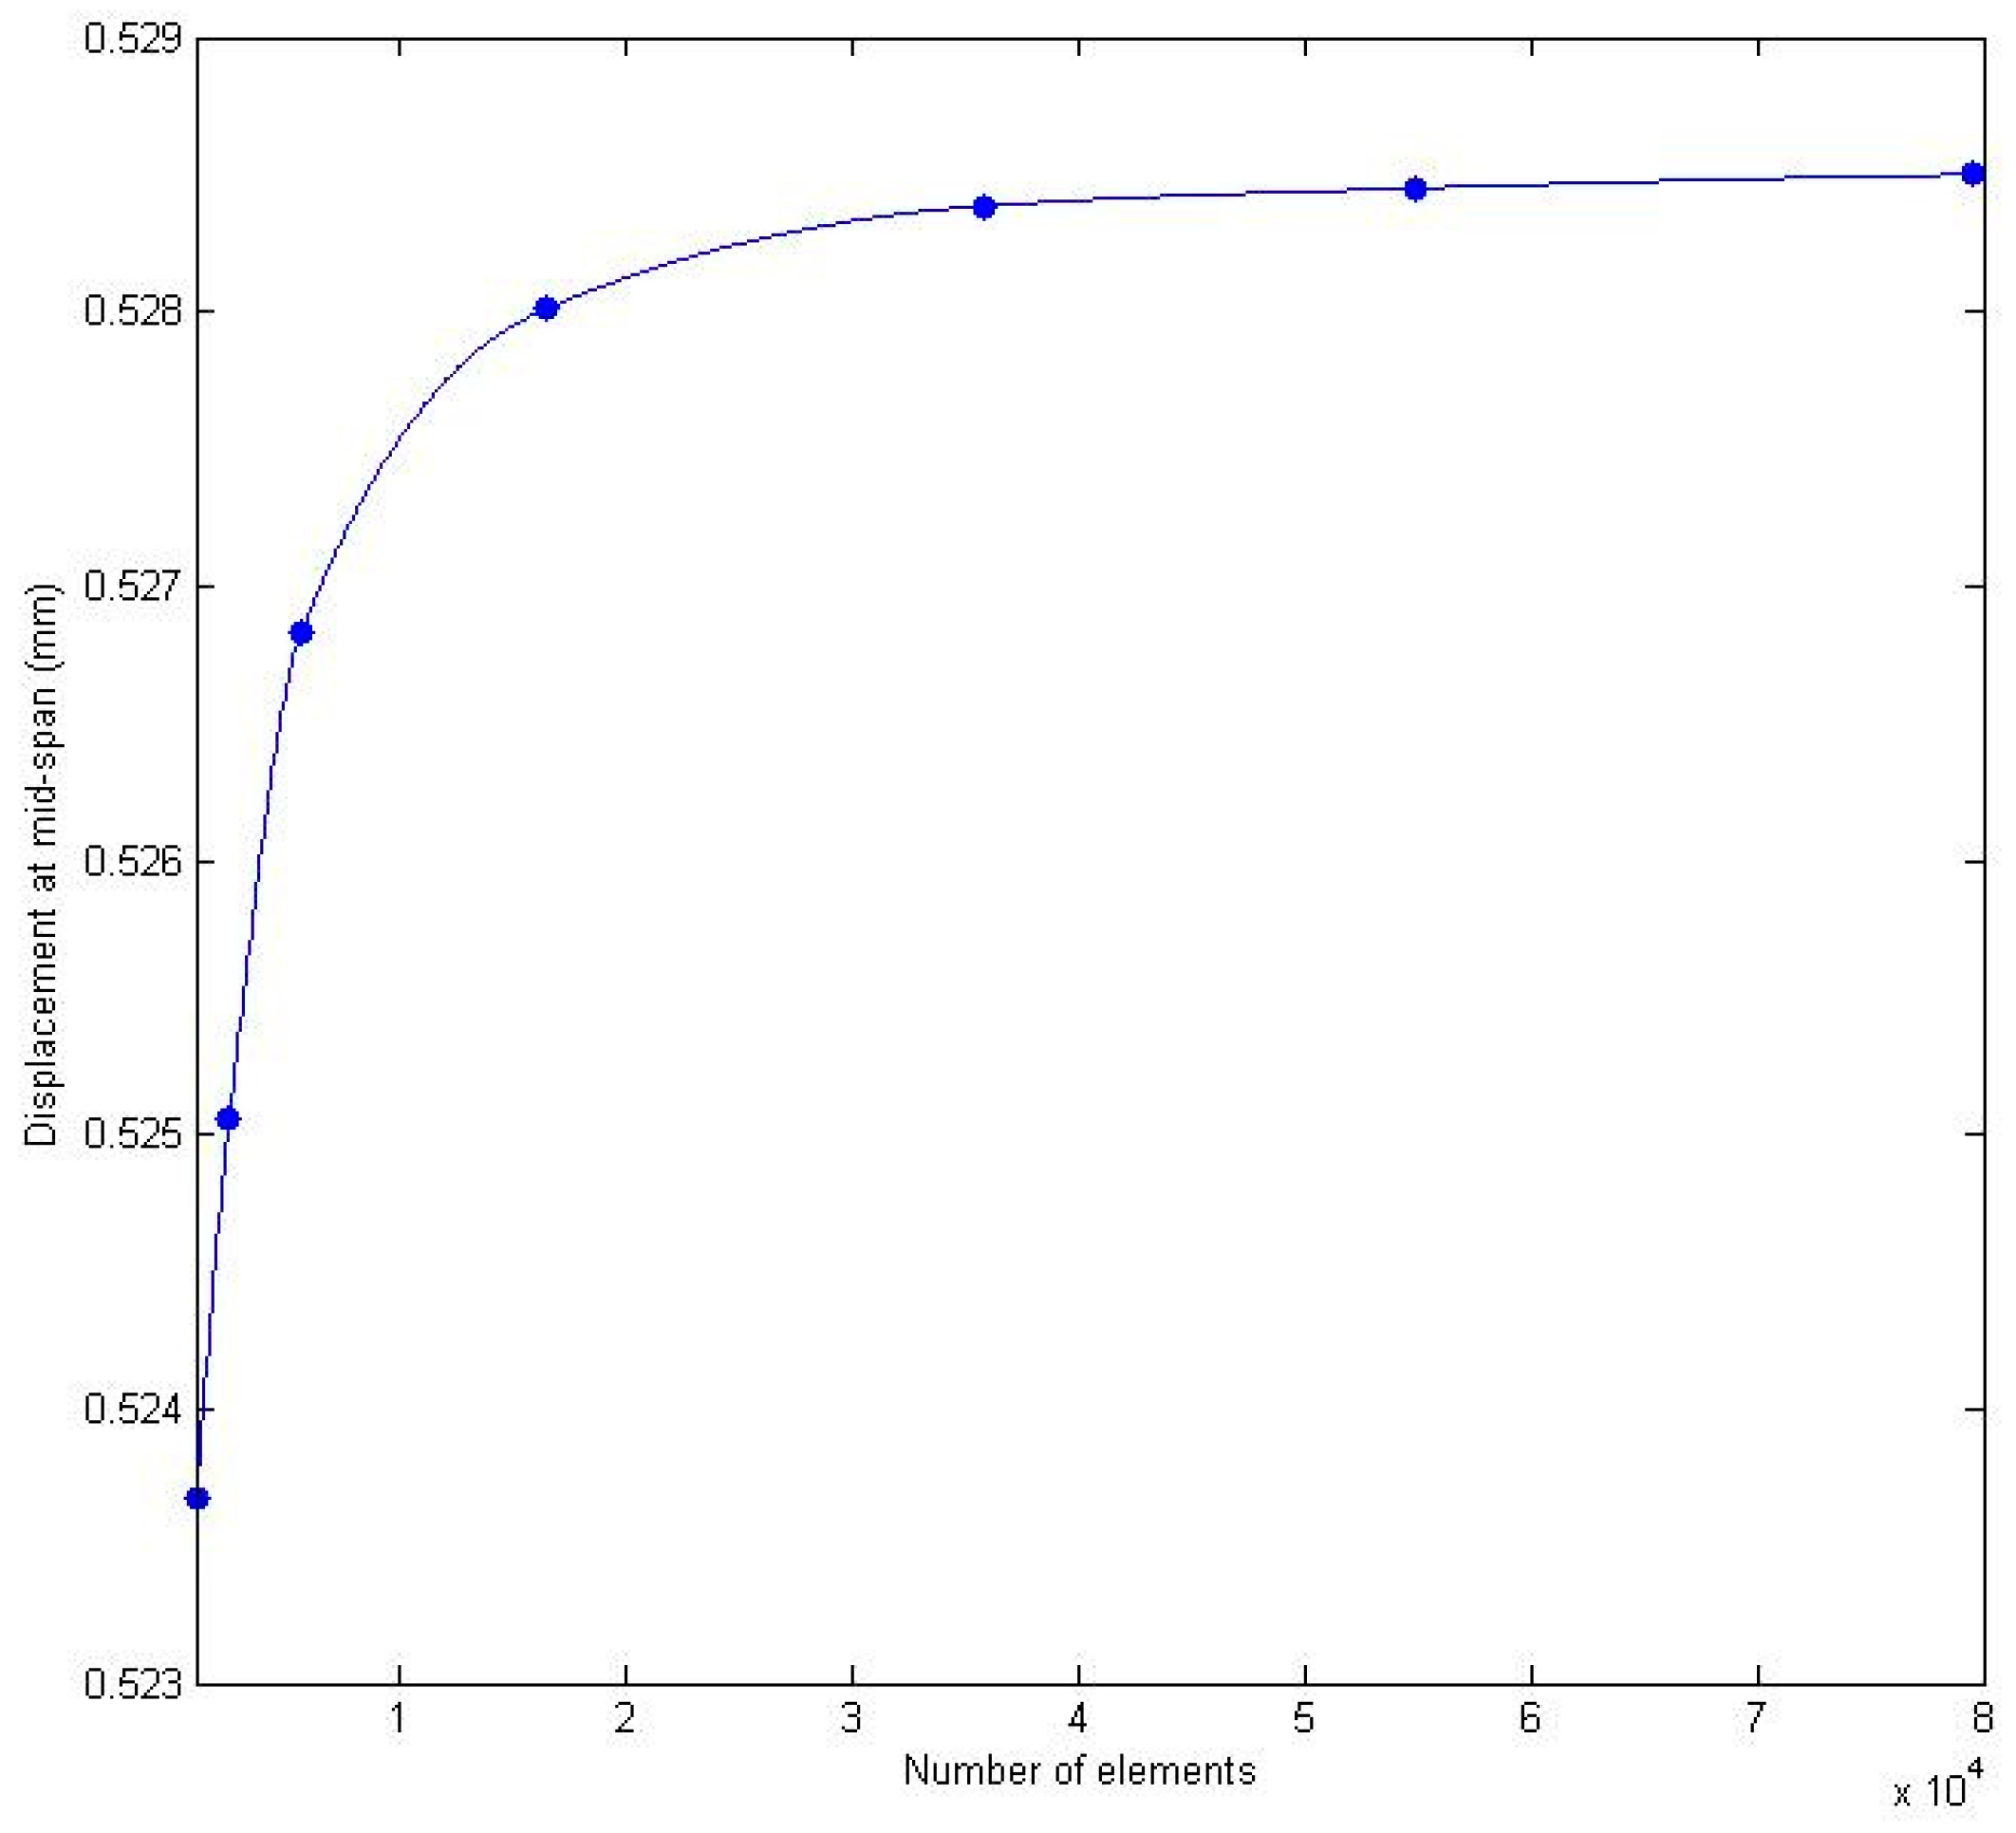
Figure 10.
Discretization of the GFRP deck panels.

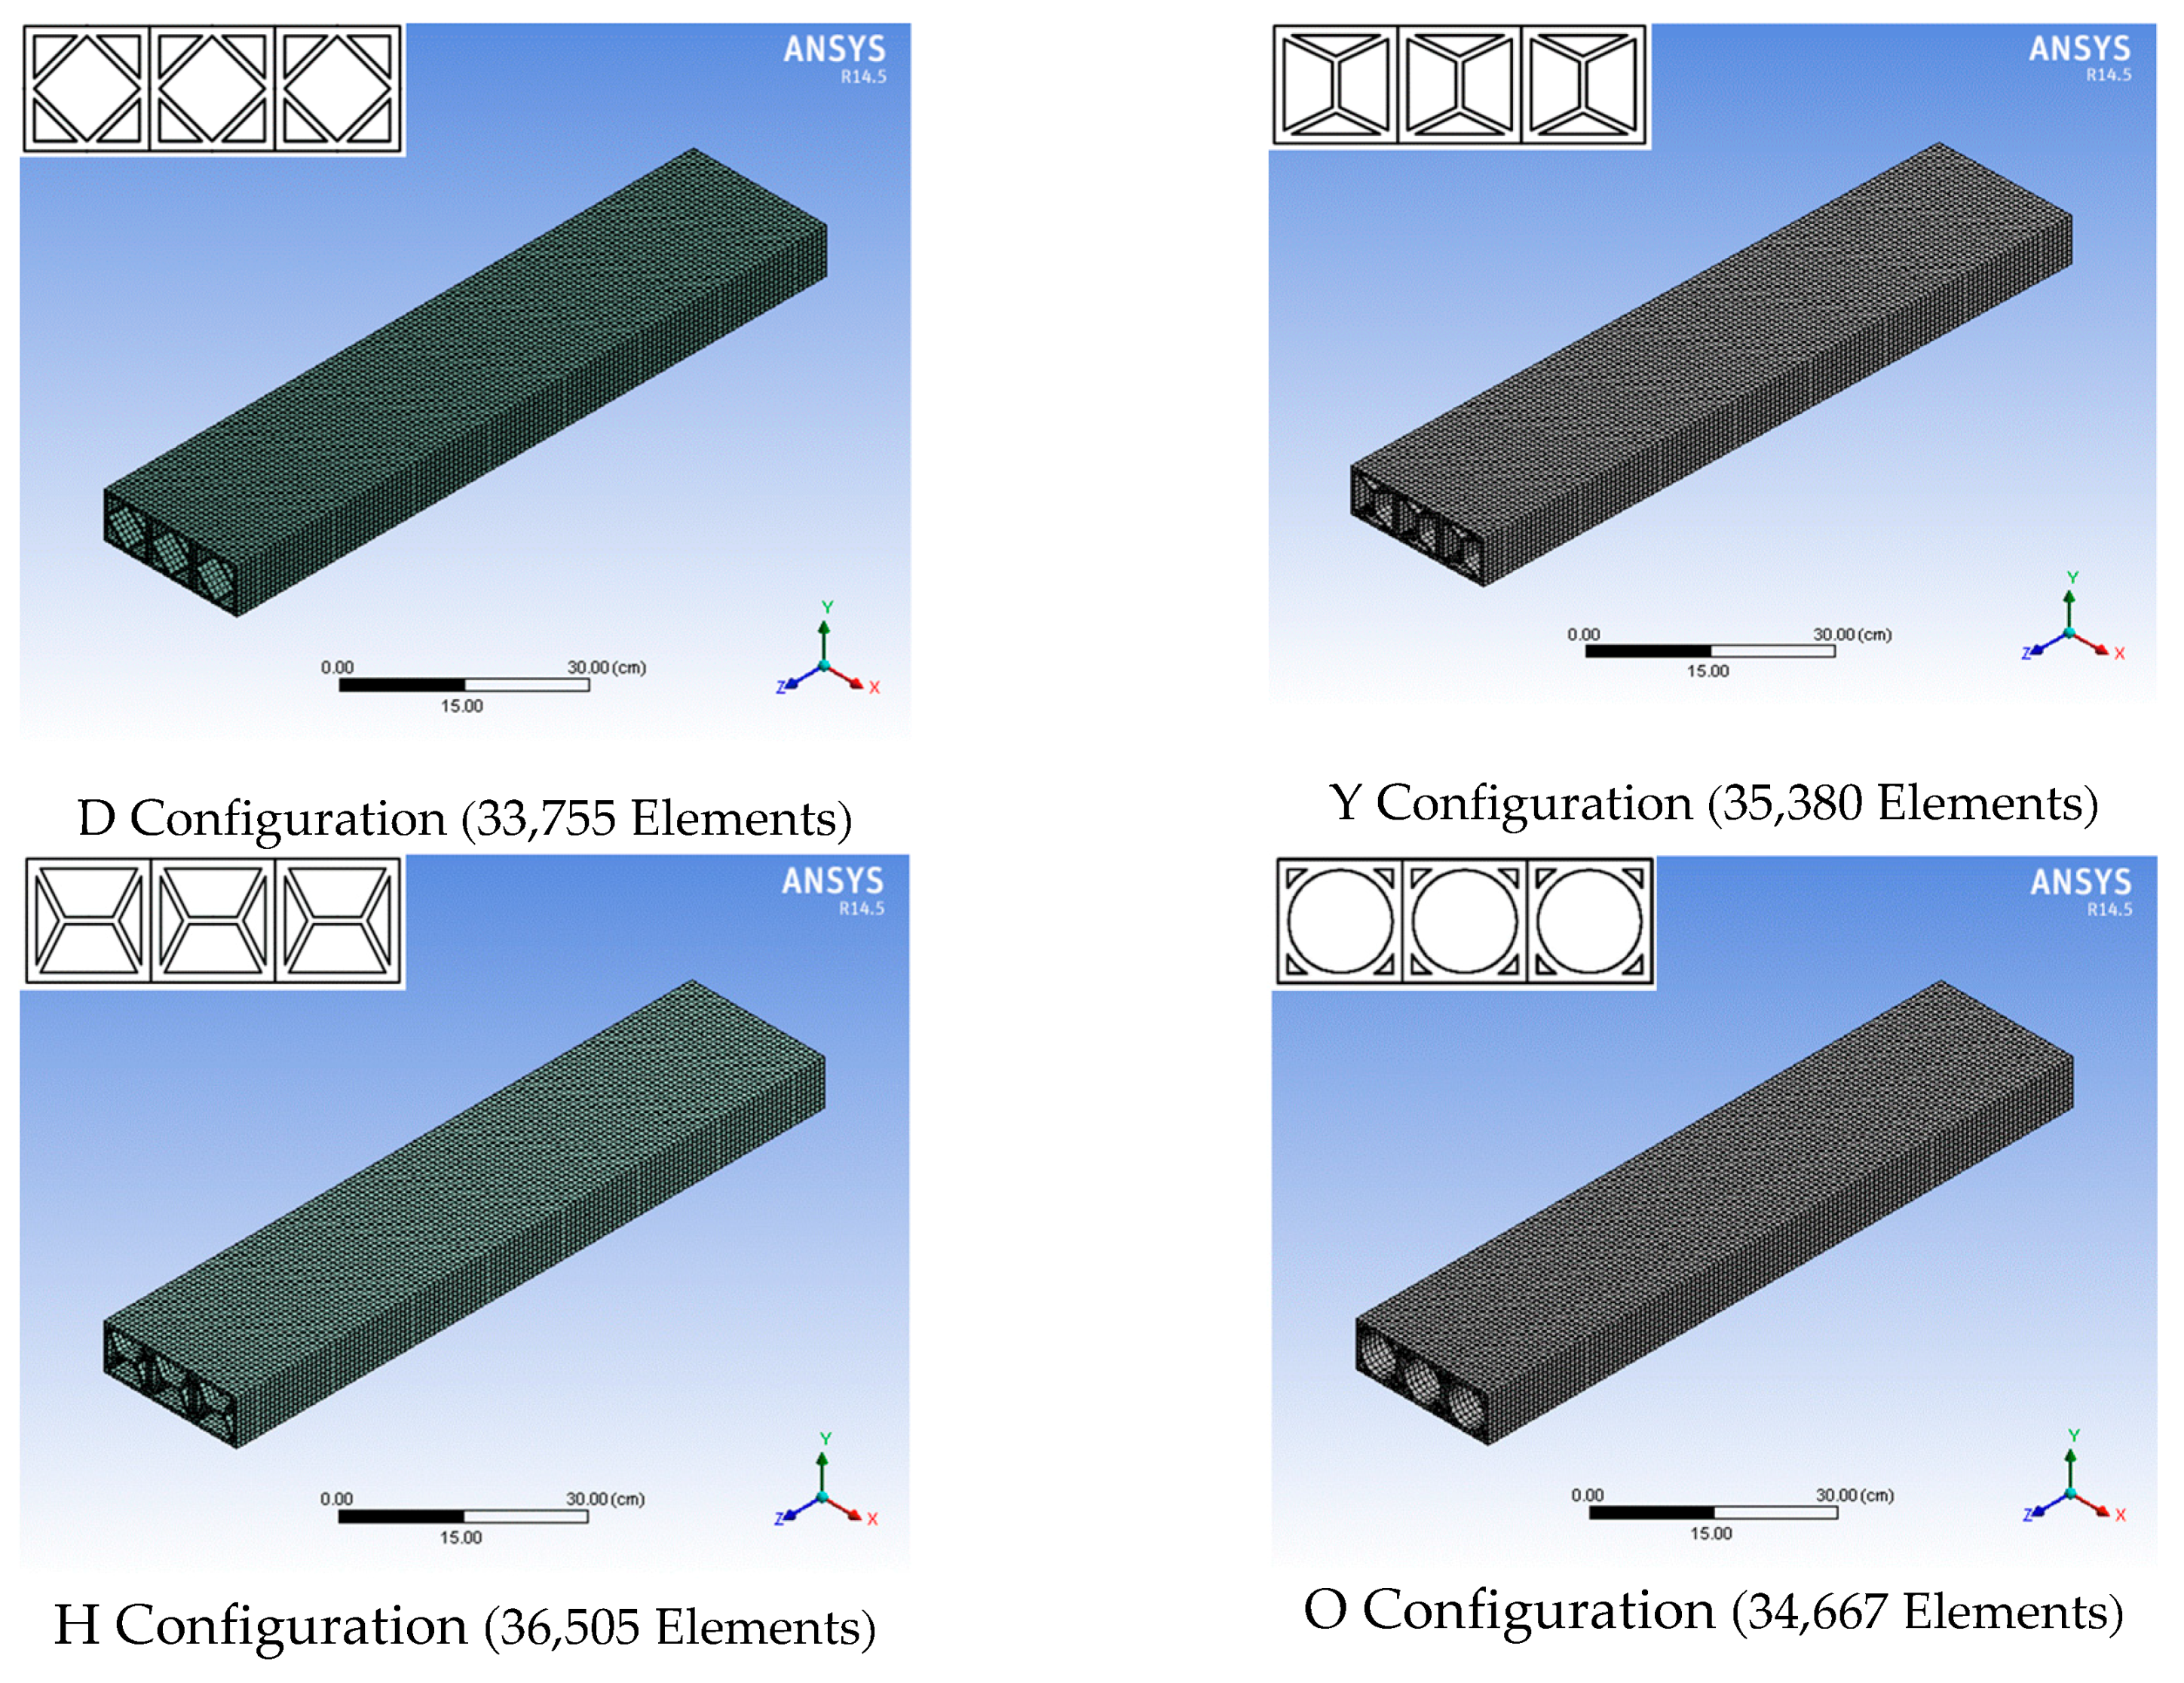
Figure 11.
Finite-element modelling of the benchmark tubular deck for the bending test.
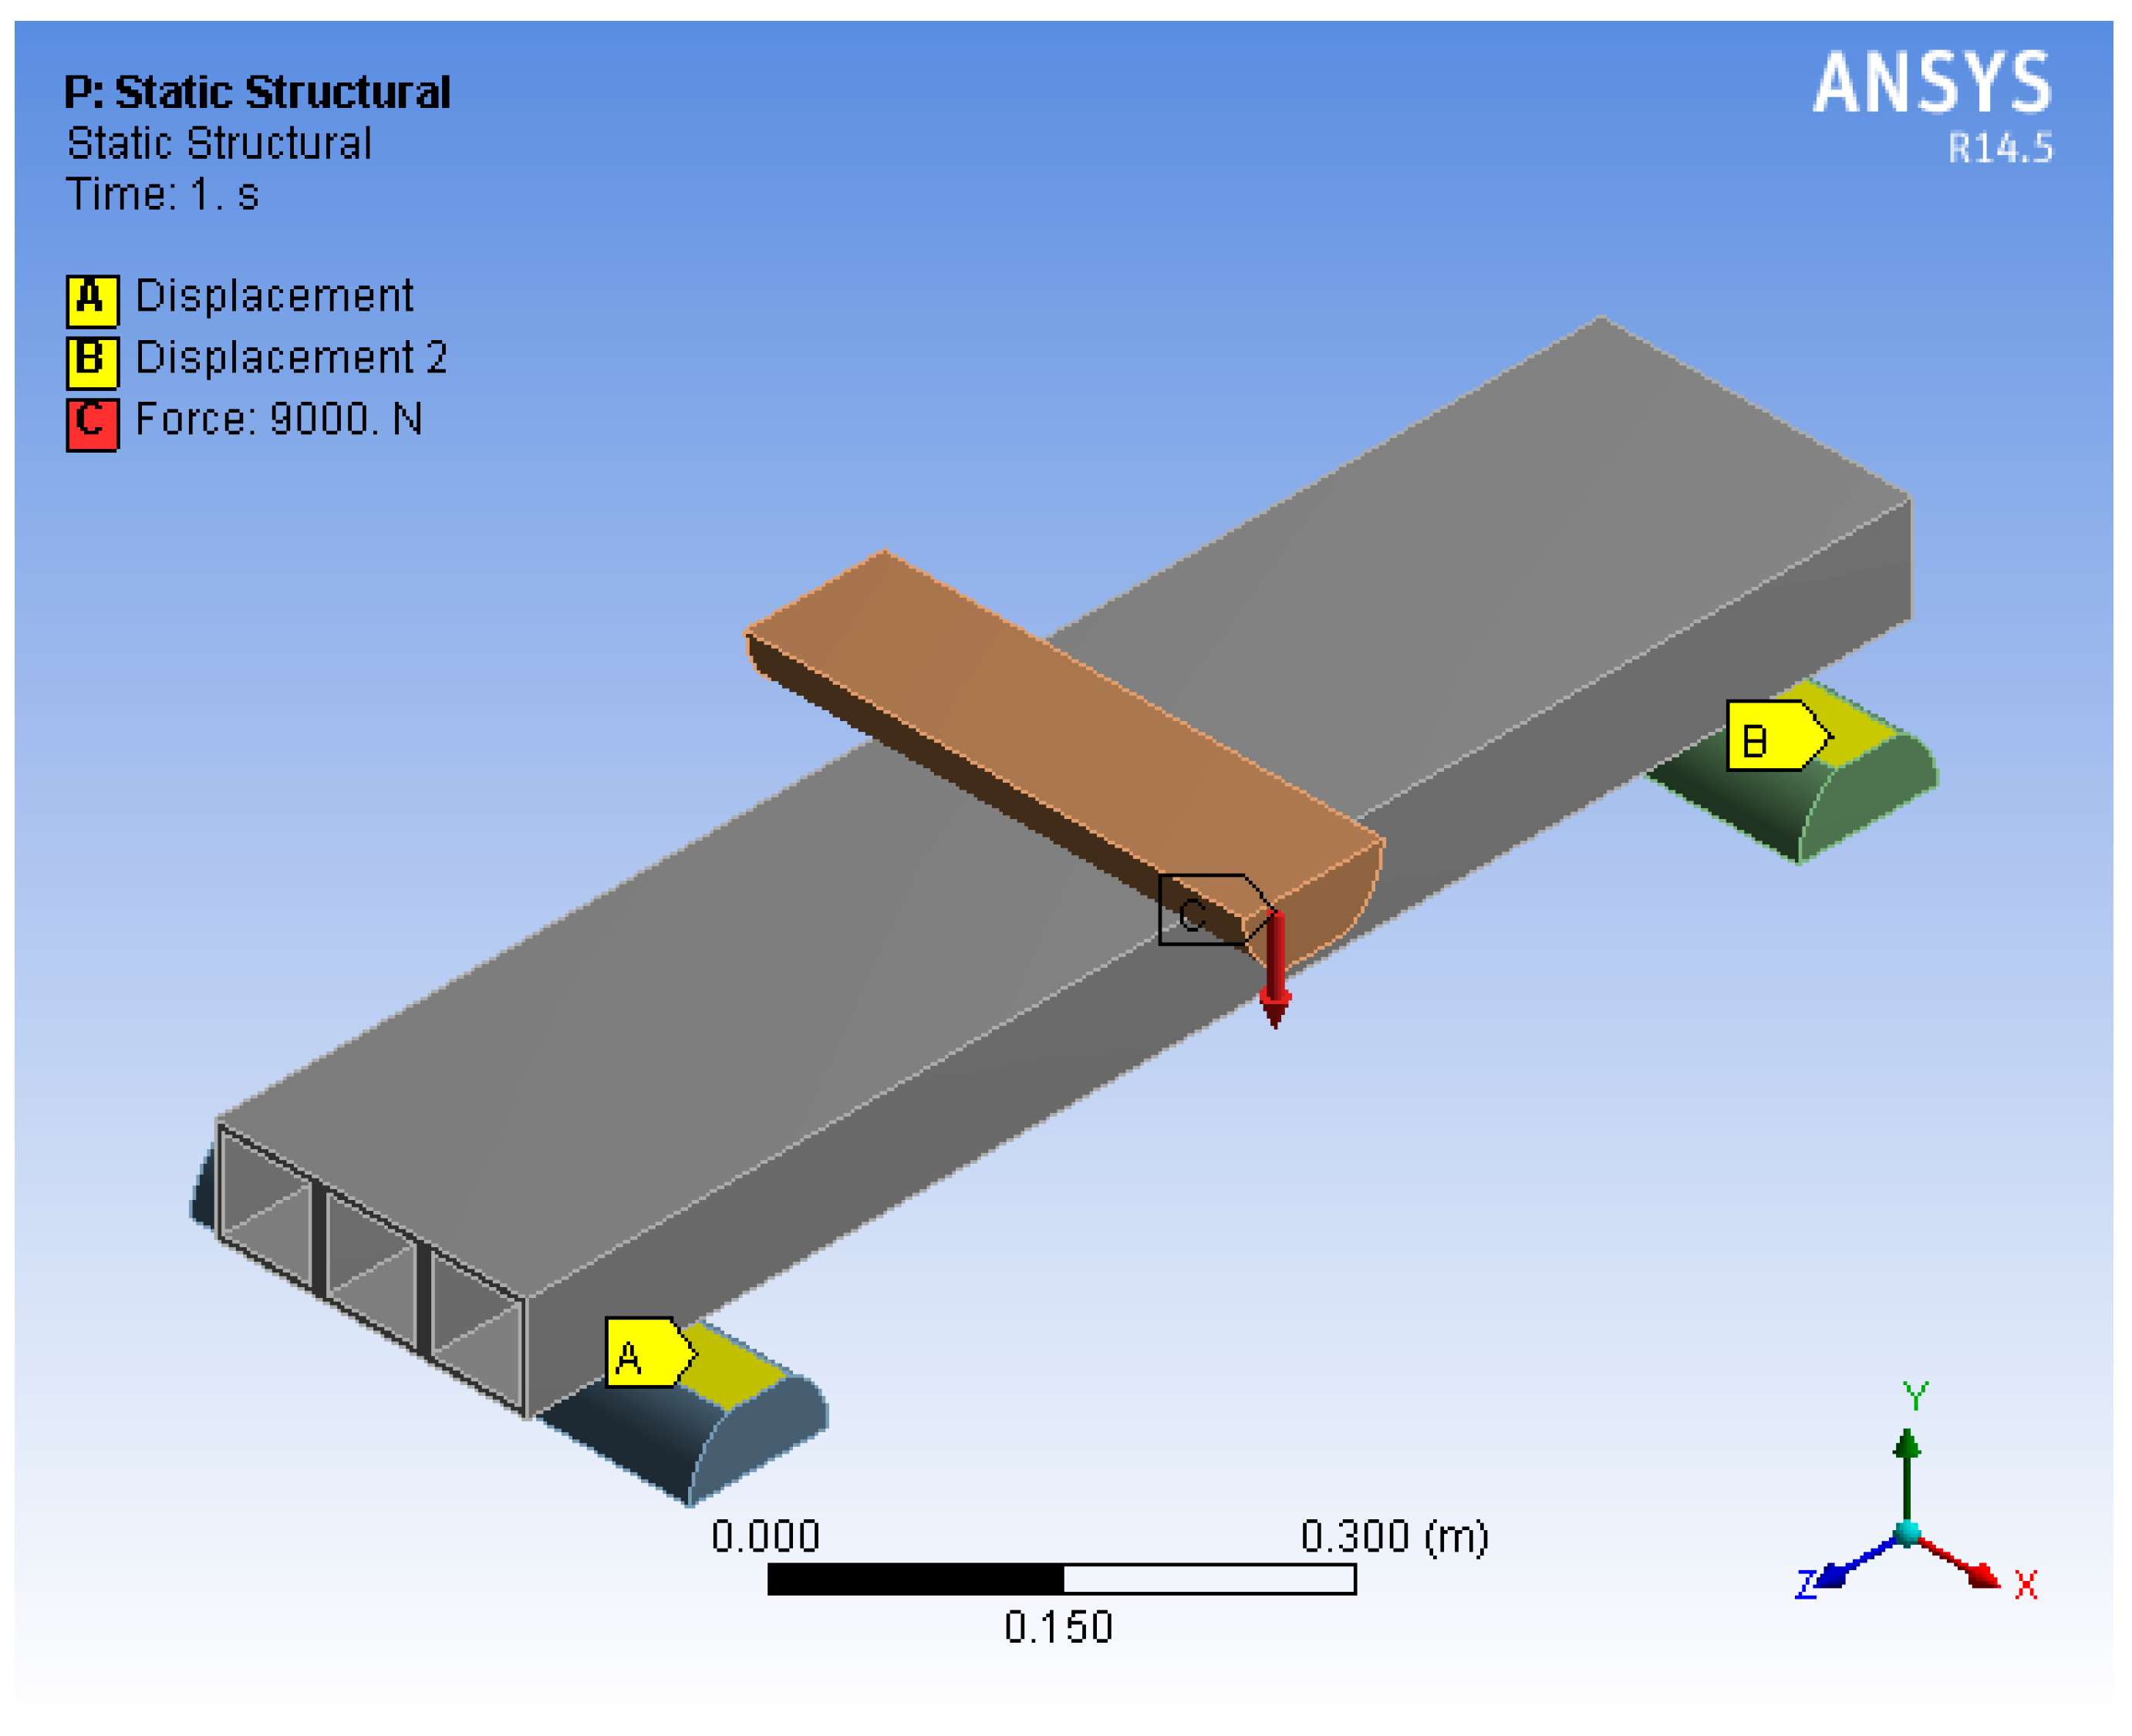
Figure 12.
FEM modelling of the benchmark tubular deck for the torsion test.

Figure 13.
Plot of the force–displacement relationships at the mid-span of tubular decks.
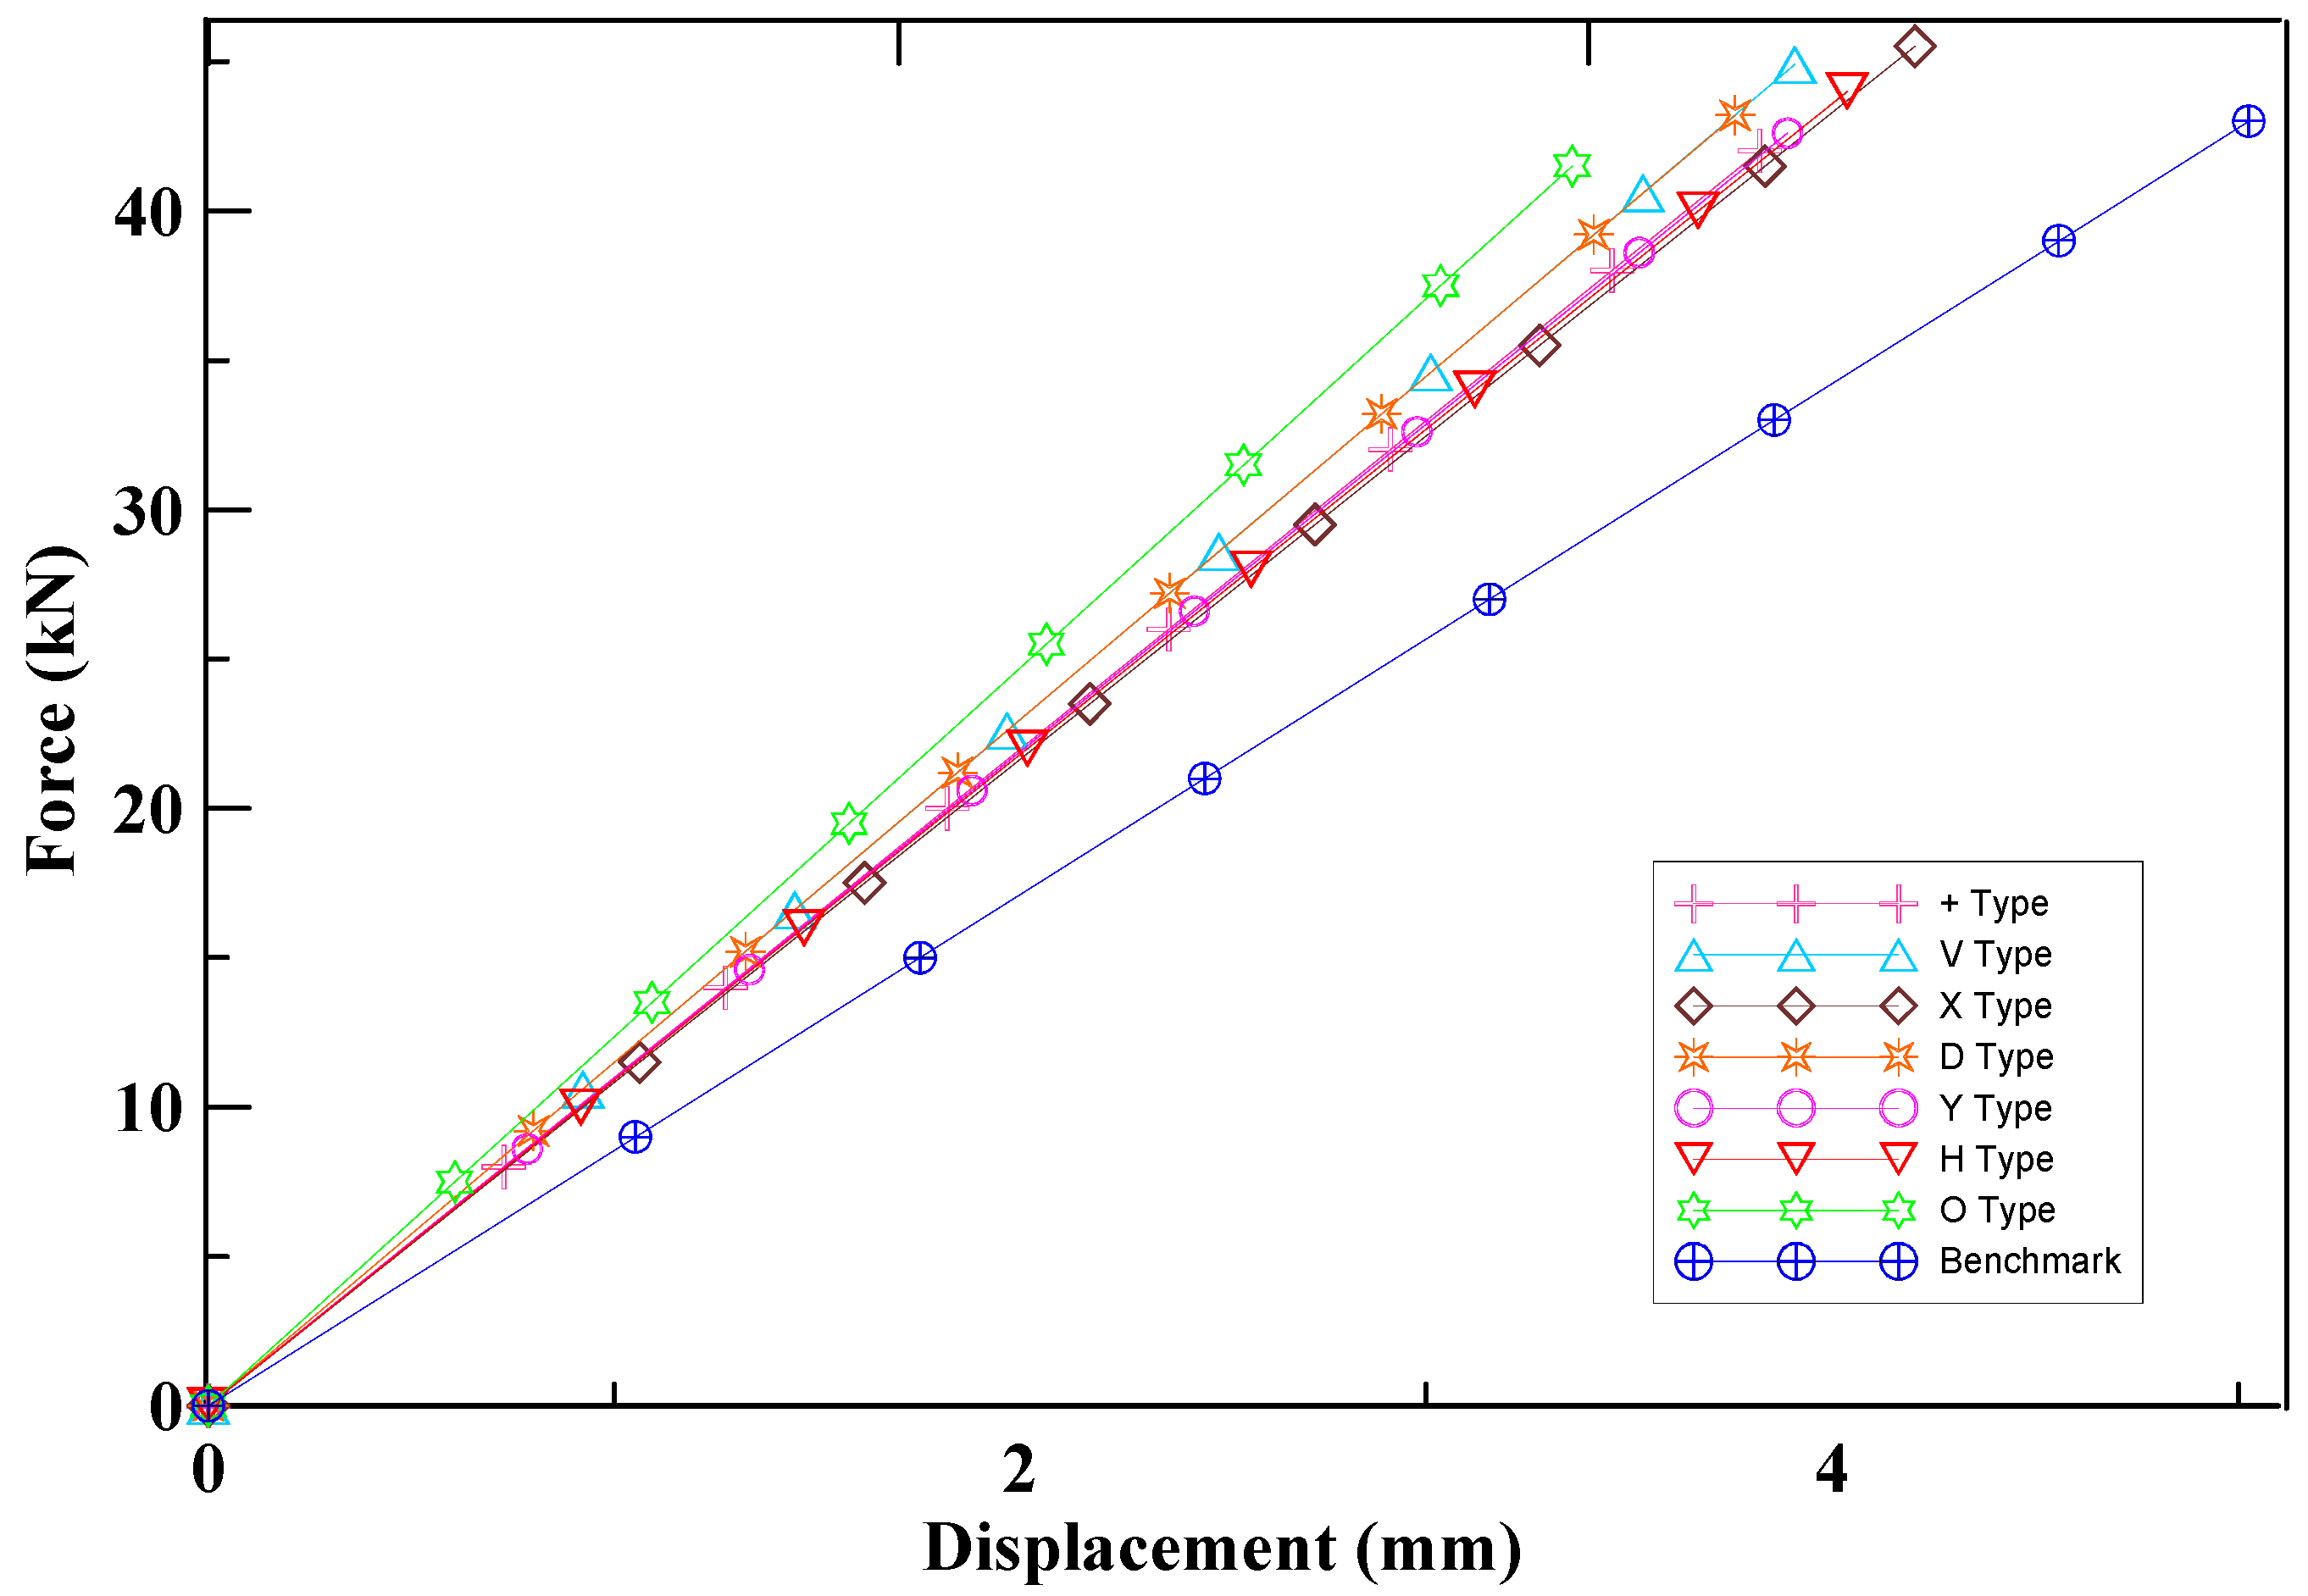
Figure 14.
Plot of the twisting moment-rotation angle relationships at the free end of tubular decks.
Figure 14.
Plot of the twisting moment-rotation angle relationships at the free end of tubular decks.


Table 1.
Mechanical properties of the pultruded glass fiber reinforced polymer (GFRP) composite material.
Table 1.
Mechanical properties of the pultruded glass fiber reinforced polymer (GFRP) composite material.
| Property | Directionality | |
|---|---|---|
| Lengthwise ᵃ | Crosswise ᵇ | |
| Density | 1800 kg/m3 | |
| Tensile ultimate strength (MPa) | 210 | |
| Compressive ultimate strength (MPa) | 210 | |
| Young’s modulus (MPa) | 21,000 | 2625 |
| Poisson’s ratio | 0.038 | 0.33 |
| Shear modulus (MPa) | 3150 | 3150 |
ᵃ Z direction or XZ and YZ plane (parallel to the pultrusion fiber axis); ᵇ X and Y direction or XY plane (perpendicular to the pultrusion fiber axis).
Table 2.
Dimensions of the seven proposed stiffened tubular decks.
| Details | Stiffener Configuration | |||||||
|---|---|---|---|---|---|---|---|---|
| + | V | X | D | Y | H | O | ||
| Dimension (cm) | a * | 0.6 | 0.6 | 0.6 | 0.6 | 0.6 | 0.6 | 0.6 |
| b * | 0.6 | 0.6 | 0.6 | 0.6 | 0.6 | 0.6 | 0.64 | |
| c * | - | 0.54 | 0.42 | 0.45 | 0.44 | 0.44 | 3.11 | |
| Relative cross sectional area | 1 | 1.0018 | 0.9971 | 1.0004 | 0.9989 | 0.9989 | 0.9987 | |
* Dimension symbols (see Figure 4).
Table 3.
Comparative table for the experimental, numerical and analytical results.
| Methods | Maximum Deflection δmax (mm) | Percentage Error (%) |
|---|---|---|
| Experiment | 5.211 | - |
| Finite-element Analysis | 5.352 | 2.70 |
| Euler Beam Theory | 4.396 | 15.63 |
| Timoshenko Beam Theory | 5.354 | 2.74 |
Table 4.
Moment of inertia (Ix) and relative bending stiffness increase of tubular decks.
| Deck Stiffener Pattern | Moment of Inertia Ix (cm4) | Bending Stiffness (kN/cm) | Bending Stiffness Increase (%) |
|---|---|---|---|
| Benchmark | 413.75 | 85.55 | - |
| X | 490.4 | 108.23 | 26.51 |
| H | 618.41 | 108.99 | 27.40 |
| + | 458.78 | 109.90 | 28.46 |
| Y | 525.66 | 109.51 | 28.00 |
| V | 487.54 | 114.89 | 34.29 |
| D | 500.51 | 114.86 | 34.26 |
| O | 543.53 | 123.53 | 44.39 |
Table 5.
Polar moment of inertia (J) and relative torsional stiffness increase of tubular decks.
| Deck Stiffener Pattern | Polar Moment of Inertia, J (cm4) | Torsional Stiffness (N-m/degree) | Torsional Stiffness Increase (%) |
|---|---|---|---|
| Benchmark | 2789.86 | 421.45 | - |
| H | 4666.87 | 558.55 | 32.53 |
| + | 3590.61 | 577.58 | 37.04 |
| Y | 3671.92 | 608.30 | 44.33 |
| V | 3656.73 | 654.30 | 55.24 |
| X | 3646.21 | 660.06 | 56.61 |
| D | 3676.03 | 721.90 | 71.29 |
| O | 3756.67 | 758.98 | 80.08 |
© 2018 by the authors. Licensee MDPI, Basel, Switzerland. This article is an open access article distributed under the terms and conditions of the Creative Commons Attribution (CC BY) license (http://creativecommons.org/licenses/by/4.0/).
Share and Cite
MDPI and ACS Style
Li, Y.-F.; Meda, H.A.; Chen, W. The Design and Analysis of Internally Stiffened GFRP Tubular Decks—A Sustainable Solution. Sustainability 2018, 10, 4538. https://doi.org/10.3390/su10124538
AMA Style
Li Y-F, Meda HA, Chen W. The Design and Analysis of Internally Stiffened GFRP Tubular Decks—A Sustainable Solution. Sustainability. 2018; 10(12):4538. https://doi.org/10.3390/su10124538
Chicago/Turabian StyleLi, Yeou-Fong, Habib Armel Meda, and Walter Chen. 2018. "The Design and Analysis of Internally Stiffened GFRP Tubular Decks—A Sustainable Solution" Sustainability 10, no. 12: 4538. https://doi.org/10.3390/su10124538
Note that from the first issue of 2016, this journal uses article numbers instead of page numbers. See further details here.