Tourist Intensity in the World, 1995–2015: Two Measurement Proposals

Facultad de Economía, Edificio Jovellanos, Universitat De Les Illes Balears, 07122 Palma de Mallorca, Spain
*
Author to whom correspondence should be addressed.
Sustainability 2018, 10(12), 4546; https://doi.org/10.3390/su10124546
Submission received: 11 October 2018
/
Revised: 11 November 2018
/
Accepted: 18 November 2018
/
Published: 2 December 2018
(This article belongs to the Special Issue Economic Growth, Energy Consumption and Sustainable Development: The Case of Mediterranean Region)
Abstract
:The work emphasizes the importance of measuring the tourist intensity of the economies that are oriented to tourism activity, with the aim of avoiding subjective arguments and being more related to perception than with the empirical contrast of the data. A tourist intensity index is proposed, which is made up of four essential variables: GDP, tourist spending, population, and the number of tourists. However, at the same time, it is complemented by a measure of tourist density, which helps to better understand the proposed index. This allows for the classification of countries according to the resulting index, and to calibrate their position in the set of tourist economies. This can be very useful for the application of economic policies aimed at correcting externalities that are generated in the advanced development of mass tourism.
1. Introduction
A concept that has been disseminated insistently in recent times is that of saturation and/or intensity in the leading mass tourism economies, after the great boom in tourism economy as of 1950 [1]. The media have echoed this issue with certain insistence, often times using arguments and experiences of a subjective nature—which are not to be ignored—but with a lack of reliable empirical data to allow reasonable—and homogenised—contrast between different geographic areas. Indeed, despite the importance of tourism on an international scale, there is no single consensus regarding how to measure tourism intensity. This is understood, by some authors, as the number of overnight stays per resident [2,3,4]; while others adduce the number of tourist arrivals and overnight stays [5,6]. In both cases, the models are basically related to the life cycle of the tourism product [7], in its different stages of development. There are also contributions from study cases of tourism destinations with high intensities, in order to identify threats and possible innovative solutions. In each contribution, the definition of tourism intensity is different: it may be the relationships of tourists with respect to the permanent population; or the number of annual tourists divided by the km2 of territory; sometimes, it is even calculated as overnight stays per 1000 inhabitants, or number of arrivals per 100 inhabitants [8,9,10,11,12,13,14].
At the same time, empirical contributions concerning the sustainability of tourism—besides the theoretical contributions in this field—incorporate decisive elements for analysing the sector. From the abundant bibliography available, we highlight these recent contributions: [15,16,17,18,19,20,21,22]. In short, intensity, saturation, and sustainability—and even, the notion of governance—have ended up being concepts that are increasingly used by social scientists to analyse tourism phenomena [23,24,25,26,27,28,29,30]. This methodologically disparate situation is what justifies the main purpose of this research: the proposal of two specific instruments for measuring tourism intensity. (There exists important official documentation regarding tourism intensity. By way of example, [31,32,33,34,35]. Bed count and/or overnight stays are usually the indicators used.) The methodological justification lies in the fact that we do not have precise indicators to measure tourism intensity and, above all, we do not have them as composite indicators. We can observe the tourist evolution with parameters such as the number of visitors, overnight stays, and even tourist spending. However, we have not detected the composition of synthetic indices that group different variables, and that the result is satisfactory in two directions: first, the possibility of having a ranking of tourist intensity; and second, that these results open new perspectives for research.
First of all, the formulation of a Tourism Intensity Index (TII). To this effect, four large dimensions will be adopted, based on information published by the World Tourism Organisation (WTO), corresponding to the period from 1995 to 2015, worldwide. These four dimensions are the number of tourists a destination receives, its total population, as well as tourism revenue, and the GDP of the economy considered. The study follows on from a previous one [36], in which a tourism intensity index was provided, and was applied to 18 island economies throughout the world, thereby revealing a ranking based on the data—GDP, tourism spending, population, and number of tourists—extracted from the statistical institutions in the observed regions. We believe the contribution offered in this new paper, which is based on the aforementioned factors, improves on the former, as it uses a homogeneous source from the WTO, thereby leading to more robust results.
Secondly, a measure of Tourism Density (TD), that is, the number of tourists per km2, which complements the TII. If we multiply the demographic component of the TII by the population ratio per km2 of the country, this tourism density will be obtained. This calculation is reached by combining the information from the WTO with that gathered from the World Bank regarding the population and number of km2 for each of the countries.
The virtue of these two indices is that they involve different variables and not only one or two, as found in the aforementioned reference contributions, which have defined much of the research conducted on the evolution of mass tourism in this specific field. Such indicators are correct. Yet, the new indices we propose contribute three basic virtues. Firstly, they constitute a methodological innovation, by introducing, in a single synthetic index, four determining variables that are closer to the economic reality of the territory considered. Secondly, they facilitate their application on an international, national, and regional scale, in order, thereby, to establish comparisons, hence the scale of analysis is equally broad. Thirdly, the results open up new pathways for research, not only in the field of tourism, but also for studying economic structures (for an interesting analysis in this direction for Spanish regions, see [37]).
The article is organised as follows. In the first section, the important development of tourism economy in the world since the 1950s is set forth, a prime example of a technical-economic change with services at the epicentre [38]. The second section focuses on the methodological proposal and the results obtained concerning a Tourism Intensity Index (TII), which uses the four aforementioned key vectors to understand tourism economy; and a Tourism Density index (TD) which is based on intensity as a function of the area of the destination, such that it complements the former. The paper closes with some final reflections that, additionally, summarise the main contributions of the study.
The starting hypothesis of the research is that there are tourist intensities of great relevance, affecting mainly island economies around the world. On the other hand, the construction of tourist intensity indexes promotes a scientific basis to validate possible processes of sustainability or unsustainability of a territory. The results obtained in the research are satisfactory in this regard, as can be consulted in the conclusions of the investigation.
The connection of our research with the fundamental idea of sustainability lies in an essential methodological aspect: to provide measurable indicators, with variables of public access, that open new perspectives for future research. We can see how we have obtained a ranking of countries based on the proposed indexes and, at the same time, this allows us to flee from subjective conceptions and contribute more and better scientific findings about the phenomenon of sustainability. Now, it may be clearer to venture, with new indicators of a biophysical nature, if the panel of countries that have emerged from our indexes confirm processes of environmental sustainability. However, from the outset, we do know that these countries constitute, in the field of tourism economy, those that, in principle, may have greater problems of spatial and demographic congestion. These two elements we consider are key to the sustainability of a territory.
2. Tourism, an Industry in Expansion
Tourism is one of the most important and dynamic economic activities of our days, recording remarkable growth since the immediate post-war period. The progression of the number of tourists between 1950 and 2018 is striking [36,39,40,41]. The perspective of economic history points towards a loss of tourism strength in Europe and America as destinations. In 1950, 97% of world tourism was aimed at these continents. By the turn of the 21st century, the proportion had decreased to 70–80% and, according to the forecasts of the UNWTO, this figure will have dropped to 64% by 2020 [42]. At the other end of the spectrum, we find the Asia and Pacific areas, which have gained greater prominence, with an outlook of 27% in 2020. Similar conclusions are reached for the East and Africa, which have doubled—and are expected to increase—their function as a world tourism destination. Hence, it is possible to observe a loss of market share for Europe and America and a certain “peripheralisation” of tourism expansion [43,44].
According to [45], the number of international tourist arrivals grew 3.9% in 2016, to reach 1235 million worldwide. It was the seventh consecutive year of above-average growth, after the Great Recession that began in 2008. This growth is sustained, on the one hand, by an increase in disposable personal income; and, on the other hand, by certain sociodemographic changes that are taking place in the most advanced countries, such as the rise in couples without children and single family homes, better standards of education, a higher proportion of older people, and an increase in the number of retirees [46]. International tourist arrivals worldwide could increase 3.3% a year between 2010 and 2030, to reach 1800 million in 2030, according to the long-term forecast listed in the UNWTO report [47].
Nonetheless, three objections can be made to these optimistic perspectives. First of all, a decrease in tourism spending at the destination. The tourism-spending variable is a concept that is affected by fluctuations in exchange rates and by an increase in prices of tourism products. However, the trend appearing over the last decade seems to be clear: a reduction in the length of stay at the destination [48,49]. Among the causes of these shorter stays, it is worth noting a greater frequency of international trips, which is associated with a reduction of the length of each one; a preference of tourists for higher quality holidays, which means giving up on longer stays; and the existence of a price effect, which could lead to a reduction of the time of stay at the destination. Secondly, symptoms of maturity in tourism demand in certain countries. Observation of outbound tourism points towards a possible stagnation—in source markets of developed countries—of the percentage of the population making trips abroad. The cases of France and Great Britain are illustrative: the rise in tourism demand is due to a greater frequency of trips per year by frequent travellers. In this sense, since 1990, the world regions that have enlarged outbound tourism have mostly been Asia and the Pacific, and the Middle East [50,51]. Europe and America have increased their figures more slowly. Finally, it is worth noting new consumer tastes [52]. This customer—described as “post-Fordist”—has interests that differ from crowded sun and beach places and, therefore, represents a serious threat to mass tourism destinations. In France, but especially in Great Britain (and also in Germany), the reduction of social benefits and continuous vacation time has encouraged the adoption of new patterns of tourist consumption. That is to say: shorter trips, but more frequent. These cases represent a model of tourist consumption that especially affects sun and beach destinations, the most demanded by British, French, and German tourists. They are examples that can be extended to other countries and destinations.
At any rate, tourism growth is expansive, measured by an indicator as eloquent as the number of visitors in a certain area. Tourism becomes imitative the moment its first successes crystallise: unconscious talent flows, emulation expands, and chaotic, disorganised beginnings give way to submission to practical rules of operation of the new activity. The turnaround becomes evident: national or regional economies show patent signs in the structures of their labour markets, and in the gradual contribution of the emerging activity in generating income. All this was coined in a peculiar expression applied to developing economies: “pleasure peripheries” [53]. According to this, these peripheries are tourism ghettos located in lagging regions that, since the 1970s, have proliferated under two essential conditions: good air connectivity and the availability of many hours of sunshine. These areas, close to the coast and, in some way, blinded, surrounded centres that were generally poor and poorly connected to other more privileged areas. (Examples that can be cited are Port-au-Prince, Nassau, San Juan de Puerto Rico, Acapulco, Cancun, Hawaii as peripheral areas frequented by North-American tourists; Mallorca, Ibiza, Benidorm, the Canary Islands, Torremolinos, more visited by Europeans, without forgetting, in these cases, other destinations such as Nice, Monte Carlo, Cannes, Venice, and Florence; and the Philippines, Hong Kong, Bangkok, and Bali, as the preferences of the Japanese [53]). However, these so-called peripheries do not have similar evolutions—because their historical trajectories are heterogeneous—neither can they be explained by tourism models of a generalist nature that satisfy all of them in their different chronologies. Ref. [54] aims to lay down some common coordinates to these peripheries, based on the theory of dependence and by relating their tourism trajectories to the general dynamics of capitalism. There exists, in this contribution, a clear interest in coding the behaviours of the tourism areas considered, from the structuralist matrix of the aforementioned theory. We totally disagree with this unifying sense. Measuring these evolutions is feasible based on the two instruments proposed below.
3. Presentation of the Indices: Methodology and Results
The authors define two different indices, the Tourism Intensity Index and the Tourism Density. The Tourism Intensity Index (TII) adopts demographic and economic variables obtained from the WTO for all countries. This ensures the homogeneity of the selection of the variables for drawing up the index. Namely, this is defined as follows:
where T is the number of tourists, P the population, TR tourism revenue, GDP the gross domestic product, and the subscript i is used for a specific country, and w for the world. The WTO provides, amongst many other indicators and always from a general perspective, the relationship between the amount of inbound and domestic tourism and the population, as well as the percentage of the GDP of inbound tourism spending from 1995 to 2015 for all the countries in the world. It must be indicated, however, that these data are not always available and, occasionally, neither are they available for the same country for all the years analysed. This led to a methodological problem that we attempted to solve by focusing on the trends of the series.
While carrying out the calculation of the TII, we added a new geographical aspect: the Tourism Density (TD) of the country, that is, the number of tourists per km2:
If the demographic component of the TII is multiplied by the population ratio per km2 of the country, the tourism density will be obtained. This calculation is reached by combining the information from the WTO with that gathered from the World Bank concerning the population and number of km2 for each of the countries.
Having defined the contents of the two indices, the calculation of the TII for all the countries between 1995 and 2015 is presented below. Countries were ranked from greater to lower tourism intensity, depending on the mean value of the indicator over this period, and were classified according to whether they had a very high TII (mean greater than 1500), a high TII (mean lower than 1500 and over 500), a medium TII (mean lower than 500 and greater than 100), or a low TII (mean lower than 100). This enabled us to obtain four large blocks of countries by comparing to 100, which would be the average world value. Let us look at this in greater detail.
3.1. Countries with a Very High Tourism Intensity Index
The countries classified as having a very high TII are the ones listed in Table 1.
In Figure 1, the set of countries with the greatest TII and the evolution of these indicators from 1995 to 2015 can be observed.
The interpretation of these materials is clear: except for the territory of Macau (made up of the mainland of Macau, connected to Asia, and the two islands of Taipa and Coloane), the rest are archipelagos located in the Caribbean (Anguilla, Antigua and Barbuda, Aruba, and the Bahamas) and the Maldives in the Indian Ocean. All of these have the highest TII and, by far, the greatest in this group, we find to be Macau, one of the largest gambling centres in the world, followed by Aruba, which boasts the best casinos in the Caribbean.
In Table 2, the two basic components of the very high TII are broken down, by country, for 2014 (it must be noted that for 2015, much of the data is still not yet available). Both Macau and the Maldives reveal a dependency on tourism spending that is greater than 90% of their GDP; but the large number of tourists, with respect to the population produced in Macau, places it in the first position, far ahead of Aruba, in second place.
3.2. Countries with a High Tourism Intensity Index
The countries classified with a high TII are the ones given in Table 3. Standing out in this group are many archipelagos that are famous for their tourism industry: Barbados, Bahrain, Belize, Dominica, Fiji, Grenada, Jamaica, Malaysia, Mauritius, Montserrat, Saint Lucia, Saint Kitts and Nevis, Seychelles; and, also, countries such as Austria, Croatia, Spain, the United States, Estonia, France, Greece, and Hong Kong, among others.
In Table 4, the five-year evolution of the TII is given, from 1995 to 2015, for the group of countries whose mean value for the period is greater than 500 and less than 1500.
In Table 5, the TII components for 2014 are broken down into their demographic and economic aspects. From the demographic point of view, the greatest pressure is received by Australia, followed by Bahrain and Taiwan, whereas, at the economic level, Seychelles reveals the greatest dependency followed by Saint Lucia, Dominica, Fiji, and Belize (it should be noted that for some countries, there are no data available in 2014).
3.3. Countries with a Medium Tourism Intensity Index
The countries classified as having a medium TII are shown in Table 6.
In Table 7, the five-year evolution of the TII can be observed from 1995 to 2015, for countries whose value for the period is greater than 100 and less than 500. As this is a mean value for the whole 20-year period, some higher magnitudes for the TII may be found, as this is not a mean value but, rather, the specific value of the TII for that particular year.
Upon analysing the data in Table 8, the country with the greatest demographic pressure is Korea, followed by Japan; in both cases, economic dependence is small. At the opposite end of the scale, we find Jordan, followed by Albania and Panama, with important economic dependence, but with controlled demographic pressure.
3.4. Countries with a Low Tourism Intensity Index
The countries classified as having a low TII are listed in Table 9.
In Table 10, the five-year evolution of the TII from 1995 to 2015 can be appreciated for the countries with a mean less than 100; many are excluded from the classification, due to a lack of data available in the WTO for the period analysed.
From Table 11, it can be deduced that, within the group, the country with the greatest economic dependence is the Solomon Islands, followed by Bhutan, Togo, and Sri Lanka. In no case is significant demographic pressure visible.
The classification demonstrates the relevance of the Caribbean as a key area in global tourism intensity, a reality that describes its nature of island economies [36,55].
Below, we present the calculation of the Tourism Density (TD) for all the countries from 1995 to 2015. With these data, a ranking was drawn up from greater to lower tourism density, based on the mean value of the indicator in this period, and the countries were classified according to whether they have very high TD (mean greater than 10,000 tourists per km2), high TD (mean less than 10,000 tourists per km2 and over 1000 tourists per km2), medium TD (mean less than 1000 tourists per km2 and greater than 300 tourists per km2), or low TD (mean less than 300 tourists per km2 and greater than 100 tourists per km2), enabling us to obtain, in turn, four large blocks of countries.
In Figure 2, the evolution of Tourism Density, from 1995 to 2015, can be observed in Macau—the country with the greatest tourism density in the world—far greater than the next two, which are Hong Kong and Singapore. Macau goes from a tourism density of 210,100 tourists per km2 in 1995 to 480,726 tourists in 2014 (there are no data available for 2015), representing 128.8% growth over this period.
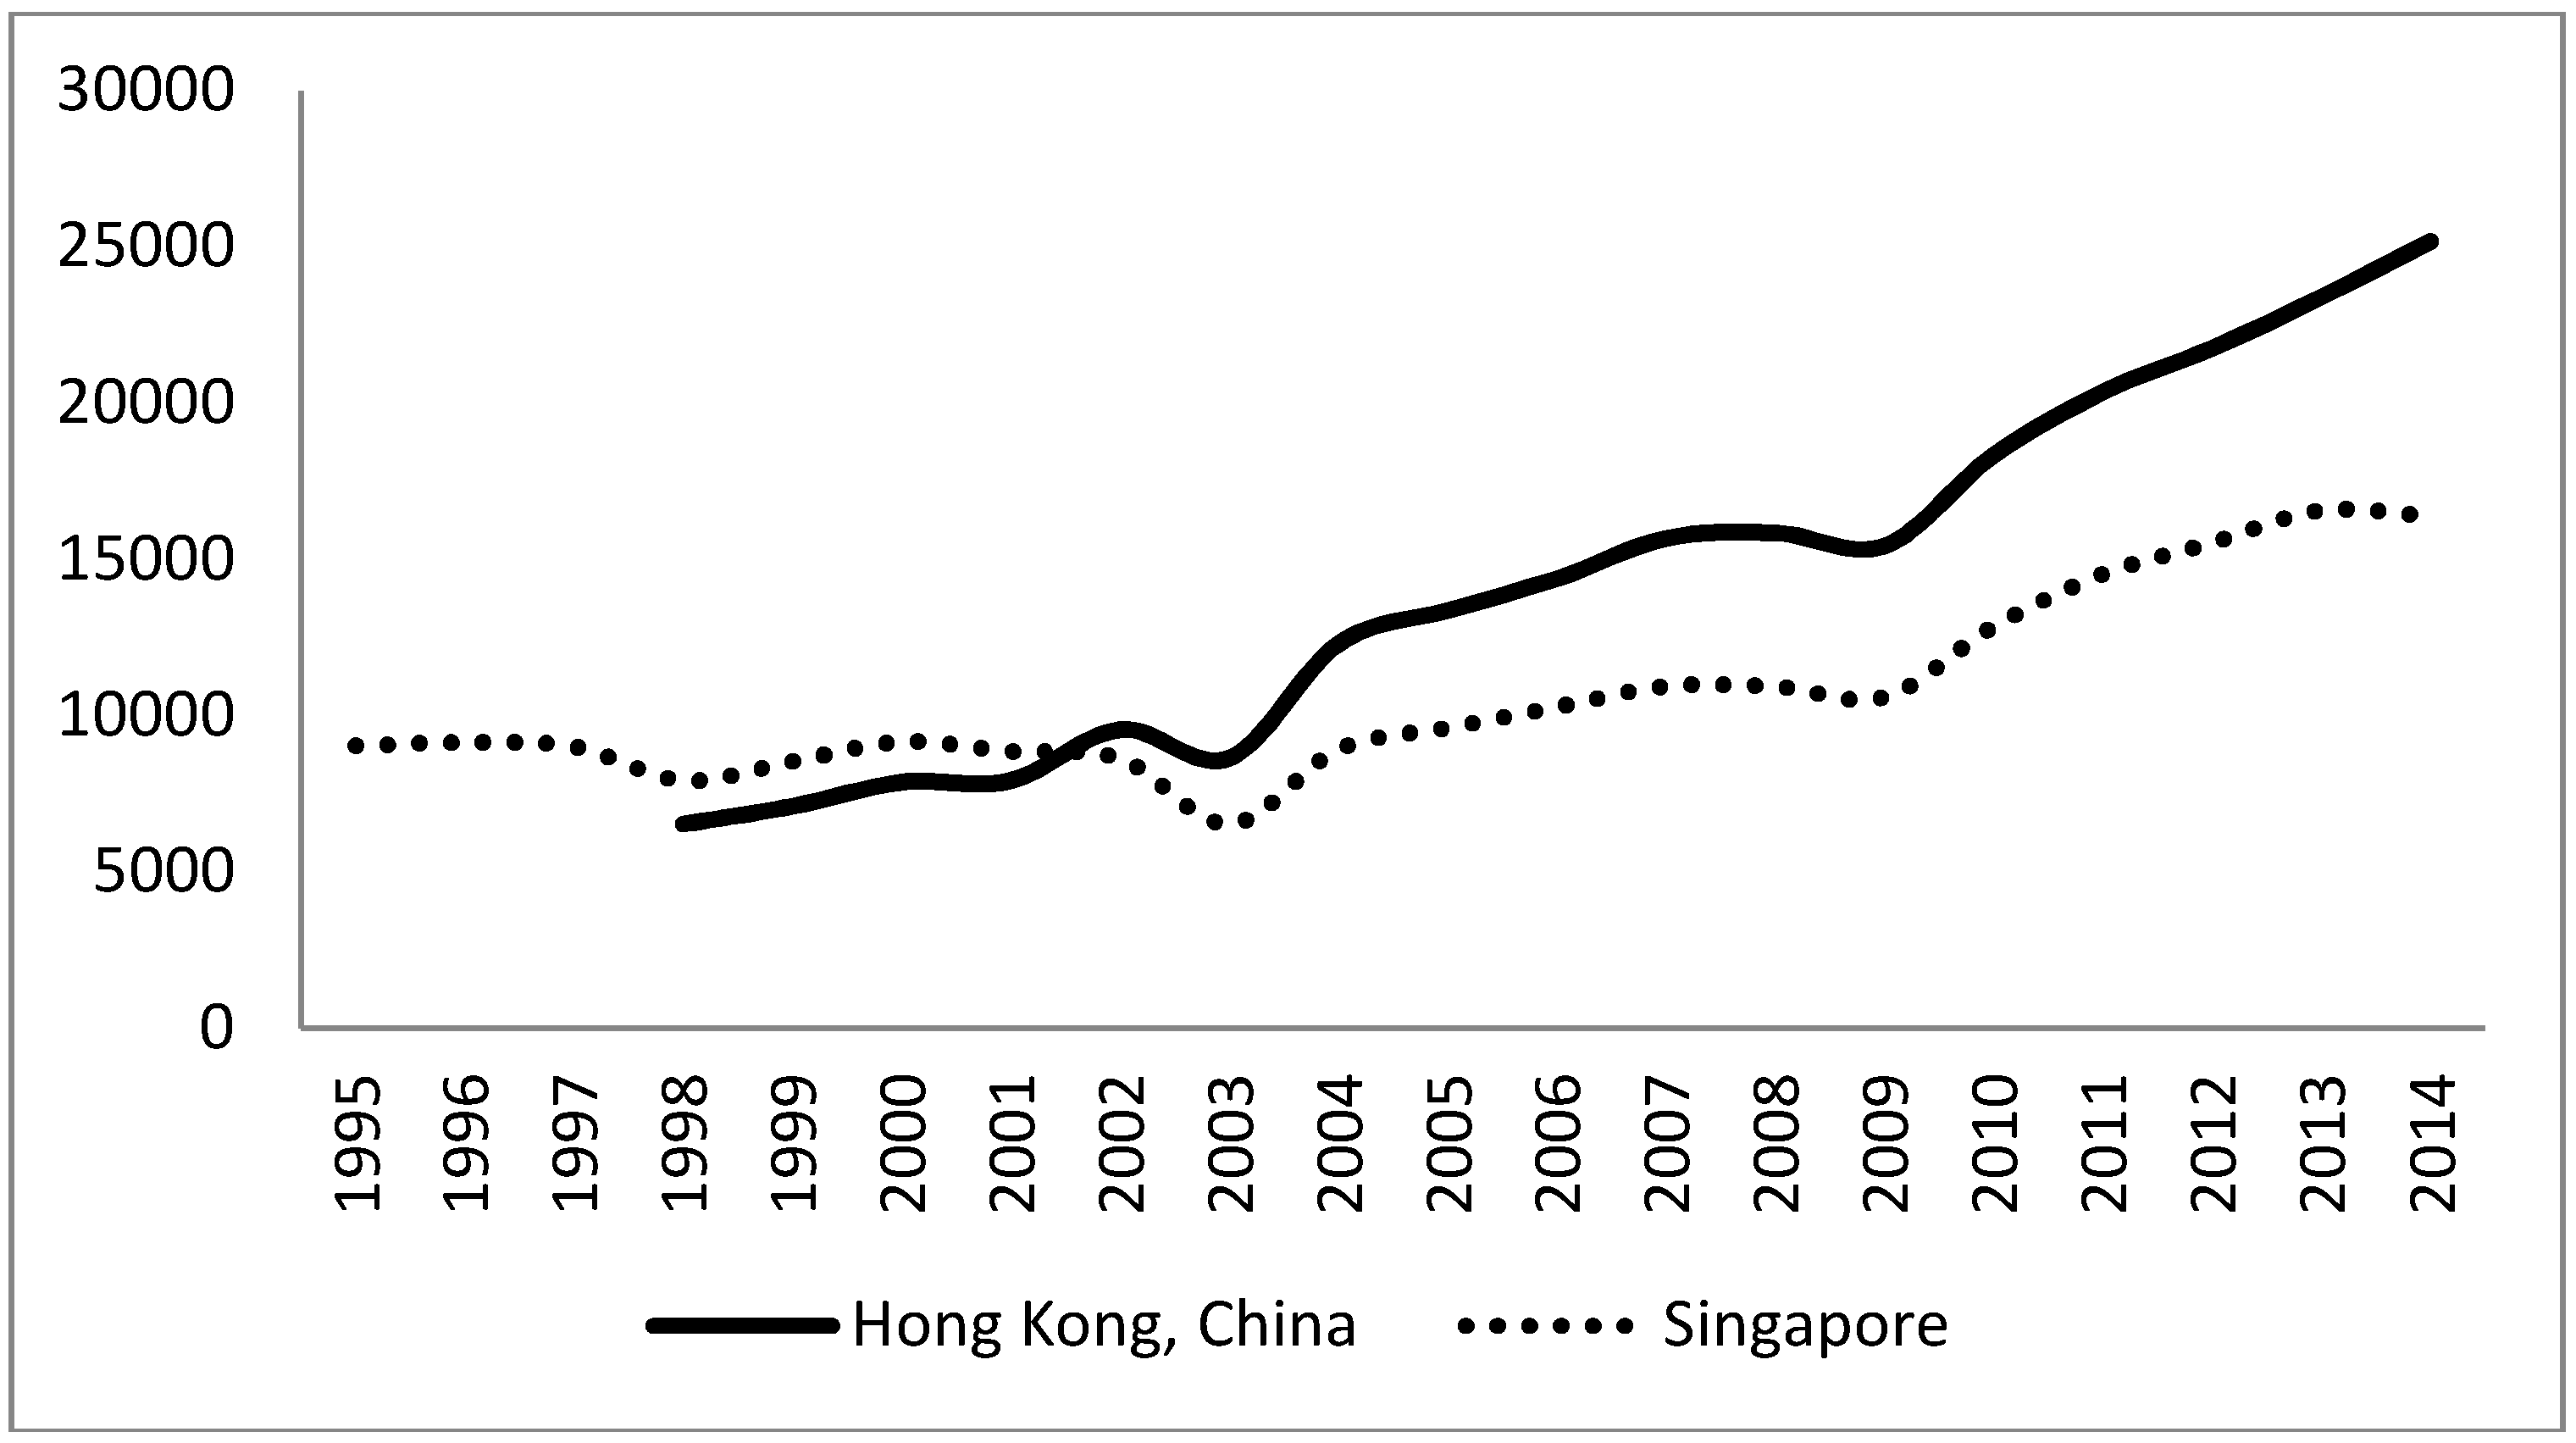
Far behind, but still classified as having very high tourism density, we find Hong Kong and Singapore, whose evolution from 1995 to 2015 is shown in Figure 3. Hong Kong goes from a density of 6532 tourists per km2 in 1998 to 25,183 tourists per km2 in 2014, namely, 285.5% growth over the period (Table 13). Singapore goes from 9034 tourists per km2 in 1995 to 16,390 in 2014, up 81% (Table 13).
In Figure 4, the evolution of density from 1995 to 2015 is revealed for the set of countries that were classified as having high Tourism Density.
The classification was drawn up based on the mean tourism density value between 1995 and 2015. It must be remembered that, in the case of high tourism density, the mean value must be less than 10,000 tourists per km2 and over 1000 tourists per km2. As it is a mean value for the whole 20-year period, some values greater than 10,000 tourists per km2 can be found in Figure 4, as this is not a mean value but, rather, the specific value for the corresponding year. Leading this group is Bahrain, which goes from a density of 3255 tourists per km2 in 1995 to 13,556 tourists per km2 in 2014, representing 216.5% growth (Table 13). The evolution of tourism density is very different among the countries classified as having high tourism density. At one end, we find the Maldives, whose tourism density increased 327.6% between 1995 and 2014; and at the other end, is Japan, which decreased 18.3% between 2008 and 2014 (in this figure, the impact of the earthquake in 2011—the strongest recorded in Japanese history—can be clearly seen).
In Table 12, the five-year evolution, between 1995 and 2015, is outlined for the Tourism Density of the set of countries classified as having medium tourism density. In this group, we find all the countries whose average tourism density over the period considered is less than 1000 tourists per km2 and greater than 300 tourists per km2.
European countries appear, for the first time, in the classification: England, France, the Czech Republic, Belgium, Spain, Cyprus, Italy, Switzerland, and Luxembourg. Table 13 shows the evolution of tourism density, which is very different among the European countries classified in the group of medium tourism density. On the one hand, we find Spain, whose density increased 27.8% from 1999 to 2014, going from 318 tourists per km2 to 406 tourists per km2; and, on the other hand, we find Switzerland, with a drop of 10.5% between 1998 and 2014, from 423 tourists per km2 to 379 per km2.
Finally, in Table 14, it is possible to see the evolution of tourism density between 1995 and 2015 for the countries classified as having low tourism density. The mean of the indicator for the period considered is less than 300 tourists per km2, and greater than 100 tourists per km2.
Standing out in this group of countries with low tourism density, we find India, Qatar, and China, which have undergone the greatest rise in tourism density in the period of study out of all the countries analysed. India went from 42 tourists per km2 in 1995 to 393 tourists per km2 in 2014, representing 830% growth (Table 13). Qatar evolved from 31 tourists per km2 in 1999 to 243 tourists per km2 in 2014, up 691.6%. China, with 67 tourists per km2 in 1995, reached 382 tourists per km2 in 2014, representing a rise of 473.5%.
4. Conclusions
First of all, the main aim of this research was to design an index to calculate tourism intensity, a key concept for any tourism destination, as it can affect the wellbeing of both residents and the tourists themselves. We established this by consulting the databases of the UNWTO for the period 1995–2015, using four determining vectors: the GDP, tourism spending, the population, and the number of tourists. We thereby built a compound index that is more convincing than tourism analysis using only one of the aforementioned indicators. However, our aim was above all descriptive, without going into—which would require considerable length—the economic characteristics of the groups of countries we were able to group together, based on the calculation of the TII. Classifying a destination according to whether it has a very high, high, medium, or low tourism intensity, may be useful when it comes to determining the type of policies that must be defined in order to eliminate negative externalities and to boost positive ones. Along these lines, we believe an analysis of tourism densities (TD) is also important, and we put forward a second proposal for measuring tourism intensity based on a specific formula, with data from the TII and from the World Bank. Both methodologies enabled different rankings to be drawn up, broken down according to tourism intensity, with some specific parameters: very high, high, medium, and low.
Secondly, it is emphasised that the region with the highest tourism intensity in the world is Macau, a destination that focuses its economy on gambling, as it boasts numerous casinos in its territory. The TII is 6656, the mean between 1995 and 2015 (100 would be the mean world value), with a TD of 48,726 tourists per km2 in 2014. The case of Macau is not unique; in fact, another relevant conclusion is that island economies are the ones with the greatest TII. In this regard, the present study follows the lines marked in a previous one [36], in which it was also determined that the highest tourism densities in the world were found in archipelagos and, specifically, in the Cayman Islands, British Virgin Islands, and the Balearic Islands.
Thirdly, we can affirm that the changes taking place in tertiary economies in the process of economic globalisation are very fast. The different tourism intensities will, undoubtedly, condition regulations of all kinds: urban, fiscal, and pertaining to the tourism industry itself. Hence, the importance, decisive in our opinion, of measuring tourism economy with tools that are innovative (the use of bioeconomy criteria is another key research path to studying the evolution of tourism economies more accurately, based on biophysical indicators that affect sustainability processes; see [56,57,58,59,60,61,62,63]). Based on this observation, a whole range of opportunities for, and threats to, tourism economies open up. As for the former, the dynamic competitiveness of the productive systems consists not only of the ability to adapt to changes in demand, but to do so in the shortest possible time. Indeed, the speed with which local actors process and put information into practice is crucial, and this can be boosted through cooperation between the different productive units. The agility whereby this information is systematised is related to three essential factors, amongst others: firstly, the productive resources of companies, depending on their critical mass or size; secondly, human capital and the implementation of regional and local innovation systems, since their availability may favour finding new possibilities of efficient productive combinations, in order to respond to changes in demand; finally, the function of leadership, which the public sector would have to take on with effective synergies with private capital.
We would like to highlight the fact that the empirical precision of tourism intensity, quite apart from perceptions that are subjective or have clear political intentions, is what we are seeking in this line of research, with the result of drawing up the Tourism Intensity Index (TII) and the Tourism Density index (TD). They have two main potentials: they enable a homogeneous comparison, using four main indicators that come from institutions with open consultation databases—the UNWTO and the World Bank; and they determine a specific numerical magnitude which, at least, eschews subjective observation which, despite always being respectable, may be biased.
The tourist intensity is affecting many regions specialized in the leisure industry. These are factors of concern: problems of demographic congestion, high consumption of natural and energy resources, ecological impacts that affect the landscape, and even our own cultural values. All these elements, which are clearly sensed in our research, force policy makers to act in very clear directions. The most important, without a doubt, will be the environmental sustainability of the tourist territory. This territory is the main context, the basic natural capital that is a claim for visitors. We understand that magical recipes cannot be given in economic policy. However, at the same time, we think that the objectives to be achieved would be to encourage renewable energies, a strong technological renovation that makes processes more efficient (production of electricity by photovoltaic means, for example), the possibility of promoting a specific environmental taxation for tourism and, last but not least, betting on the formation of a human capital specialized in mass tourism in all its aspects.
Lastly, our results are of a macroeconomic nature, and are usually assigned to nation states. However, we think that, as research assumptions, the indices and the methodology we have constructed would be equally applicable to a more regional-scale analysis. The sustainability of tourism should be treated from regional perspectives (as has also happened with studies of economic history in the industrial field). This is why this can be a good line of future research: the disaggregation of data on a regional scale. Now, the research that is developed in the future will have the limits that will be marked by the availability of statistical records. This is fundamental. However, at the same time, the proportion of these new measurement indices can be contrasted with others that should be investigated. In this sense, we are working on the preparation of biophysical indicators for the tourist economy, which will complement the two indices presented in this work.
Author Contributions
C.M. develops the methodological part of the paper defining the indexes and E.V. performs the calculations of the defined indices. The writing of the article and the conclusions has been elaborated jointly. And all authors read and approved the final manuscript.
Funding
This work inserts in the project of research Crisis industrial y recuperación productiva en la historia de España, 1686–2018, HAR2015-64769-P, directed by Jordi Catalan. Dirección General de Investigación, Ministerio de Economía y Competitividad.
Conflicts of Interest
The authors declare no conflict of interest.
References
- Milano, C.; Novelli, M.; Eastbourne, U.K.; Cheer, J.M. Tourism Planning and Development Journal Special Issue on: Overtourism and Tourismphobia: A Journey through Four Decades’ of Tourism Development, Planning and Local Concerns. Available online: https://www.researchgate.net/publication/321873167_CALL_FOR_PAPERS_Overtourism_and_Tourismphobia_A_journey_through_four_decades’_of_tourism_development_planning_and_local_concerns/citations (accessed on 22 November 2018).
- Getz, D. Tourism planning and destination life cycle. Ann. Tour. Res. 1992, 19, 752–770. [Google Scholar] [CrossRef]
- Gonçalves, V.; Aguas, P. The concept of life cycle: An application to the tourist product. J. Travel Res. 1997, 35, 12–22. [Google Scholar] [CrossRef]
- Tokarchuk, O.; Gabriele, R.; Maurer, O. Tourism intensity impact on satisfaction with life of German residents. Tour. Econ. 2016, 22, 1315–1331. [Google Scholar] [CrossRef]
- Spinalis, I.; Kizos, T.; Karampela, S.; Vayanni, H. A tourism tipology of the Greek Islands. In Proceedings of the International Conference of Trends, Impacts and Policies on Tourism Development, Heraklion, Greece, 15–18 June 2006; Hellenic Open University: Patras, Greece, 2006. [Google Scholar]
- Albalate, D.; Bel, G. Tourism and urban public transport: Holding demand pressure under supply constraints. Tour. Manag. 2010, 31, 425–433. [Google Scholar] [CrossRef]
- Butler, R.W. The concept of tourism area cycle of evolution: Implications for management of resources. Can. Geogr. 1980, 24, 5–12. [Google Scholar] [CrossRef]
- Ioannides, D. Strengthening the ties between tourism and economic geography: A theoretical agenda. Prof. Geogr. 1995, 47, 49–60. [Google Scholar] [CrossRef]
- Agarwal, S. The resort cycle and seaside tourism: An assessment of its applicability and validity. Tour. Manag. 1997, 18, 65–73. [Google Scholar] [CrossRef]
- Agarwal, S. Restructuring seaside tourism. The resort lifecycle. Ann. Tour. Res. 2002, 29, 25–55. [Google Scholar] [CrossRef]
- Berry, E.N. An Application of Butler’s Tourism Area Life Cycle to the Cairns Region, Australia (1876–1998). Ph.D. Thesis, School of Tropical Environment Studies and Geography, James Cook University of North Queensland, Cairns, Australia, 2001. [Google Scholar]
- Hovinen, G. Revisiting the destination life cycle model. Ann. Tour. Res. 2002, 29, 209–230. [Google Scholar] [CrossRef]
- Garay Tamajón, L. El Ciclo de Evolución del Destino Turístico. Una Aproximación al Desarrollo Histórico del Turismo en Cataluña. Ph.D. Thesis, Universitat Autònoma de Barcelona, Barcelona, Spain, 2007. [Google Scholar]
- Gross, S.; Weber, F.; Stettler, J.; Priskin, J.; Rosenberg-Taufer, B.; Ponnapureddy, S.; Fux, S.; Camp, M.A.; Barth, M. Tourism Destinations under Pressure. Challenges and Innovative Solutions; Working Paper; Lucerne University of Applied Sciences and Arts Institute of Tourism: Lucerne, Switzerland, 2017. [Google Scholar]
- Sharpley, R. Tourism and Sustainable Development: Exploring the Theoretical Divide. J. Sustain. Tour. 2000, 8, 1–19. [Google Scholar] [CrossRef]
- Liu, Z. Sustainable Tourism Development: A Critique. J. Sustain. Tour. 2003, 11, 459–475. [Google Scholar] [CrossRef] [Green Version]
- OMT. Indicators of Sustainable Development for Tourism Destinations: A Guidebook; OMT: Madrid, Spain, 2004. [Google Scholar]
- Weaver, D. Can sustainable tourism survive climate change? J. Sustain. Tour. 2011, 19, 5–15. [Google Scholar] [CrossRef] [Green Version]
- Burghelea, C.; Uzlău, C.; Ene, C.M. Comparative indicators of Sustainable Tourism. Available online: http://managementjournal.usamv.ro/pdf/vol.16_3/Art9.pdf (accessed on 22 November 2018).
- Zientara, P.; Zamojska, A. Green organitzational climates and employee pro-environmental behavior in the hotel industry. J. Sustain. Tour. 2016, 26, 1142–1159. [Google Scholar] [CrossRef]
- De Jong, A.; Varley, P. Foraging tourism: Critical moments in sustainable consumption. J. Sustain. Tour. 2018, 26, 685–701. [Google Scholar] [CrossRef]
- Moyle, C.L.J.; Moyle, B.D.; Chai, A.; Hales, R.; Banhalmi-Zakar, Z.; Bec, A. Have Australia’s tourism strategies incorporated climate change? J. Sustain. Tour. 2018, 26, 703–721. [Google Scholar] [CrossRef]
- Bramwell, B.; Lane, B. Sustainable Tourism: An Evolving Global Approach. J. Sustain. Tour. 1993, 1, 1–5. [Google Scholar] [CrossRef]
- Butler, R.W. Sustainable tourism: A state-of-the-art review. Tour. Geogr. 1999, 1, 7–25. [Google Scholar] [CrossRef]
- Pulido-Fernández, J.I.; Cárdenas-García, P.J.; Villanueva-Álvaro, J.J. The role of environmental sustainability in the transformation of tourism growth into economic development. Environ. Eng. Manag. J. 2013, 12, 2009–2018. [Google Scholar] [CrossRef]
- Boluk, K.; Cavaliere, C.T.; Higgins-Desbiolles, F. Critical thinking to realize sustainability in tourism systems: Reflecting on the 2030 sustainable development goals. J. Sustain. Tour. 2017, 25, 1201–1204. [Google Scholar] [CrossRef]
- Pulido-Fernández, J.I.; López-Sánchez, Y. Are Tourists Really Willing to Pay More for Sustainable Destinations? Available online: https://www.mdpi.com/2071-1050/8/12/1240/htm (accessed on 22 November 2018).
- Pulido-Fernández, J.I.; Pulido-Fernández, M.C. Proposal for an indicators system of governance in tourism destinations. Soc. Indic. Res. 2018, 137, 695–743. [Google Scholar] [CrossRef]
- Font, X.; McCabe, S. Sustainability and marketing in tourism: Its contexts, paradoxes, approaches, challenges and potential. J. Sustain. Tour. 2018, 25, 869–883. [Google Scholar] [CrossRef]
- Higham, J.; Miller, G. Transforming societies and transforming tourism: Sustainable tourism in times of change. J. Sustain. Tour. 2018, 26, 1–8. [Google Scholar] [CrossRef]
- European Environment Agency. Indicator Fact Sheet Signals. Chapter Tourism; European Environment Agency: København, Denmark, 2001. [Google Scholar]
- INTERREG IIIC. Intensity of Tourism; European Union: Brussels, Belgium, 2005. [Google Scholar]
- INTERREG IVC. Sustain. Measuring Coastal Sustainability; European Union: Brussels, Belgium, 2012. [Google Scholar]
- Gauche, M. Tourism Intensity at a Local Level: Environmental Pressure of Preservation Factor? Datalab, The Monitoring and Statistics Directorate: Gobierno de Francia, France, 2017. [Google Scholar]
- Gauche, M. Measuring tourism intensity and its environmental impact. In Proceedings of the 6th UNWTO International Conference of Tourism Statistics Measuring Sustainable Tourism, Manila, Philippines, 19–24 June 2017. [Google Scholar]
- Manera, C.; Navinés, F. La Indústria Invisible, 1950–2016. El Desenvolupament del Turisme a L’economia Balear; Lleonard Muntaner Editor: Palma, Spain, 2018. [Google Scholar]
- Pérez-Dacal, D.; Pena-Boquete, Y.; Fernández, M. A Measuring Tourism Specialization: A Composite Indicator for the Spanish Regions. Alma Tour. 2014, 5, 35–73. [Google Scholar]
- Pérez, C. Revoluciones Tecnológicas y Capital Financiero. Las Dinámicas de las Grandes Burbujas y las Épocas de Bonanza; Siglo XXI: Madrid, Spain, 2004. [Google Scholar]
- Morley, C.L. A microeconomic theroy of international tourism demand. Ann. Tour. Res. 1992, 19, 250–267. [Google Scholar] [CrossRef]
- Apostolopoulos, Y.; Loukissas, P.; Leontidou, L. Mediterranean Tourism. Facets If Socioeconomic Development and Cultural Change; Roudlege: London, UK, 2001. [Google Scholar]
- Segreto, L.; Manera, C.; Pohl, M. (Eds.) Europe at the Seaside. The Economic History of Mass Tourism in the Mediterranean; Berghan Books: New York, NY, USA; Oxford, UK, 2009. [Google Scholar]
- Papatheodorou, A.; Song, H. International tourism forecasts: Time-series analysis of world and regional data. Tour. Econ. 2005, 11, 11–23. [Google Scholar] [CrossRef]
- Agarwal, S.; Ball, R.; Shaw, G.; Williams, A. The geography of tourism production: Uneven disciplinary development. Tour. Geogr. 2000, 2, 241–263. [Google Scholar] [CrossRef]
- Pulido-Fernández, J.I.; Cárdenas-García, P.J. Tourism as a tool of economic development in por countries. Tour. Intediscip. J. 2014, 62, 309–322. [Google Scholar]
- OMT. Panorama OMT del Turismo Internacional; OMT: Madrid, Spain, 2017. [Google Scholar]
- Garau, J. Tourist Satisfaction, Dissatisfaction and Place Attachment at Sun and Sand Mass Tourism Destinations; Ph.D. Thesis, Universitat de les Illes Balears, Palma, Spain, 2010. [Google Scholar]
- OMT. Tourism Towards 2030. Global Overview; OMT: Madrid, Spain, 2011. [Google Scholar]
- Alegre, J.; Pou, L.L. The Determinants of the Probability of Tourism Consumption: An Analysis with a Family Expenditure Survey; Working Papers; Departamento de Economía Aplicada de la Universitat de les Illes Balears: Palma, Spain, 2002. [Google Scholar]
- Alegre, J.; Pou, L.L. La reducción del tiempo de estancia en los destinos vacacionales: Implicaciones sobre el gasto turístico y la estacionalidad en las Islas Baleares. G. López Casasnovas (Dir.). In Islas Baleares. Serie Estudios Regionales; Fundación BBVA: Madrid, Spain, 2003. [Google Scholar]
- Britton, S. Tourism, Capital and Place: Towards a Critical Geography of Tourism. Available online: https://journals.sagepub.com/doi/10.1068/d090451 (accessed on 22 November 2018).
- Britton, S. La economía política del turismo en el Tercer Mundo. In Los Mitos del Turismo; Jurdao, F., Ed.; Endymion: Madrid, Spain, 1992. [Google Scholar]
- Poon, A. Tourism, Technology and Competitive Strategies; CAB International: Wallingford, UK, 1993. [Google Scholar]
- Turner, L.; Ash, J. La Horda Dorada. El Turismo Internacional y la Periferia del Placer; Endymion: Madrid, Spain, 1991. [Google Scholar]
- Gormsen, E. The impact of tourism on coastal areas. Geojournal 1997, 42, 39–54. [Google Scholar] [CrossRef]
- Wilkinson, P.F. Strategies for tourism in island microstates. Ann. Tour. Res. 1989, 16, 153–177. [Google Scholar] [CrossRef]
- O’Reilly, A.M. Tourism carrying-capacity: Concept and issues. Tour. Manag. 1986, 7, 254–258. [Google Scholar] [CrossRef]
- Pearce, D. Tourism Development; Longman: Harlow, UK, 1989. [Google Scholar]
- Mowforth, M.; Munt, I. Tourism and Sustainability: New Tourism in the Third World; Routledge: London, UK, 1998. [Google Scholar]
- Sindinga, I. Alternative tourism and sustainable development in Kenya. J. Sustain. Tour. 1999, 7, 108–127. [Google Scholar] [CrossRef]
- Twining-Ward, L.; Butler, R. Implementing sustainable tourism development on a small island: Development and the use of sustainable tourism development indicators in Samoa. J. Sustain. Tour. 2002, 19, 363–387. [Google Scholar] [CrossRef]
- Gössling, S.; Hanssonb, C.B.; Hörstmeierc, O.; Sagge, S. Ecological footprint analysis as a tool to assess tourism sustainability. Ecol. Econ. 2002, 43, 2–3. [Google Scholar] [CrossRef]
- Hall, M.C. Tourism urbanisation and global environmental change. In Tourism and Global Environmental Change. Ecological, Social, Economic and Political Interrelationships; Gössling, S., Hall, M., Eds.; Routledge: New York, NY, USA, 2006. [Google Scholar]
- Pulido-Fernández, J.I.; Sánchez-Rivero, M. Measuring Tourism Sustainability. Proposal of a Composite Index. Tour. Econ. 2009, 15, 277–296. [Google Scholar] [CrossRef]
Figure 1.
Very high Tourism Intensity Index evolution. Source: own work. Data source: World Tourism Organization.
Figure 1.
Very high Tourism Intensity Index evolution. Source: own work. Data source: World Tourism Organization.

Figure 2.
Tourism Density in Macao. Source: own work. Data source: World Tourism Organization and World Bank.
Figure 2.
Tourism Density in Macao. Source: own work. Data source: World Tourism Organization and World Bank.

Figure 3.
Very high Tourism Density. Source: own work. Data source: World Tourism Organization and World Bank.
Figure 3.
Very high Tourism Density. Source: own work. Data source: World Tourism Organization and World Bank.

Figure 4.
High Tourism Density. Source: own work. Data source: World Tourism Organization and World Bank.
Figure 4.
High Tourism Density. Source: own work. Data source: World Tourism Organization and World Bank.


Table 1.
Very high Tourism Intensity Index (mean value 1995–2015).
| COUNTRY | TII |
|---|---|
| Mean Value 1995–2015 | |
| Macao, China | 6.656 |
| Aruba | 3.720 |
| Anguilla | 2.654 |
| Bahamas | 2.164 |
| Maldives | 2.077 |
| Antigua and Barbuda | 1.944 |
Source: own work. Data source: World Tourism Organization.
Table 2.
Basic components of the very high TII.
| (Tourism/Population) (Ti/Pi) | Tourism Revenue/GDP (TRi/GDPi)—% | |
|---|---|---|
| COUNTRY | 2014 | 2014 |
| Macao, China | 25.20 | 92.9 |
| Aruba | 10.36 | 61.0 |
| Anguilla | 4.91 | 41.8 |
| Bahamas | 3.73 | 27.0 |
| Maldives | 3.37 | 91.7 |
There is no 2014 data in the case of Antigua and Barbuda. Source: own work. Data source: World Tourism Organization.
Table 3.
High Tourism Intensity Index (mean value 1995–2015).
| COUNTRY | TII | COUNTRY | TII |
|---|---|---|---|
| Mean Value 1995–2015 | Mean Value 1995–2015 | ||
| Seychelles | 1.501 | Hungary | 697 |
| Bahrain | 1.419 | Belize | 690 |
| Saint Lucia | 1.419 | Fiji | 677 |
| Croatia | 1.413 | Czech Republic | 677 |
| Barbados | 1.360 | Saint Vincent and the Grenadines | 671 |
| Cyprus | 1.203 | Ireland | 667 |
| Saint Kitts and Nevis | 1.157 | Greece | 659 |
| Montenegro | 982 | Cambodia | 619 |
| Montserrat | 969 | Mauritius | 608 |
| Australia | 925 | Finland | 603 |
| Grenada | 866 | Uruguay | 598 |
| New Zealand | 866 | Singapore | 589 |
| Hong Kong, China | 852 | Slovenia | 586 |
| Spain | 847 | Jamaica | 584 |
| Estonia | 813 | France | 580 |
| Austria | 811 | Vanuatu | 579 |
| Dominica | 809 | Samoa | 578 |
| Taiwan Province of China | 804 | United States of America | 513 |
| Malaysia | 789 | Iceland | 509 |
| Luxembourg | 758 | Norway | 501 |
| Thailand | 711 |
Source: own work. Data source: World Tourism Organization.
Table 4.
Five-year evolution of the high Tourism Intensity Index.
| COUNTRY | 1995 | 2000 | 2005 | 2010 | 2015 |
|---|---|---|---|---|---|
| Seychelles | 1.895 | 1.508 | 1.175 | 1.588 | |
| Bahrain | 1.473 | 1.468 | 1.548 | 1.725 | |
| Saint Lucia | 1.809 | 1.554 | 1.596 | 1.258 | |
| Croatia | 1.316 | 1.515 | |||
| Barbados | 1.703 | 1.361 | 1.342 | 1.305 | |
| Cyprus | 1.269 | ||||
| Saint Kitts and Nevis | 1.616 | 930 | 1.440 | 948 | |
| Montenegro | 1.097 | ||||
| Montserrat | 1.592 | 1.425 | 1.101 | 690 | |
| Australia | 966 | 960 | |||
| Grenada | 1.236 | 941 | 564 | 751 | |
| New Zealand | 831 | ||||
| Hong Kong, China | 492 | 724 | 1.124 | 1.259 | |
| Spain | 1.008 | 819 | 775 | 837 | |
| Estonia | 818 | 1.065 | |||
| Austria | 829 | 826 | |||
| Dominica | 909 | 748 | 748 | 873 | |
| Taiwan Province of China | 694 | 914 | |||
| Malaysia | 800 | 810 | |||
| Luxembourg | 736 | 745 | |||
| Thailand | 697 | ||||
| Hungary | 717 | 737 | |||
| Belize | 641 | 642 | 722 | 725 | |
| Fiji | 634 | 494 | 722 | 845 | |
| Czech Republic | 681 | 705 | 624 | ||
| Saint Vincent and the Grenadines | 756 | 739 | 735 | 554 | |
| Ireland | 658 | 753 | |||
| Greece | 667 | 558 | 826 | ||
| Cambodia | 621 | ||||
| Mauritius | 543 | 582 | 608 | 672 | 644 |
| Finland | 547 | 561 | 694 | ||
| Uruguay | 629 | 543 | |||
| Singapore | 884 | 568 | 498 | 631 | |
| Slovenia | 576 | 544 | 629 | 637 | |
| Jamaica | 660 | 591 | 533 | 641 | 637 |
| France | 597 | 583 | 548 | ||
| Vanuatu | 506 | 587 | 503 | 724 | |
| Samoa | 606 | 591 | |||
| United States of America | 520 | 550 | |||
| Iceland | 402 | 426 | 393 | 491 | 1081 |
| Norway | 512 | 494 |
Source: own work. Data source: World Tourism Organization.
Table 5.
Basic components of the high TII.
| (Tourism/Population) (Ti/Pi) | Tourism Revenue/GDP (TRi/GDPi)—% | (Tourism/Population) (Ti/Pi) | Tourism Revenue/GDP (TRi/GDPi)—% | ||
|---|---|---|---|---|---|
| COUNTRY | 2014 | 2014 | COUNTRY | 2014 | 2014 |
| Seychelles | 2.43 | 31.8 | Hungary | 2.73 | 5.4 |
| Bahrain | 7.67 | 5.7 | Belize | 0.91 | 22.1 |
| Saint Lucia | 1.84 | 28.6 | Fiji | 0.78 | 22.8 |
| Croatia | 4.00 | 17.6 | Czech Republic | 3.58 | 3.7 |
| Cyprus | 3.24 | 12.5 | Saint Vincent and the Grenadines | 0.65 | 12.8 |
| Saint Kitts and Nevis | 2.06 | 15.1 | Ireland | 3.81 | 4.4 |
| Montenegro | 2.16 | 20.8 | Greece | 2.34 | 8.2 |
| Montserrat | 1.73 | 13.0 | Cambodia | 0.88 | 19.2 |
| Australia | 10.70 | 2.4 | Mauritius | 0.82 | 13.6 |
| Grenada | 1.26 | 15.8 | Uruguay | 2.33 | 3.5 |
| Hong Kong, China | 3.84 | 15.8 | Singapore | 2.15 | 6.2 |
| Spain | 4.42 | 4.6 | Slovenia | 2.08 | 5.9 |
| Estonia | 4.17 | 8.6 | Jamaica | 0.75 | 16.2 |
| Austria | 4.32 | 4.8 | France | 4.37 | 2.3 |
| Dominica | 1.13 | 23.6 | United States of America | 6.84 | 1.4 |
| Taiwan Province of China | 7.09 | 3.3 | Iceland | 3.05 | 8.0 |
| Malaysia | 3.32 | 6.7 | Norway | 5.73 | 1.3 |
| Luxembourg | 2.05 | 9.6 |
There are no complete 2014 dates in the case of Barbados, New Zealand, Thailand, Finland, Vanuatu, and Samoa. Source: own work. Data source: World Tourism Organization.
Table 6.
Medium Tourism Intensity Index (mean value 1995–2015).
| COUNTRY | TII | COUNTRY | TII |
|---|---|---|---|
| Mean Value 1995–2015 | Mean Value 1995–2015 | ||
| Jordan | 491 | Philippines | 243 |
| Switzerland | 470 | Japan | 225 |
| Republic of Korea | 465 | Kyrgyzstan | 205 |
| Cabo Verde | 456 | South Africa | 205 |
| Slovakia | 444 | Vietnam | 202 |
| Turkey | 444 | Indonesia | 199 |
| Tunisia | 422 | China | 198 |
| Lebanon | 407 | Guyana | 189 |
| Italy | 389 | Israel | 175 |
| United Kingdom | 386 | Ukraine | 163 |
| Dominican Republic | 368 | Oman | 163 |
| Lithuania | 364 | Ecuador | 162 |
| Canada | 360 | Gambia | 160 |
| Armenia | 353 | Suriname | 154 |
| Colombia | 337 | Brunei Darussalam | 141 |
| Belgium | 332 | Mongolia | 138 |
| Albania | 331 | El Salvador | 135 |
| Botswana | 331 | Nicaragua | 124 |
| Romania | 322 | India | 111 |
| Poland | 318 | Honduras | 111 |
| Costa Rica | 308 | Mexico | 106 |
| Tonga | 276 | Bosnia and Herzegovina | 105 |
| Saudi Arabia | 271 | ||
| Panama | 267 | ||
| Qatar | 264 |
Source: own work. Data source: World Tourism Organization.
Table 7.
Five-year evolution of the medium Tourism Intensity Index.
| COUNTRY | 1995 | 2000 | 2005 | 2010 | 2015 |
|---|---|---|---|---|---|
| Jordan | 431 | 378 | 504 | 617 | |
| Switzerland | 466 | 420 | |||
| Republic of Korea | 418 | 467 | |||
| Cabo Verde | 148 | 348 | 497 | 767 | |
| Slovakia | 437 | 430 | |||
| Turkey | 428 | 467 | |||
| Tunisia | 489 | 461 | 422 | 463 | |
| Lebanon | 196 | 507 | 621 | ||
| Italy | 447 | 377 | 374 | 336 | |
| United Kingdom | 382 | 404 | |||
| Dominican Republic | 345 | 405 | 369 | 348 | 390 |
| Lithuania | 383 | 348 | 347 | ||
| Canada | 371 | 342 | |||
| Armenia | 342 | 442 | |||
| Colombia | 339 | 395 | |||
| Belgium | 322 | 353 | |||
| Albania | 44 | 66 | 645 | 733 | |
| Botswana | 252 | 316 | 381 | 450 | |
| Romania | 295 | 344 | |||
| Poland | 319 | 308 | 321 | ||
| Costa Rica | 274 | 316 | 341 | 320 | |
| Tonga | 275 | 227 | 277 | 355 | |
| Saudi Arabia | 266 | 252 | 333 | ||
| Panama | 167 | 184 | 222 | 350 | 441 |
| Qatar | 134 | 246 | |||
| Philippines | 208 | 308 | |||
| Japan | 228 | ||||
| Kyrgyzstan | 45 | 160 | 344 | ||
| South Africa | 209 | 188 | |||
| Vietnam | 173 | 230 | |||
| Indonesia | 193 | 213 | |||
| China | 180 | 185 | 200 | 213 | |
| Guyana | 200 | 249 | 147 | 162 | |
| Israel | 274 | 234 | 150 | 186 | 150 |
| Ukraine | 44 | 96 | 220 | 243 | 126 |
| Oman | 138 | 152 | 181 | ||
| Ecuador | 186 | 203 | |||
| Gambia | 152 | 129 | |||
| Suriname | 193 | 143 | 238 | 152 | |
| Brunei Darussalam | 150 | ||||
| Mongolia | 78 | 89 | 187 | 169 | |
| El Salvador | 59 | 133 | 154 | 146 | 183 |
| Nicaragua | 71 | 111 | 135 | 153 | |
| India | 72 | 80 | 101 | 139 | 187 |
| Honduras | 73 | 104 | 123 | 130 | |
| Mexico | 163 | 111 | 98 | 93 | 113 |
| Bosnia and Herzegovina | 93 | 94 | 115 |
Source: own work. Data source: World Tourism Organization.
Table 8.
Basic components of the medium TII.
| (Tourism/Population) (Ti/Pi) | Tourism Revenue/GDP (TRi/GDPi)—% | (Tourism/Population) (Ti/Pi) | Tourism Revenue/GDP (TRi/GDPi)—% | ||
|---|---|---|---|---|---|
| COUNTRY | 2014 | 2014 | COUNTRY | 2014 | 2014 |
| Jordan | 0.54 | 15.4 | Saudi Arabia | 1.79 | 1.2 |
| Switzerland | 1.91 | 3.0 | Panama | 0.45 | 11.7 |
| Republic of Korea | 4.82 | 1.6 | Qatar | 1.30 | 5.0 |
| Turkey | 1.43 | 4.9 | Philippines | 1.13 | 2.1 |
| Tunisia | 0.64 | 6.4 | Japan | 4.80 | 0.4 |
| Italy | 1.65 | 2.1 | Kyrgyzstan | 0.49 | 6.3 |
| United Kingdom | 2.28 | 2.0 | South Africa | 0.40 | 3.0 |
| Dominican Republic | 0.49 | 8.8 | Indonesia | 1.02 | 1.3 |
| Lithuania | 1.62 | 2.9 | China | 2.68 | 1.0 |
| Canada | 3.52 | 1.2 | Israel | 0.37 | 2.1 |
| Armenia | 0.69 | 8.6 | Ukraine | 0.28 | 1.7 |
| Colombia | 2.73 | 1.3 | Oman | 0.38 | 2.4 |
| Belgium | 1.3 | 2.8 | Brunei Darussalam | 0.48 | 0.5 |
| Albania | 1.16 | 14.0 | El Salvador | 0.22 | 5.1 |
| Botswana | 0.89 | 6.2 | Nicaragua | 0.22 | 3.8 |
| Romania | 2.98 | 1.1 | India | 1.00 | 1.0 |
| Poland | 1.41 | 2.2 | Mexico | 0.23 | 1.3 |
| Costa Rica | 0.53 | 6.4 | Bosnia And Herzegovina | 0.14 | 4.0 |
There are no complete 2014 dates in the case of Cabo Verde, Slovakia, Lebanon, Tonga, Vietnam, Guyana, Gambia, Suriname, Mongolia, and Honduras. Source: own work. Data source: World Tourism Organization.
Table 9.
Low Tourism Intensity Index (mean value 1995–2015).
| COUNTRY | TII | COUNTRY | TII |
|---|---|---|---|
| Mean Value 1995–2015 | Mean Value 1995–2015 | ||
| Comoros | 98 | Kuwait | 39 |
| The Former Yugoslav Republic of Macedonia | 97 | Malawi | 38 |
| Syrian Arab Republic | 95 | Togo | 38 |
| Lesotho | 93 | Madagascar | 37 |
| Guatemala | 92 | Yemen | 33 |
| Azerbaijan | 86 | Mali | 30 |
| Senegal | 85 | Cameroon | 28 |
| Rwanda | 84 | Guinea-Bissau | 24 |
| Russian Federation | 83 | Timor-Leste | 23 |
| Kenya | 81 | Burkina Faso | 23 |
| Serbia | 70 | Ethiopia | 21 |
| Solomon Islands | 69 | Sierra Leone | 21 |
| Zambia | 69 | Côte D’Ivoire | 17 |
| Bolivarian Republic of Venezuela | 67 | Algeria | 16 |
| Bhutan | 66 | Chad | 15 |
| Plurinational State of Bolivia | 64 | Congo | 14 |
| Republic of Moldova | 60 | Niger | 14 |
| Haiti | 57 | Pakistan | 11 |
| Peru | 57 | Papua New Guinea | 10 |
| Belarus | 56 | Angola | 9 |
| Paraguay | 54 | Burundi | 8 |
| Sri Lanka | 53 | Sudan | 8 |
| Nepal | 48 | Central African Republic | 8 |
| Uganda | 47 | Myanmar | 4 |
| Ghana | 46 | Bangladesh | 2 |
| Benin | 45 | Democratic Republic of the Congo | 1 |
| Djibouti | 41 |
Source: own work. Data source: World Tourism Organization.
Table 10.
Five-year evolution of the low Tourism Intensity Index.
| COUNTRY | 1995 | 2000 | 2005 | 2010 | 2015 |
|---|---|---|---|---|---|
| Comoros | 156 | 112 | 93 | 74 | |
| The Former Yugoslav Republic of Macedonia | 101 | 78 | 100 | 140 | |
| Syrian Arab Republic | 85 | 82 | 98 | 201 | |
| Lesotho | 89 | 89 | |||
| Guatemala | 97 | 84 | |||
| Azerbaijan | 45 | 88 | |||
| Senegal | 76 | 71 | 92 | 96 | |
| Rwanda | 28 | 82 | 119 | ||
| Russian Federation | 70 | 86 | 71 | 70 | 85 |
| Kenya | 123 | 67 | 81 | 82 | |
| Serbia | 43 | 82 | 121 | ||
| Solomon Islands | 89 | 24 | 31 | 103 | |
| Zambia | 59 | 103 | 78 | ||
| Bolivarian Republic of Venezuela | 61 | ||||
| Bhutan | 28 | 35 | 41 | 93 | |
| Plurinational State of Bolivia | 52 | 42 | 82 | 66 | 79 |
| Republic of Moldova | 56 | 64 | |||
| Haiti | 61 | 47 | 27 | 73 | |
| Peru | 32 | 44 | 60 | 69 | |
| Belarus | 34 | 60 | 77 | ||
| Paraguay | 92 | 48 | 46 | 58 | 99 |
| Sri Lanka | 57 | 44 | 52 | 50 | |
| Nepal | 69 | 56 | 30 | 44 | |
| Uganda | 23 | 30 | 48 | 73 | |
| Ghana | 20 | 56 | |||
| Benin | 68 | 42 | 42 | 42 | |
| Djibouti | 42 | 41 | 35 | ||
| Kuwait | 51 | 41 | 28 | 35 | |
| Malawi | 40 | 36 | 38 | 35 | |
| Togo | 23 | 20 | 24 | 60 | |
| Madagascar | 31 | 39 | 43 | 35 | |
| Yemen | 9 | 10 | 22 | 82 | |
| Mali | 34 | ||||
| Cameroon | 18 | 31 | 21 | 27 | |
| Guinea-Bissau | 5 | 28 | |||
| Timor-Leste | 28 | ||||
| Burkina Faso | 19 | 22 | 28 | ||
| Ethiopia | 17 | 14 | 20 | 33 | |
| Sierra Leone | 35 | 15 | 32 | 16 | |
| Côte D’Ivoire | 20 | ||||
| Algeria | 8 | 14 | 25 | 21 | |
| Chad | 20 | 14 | |||
| Congo | 22 | 10 | 15 | 0 | |
| Niger | 8 | 15 | 13 | 18 | |
| Pakistan | 13 | 11 | 11 | 11 | |
| Papua New Guinea | 15 | 9 | |||
| Angola | 7 | 11 | |||
| Burundi | 8 | 6 | 10 | 8 | 6 |
| Sudan | 2 | 1 | 9 | 8 | |
| Central African Republic | 12 | 8 | 7 | ||
| Myanmar | 6 | 4 | |||
| Bangladesh | 2 | 3 | 3 | 3 | |
| Democratic Republic of the Congo | 1 | 1 |
Source: own work. Data source: World Tourism Organization.
Table 11.
Basic components of the low TII.
| (Tourism/Population) (Ti/Pi) | Tourism Revenue/GDP (TRi/GDPi)—% | (Tourism/Population) (Ti/Pi) | Tourism Revenue/GDP (TRi/GDPi)—% | ||
|---|---|---|---|---|---|
| COUNTRY | 2014 | 2014 | COUNTRY | 2014 | 2014 |
| The Former Yugoslav Republic of Macedonia | 0.20 | 2.6 | Belarus | 0.11 | 1.6 |
| Guatemala | 0.09 | 2.7 | Paraguay | 0.10 | 0.1 |
| Azerbaijan | 0.22 | 3.6 | Sri Lanka | 0.07 | 4.4 |
| Senegal | 0.07 | 3.1 | Nepal | 0.03 | 2.6 |
| Rwanda | 0.08 | 3.7 | Benin | 0.02 | 1.7 |
| Russian Federation | 0.23 | 1.0 | Kuwait | 0.05 | 0.4 |
| Kenya | 0.03 | 3.0 | Malawi | 0.05 | 0.6 |
| Serbia | 0.12 | 3.1 | Togo | 0.04 | 5.1 |
| Solomon Islands | 0.04 | 6.2 | Mali | 0.01 | 1.8 |
| Zambia | 0.06 | 2.4 | Burkina Faso | 0.01 | 1.5 |
| Bolivarian Republic of Venezuela | 0.51 | 0.1 | Sierra Leone | 0.01 | 0.7 |
| Bhutan | 0.18 | 6.1 | Algeria | 0.06 | 0.2 |
| Plurinational State of Bolivia | 0.08 | 2.2 | Burundi | 0.02 | 0.2 |
| Republic of Moldova | 0.03 | 3.9 | Bangladesh | 0.00 | 0.1 |
| Peru | 0.10 | 1.9 |
There are no complete 2014 dates in the case of Comoros, Syrian Arab Republic, Lesotho, Haiti, Uganda, Ghana, Djibouti, Madagascar, Yemen, Cameroon, Guinea-Bissau, Timor-Leste, Ethiopia, Cote d’Ivore, Chad, Congo, Niger, Pakistan, Papua New Guinea, Angola, Sudan, Central African Republic, Myanmar, and Democratic Republic of the Congo. Source: own work. Data source: World Tourism Organization.
Table 12.
Five-year evolution of the medium Tourism Density.
| COUNTRY | 1995 | 2000 | 2005 | 2010 | 2014 | Average (1995–2014) |
|---|---|---|---|---|---|---|
| United Kingdom | 607 | 605 | 627 | |||
| Antigua and Barbuda | 500 | 470 | 557 | 523 | 538 | |
| France | 537 | 509 | 527 | 530 | ||
| Czech Republic | 437 | 458 | 477 | 461 | ||
| Saint Lucia | 373 | 435 | 513 | 494 | 545 | 455 |
| Belgium | 424 | 480 | 445 | |||
| Spain | 380 | 419 | 392 | 406 | 399 | |
| Cyprus | 390 | 404 | 393 | |||
| Italy | 384 | 410 | 410 | 333 | 389 | |
| Saint Kitts and Nevis | 304 | 281 | 542 | 377 | 435 | 383 |
| Switzerland | 368 | 379 | 383 | |||
| Luxembourg | 329 | 441 | 378 | |||
| Mauritius | 206 | 322 | 375 | 459 | 506 | 372 |
| Grenada | 318 | 379 | 291 | 324 | 394 | 355 |
| Seychelles | 258 | 283 | 262 | 367 | 483 | 319 |
Source: own work. Data source: World Tourism Organization and World Bank.
Table 13.
Evolution of Tourism Density.
| COUNTRY | Tourism Density | Initial Year Considered | Final Year Considered | Initial Tourism Density | Final Tourism Density | Growth |
|---|---|---|---|---|---|---|
| India | Low | 1995 | 2014 | 42 | 393 | 830.0 |
| Qatar | Low | 1999 | 2014 | 31 | 243 | 691.6 |
| China | Low | 1995 | 2014 | 67 | 382 | 473.5 |
| Maldives | High | 1995 | 2014 | 1.054 | 4.506 | 327.6 |
| Bahrain | High | 1995 | 2014 | 3.255 | 13.556 | 316.5 |
| Hong Kong, China | Very High | 1998 | 2014 | 6.532 | 25.183 | 285.5 |
| Mauritius | Medium | 1995 | 2014 | 206 | 506 | 146.1 |
| Macao, China | Very High | 1995 | 2014 | 210.100 | 480.726 | 128.8 |
| Lebanon | Low | 1997 | 2013 | 53 | 122 | 128.3 |
| Philippines | Low | 2009 | 2014 | 174 | 374 | 114.8 |
| Malaysia | Low | 2008 | 2014 | 155 | 300 | 92.8 |
| Seychelles | Medium | 1995 | 2014 | 258 | 483 | 86.9 |
| Singapore | Very High | 1995 | 2014 | 9.034 | 16.390 | 81.4 |
| Jamaica | Low | 1995 | 2014 | 104 | 189 | 81.3 |
| Aruba | High | 1995 | 2014 | 3.439 | 5.956 | 73.2 |
| Thailand | Low | 2006 | 2013 | 186 | 297 | 60.1 |
| Saint Lucia | Medium | 1995 | 2014 | 373 | 545 | 46.3 |
| Saint Kitts and Nevis | Medium | 1995 | 2014 | 304 | 435 | 43.0 |
| Israel | Low | 1995 | 2014 | 104 | 137 | 31.5 |
| Colombia | Low | 2009 | 2014 | 89 | 114 | 27.9 |
| Spain | Medium | 1999 | 2014 | 318 | 406 | 27.8 |
| Slovenia | Low | 2000 | 2014 | 167 | 212 | 26.5 |
| Indonesia | Low | 2006 | 2014 | 110 | 136 | 24.5 |
| Grenada | Medium | 1995 | 2014 | 318 | 394 | 24.1 |
| Turkey | Low | 2009 | 2014 | 116 | 141 | 21.6 |
| Barbados | High | 1995 | 2012 | 1.028 | 1.247 | 21.3 |
| Belgium | Medium | 2009 | 2014 | 399 | 480 | 20.3 |
| Saint Vincent and The Grenadines | Low | 1995 | 2014 | 154 | 182 | 18.3 |
| Luxembourg | Medium | 2007 | 2014 | 381 | 441 | 15.5 |
| Ireland | Low | 2006 | 2014 | 217 | 250 | 15.4 |
| Austria | Medium | 2008 | 2014 | 385 | 440 | 14.2 |
| Cyprus | Medium | 2003 | 2014 | 355 | 404 | 13.9 |
| Croatia | Low | 2008 | 2014 | 265 | 300 | 13.1 |
| Antigua and Barbuda | Medium | 1995 | 2013 | 500 | 552 | 10.5 |
| Italy | Medium | 1997 | 2014 | 310 | 333 | 7.4 |
| Republic of Korea | High | 2009 | 2014 | 2.294 | 2.423 | 5.6 |
| Poland | Low | 2005 | 2014 | 162 | 171 | 5.4 |
| Greece | Low | 2004 | 2014 | 184 | 193 | 4.8 |
| United States of America | Low | 2007 | 2014 | 214 | 222 | 3.8 |
| Czech Republic | Medium | 2003 | 2014 | 464 | 477 | 2.8 |
| France | Medium | 2005 | 2014 | 537 | 527 | −1.9 |
| Slovakia | Low | 2005 | 2013 | 246 | 236 | −4.2 |
| United Kingdom | Medium | 2009 | 2014 | 634 | 605 | −4.4 |
| Switzerland | Medium | 1998 | 2014 | 423 | 379 | −10.5 |
| Bahamas | Low | 1995 | 2014 | 115 | 103 | −10.7 |
| Hungary | Low | 2008 | 2014 | 328 | 289 | −11.8 |
| Japan | High | 2008 | 2014 | 1.977 | 1.615 | −18.3 |
Source: own work. Data source: World Tourism Organization and World Bank.
Table 14.
Five-year evolution of the low Tourism Density.
| COUNTRY | 1995 | 2000 | 2005 | 2010 | 2014 | Average (1995–2014) |
|---|---|---|---|---|---|---|
| Croatia | 263 | 300 | 280 | |||
| Philippines | 211 | 374 | 270 | |||
| Slovakia | 246 | 209 | 237 | |||
| Thailand | 229 | 230 | ||||
| Malaysia | 207 | 300 | 226 | |||
| Ireland | 203 | 250 | 224 | |||
| United States of America | 205 | 222 | 210 | |||
| Saint Vincent and the Grenadines | 154 | 187 | 246 | 185 | 182 | 194 |
| Greece | 211 | 152 | 193 | 191 | ||
| Slovenia | 167 | 173 | 190 | 212 | 185 | |
| China | 67 | 81 | 131 | 225 | 382 | 161 |
| Poland | 162 | 146 | 171 | 159 | ||
| India | 42 | 68 | 120 | 229 | 393 | 152 |
| Jamaica | 104 | 120 | 135 | 175 | 189 | 141 |
| Turkey | 127 | 141 | 129 | |||
| Indonesia | 126 | 136 | 126 | |||
| Lebanon | 71 | 109 | 207 | 110 | ||
| Bahamas | 115 | 111 | 116 | 99 | 103 | 108 |
| Qatar | 33 | 79 | 243 | 105 | ||
| Colombia | 105 | 114 | 105 | |||
| Israel | 104 | 115 | 90 | 130 | 137 | 100 |
Source: own work. Data source: World Tourism Organization and World Bank.
© 2018 by the authors. Licensee MDPI, Basel, Switzerland. This article is an open access article distributed under the terms and conditions of the Creative Commons Attribution (CC BY) license (http://creativecommons.org/licenses/by/4.0/).
Share and Cite
MDPI and ACS Style
Manera, C.; Valle, E. Tourist Intensity in the World, 1995–2015: Two Measurement Proposals. Sustainability 2018, 10, 4546. https://doi.org/10.3390/su10124546
AMA Style
Manera C, Valle E. Tourist Intensity in the World, 1995–2015: Two Measurement Proposals. Sustainability. 2018; 10(12):4546. https://doi.org/10.3390/su10124546
Chicago/Turabian StyleManera, Carles, and Elisabeth Valle. 2018. "Tourist Intensity in the World, 1995–2015: Two Measurement Proposals" Sustainability 10, no. 12: 4546. https://doi.org/10.3390/su10124546
Note that from the first issue of 2016, this journal uses article numbers instead of page numbers. See further details here.