Article

Complex Interrelationships between Ecosystem Services Supply and Tourism Demand: General Framework and Evidence from the Origin of Three Asian Rivers

1
Center for Systems Integration and Sustainability, Department of Fisheries and Wildlife, Michigan State University, East Lansing, MI 48823, USA
2
Environmental Science and Policy Program, Michigan State University, East Lansing, MI 48824, USA
3
Key Laboratory of Land Surface Pattern and Simulation, Institute of Geographic Sciences and Natural Resources Research, Chinese Academy of Sciences, Beijing 100101, China
4
Guangdong Urban & Rural Planning and Design Institute, Guangzhou 510290, China
5
University of Chinese Academy of Sciences, Beijing 100049, China
*
Author to whom correspondence should be addressed.
Sustainability 2018, 10(12), 4576; https://doi.org/10.3390/su10124576
Submission received: 24 October 2018 / Revised: 27 November 2018 / Accepted: 30 November 2018 / Published: 4 December 2018

Abstract

:
Over the past two decades, the demands of nature-based tourism have been rapidly growing worldwide, yet it is not clear how tourist demands for water, food, and infrastructure influence the ecosystem services (ES), which are often the bedrock of an area’s economic, cultural, and natural wealth. With a general conceptual model that applies the telecoupling framework, this study identifies complex interrelationships between the demand for nature-based tourism, which is a type of cultural ES, ES supply, and the economy simultaneously, using China’s Qinghai Province as a demonstration site. The province is the origin of three rivers, making it crucial for water retention and prime for tourism. The results indicate that there is a strong spatial interaction between the number of tourism attractions and water retention. The southern Qinghai region’s natural resources are protected by the Sanjiangyuan (three rivers headwater) National Park. From 2010–2014, tourists in the Sanjiangyuan region spent more money than those in the northern Qinghai region, which has accelerated the development of tourism infrastructures. The Sanjiangyuan region may face the unexpected degradation of its natural habitats due to rapid tourism development. Our findings suggest that new management plans are needed to minimize the negative impacts from the demands of distant tourists, and preserve the region that supports both the environment and the economy.

1. Introduction

The challenges of managing multiple ecosystem services (ES) include determining the complex interactions between ES supply and demand in the context of coupled human and natural systems [1,2,3]. While rapid economic growth leads humans to become more dependent on ES [4], high ES demands may exceed the capacity of ES supplies worldwide [2,5]. The demands for ES in distant locations are met via food trade, water transfer, or traveling—as in nature-based tourism [5,6]. The increasing separation between where ES are needed and from where they are supplied makes managing multiple ES difficult [7,8]. Increasing ES demand across regions may accelerate ES flows, but damage the supply areas’ basic ability to provide those resources [9]. Therefore, a holistic approach is necessary to investigate complex interconnections between the ES supply and demand areas and integrate human and natural systems using the framework of telecoupling (socioeconomic and environmental interactions over distances) [10].
Tourism is comprised of flows of international and domestic tourists from the sending systems (ES demand areas, departures, origins) to attractions in the receiving systems (ES supply areas, arrivals, destinations). Under the telecoupling framework, nature-based tourism, as a type of cultural ES that interacts with other ES and economies across regions, is a telecoupling process [11,12]. Tourist flows can provide avenues to achieve international coordinated efforts for sustainable tourism (e.g., the United Nations (UN) Sustainable Development Goals (SDGs) and International Union for Conservation of Nature (IUCN) Tourism and Protected Areas Specialist Group Strategy (TAPAS)) [13,14]. For example, increased tourist flows may contribute to SDG 8.9 (“By 2030, devise and implement policies to promote sustainable tourism that creates jobs and promotes local culture and products”) and 12.B (“Develop and implement tools to monitor sustainable development impacts for sustainable tourism that creates jobs and promotes local culture and products”), because tourists can use ES and economically boost tourism sites and beyond. Global tourists annually consume approximately 39.4 Mt of food and 138 km3 of fresh water, and emit 4.5 Gt of CO2 emissions during travel [15,16]. In addition, tourism provided 10.4% of the global gross domestic product (GDP) and 9.9% of global employment in 2017 [17]. The increased tourist flows have the potential to influence the supply ability of multiple ES and enhance local economies that span long distances [18].
Nature-based tourism in areas with natural and cultural attractions has become one of tourism’s fastest growing sectors [19]. However, it is not clear how the increased demand for nature-based tourism simultaneously generates telecoupled interrelationships with other supplies of ES and influences economies. For example, multiple conservation efforts for ES may further facilitate meeting nature-based tourism demand because nature-based tourism depends highly on the provision of many other ES [20,21]. At the same time, nature-based tourism can be improved with conservation policies [6]. Even if the conservation policies increase nature-based tourism supply and local incomes, the increased tourism demand may be at odds with the supply of other ES and negatively influence conservation efforts [22]. Therefore, investigating the complex interactions between ES demand and supply as well as the environment and economy is critical for policymaking regarding ecosystem conservation and tourism development.
This research develops a general conceptual model that applies the integrated telecoupling framework [11]. The telecoupling framework can help identify socioeconomic and environmental interactions over long distances [11]. By using the telecoupling framework, a better understanding of how nature-based tourism demand interacts with multiple ES supply and the economy can help harmonize ecosystem conservation and tourism development.
Using China’s Qinghai Province as a demonstration site, our general conceptual model will help to understand how tourist attractions that draw more tourists from afar interact with multiple ES supplies as well as with the environment and economy of the region. We first illustrate the conceptual model to demonstrate the causes and effects of distant tourism demand on multiple ES supplies. Then, we identify tourist flows toward Qinghai Province. After investigating factors that influence Qinghai tourism demand, we assess interrelationships between tourism demand and five major ES (crop and livestock production, water retention, carbon sequestration, and tourism attraction). We select five major ES based on data availability and the importance for human communities. We also evaluate the effects of the tourism on the environment and the economy.

2. Materials and Methods

2.1. General Conceptual Model

Conventional tourism studies have mainly focused on socioeconomic and/or environmental factors for tourism demand [23,24], environmental effects [15], or socioeconomic effects [17] separately, although these components may be closely interrelated. To identify the complex interrelationships comprehensively, we propose a general conceptual model based on the integrated telecoupling framework. Telecoupling refers to socioeconomic and environmental interactions over distance [11]. Applying the telecoupling framework to telecoupling processes is burgeoning [18]. The telecoupling framework contains five major components that are interconnected: systems, agents, flows, causes, and effects. Systems are coupled human and natural systems that include sending, receiving, and spillover systems. Agents are entities that facilitate or hinder telecoupling processes. Driven by agents, flows are movements of materials, energy, people, and information between systems. Causes are factors that affect the emergence and dynamics of telecouplings. Effects are socioeconomic and environmental impacts triggered by telecoupling processes [11]. The telecoupling framework can help identify distant tourism demand and socioeconomic and environmental effects simultaneously [10,18]. The telecoupling framework has been utilized to explore a variety of important issues, such as the trade of food [25], sand [26], and forest products [27], land use and land cover change [28], species migration [29], water transfer [30], payment for ecosystem services [31], conservation [32], fisheries [33], foreign direct investment [34], and economic development [35]. This research used the framework in the context of tourism demand, multiple ES supplies, and tourist consumption.
To operationalize the telecoupling framework in the context of nature-based tourism, we develop a general conceptual model (Figure 1). Figure 1 demonstrates how the demand for nature-based tourism, a type of cultural ES, forms telecoupled interrelationships with multiple ES supply in a receiving system. Tourists generate a flow from sending systems to tourism attractions in receiving systems as a telecoupling process [18]. Spillover systems are affected by interactions between sending and receiving systems (e.g., connecting flights or transportation routes), and generate spillover effects such as spatial externalities (e.g., greenhouse gas emissions for climate change) [36]. The conceptual model assumes that the increase of tourism attractions spurred by distant demand affects not only the supply ability of multiple ES, but also the environment and economy of the receiving system attracting tourists [5,18]. We focused on the impacts of the tourism activity on the receiving system providing tourism attractions and the resulting impacts of the tourism activity on multiple ES supplies. In this research, annual visitation numbers and their economic capacity represent the demand for nature-based tourism, and the number of tourism attractions represents the supply of nature-based tourism. Although tourism demand and supply can change with the season, we did not include seasonal changes of tourism demand and supply due to a lack of relevant data.
In the receiving system, the interconnections among causes, effects, and agents of tourism activity can emerge due to tourist flows (Figure 1). Nature-based tourists may prefer to visit tourism attractions (flows) that have good natural conditions (causes), while the demand for nature-based tourism in sending systems affects the supply of nature-based tourism along with other ES provisioning in a receiving system (effects). The telecoupling process of nature-based tourism is generated by agents (e.g., tourists, tourism agencies, local governments, or hotels) that facilitate or prevent tourist flows. For example, when nature-based tourism and regulating ES co-occur in some natural areas, tourism attractions that have a high supply of regulating ES (e.g., water-retention ability) can attract more tourists (e.g., designated spots to appreciate lake views). Consequently, such tourism attractions may suffer high environmental pressures due to the high number of tourists (represented in the tourism pressure area in Figure 1). The environmental pressures may cause a trade-off between nature-based tourism and surrounding regulating and provisioning ES. The conceptual model includes five components (systems, agents, flows, causes, and effects) of the telecoupling framework. By including the five components, the conceptual model can provide a systematic understanding of distant interrelationships of tourism demand with multiple ES supplies, as well as the environment and economy in the receiving system.

2.2. Systems

In this study, Qinghai Province is a receiving system (Figure 2). Sending systems are the countries that send international tourists to Qinghai Province and the other parts of China that send domestic tourists. This study focuses on the causes and effects of Qinghai tourism, because our research objective is to examine how distant tourism demand influences five ES supplies as well as the environment and economy of the region attracting tourists. We used administrative boundaries for these systems, because social and political processes directly influence ES demand and change ES supply [21,37]. This work can also be useful for informing policy making, which is a good justification for using administrative boundaries to define system boundaries.
Qinghai Province has experienced rapid tourism growth over the past few decades. Its location in the Qinghai–Tibetan (or Qing–Zang) Plateau provides unique natural scenery and cultural heritage as cultural ES for tourists [39,40,41]. Qinghai tourism mainly occurs in scenic natural areas such as Qinghai Lake and Buddhist cultural heritage sites such as Kumbum monastery [41,42,43]. In 2014, Qinghai Province had 42 natural attractions (46.7%) and 43 cultural attractions (47.8%). Five tourism attractions (5.5%) had both natural and cultural spots. In southern Qinghai, the Sanjiangyuan (three rivers headwater) region is the critical natural area for China. The dominant land cover type in southern Qinghai is grasslands (Figure 2). The Sanjiangyuan region is reputed as ‘the origin of three rivers’, because the Yellow, Yangtze, and Mekong rivers start from this area [39,44,45]. The Sanjiangyuan Nature Reserve was established in 2003 and promoted to a national nature reserve in 2005, at which point it became the second-largest protected area in China (152,300 km2) [46]. In 2015, the Sanjiangyuan Nature Reserve became the first national park in China [47].
Qinghai Province has a population of 5.8 million people (2.8 million in the urban area and three million in the rural area) and 720,000 km2 of land. As Qinghai Province’s elevation is over 3000 m, its climate is appealing for tourists who seek cool temperatures during the summer [48]. The mean temperature is 4.7 °C (14.4 °C in summer) with an average annual precipitation of 441.9 mm [49].
Qinghai Province has two tiers of local governments: eight prefectures and 43 counties that are nested within the prefectures. We selected the prefectures for the statistical analysis of tourism demand over time and the counties for ES quantifications. Then, we estimated the effects of tourism on the economy and the environment at the province level by aggregating information at the county and prefecture levels. This study mainly covered the period of 2000–2014 for ES quantification and effect analysis. In the panel regression analysis, we selected the period of 2010–2014.

2.3. Agents and Flows Analysis

Agents that can facilitate or discourage Qinghai tourism included tourists, tourism agencies, and local residents from 2000 to 2014 at the province level. The relevant data were obtained from the Qinghai statistical yearbook [49]. Specifically, to identify the flows of international and domestic tourists, we collected data about the countries of residence for international tourists and the provinces of residence for domestic tourists over the period of 2012–2014. We selected domestic provinces that sent more than 200,000 tourists, and countries that sent more than 30 tourists. These tourists visited natural and/or cultural attractions in Qinghai Province. The percentage of tourism earnings in Qinghai GDP was calculated using data on tourism earnings from the Qinghai statistical yearbook.

2.4. Statistical Analysis of Tourism Demand over Time

To determine the factors that affect Qinghai tourism demand, we performed a linear panel regression analysis in R [50]. Panel regression models can control for variables that change not only over time, but also across entities (e.g., country or person). Qinghai tourism demand may be changed across regions and over time, which have different socioeconomic and environmental factors. From 2010 to 2014, panel data were obtained from the Qinghai statistical yearbook at the prefecture level [49]. We established two models that had annual visitation numbers and per tourist expenditure as separate dependent variables. These two dependent variables represent the demand for nature-based tourism in Qinghai Province. Independent variables included the number of tourism attractions, the percentage of GDP from construction, road and rail length, and per-capita GDP.
We selected these four independent variables based on previous studies and data availability. These factors help investigate the determinants of Qinghai tourism. Destination attractions such as natural scenery, cultural heritage, and iconic sites are essential drivers for tourist flows [6,51,52]. We used the number of natural and cultural attractions, which represents the supply for nature-based tourism in Qinghai Province. Tourists prefer to visit tourism attractions that have good accessibility and transportation infrastructure [41,53]. We used road and railway length to indicate accessibility. In addition, tourism facilities (e.g., visitor information center and lodging facility) can encourage tourist flows [52,54]. We used the percentage of GDP from construction as a proxy of the level of tourism development. Income level at a destination is the most influential predictor for tourist flows. High-income areas can attract more tourists as they can provide better public services and have more spending opportunities [54,55,56]. We included per capita GDP as an independent variable.
We used a Hausman test to decide fixed effects model or random effects model [57]. This test accepted the random effects model. The random effects model assumes that the variation across prefectures is random and uncorrelated with the independent variables. We also performed a Breusch–Pagan Lagrange multiplier (LM) test to choose between a random effects regression model and a simple ordinary least squares (OLS) regression model [57]. The null hypothesis of the LM test is that there are no significant variances across prefectures (no panel effect). Our test rejected the null hypothesis and concluded that the random effects model is appropriate. Cross-sectional dependence and serial correlation are problems in macro panels with long time series, but they are not problems in micro panels with a few years. Our panel data had eight prefectures over five years, and therefore, we did not need to perform tests for cross-sectional dependence and serial correlation. We also tested for heteroskedasticity. As we detected heteroskedasticity in the random effects model of annual visitation numbers, we used robust covariance estimation (also known as a Sandwich estimation of variance) to account for it [57].

2.5. ES Supply Quantification

From 2000 to 2014, we assessed and mapped five ES at the county level, including provisioning (crop production and livestock production), regulating (water retention and carbon sequestration), and cultural ES (tourism attraction). We selected these ES based on data availability and the importance of ES to human communities. The quantified maps of multiple ES allow identifying spatial interactions between nature-based tourism demand and multiple ES supply in Qinghai Province.
Spatial and temporal scales differed among the five ES because of their data availability. While carbon sequestration was quantified from raster data 500-m resolution, the other four ES (crop and livestock production, water retention, and tourism attraction) were at the scale of counties. Additionally, to examine the spatial distribution of water retention, we obtained raster data of water retention with 90-m resolution in 2000 and 2010. Crop production, livestock production, water retention, and carbon sequestration were quantified over the period of 2000–2014. Tourism attractions were quantified from 2008 to 2014.
We mapped each ES to show spatial distributions and compare changes over time in ArcGIS [38]. The spatial clustering of ES changes was determined using global Moran’s I with queen contiguity in ArcGIS [38]. Principal component analysis (PCA) was also used to quantify the interrelationships among five ES across county boundaries [37,58]. To perform PCA, we aggregated the results of five ES quantification according to county boundaries over the period from 2010 to 2014.

2.5.1. Crop and Livestock Production

We collected data on annual crop and livestock production from 2000 to 2014 using the Qinghai statistical yearbook [49]. The most detailed spatial unit of the statistical yearbook was at the county level. We used physical unit (tonne) of crop and livestock production. Crops included wheat, corn, soybean, oil-bearing crops, fruits, and vegetables. Livestock production included meat, eggs, and milk.

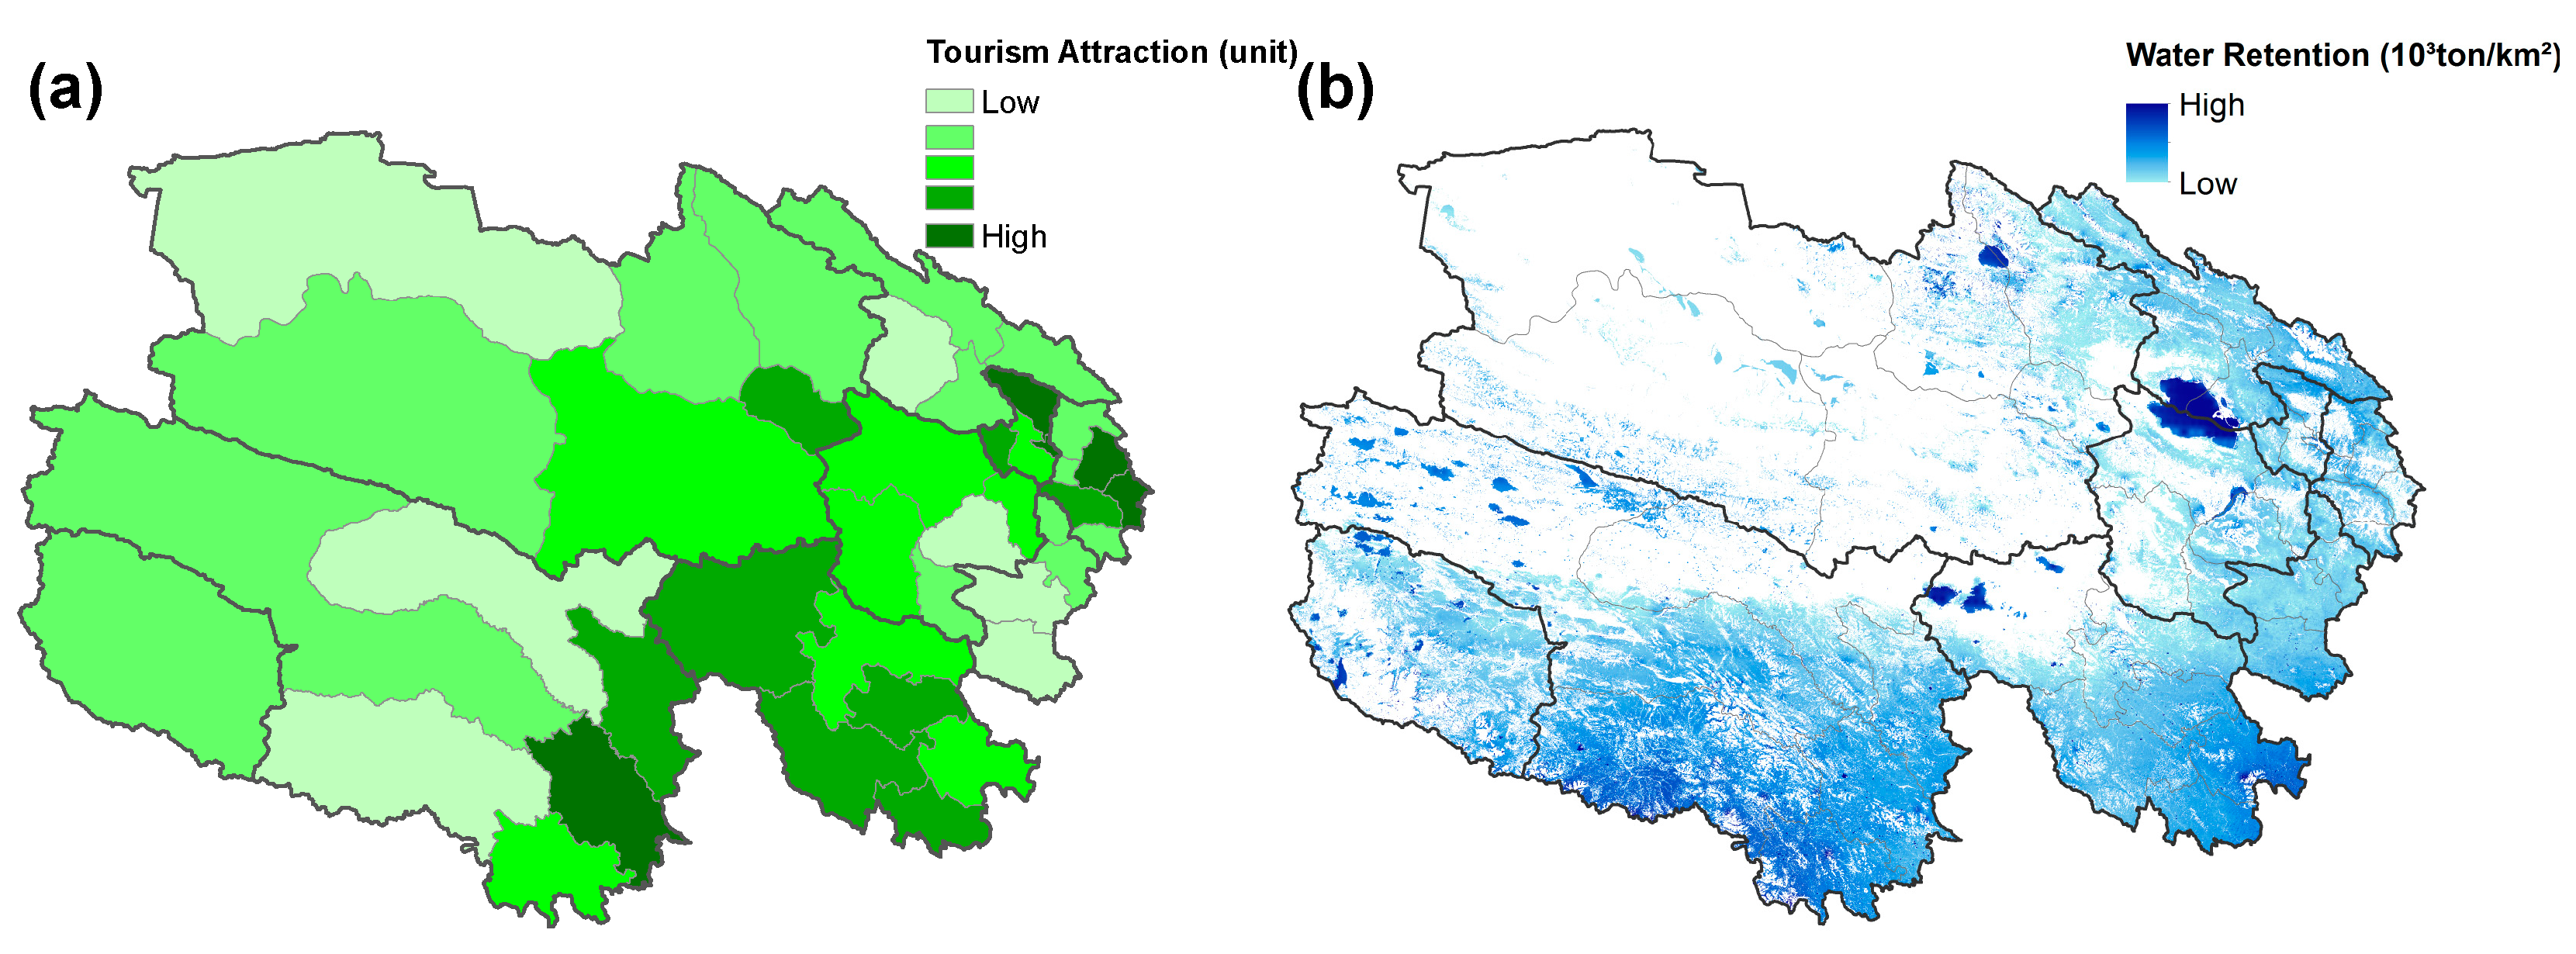
2.5.2. Water Retention

We collected data on annual water retention in Qinghai Province from 2000 to 2014 [59]. To examine the spatial distribution of water retention, we also obtained the spatial measures of water retention from Ouyang et al. [60]. They modeled water retention by revising the Integrated Valuation of Ecosystem Services and Tradeoffs (InVEST) model [60]. In 2000 and 2010, they estimated water retention using precipitation, storm runoff, and evapotranspiration based on land cover types. The water retention was estimated at the resolution of 90 m by 90 m [60].

2.5.3. Carbon Sequestration

Carbon sequestration is the process of carbon captured by terrestrial ecosystems (e.g., photosynthesis) [61]. We used net primary production (NPP) as a proxy of carbon sequestration, because NPP measures the amounts of carbon absorbed via photosynthesis and fixed as plant biomass [62,63]. Specifically, NPP is calculated by subtracting the amounts of carbon dioxide during vegetation photosynthesis from those of vegetation release during respiration [64]. The Moderate Resolution Imaging Spectroradiometer (MODIS) NPP product is made up of annual composites of a 500 m by 500 m resolution (MOD17A3H) from 2000 to 2014. This product is derived from the MODIS on National Aeronautics Space Administration (NASA)’s Terra satellite. MODIS net primary production was obtained from NASA’s Reverb Echo portal (http://reverb.echo.nasa.gov).

2.5.4. Tourism Attractions

Data regarding the number of tourism attractions that represents the supply of nature-based tourism were collected from the Qinghai statistical yearbook. The statistical yearbook provided the lists of tourism attractions from 2008 to 2014 [49]. We summed the number of tourism attractions for each county. These attractions were represented as cultural and/or natural attractions.

2.6. Effect Analysis

In effect analysis, we estimated the annual tourist food and water consumption over the 15-year period from 2000 to 2014 in Qinghai Province. Our assumption was that per tourist food and water consumption would be the same as per capita food and water consumption by local residents, because most tourists follow local food and lifestyle conventions [39,65]. We used annual visitation numbers for estimating tourist food and water consumption.
First, we collected data about per capita crop and livestock consumption by local residents from 2000 to 2014 [49]. Crop consumption included vegetable and grain consumption, and livestock consumption included meat, milk, and egg consumption.
Second, data on water use for residents were obtained from 2000 to 2014 (except for 2001–2002, when there were missing data) [59]. Water use in tourism is divided into direct (e.g., water use in rooms) and indirect water use (e.g., the construction of tourism infrastructures) [66]. This research focused on direct water use in accommodations such as shower, toilet flush, and drinking water.
Finally, we built scenarios with different travel durations (one day, three days, five days, and 10 days), because travel durations differed among tourists. Then, by multiplying annual visitation numbers, we estimated total crop, livestock, and water consumption by tourists in Qinghai. To calculate the proportion of consumption by tourists, we divided the amounts of tourist crop, livestock, and water consumption by total crop production, livestock production, and water use in Qinghai Province, respectively. A summary of our methodologies in each telecoupling component is shown in Table 1.

3. Results

3.1. Agents and Flows

Visitation numbers, tourism agencies, and local residents increased from 2000 to 2014 (Table 2). The number of domestic tourists increased sixfold over the period, while international tourists have doubled. Domestic tourists accounted for approximately 99% of total tourists, and international tourists accounted for less than 1%. In 2000 and 2014, the per capita expenditure of international tourists (1687.5 yuan in 2000 and 3846.2 yuan in 2014, one USD = 6.9 yuan as of October 2018) was twofold and threefold larger than those of domestic tourists (314.8 yuan in 2000 and 999.8 yuan in 2014), respectively. Specifically, international tourists came from all continents, except Africa and South America (Figure 3a). Domestic tourists were mainly from surrounding provinces and high-income eastern provinces (Figure 3b). With the increase of visitation numbers, the number of tourism agencies and hotels also increased twofold and eightfold from 2000 to 2014, respectively (Table 2). During the same period, Qinghai Province experienced rapid urbanization as its urban population increased by 104%. In Qinghai Province, the total population increased by 21%, and the rural population decreased by 12%.

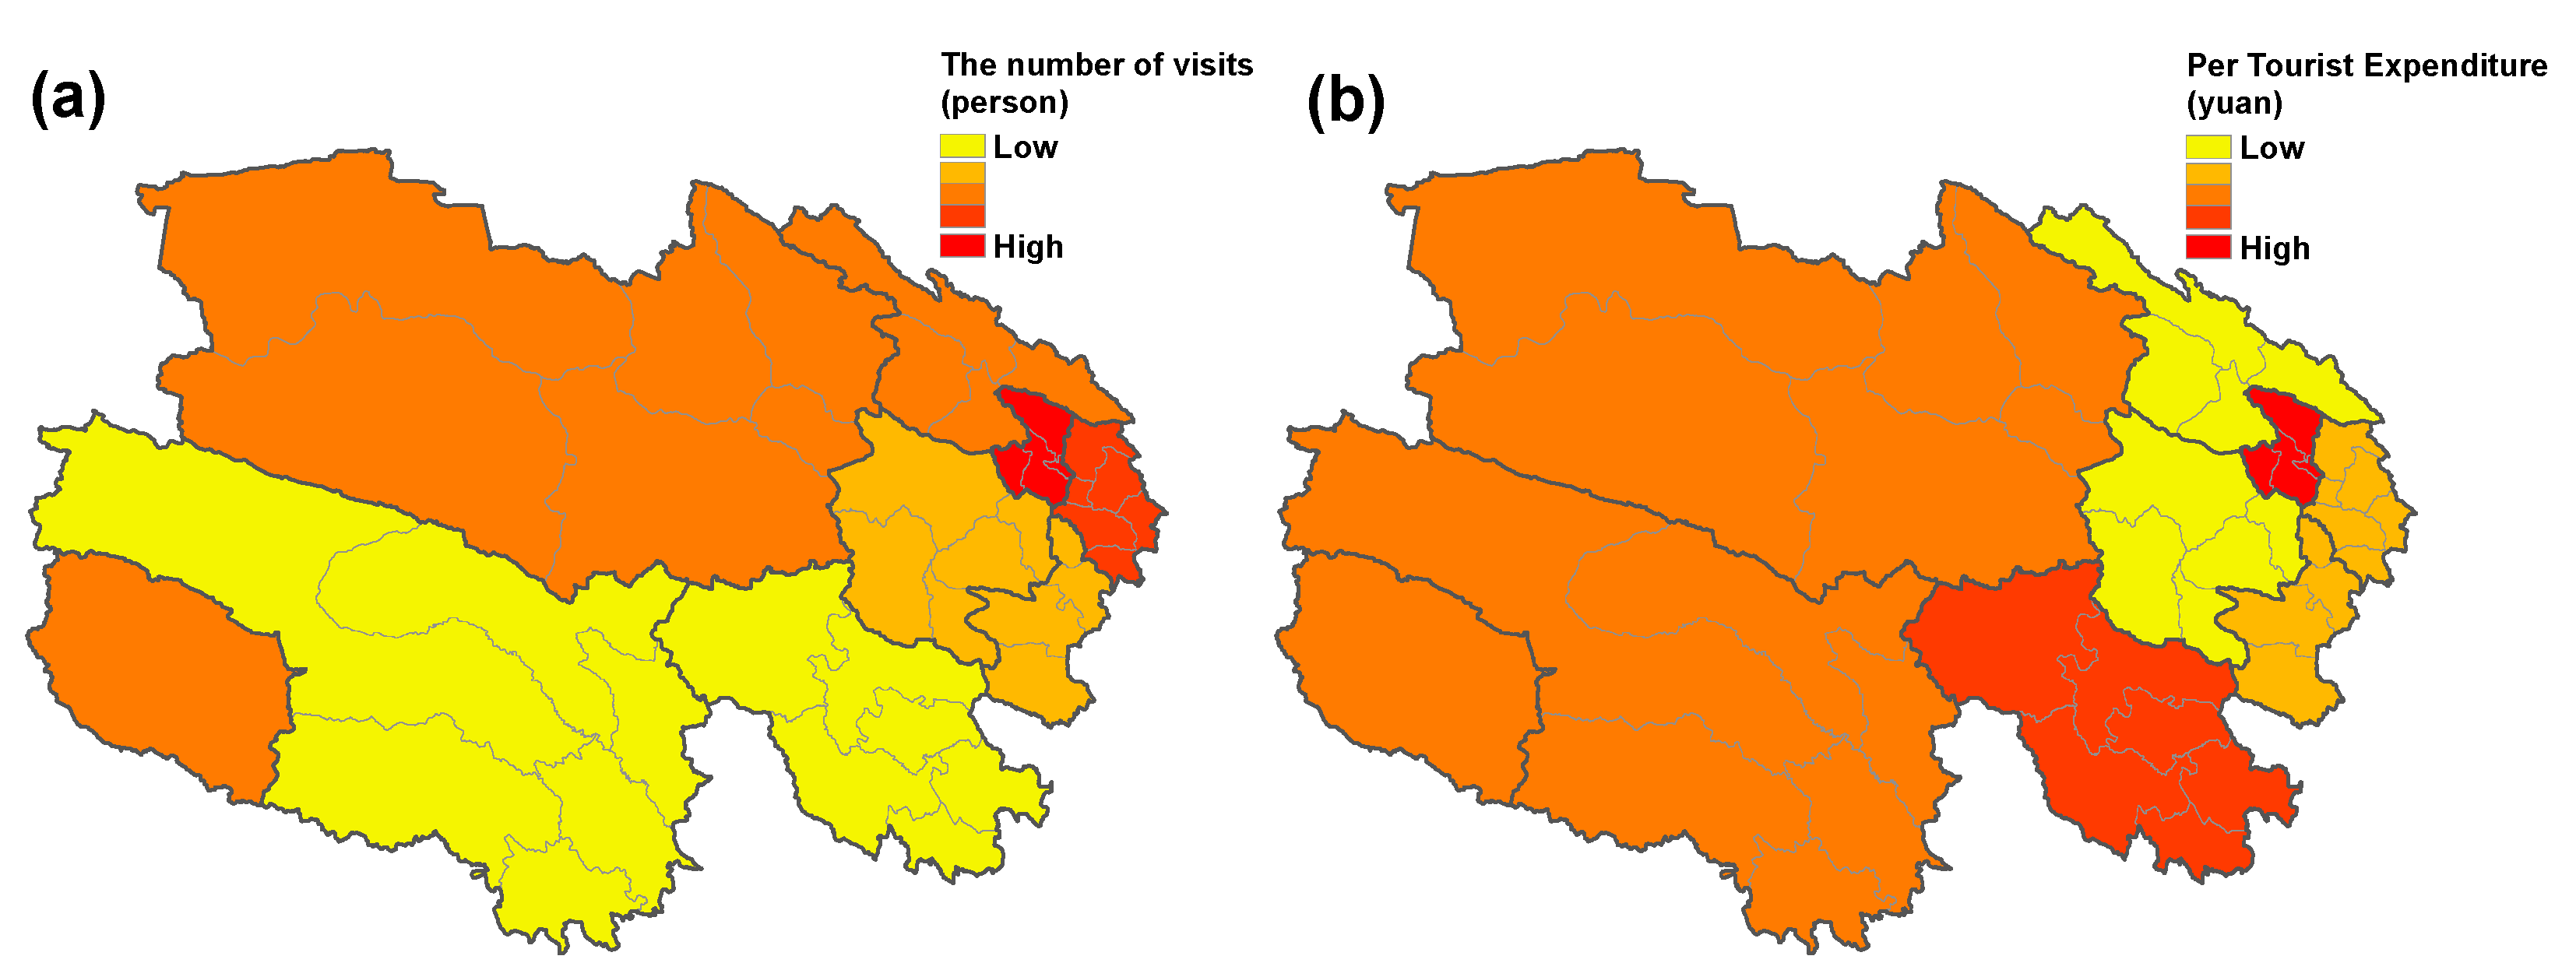
3.2. Factors Affecting Qinghai Tourism Demand

Both visitation numbers and their expenditures—the demand for nature-based tourism—had positive associations with the number of tourism attractions—the supply of nature-based tourism (Table 3). The increased demand for Qinghai tourism had a positive relationship with rapid tourism development. The number of tourism attractions increased threefold from 2008 to 2014 (Figure A1 and Figure A2). With an insignificant Moran’s I (p > 0.05), the development areas of tourism attractions were not clustered in specific areas; instead, they were distributed across Qinghai Province.
Expenditure per tourist was positively associated with GDP per capita at a prefecture level (Table 3, p < 0.05). Additionally, the lower percentage of GDP from construction tended to have higher expenditure per tourist. Spatial distributions differed between visitation numbers and their expenditures (Figure A3). The northern Qinghai region attracted more tourists than the southern region, but the southern Qinghai (e.g., Golog prefecture) region had higher expenditure per tourist than the northern region. Overall, Xining city had both the highest tourist numbers and per tourist expenditures.
Additionally, the number of tourism attractions was interrelated with other ES supply. Principal component analysis (PCA) showed that the first two principal components accounted for 68.7% of the total ES variation (Figure 4). The first principal component accounted for 43.7% of the variation in ES. This component changed along with crop production, livestock production, and carbon sequestration as types of spatial interaction. The second principal component accounted for an additional 25% of the variation in ES, and represented high water retention and tourism attraction. Tourism attraction and water retention varied together and formed a spatial interaction. This PCA result indicated that counties with high water retention tended to have more tourism attractions, while counties with higher crop and livestock production tended to have higher carbon sequestration. Crop and livestock production did not have a spatial interaction with tourism attraction sites (Figure 4). Spatially, the southern Qinghai region is protected by the Sanjiangyuan National Park, and had both high water retention and tourism attractions (Figure A4).

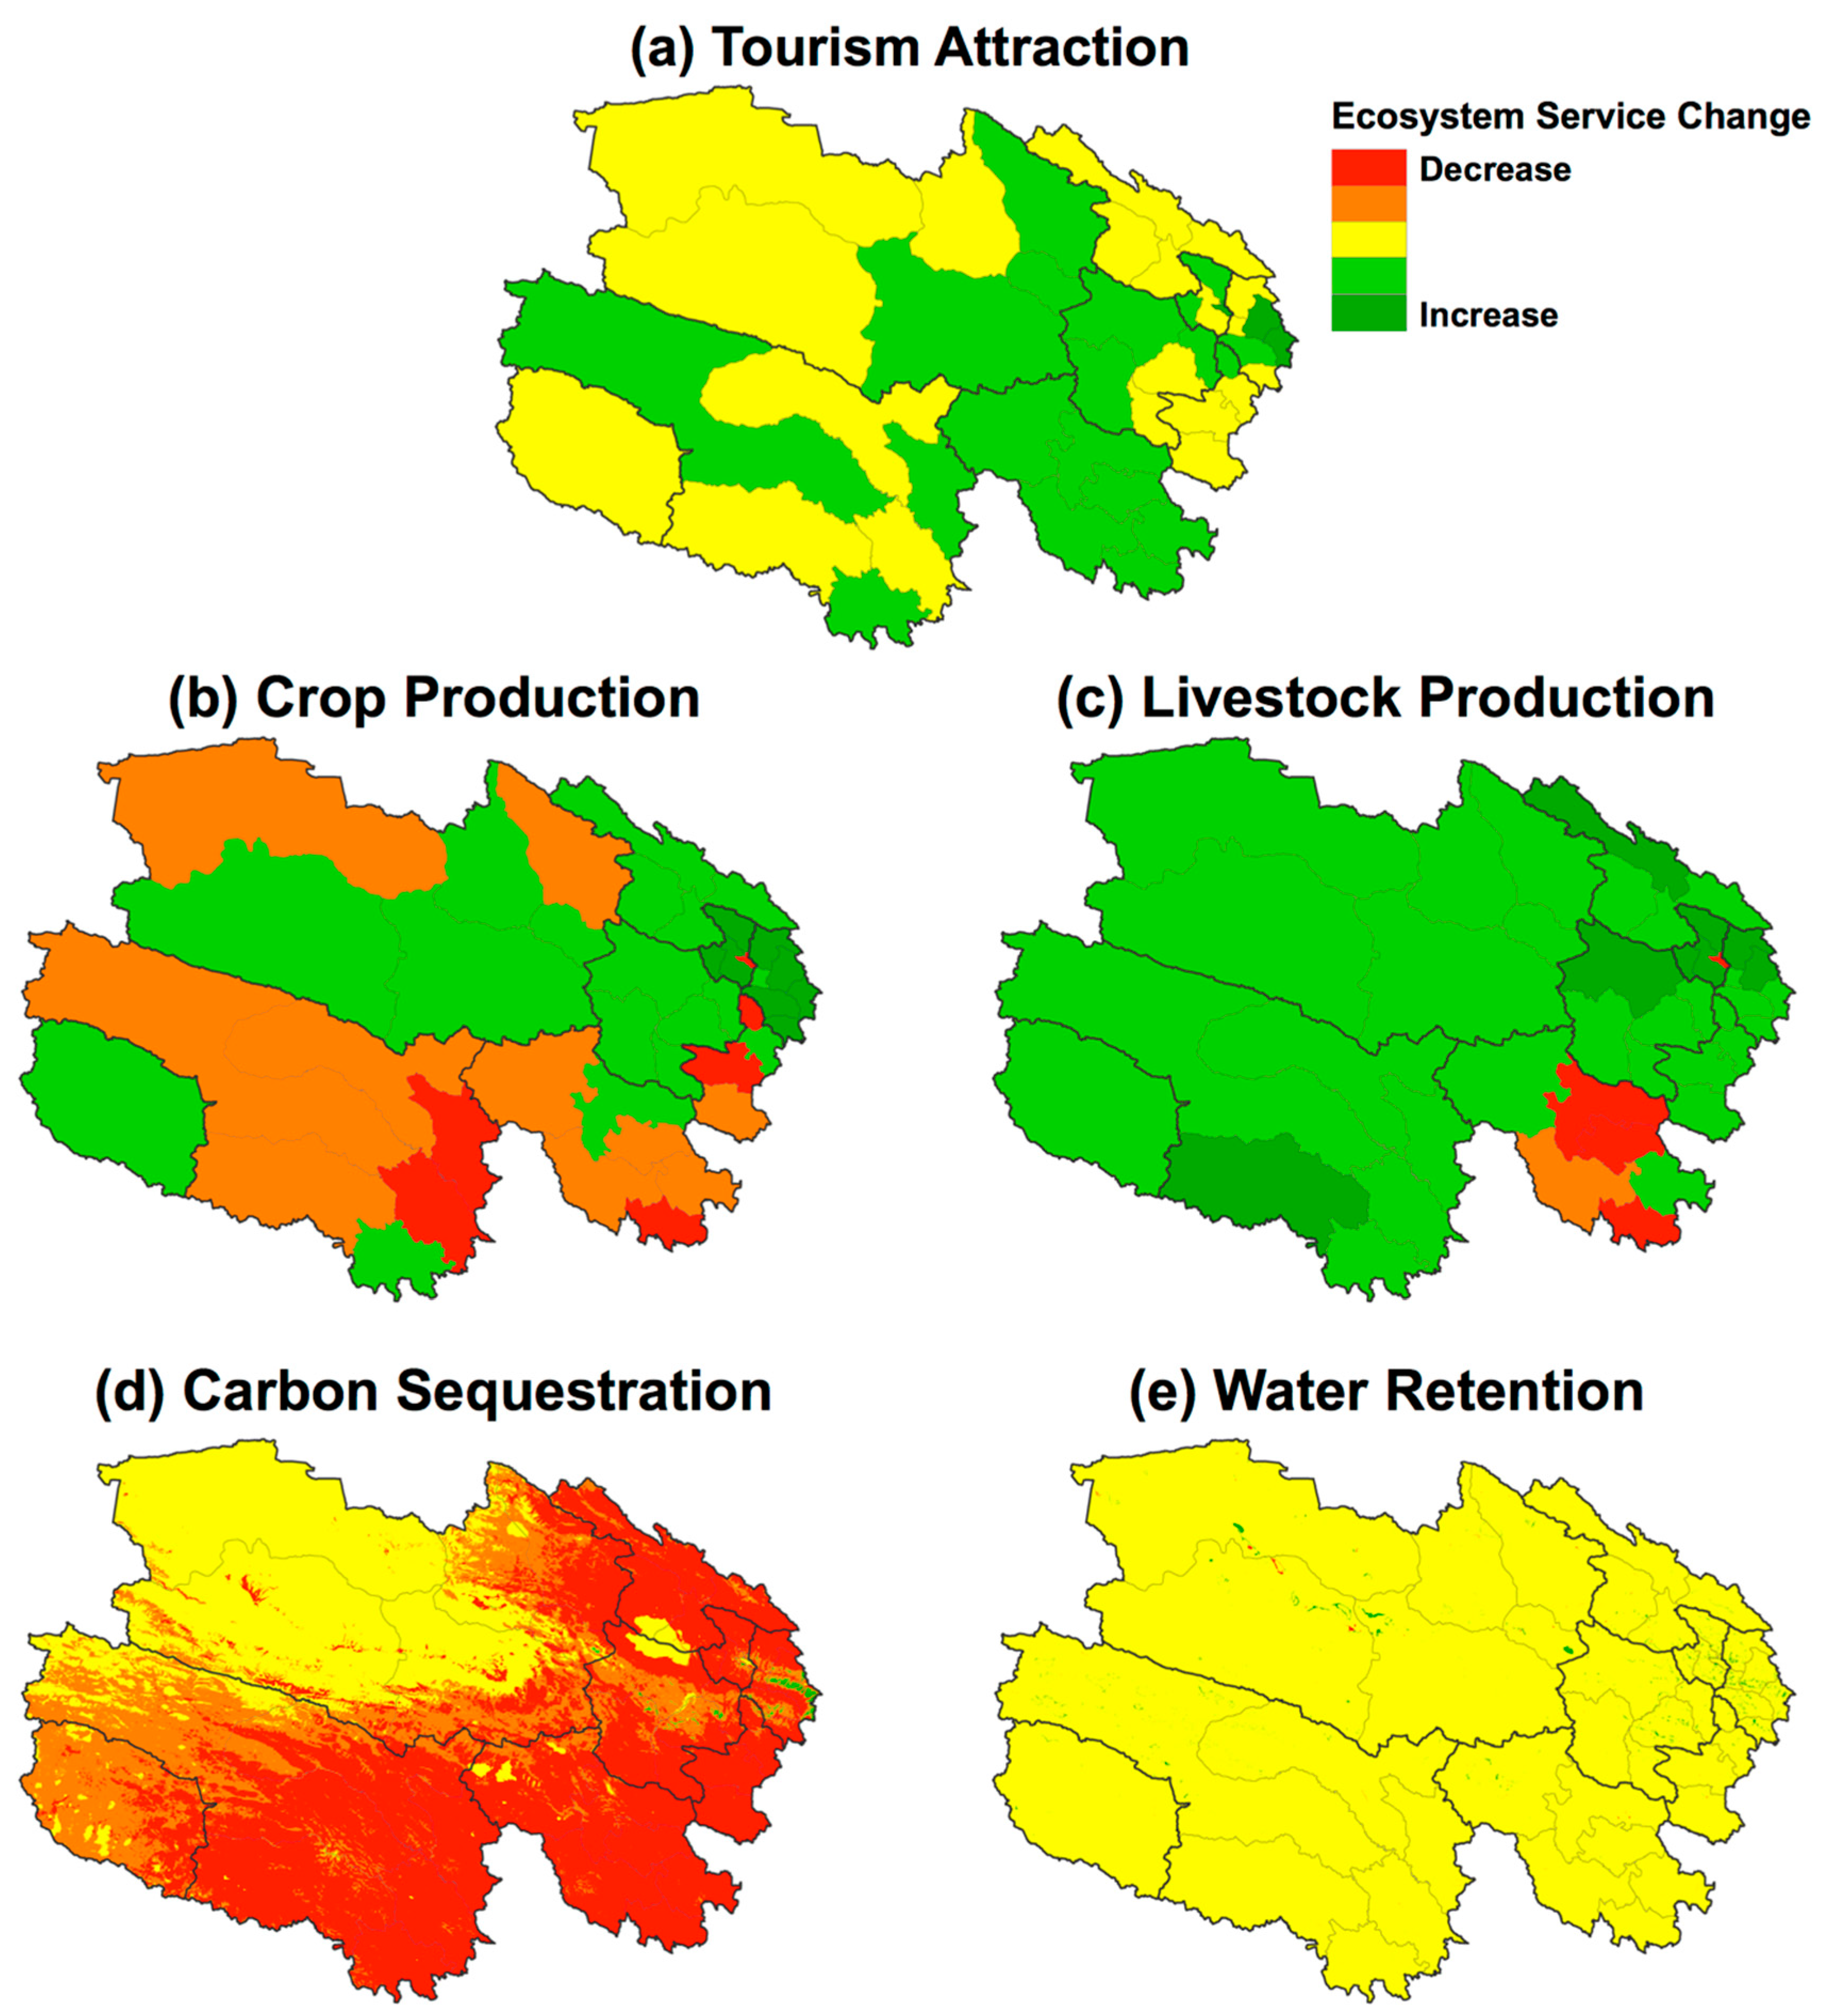
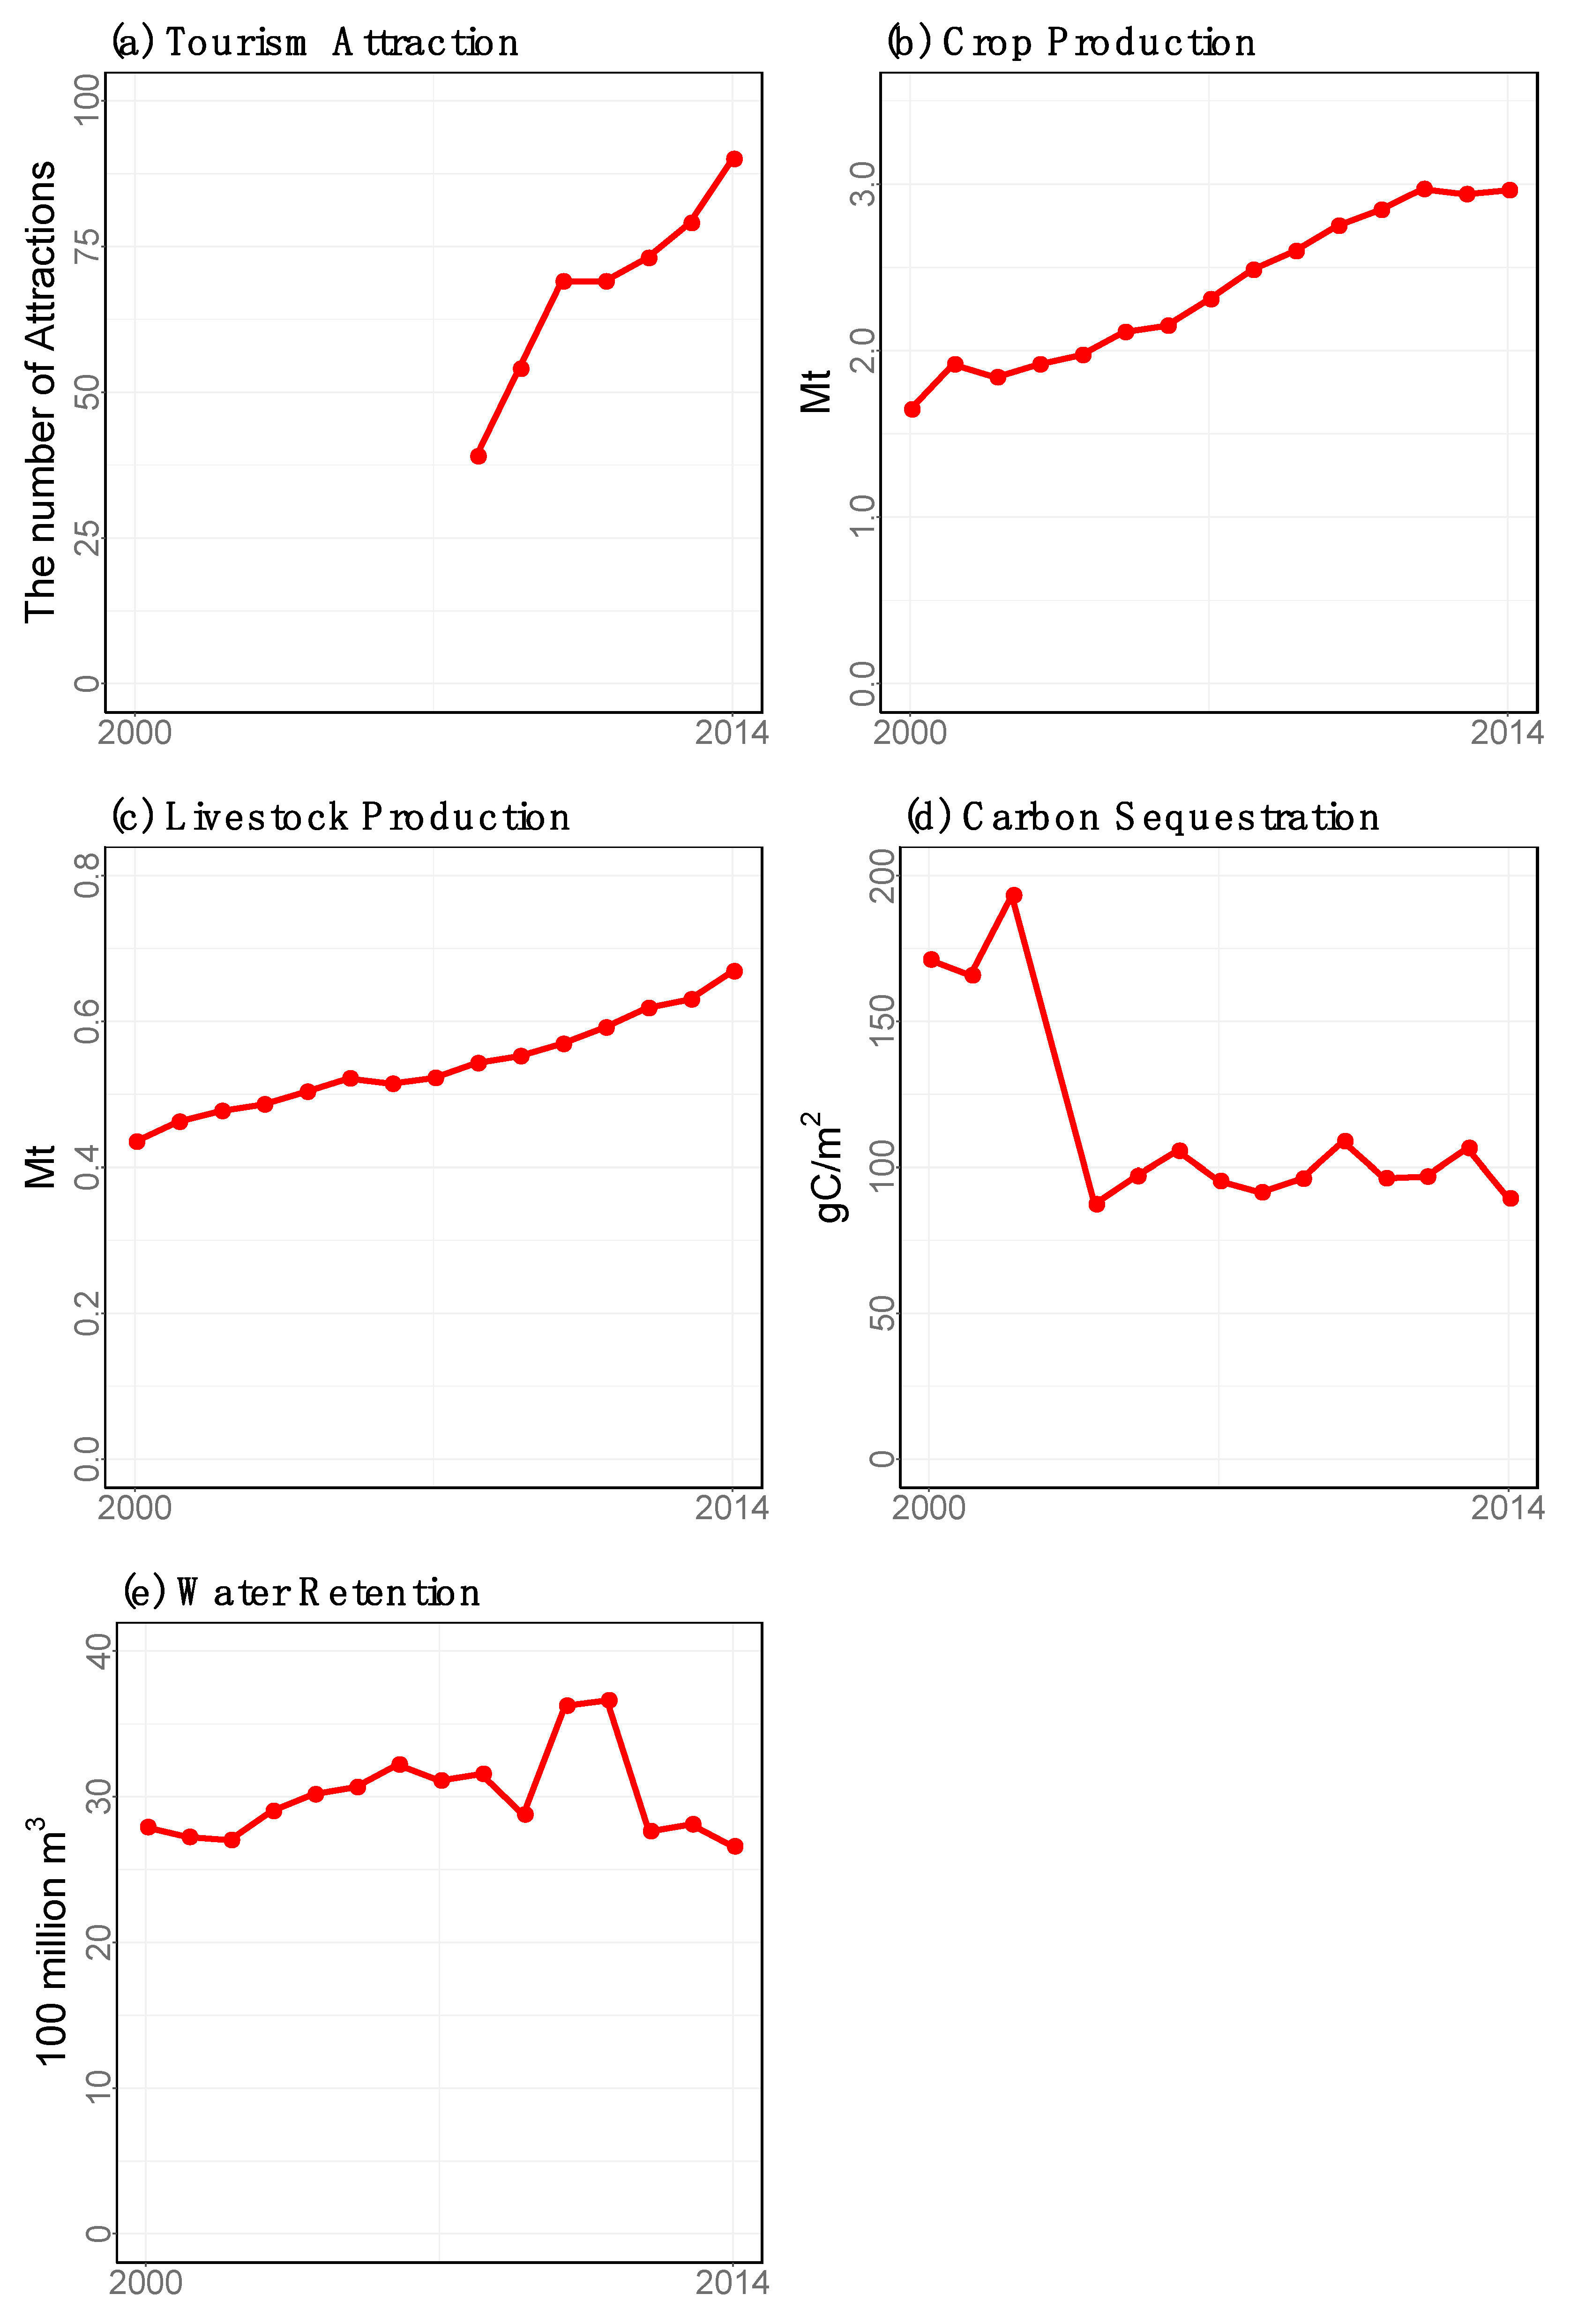
3.3. Environmental and Economic Effects

Tourism became an important industry in the Qinghai economy. First, tourism earnings increased 20-fold from 2000 to 2014, and accounted for approximately 9% of Qinghai’s GDP in 2014 (Figure 5a). Regarding flows and agents, the number of tourism agencies and hotels escalated over time, and this escalation led to more employment in the tourism industry. The increased tourism earnings contributed to income growth in Qinghai Province.
Second, the total tourist consumption of crop and livestock products in 2014 was threefold and fourfold higher than those in 2000, respectively. From 2000 to 2014, crop consumption per tourist changed between 0.43–0.58 kg/day, while livestock consumption per tourist changed between 0.14–0.19 kg/day. Tourists with longer stays consumed more crop and livestock production (Figure 5b,c).
Third, tourist water consumption increased fourfold from 2000 to 2014. Over the 15-year period, per tourist water consumption in accommodation changed between 59.1–89.3 L/day. Tourists with longer stays consumed more water (Figure 5d,e). The water consumption accounted for approximately 5% of the total residential water use in Qinghai Province (Figure 5d). As residential water use accounted for 10% of total water use (Figure A5), tourist water consumption accounted for less than 1% of total water use in Qinghai Province (Figure 5e).

4. Discussion and Conclusions

4.1. Complex Interrelationships among Tourism Demand, the Environment, and the Economy

Nature-based tourism is a telecoupling process that can influence multiple ES supplies, the environment, and the economy. With the general conceptual model, this study investigated the complex interrelationships of nature-based tourism demand with multiple ES supplies as well as the environment and economy in Qinghai Province. By identifying five interrelated components systematically, our results can provide scientific knowledge for distant interrelationships. The results demonstrated that distant tourism demand led to an increase in the number of tourism attractions and facilities in Qinghai Province (Table 2 and Figure A2). Qinghai tourism, which draws mainly from domestic areas, contributed to local income growth, along with more employment in the tourism industry. More local people have participated in tourism industries to receive direct and indirect benefits, including working temporarily on infrastructure construction and selling local agricultural products to tourists [65]. Additionally, from 2000 to 2014, those increased tourists consumed twofold, threefold, and fourfold more crop, livestock, and water, respectively. The consumption accounted for approximately 2% of the total food production and less than 1% of the total water use in Qinghai Province. Our findings are consistent with global tourism studies. Worldwide, food consumption in tourism is less than 1% of global food production [15,68], and direct water use in tourism is less than 1% of global water consumption [66].
In Qinghai tourism, visitation numbers and their expenditures had different determinants (Table 3). On the one hand, both visitation numbers and their expenditures are positively associated with the number of tourism attractions. These results are consistent with previous studies that showed that destination attractions such as natural scenery and cultural heritage play an important role in tourist flows [6,51,52]. On the other hand, more expenditure per tourist was significantly associated with higher per capita GDP and a lower percentage of GDP from construction, while visitation numbers were not. Tourists tended to spend more money in high-income areas because they provided more spending opportunities [54,55,56].
Contrary to expectations, the percentage of GDP from construction had a negative association with expenditure per tourist. The negative association may be due to spatial differences of tourist spending across regions. Our findings indicated that the southern Qinghai region (e.g., Golog prefecture) had higher expenditure per tourist than the northern Qinghai region (Figure A3). The southern Qinghai region is protected by the Sanjiangyuan National Park, and has a lower percentage of GDP from construction than the northern Qinghai region. In other words, the southern Qinghai has comparatively little construction, because it is an area protected for conservation. In addition, as the southern Qinghai has more tourism attractions than the northern Qinghai (Figure A4), each tourist has more opportunities to spend money on admission fees and souvenirs in the southern region. For example, only 3% of the GDP from Golog Prefecture came from construction in 2014, but tourists in Golog Prefecture may spend more money to purchase expensive local products such as dried beef.

4.2. Management Implications

Our general conceptual model enables a broad understanding of how to maintain the balance between ecosystem conservation and tourism development. Among five ES supplies, water retention has a spatial interaction with the number of tourism attractions. This result matched with previous research that showed that regulating ES plays an important role in maintaining provisions and cultural ES sustainably under increasing demands over long distances [37,69,70]. In fact, many tourism attractions in Qinghai Province are located in water source areas (Figure A4). Spatially, the southern Qinghai region protected by the Sanjiangyuan National Park has various tourism attractions, and is critical for water retention (Figure 1 and Figure A4). Since the Sanjiangyuan region had a high expenditure per tourist, the spatial interactions between water retention and tourism attractions may stimulate the development of tourism facilities to increase the economic benefits. Without adaptable management practices in place for tourism, rapid tourism development may cause the Sanjiangyuan region to face the unexpected degradation of its water-retention ability. With increased tourism development, distant water demand from eastern provinces in China may also exacerbate water quantity and quality in Qinghai Province, which is one of the western provinces. To mitigate the lack of water supply in eastern provinces, fresh water increasingly flows or transports from the western provinces, which have low urbanization and income levels, to the eastern provinces, which have largely urbanized population and high-income levels [5,71]. These water flows provoke water stress in the western provinces [71].
In the Sanjiangyuan region, two management systems (protected areas and payment for ecosystem services) have an opportunity to balance ecosystem conservation with tourism development. First, in 2015, the Sanjiangyuan National Park became the first Chinese national park to effectively conserve water, natural grassland, and wetland [47]. However, the Sanjiangyuan National Park has not mitigated the negative effects of the rapid tourism development. The management practices of the Sanjiangyuan National Park would have to prevent the spread of invasive species in tourism hotspots and the degradation of conservation targets by the construction of tourism infrastructures [22].
Second, in the Sanjiangyuan region, Qinghai Province has been implementing a “retire livestock and restore grassland” (tuimu huancao) program as payments for ecosystem services since 2003 [72,73]. Although the current program provides some benefits to restore degraded grasslands from livestock grazing [74,75], this program may not work in regard to balancing ecosystem conservation and tourism development. Our findings supported that there were no significant spatial interactions between tourism attraction sites and livestock production that have a positive relationship with grassland (Figure 4). The “retire livestock and restore grassland” program in the Sanjiangyuan region has also integrated with the “ecological migration” program (shengtai yimin) that moves herders from the grasslands to towns [76,77,78]. Consequently, crop and livestock production decreased from 2000 to 2014 in the core area of the Sanjiangyuan National Park (Figure A1b,c). However, the ecological migration may reduce the herders’ standard of living because of small government subsidies for resettlement and the herders’ lack of skills to earn an income in the towns [79,80]. Therefore, future programs need to work to improve both grassland health and local livelihoods. The future plans that encourage herders to participate in tourism activities can overcome the problems of ecological migration by diversifying economic activities for local income [81]. As more tourism agencies and hotels led to more employment in the Qinghai tourism industry (Table 2), herders can provide a substantial labor force (e.g., working in tourism hotels or agencies, or selling souvenirs or local products to tourists) [65].

4.3. Research Limitations and Future Studies

Although our study examined the complex interrelationships of distant tourism demands with multiple ES supplies as well as the environment and economy in Qinghai Province, we point out the limitations of this study due to data availability. First, we lack data for a detailed understanding of various types of tourism supply and demand. The interrelationships between tourism supply and demand are complex, and it may be challenging to examine the interrelationships using the available statistical dataset [66,82]. Therefore, future research needs to consider various aspects of the structure of the Qinghai tourism industry (e.g., budgets for tourist infrastructure, accommodations, and transportation systems). The future research can examine more dynamic interactions between tourism supply and demand.
Furthermore, there may be seasonal changes to Qinghai tourism supply and demand. Qinghai tourism demand is tremendously high in summer because of the comfortable low temperatures and humidity for vacations [40,48]. Since the Qinghai statistical yearbook that was used for our effect analyses does not provide data on monthly tourism changes, the environmental effects may be underestimated in the summer. Especially during the summer, the growing number of tourists may accelerate total food and water consumption and have a greater impact on the environment. The availability of tourism attractions as well as the amount of water retention may also change with the season [40,82]. Future research would have to determine the seasonal changes of tourism supply and its relationship with distant tourism demand [5,83]. Identifying the seasonal changes of the interconnections helps manage the supply ability of multiple ES simultaneously [7,21].
Finally, this study assumed that tourists consume the same food and water as local people. This assumption is based on domestic Chinese tourists, who make up 99% of Qinghai tourism. However, tourists may consume more food and water than the local people in Qinghai Province [15,84]. Additionally, per tourist environmental impact may differ between different tourism destinations and lifestyle consumption variables [85,86]. In order to have precise estimations, further work is required to perform not only tourist interviews regarding travel duration, but also field works in tourism attractions. Tourist interviews and surveys could provide relevant information for precise estimates of per tourist food and water consumption. The interviews and surveys would also benefit investigating how many tourists are coming for other purposes (e.g., business or scientific field survey). With the tourist interviews, field works for measuring biodiversity metrics (e.g., species richness, evenness, and abundance) help examine the impacts of tourist visitations on biodiversity in tourism attractions [87,88].
Despite the limitations of our study, we here took the first step to examine the complex interrelationships with the general conceptual model. This study provides a basis for identifying the interrelationships of distant tourism demand with multiple ES supplies, the environment, and the economy. Our findings suggest that new management plans are needed to minimize the negative impacts of the demands from tourists, and preserve the Sanjiangyuan region, which supports both the environment and the economy. Armed with our conceptual framework, decision-makers can establish new management plans to balance ecosystem conservation and tourism development and achieve Sustainable Development Goals. It is our hope that this approach and these findings are applicable to many other regions worldwide that experience nature-based tourism.

Author Contributions

M.G.C. and T.P. analyzed the model and drafted the manuscript. M.G.C., T.P., X.Z., and J.L. conceived of the study and revised the manuscript. All authors reviewed the manuscript.

Funding

This research was funded by the National Science Foundation, NASA, Environmental Science and Policy Program at Michigan State University, Sustainable Michigan Endowment Project, Michigan AgBioResearch, National Natural Science Foundation of China [Grant No. 41671107 and 41671037], and the Youth Innovation Promotion Association, CAS [Grant No. 2016049].

Acknowledgments

We are grateful to Sue Nichols and Yingying Yao for their helpful comments on an earlier draft.

Conflicts of Interest

The authors declare that they have no competing interests.

Appendix A. Ecosystem Services Quantification

The number of tourism attractions increased threefold from 2008 to 2014 (Figure A1a). Crop and livestock production increased from 2000 to 2014, whereas carbon sequestration decreased during this period (Figure A2b–d). Water retention has not changed between 2000 and 2014 (Figure A2e). The changes of crop production, livestock production, and carbon sequestration were spatially clustered (p < 0.05, Figure A1). Water retention did not change.
Figure A1. Spatial distributions of ecosystem service change in Qinghai Province. (a) Tourism attractions from 2008 to 2014. (b) Crop production from 2000 to 2014. (c) Livestock production from 2000 to 2014. (d) Carbon sequestration from 2000 to 2014. (e) Water retention from 2000 to 2010.
Sustainability 10 04576 g0a1
Figure A2. Ecosystem service changes over time in Qinghai Province. (a) Tourism attractions from 2008 to 2014. (b) Crop production from 2000 to 2014. (c) Livestock production from 2000 to 2014. (d) Carbon sequestration from 2000 to 2014. (e) Water retention from 2000 to 2014.
Sustainability 10 04576 g0a2

Appendix B. Qinghai Tourism

Figure A3. Spatial distributions of (a) visitation numbers and (b) per tourist expenditures from 2010 to 2014.
Sustainability 10 04576 g0a3
Figure A4. Spatial distribution of (a) the number of tourism attractions in 2014 and (b) water retention in 2010.
Sustainability 10 04576 g0a4
Figure A5. Water uses by sectors in Qinghai Province.
Sustainability 10 04576 g0a5

References

  1. Liu, J.; Dietz, T.; Carpenter, S.R.; Folke, C.; Alberti, M.; Redman, C.L.; Schneider, S.H.; Ostrom, E.; Pell, A.N.; Lubchenco, J.; et al. Complexity of coupled human and natural systems. Science 2007, 36, 639–649. [Google Scholar] [CrossRef] [PubMed]
  2. Burkhard, B.; Kroll, F.; Nedkov, S.; Müller, F. Mapping ecosystem service supply, demand and budgets. Ecol. Indic. 2012, 21, 17–29. [Google Scholar] [CrossRef]
  3. Bagstad, K.J.; Johnson, G.W.; Voigt, B.; Villa, F. Spatial dynamics of ecosystem service flows: A comprehensive approach to quantifying actual services. Ecosyst. Serv. 2013, 4, 117–125. [Google Scholar] [CrossRef]
  4. Guo, Z.; Zhang, L.; Li, Y. Increased dependence of humans on ecosystem services and biodiversity. PLoS ONE 2010, 5, e13113. [Google Scholar] [CrossRef] [PubMed]
  5. Liu, J.; Yang, W.; Li, S. Framing ecosystem services in the telecoupled Anthropocene. Front. Ecol. Environ. 2016, 14, 27–36. [Google Scholar] [CrossRef]
  6. Chung, M.G.; Dietz, T.; Liu, J. Global relationships between biodiversity and nature-based tourism in protected areas. Ecosyst. Serv. 2018, 34, 11–23. [Google Scholar] [CrossRef]
  7. Burkhard, B.; Kandziora, M.; Hou, Y.; Müller, F. Ecosystem service potentials, flows and demands-concepts for spatial localisation, indication and quantification. Landsc. Online 2014, 34, 1–32. [Google Scholar] [CrossRef]
  8. Wei, H.; Fan, W.; Wang, X.; Lu, N.; Dong, X.; Zhao, Y.; Ya, X.; Zhao, Y. Integrating supply and social demand in ecosystem services assessment: A review. Ecosyst. Serv. 2017, 25, 15–27. [Google Scholar] [CrossRef]
  9. Bagstad, K.J.; Villa, F.; Batker, D.; Harrison-Cox, J.; Voigt, B.; Johnson, G.W. From theoretical to actual ecosystem services: Mapping beneficiaries and spatial flows in ecosystem service assessments. Ecol. Soc. 2014, 19. [Google Scholar] [CrossRef]
  10. Liu, J.; Mooney, H.; Hull, V.; Davis, S.J.; Gaskell, J.; Hertel, T.; Lubchenco, J.; Seto, K.C.; Gleick, P.; Kremen, C.; et al. Systems integration for global sustainability. Science 2015, 347, 1258832. [Google Scholar] [CrossRef]
  11. Liu, J.; Hull, V.; Batistella, M.; de Fries, R.; Dietz, T.; Fu, F.; Hertel, T.W.; Izaurralde, R.C.; Lambin, E.F.; Li, S.; et al. Framing sustainability in a telecoupled world. Ecol. Soc. 2013, 18, 26. [Google Scholar] [CrossRef]
  12. Boillat, S.; Gerber, J.-D.; Oberlack, C.; Zaehringer, G.J.; Ifejika Speranza, C.; Rist, S. Distant interactions, power, and environmental justice in protected area governance: A telecoupling perspective. Sustainability 2018, 10, 3954. [Google Scholar] [CrossRef]
  13. United Nations. Sustainable Development Goals. Available online: http://www.un.org/sustainabledevelopment/sustainable-development-goals (accessed on 13 November 2018).
  14. IUCN and WCPA. Tourism and Protected Areas Specialist Group Strategy 2015–2020. Available online: https://www.iucn.org/theme/protected-areas/wcpa/what-we-do/tourism-tapas (accessed on 13 November 2018).
  15. Gössling, S.; Peeters, P. Assessing tourism’s global environmental impact 1900–2050. J. Sustain. Tour. 2015, 23, 639–659. [Google Scholar] [CrossRef]
  16. Lenzen, M.; Sun, Y.-Y.; Faturay, F.; Ting, Y.-P.; Geschke, A.; Malik, A. The carbon footprint of global tourism. Nat. Clim. Chang. 2018, 8, 522–528. [Google Scholar] [CrossRef]
  17. World Travel and Tourism Council. Travel and Tourism Economic Impact 2018-World. Available online: https://www.wttc.org/economic-impact/country-analysis/regional-reports (accessed on 13 November 2018).
  18. Liu, J.; Hull, V.; Luo, J.; Yang, W.; Liu, W.; Viña, A.; Vogt, C.; Xu, Z.; Yang, H.; Zhang, J.; et al. Multiple telecouplings and their complex interrelationships. Ecol. Soc. 2015, 20, 44. [Google Scholar] [CrossRef]
  19. Newsome, D.; Moore, S.A.; Dowling, R.K. Natural Area Tourism: Ecology, Impacts and Management; Channel View Publications: Bristol, UK, 2012; Volume 58. [Google Scholar]
  20. Daniel, T.C.; Muhar, A.; Arnberger, A.; Aznar, O.; Boyd, J.W.; Chan, K.M.A.; Costanza, R.; Elmqvist, T.; Flint, C.G.; Gobster, P.H.; et al. Contributions of cultural services to the ecosystem services agenda. Proc. Natl. Acad. Sci. USA 2012, 109, 8812–8819. [Google Scholar] [CrossRef] [PubMed] [Green Version]
  21. Chung, M.G.; Kang, H.; Choi, S.-U. Assessment of coastal ecosystem services for conservation strategies in South Korea. PLoS ONE 2015, 10, e0133856. [Google Scholar] [CrossRef] [PubMed]
  22. Zhong, L.; Buckley, R.C.; Wardle, C.; Wang, L. Environmental and visitor management in a thousand protected areas in China. Boil. Conserv. 2015, 181, 219–225. [Google Scholar] [CrossRef] [Green Version]
  23. Peng, B.; Song, H.; Crouch, G.I. A meta-analysis of international tourism demand forecasting and implications for practice. Tour. Manag. 2014, 45, 181–193. [Google Scholar] [CrossRef]
  24. Balmford, A.; Green, J.M.H.; Anderson, M.; Beresford, J.; Huang, C.; Naidoo, R.; Walpole, M.; Manica, A. Walk on the wild side: Estimating the global magnitude of visits to protected areas. PLoS Biol. 2015, 13, e1002074. [Google Scholar] [CrossRef]
  25. Sun, J.; Mooney, H.; Wu, W.; Tang, H.; Tong, Y.; Xu, Z.; Huang, B.; Cheng, Y.; Yang, X.; Wei, D.; et al. Importing food damages domestic environment: Evidence from global soybean trade. Proc. Natl. Acad. Sci. USA 2018. [Google Scholar] [CrossRef] [PubMed]
  26. Torres, A.; Brandt, J.; Lear, K.; Liu, J. A looming tragedy of the sand commons. Science 2017, 357, 970–971. [Google Scholar] [CrossRef] [PubMed]
  27. Liu, J. Forest sustainability in China and implications for a telecoupled world. Asia Pac. Policy Stud. 2014, 1, 230–250. [Google Scholar] [CrossRef]
  28. Sun, J.; Tong, Y.; Liu, J. Telecoupled land-use changes in distant countries. J. Integr. Agric. 2017, 16, 368–376. [Google Scholar] [CrossRef]
  29. Hulina, J.; Bocetti, C.; Campa, H., III; Hull, V.; Yang, W.; Liu, J. Telecoupling framework for research on migratory species in the Anthropocene. Elem. Sci. Anthr. 2017, 5, 5. [Google Scholar] [CrossRef]
  30. Yang, W.; Hyndman, D.W.; Winkler, J.A.; Viña, A.; Deines, J.M.; Lupi, F.; Luo, L.; Li, Y.; Basso, B.; Zheng, C.; et al. Urban water sustainability: Framework and application. Ecol. Soc. 2016, 21. [Google Scholar] [CrossRef]
  31. Liu, J.; Yang, W. Integrated assessments of payments for ecosystem services programs. Proc. Natl. Acad. Sci. USA 2013, 110, 16297–16298. [Google Scholar] [CrossRef] [Green Version]
  32. Gasparri, N.I.; Kuemmerle, T.; Meyfroidt, P.; de Waroux, Y.L.; Kreft, H. The emerging soybean production frontier in Southern Africa: Conservation challenges and the role of South-South telecouplings. Conserv. Lett. 2016, 9, 21–31. [Google Scholar] [CrossRef]
  33. Carlson, A.K.; Taylor, W.W.; Liu, J.; Orlic, I. Peruvian anchoveta as a telecoupled fisheries system. Ecol. Soc. 2018, 23. [Google Scholar] [CrossRef]
  34. McKinney, L.A. Foreign direct investment, development, and overshoot. Soc. Sci. Res. 2014, 47, 121–133. [Google Scholar] [CrossRef]
  35. Yang, D.; Cai, J.; Hull, V.; Wang, K.; Tsang, Y.-P.; Liu, J. New road for telecoupling global prosperity and ecological sustainability. Ecosyst. Health Sustain. 2016, 2, e01242. [Google Scholar] [CrossRef]
  36. Liu, J.; Dou, Y.; Batistella, M.; Challies, E.; Connor, T.; Friis, C.; Millington, J.D.A.; Parish, E.; Romulo, C.L.; Silva, R.F.B.; et al. Spillover systems in a telecoupled Anthropocene: Typology, methods, and governance for global sustainability. Curr. Opin. Environ. Sustain. 2018, 33, 58–69. [Google Scholar] [CrossRef]
  37. Raudsepp-Hearne, C.; Peterson, G.D.; Bennett, E.M. Ecosystem service bundles for analyzing tradeoffs in diverse landscapes. Proc. Natl. Acad. Sci. USA 2010, 107, 5242–5247. [Google Scholar] [CrossRef] [PubMed] [Green Version]
  38. ESRI. ArcGIS Desktop: Release 10.3.1; Environmental Systems Research Institution: Redlands, CA, USA, 2015. [Google Scholar]
  39. Shen, X.; Tan, J. Ecological conservation, cultural preservation, and a bridge between: The journey of Shanshui conservation center in the Sanjiangyuan region, Qinghai-Tibetan Plateau, China. Ecol. Soc. 2012, 17. [Google Scholar] [CrossRef]
  40. Li, R.; Chi, X. Thermal comfort and tourism climate changes in the Qinghai–Tibet Plateau in the last 50 years. Theor. Appl. Climatol. 2014, 117, 613–624. [Google Scholar] [CrossRef]
  41. Su, M.M.; Wall, G. The Qinghai–Tibet railway and Tibetan tourism: Travelers’ perspectives. Tour. Manag. 2009, 30, 650–657. [Google Scholar] [CrossRef]
  42. Zhang, H. The Province Tour in Qinghai Beauty Spot Space Structure and Form Analyze. Master’s Thesis, Qinghai Normal University, Qinghai, China, 2009. (In Chinese). [Google Scholar]
  43. Wang, Y. Research on the Tourism Spatial Structure and Its Optimization in Qinghai Province. Master’s Thesis, Qinghai Normal University, Qinghai, China, 2013. (In Chinese). [Google Scholar]
  44. Fan, J.-W.; Shao, Q.-Q.; Liu, J.-Y.; Wang, J.-B.; Harris, W.; Chen, Z.-Q.; Zhong, H.-P.; Xu, X.-L.; Liu, R.-G. Assessment of effects of climate change and grazing activity on grassland yield in the Three Rivers Headwaters Region of Qinghai–Tibet Plateau, China. Environ. Monit. Assess. 2010, 170, 571–584. [Google Scholar] [CrossRef] [PubMed]
  45. Wang, Z.; Song, K.; Hu, L. China’s largest scale ecological migration in the Three-River Headwater region. Ambio 2010, 39, 443–446. [Google Scholar] [CrossRef] [PubMed]
  46. IUCN and UNEP-WCMC. The World Database on Protected Areas (WDPA). Available online: http://www.protectedplanet.net (accessed on 13 November 2018).
  47. Li, J.; Wang, W.; Axmacher, J.C.; Zhang, Y.; Zhu, Y. Streamlining China’s protected areas. Science 2016, 351, 1160. [Google Scholar] [CrossRef]
  48. Tang, C.; Zhong, L.; Kristen, M.; Cheng, S. A comprehensive evaluation of tourism climate suitability in Qinghai Province, China. J. Mt. Sci. 2012, 9, 403–413. [Google Scholar] [CrossRef]
  49. Qinghai Bureau of Statistics and Survey Organization of National Bureau of Statistics. Qinghai Statistical Yearbook 2000–2014; National Bureau of Statistics of China: Beijing, China, 2015.
  50. R Core Team. R: A Language and Environment for Statistical Computing; R Foundation for Statistical Computing: Vienna, Austria, 2013. [Google Scholar]
  51. Buckley, R.; Zhong, L.; Ma, X. Visitors to protected areas in China. Boil. Conserv. 2017, 209, 83–88. [Google Scholar] [CrossRef]
  52. Su, S.; Wan, C.; Hu, Y.; Cai, Z. Characterizing geographical preferences of international tourists and the local influential factors in China using geo-tagged photos on social media. Appl. Geogr. 2016, 73, 26–37. [Google Scholar] [CrossRef]
  53. Massidda, C.; Etzo, I. The determinants of Italian domestic tourism: A panel data analysis. Tour. Manag. 2012, 33, 603–610. [Google Scholar] [CrossRef]
  54. Yang, C.-H.; Lin, H.-L.; Han, C.-C. Analysis of international tourist arrivals in China: The role of World Heritage Sites. Tour. Manag. 2010, 31, 827–837. [Google Scholar] [CrossRef]
  55. Patuelli, R.; Mussoni, M.; Candela, G. The effects of World Heritage sites on domestic tourism: A spatial interaction model for Italy. J. Geogr. Syst. 2013, 15, 369–402. [Google Scholar] [CrossRef]
  56. de la Mata, T.; Llano-Verduras, C. Spatial pattern and domestic tourism: An econometric analysis using inter-regional monetary flows by type of journey. Pap. Reg. Sci. 2011, 91, 437–470. [Google Scholar] [CrossRef]
  57. Torres-Reyna, O. Getting Started in Fixed/Random Effects Models Using R; Data & Statistical Services; Princeton University: Princeton, NJ, USA, 2010. [Google Scholar]
  58. Turner, K.G.; Odgaard, M.V.; Bøcher, P.K.; Dalgaard, T.; Svenning, J.-C. Bundling ecosystem services in Denmark: Trade-offs and synergies in a cultural landscape. Landsc. Urban Plan. 2014, 125, 89–104. [Google Scholar] [CrossRef]
  59. Department of Qinghai Water Resources. Qinghai Water Resources Belletin 2000–2014. Available online: http://www.qhsl.gov.cn (accessed on 13 November 2018). (In Chinese)
  60. Ouyang, Z.; Zheng, H.; Xiao, Y.; Polasky, S.; Liu, J.; Xu, W.; Wang, Q.; Zhang, L.; Xiao, Y.; Rao, E.; et al. Improvements in ecosystem services from investments in natural capital. Science 2016, 352, 1455–1459. [Google Scholar] [CrossRef]
  61. Sedjo, R.; Sohngen, B. Carbon sequestration in forests and soils. Annu. Rev. Resour. Econ. 2012, 4, 127–144. [Google Scholar] [CrossRef]
  62. Zhao, M.; Running, S.W. Drought-induced reduction in global terrestrial Net Primary Production from 2000 through 2009. Science 2010, 329, 940–943. [Google Scholar] [CrossRef]
  63. Viña, A.; Liu, J. Hidden roles of protected areas in the conservation of biodiversity and ecosystem services. Ecosphere 2017, 8, e01864. [Google Scholar] [CrossRef] [Green Version]
  64. Running, S.; Zhao, M. User’s Guide: Daily GPP and Annual NPP (MOD17A2/A3) Products NASA Earth Observing System MODIS Land Algorithm; MODIS Land Team, US National Aeronautics and Space Administration: Washington, DC, USA, 2015.
  65. Liu, W.; Vogt, C.A.; Luo, J.; He, G.; Frank, K.A.; Liu, J. Drivers and socioeconomic impacts of tourism participation in protected areas. PLoS ONE 2012, 7, e35420. [Google Scholar] [CrossRef]
  66. Gössling, S.; Peeters, P.; Hall, C.M.; Ceron, J.-P.; Dubois, G.; Lehmann, L.V.; Scott, D. Tourism and water use: Supply, demand, and security. An international review. Tour. Manag. 2012, 33, 1–15. [Google Scholar] [CrossRef]
  67. Tonini, F.; Liu, J. Telecoupling Toolbox: Spatially explicit tools for studying telecoupled human and natural systems. Ecol. Soc. 2017, 22. [Google Scholar] [CrossRef]
  68. UN FAO. FAOSTAT Statistics Database. Available online: http://faostat.fao.org/ (accessed on 13 November 2018).
  69. Carpenter, S.R.; Mooney, H.A.; Agard, J.; Capistrano, D.; Defries, R.S.; Diaz, S.; Dietz, T.; Duraiappah, A.K.; Oteng-Yeboah, A.; Pereira, H.M.; et al. Science for managing ecosystem services: Beyond the Millennium Ecosystem Assessment. Proc. Natl. Acad. Sci. USA 2009, 106, 1305–1312. [Google Scholar] [CrossRef] [PubMed] [Green Version]
  70. DeFries, R.S.; Rudel, T.; Uriarte, M.; Hansen, M. Deforestation driven by urban population growth and agricultural trade in the twenty-first century. Nat. Geosci. 2010, 3, 178–181. [Google Scholar] [CrossRef]
  71. Zhao, X.; Liu, J.; Liu, Q.; Tillotson, M.R.; Guan, D.; Hubacek, K. Physical and virtual water transfers for regional water stress alleviation in China. Proc. Natl. Acad. Sci. USA 2015, 112, 1031–1035. [Google Scholar] [CrossRef] [PubMed] [Green Version]
  72. Zhang, Y.; Zhang, C.; Wang, Z.; Chen, Y.; Gang, C.; An, R.; Li, J. Vegetation dynamics and its driving forces from climate change and human activities in the Three-River Source Region, China from 1982 to 2012. Sci. Total Environ. 2016, 563–564, 210–220. [Google Scholar] [CrossRef] [PubMed]
  73. Xu, H.-J.; Wang, X.-P.; Zhang, X.-X. Alpine grasslands response to climatic factors and anthropogenic activities on the Tibetan Plateau from 2000 to 2012. Ecol. Eng. 2016, 92, 251–259. [Google Scholar] [CrossRef]
  74. Lu, X.; Kelsey Kathy, C.; Yan, Y.; Sun, J.; Wang, X.; Cheng, G.; Neff Jason, C. Effects of grazing on ecosystem structure and function of alpine grasslands in Qinghai–Tibetan Plateau: A synthesis. Ecosphere 2017, 8, e01656. [Google Scholar] [CrossRef]
  75. Yan, Y.; Lu, X. Is grazing exclusion effective in restoring vegetation in degraded alpine grasslands in Tibet, China? PeerJ 2015, 3, e1020. [Google Scholar] [CrossRef] [PubMed] [Green Version]
  76. Bauer, K. New homes, new lives—The social and economic effects of resettlement on Tibetan nomads (Yushu prefecture, Qinghai province, PRC). Nomadic Peoples 2015, 19, 209–220. [Google Scholar] [CrossRef]
  77. Du, F. Ecological resettlement of Tibetan herders in the Sanjiangyuan: A case study in Madoi County of Qinghai. Nomadic Peoples 2012, 16, 116–133. [Google Scholar] [CrossRef]
  78. Harris, R.B.; Samberg, L.H.; Yeh, E.T.; Smith, A.T.; Wenying, W.; Junbang, W.; Gaerrang; Bedunah, D.J. Rangeland responses to pastoralists’ grazing management on a Tibetan steppe grassland, Qinghai Province, China. Rangel. J. 2016, 38, 1–15. [Google Scholar] [CrossRef]
  79. Yeh, E.T.; Samberg, L.H.; Gaerrang; Volkmar, E.; Harris, R.B. Pastoralist decision-making on the Tibetan Plateau. Hum. Ecol. 2017, 45, 333–343. [Google Scholar] [CrossRef]
  80. Foggin, J.M. Depopulating the Tibetan grasslands. Mt. Res. Dev. 2008, 28, 26–31. [Google Scholar] [CrossRef]
  81. Oldekop, J.A.; Holmes, G.; Harris, W.E.; Evans, K.L. A global assessment of the social and conservation outcomes of protected areas. Conserv. Boil. 2016, 30, 133–141. [Google Scholar] [CrossRef] [PubMed]
  82. Wan, W.; Xiao, P.; Feng, X.; Li, H.; Ma, R.; Duan, H.; Zhao, L. Monitoring lake changes of Qinghai-Tibetan Plateau over the past 30 years using satellite remote sensing data. Chin. Sci. Bull. 2014, 59, 1021–1035. [Google Scholar] [CrossRef]
  83. Renard, D.; Rhemtulla, J.M.; Bennett, E.M. Historical dynamics in ecosystem service bundles. Proc. Natl. Acad. Sci. USA 2015, 112, 13411–13416. [Google Scholar] [CrossRef] [Green Version]
  84. Li, P.; Yang, G. Ecological footprint study on tourism itinerary products in Shangri-La, Yunnan Province, China. Acta Ecol. Sin. 2007, 27, 2954–2963. [Google Scholar] [CrossRef]
  85. Zhong, L.; Deng, J.; Song, Z.; Ding, P. Research on environmental impacts of tourism in China: Progress and prospect. J. Environ. Manag. 2011, 92, 2972–2983. [Google Scholar] [CrossRef] [PubMed]
  86. Du, J.; Buckley, R.; Tang, Y. Cultural differentiation in product choice by outdoor tourists. Tour. Recreat. Res. 2016, 41, 177–187. [Google Scholar] [CrossRef]
  87. Graves, R.A.; Pearson, S.M.; Turner, M.G. Species richness alone does not predict cultural ecosystem service value. Proc. Natl. Acad. Sci. USA 2017. [Google Scholar] [CrossRef] [PubMed]
  88. Hausmann, A.; Toivonen, T.; Heikinheimo, V.; Tenkanen, H.; Slotow, R.; Di Minin, E. Social media reveal that charismatic species are not the main attractor of ecotourists to sub-Saharan protected areas. Sci. Rep. 2017, 7, 763. [Google Scholar] [CrossRef] [PubMed]
Figure 1. Schematic diagram of spatial interactions between distant tourism demand and ecosystem services (ES) supply. The thickness of green arrows shows the relative numbers of tourists. The dotted arrows (gray) indicate the spillover effects of tourist flows. Tourism pressure areas (purple) experience high environmental pressures because of the high number of tourists.
Sustainability 10 04576 g001
Figure 2. Land use map (2010) and protected areas (2014) in Qinghai Province, China. The map was generated by ArcGIS 10.3 [38].
Sustainability 10 04576 g002
Figure 3. Flows of (a) international tourists and (b) domestic tourists to Qinghai Province from 2012 to 2014. The receiving system is highlighted in red, and the sending systems are highlighted in green. Gray areas represent spillover systems. The map was generated by ArcGIS 10.3 [38] and the Telecoupling Toolbox [67].
Sustainability 10 04576 g003
Figure 4. PCA biplot of the five ecosystem services.
Sustainability 10 04576 g004
Figure 5. Economic and environmental effects of Qinghai tourism from 2000 to 2014. (a) Tourism earnings. (b) Percentage of tourist crop consumption in total crop production. (c) Percentage of tourist livestock consumption in total livestock production. (d) Percentage of tourist water consumption in total residential water use. (e) Percentage of tourist water consumption in total water use.
Sustainability 10 04576 g005
Table 1. Summary of methodologies in each telecoupling component.
ComponentMethodologyAim
AgentsDescriptive statisticsTo identify the changes in tourists, tourism agencies, and local residents
FlowsRadial flow analysisTo explore the flows of international and domestic tourists
CausesES supply quantification and principal component analysis (PCA)To understand the spatial interactions of provisioning, regulating, and cultural ES
Linear panel regression analysisTo determine factors that affect Qinghai tourism demand
EffectsEffect analysisTo estimate annual tourist food and water consumption
Table 2. Agents for Qinghai tourism in 2000 and 2014.
Agents20002014
Tourists (persons)3,209,59220,056,000
Domestic3,177,00020,004,000
International32,59252,000
Tourism agencies (number)102247
Hotels (number)27219
Local governments (number)430365
Residents (persons)4,804,1605,801,645
Urban1,360,9452,782,000
Rural3,443,2153,019,645
Table 3. Coefficients of panel regression models from 2010 to 2014, predicting annual visitation numbers and expenditure per tourist. GDP: gross domestic product.
VariableVisitation Numbers (10,000 Persons)Expenditure Per Tourist (Yuan)
Tourism attractions (number)40.243 * (11.949)32.399 ** (3.345)
GDP per capita (yuan)0.005 (0.003)0.003 ** (0.001)
Percentage of GDP from construction (%)3.429 (6.067)−7.776 * (2.748)
Road and rail length (km)0.007 (0.010)0.004 (0.005)
Intercept−258.660 (144.030)24.272 (56.913)
R20.654 **0.798 **
F–statistic16.55034.481
df3535
Values in parentheses are standard errors. ** p < 0.001, * p < 0.05.

