Article

Soil Physical Properties and Soybean Yield as Influenced by Long-Term Tillage Systems and Cover Cropping in the Midsouth USA

1
Biosystems Engineering & Soil Science, The University of Tennessee, Knoxville, TN 37996, USA
2
Department of Plant Sciences, The University of Tennessee, Jackson, TN 38301, USA
3
Biosystems Engineering & Soil Science, The University of Tennessee, Jackson, TN 38301, USA
4
USDA-ARS, Crop Genetics Research Unit, 605 Airways Blvd., Jackson, TN 38301, USA
*
Author to whom correspondence should be addressed.
Sustainability 2018, 10(12), 4696; https://doi.org/10.3390/su10124696
Submission received: 4 November 2018 / Revised: 28 November 2018 / Accepted: 7 December 2018 / Published: 10 December 2018
(This article belongs to the Section Sustainable Agriculture)

Abstract

:
A better understanding of the effect of long-term tillage management on soil properties and yield is essential for sustainable food production. This research aimed to evaluate the 37-year impact of different tillage systems and cover cropping on soil hydro-physical properties at 0–15 and 15–30 cm, as well as on soybean [Glycine max (L.) Merr] yield. The long-term experiment was located in Jackson, TN, and the different treatments involved in this study were no-tillage (NT), disk (DP), chisel (CP), moldboard plow (MP), and no-tillage with winter wheat [Triticum aestivum (L.)] cover crop (NTW). Forty-five days after the tillage operation, MP showed a comparable bulk density (BD) with NT, NTW, and CP at 0–15 cm depth. At surface depth, No-tillage systems increased cone penetration resistance (PR) by 12% compared with the reduced tillage systems, and 47% relative to MP. Wet aggregate stability (WAS) at surface depth was 27% and 36% greater for NT systems than for reduced and conventional tillage systems, respectively. Similarly, the geometric mean diameter (GMD) of aggregates was significantly higher under NT and NTW. However, water infiltration and field-saturated hydraulic conductivity (Kfs) did not differ significantly among tillage systems. The greatest soybean yield was obtained from CP and DP, producing 10% higher yield than NTW. Overall, 37 years of no-tillage, with or without simplified cover cropping did not result in a consistent improvement in soybean yield and soil physical properties with the exception of having improved soil aggregation.

1. Introduction

By 2050, agricultural food production is projected to increase by seventy percent globally to sustain food security for the growing population [1]. Limited scope in further expansion of global farmland area necessitates the adoption of effective conservation practices for sustainable intensification of food production [2,3]. Conservation tillage is well-recognized as a potential strategy to increase the agricultural sustainability by preserving soil and water resources and improving the production economy, among other agroecosystem services [4]. The effect of tillage practices on soil properties, however, depends on the frequency and intensity of soil disturbance, quantity, and quality of crop residues left on the field after harvest and redistribution of plant residues within the soil profile [5]. Soil properties such as aggregate stability and size distribution, soil strength and penetrability, and water infiltration and hydraulic conductivity are important indicators of soil structural quality as influenced by agricultural management systems. Soil structural quality in turn is closely tied to the soil’s ability to maintain its vital functions under climatic tensions, such as storing and supplying water in dry periods and quickly infiltrating and percolating water in wet periods while remaining stable [6]. Maintaining such soil characteristics is particularly important for rainfed cropping systems in hot and humid climates, such as the Midsouth USA, due to the torrent winter, spring rainfalls, and periodic severe droughts in summer.
Among conservation tillage systems, no-tillage is a leading conservation technique which has gained recognition during the last few decades, primarily due to its potential to reduce soil erosion and decrease production cost [7,8]. Almost 35% of the farmland areas in the US and over 70% in Tennessee are managed under a no-tillage system [9]. Most Tennessee upland soils are silt loam in texture with topsoil organic matter content rarely exceeding one percent with conventional tillage. This leads to a faster disruption of soil aggregates to finer particles by the raindrop impact and a reduction of water infiltration by clogging the pore inlets. This in turn may lead to crop failure due to the excessive droughts in such a humid climate [10]. In Tennessee, a widespread adoption of no-tillage had a great contribution to the conservation of soil and water resources. However, the positive effect of no-tillage on soil quality and crop yield is not consistent across the state [11,12,13]. In no-tillage, high dependency of improvements in soil quality on the amount of biomass input may limit its benefits in low-biomass row cropping systems. This effect may be even more intense in humid climates due to the relatively rapid decomposition of crop residues and organic matter [6].
Due to accumulating plant residues on soil surfaces, no-tillage generally has a more intense and immediate effect on topsoil than on subsoil properties. For instance, no-tillage has generally resulted in a greater wet aggregate stability [14], macroaggregation [15], and water content [16] at surface soil layer compared with conventional tillage. Moreover, residue cover retained on the soil surface may improve gas and water exchange at the soil-atmosphere interface [17]. However, previous studies have reported inconsistent results when soil hydro-physical properties were compared between no-tillage and reduced tillage systems. For example, compared with reduced tillage, no-tillage resulted in higher [18,19], lower [20,21], or similar [14,22] aggregate stability and size distribution. Contradictory results can also be found in soil hydraulic properties and crop yield when comparing between reduced and no-tillage systems [20,23,24]. Although a complete soil surface protection by crop residue cover cannot be achieved by reduced tillage [25], studies have shown that reduced tillage can result in a lower near-surface soil compaction compared with no-tillage [26]. Additionally, the adoption of no-till in poorly-drained, fine-textured soils has been shown to further confine air, water, and nutrient transport in the soil profile [27]. Therefore, in some cases reduced tillage may result in better nutrient (e.g., phosphorous and potassium) availability in tilled rather than in no-till system, which may eventually benefit the crop yield [28]. In a 4-year study conducted on a poorly drained clay loam, no-tillage led to a lower plant available water content at 15 cm of topsoil, reduced wheat and rice grain, reduced biomass yield, and a lower root mass density down into 30 cm compared to chisel plow [20]. Moreover, in cold and humid climates, excessive accumulation of crop residues on the no-tilled soil surface can hinder timely seed germination and reduce soil workability [29].
There is not a singular conservation tillage system that can satisfy all agroecosystem services for soil quality, environmental sustainability, and economic outcome across soils, climates, and crops. Hence, there is a need for region-specific designs of tillage and cropping systems to obtain the maximum outcome within certain climatic and terrestrial boundaries. This may not come true without a deeper understanding of the effectiveness of the current tillage practices for improving soil quality and crop yield. Our research leverages a long-term field experiment established in 1979 on the regionally most representative soil type and row crop (soybean). This is one of the long-term ongoing experiments in the Midsouth USA comprising different tillage systems. Our objective was to determine the soil hydro-physical properties, including the soil strength parameters, aggregate stability and size distribution, water infiltration, and hydraulic conductivity along with soybean yield under long-term no-tillage, no-tillage with winter wheat cover crop, chisel plow, disk and moldboard plow in a rainfed continuous soybean in western Tennessee.

2. Materials and Methods

2.1. Study Site and Experimental Setting

The research was conducted on a continuous soybean [Glycine max (L.) Merr.] field experiment located at the University of Tennessee’s West Tennessee Research and Education Center, Jackson, TN (35°37′22″ N, 88°50′47″ W). According to the Köppen classification, the study region is under humid subtropical (Cfa) climate, with a mean annual temperature of 15.6 °C and a mean annual rainfall of 1350 mm. The field experiment was established in 1979 on a one-hectare area to study six tillage systems on a uniform Lexington silt loam soil (fine-silty, mixed thermic Ultic Hapludalfs). Five treatments were selected for this research: moldboard plowing to 25 cm deep (MP) followed by disking and roller harrowing; disking to 10 cm deep (DP) followed by roller harrowing; chisel plowing to 20 cm deep (CP) followed by roller harrowing; no-tillage (NT), on the previous soybean stubble and no-tillage with winter wheat [Triticum aestivum (L.)] cover crop (NTW). Each plot is sized 18 m × 6 m, including four rows of soybean with 1.5 m of row spacing and 4 field replications (Figure 1). Each year since 1979, following the chemical suppression of the wheat cover crop by applying 0.71 kg ha−1 paraquat (1-methyl-4-(1-methylpyridin-1-ium-4-yl) pyridin-1-ium), tillage plots were tilled in late May and soybean was seeded. Pre-emergence weed control was achieved by applying alachlor (2-chloro-N-(2,6-diethylphenyl)-N-(methoxymethyl) acetamide) at 3.36 kg ha−1 and metribuzin (4-amino-6-tert-butyl-3-methylsulfanyl-1,2,4-triazin-5-one) at 0.42 kg ha−1. Post-emergence weeds were controlled by applying 0.13 kg ha−1 clethodim (2-[1-[[(E)-3-chloroprop-2-enoxy] amino] propylidene]-5-(2-ethylsulfanylpropyl) cyclohexane-1,3-dione). Two middle rows of soybean were harvested in October and yield was adjusted to 13% moisture content. The winter wheat cover crop was reseeded in NTW plots in October–November following the soybean harvest.

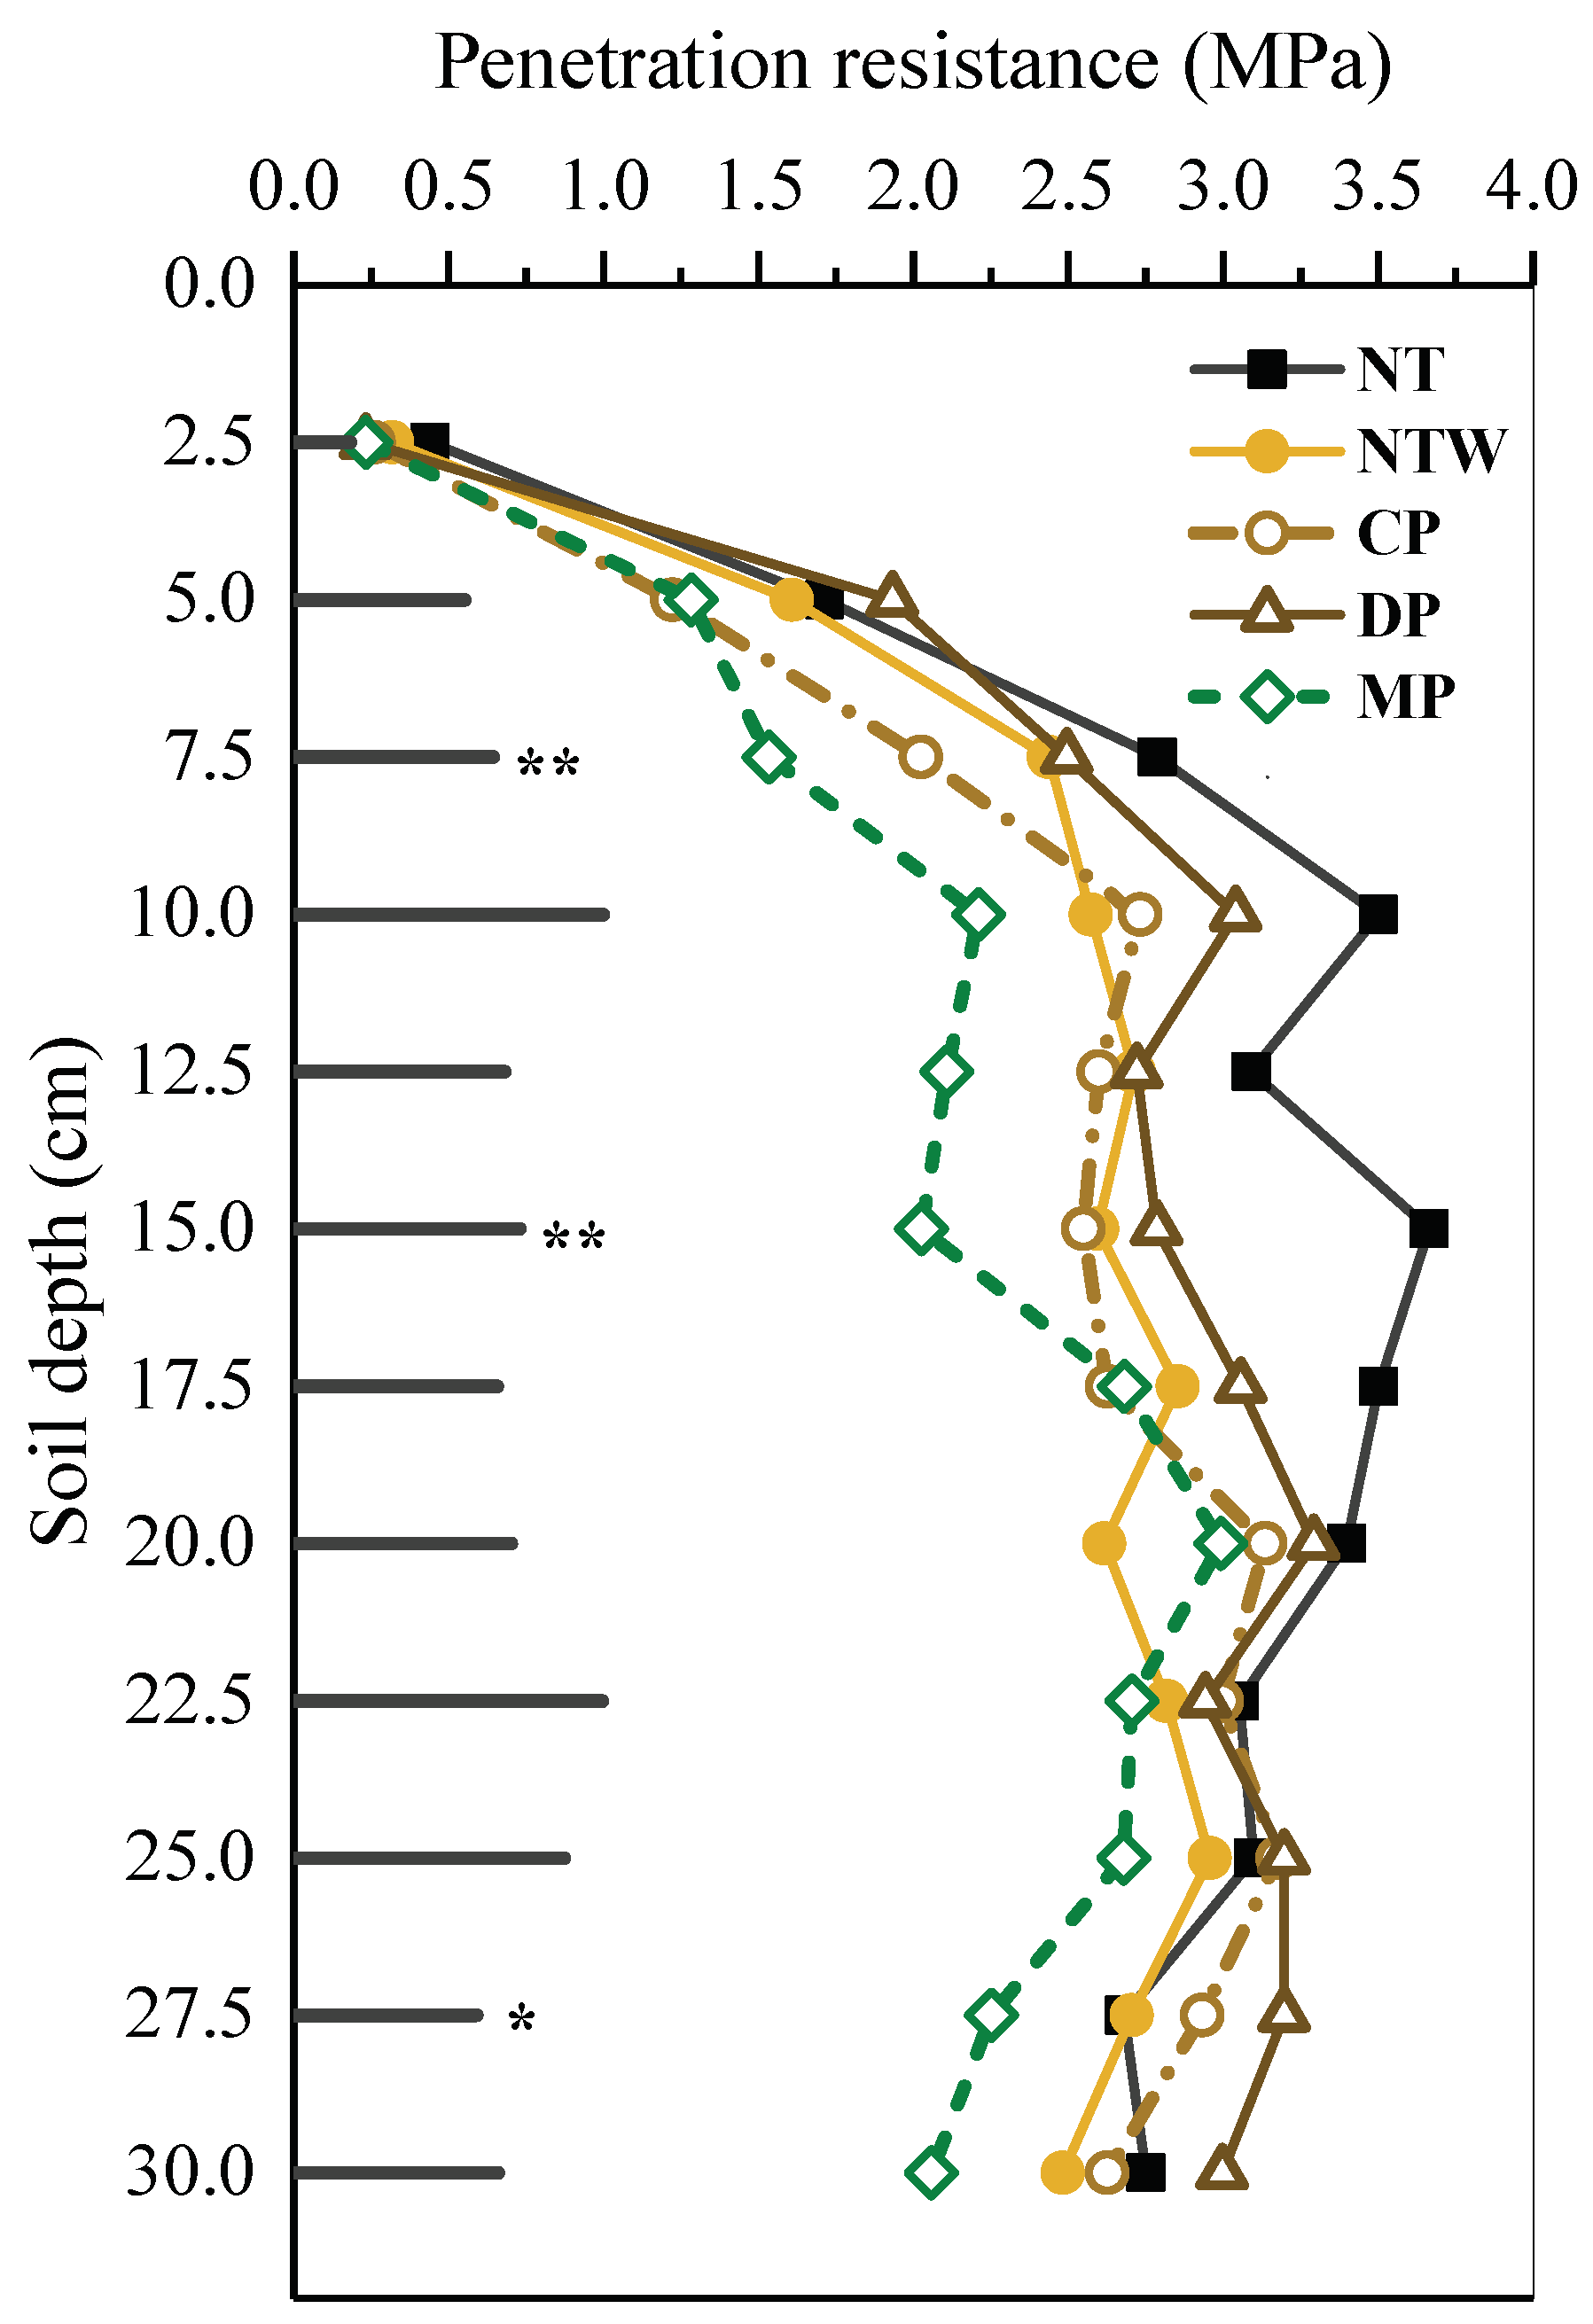
2.2. Bulk Density, Penetration Resistance and Field Moisture Content

In July 2015, soil samples were collected randomly from the no-trafficked soybean inter-row spaces from 0–15 cm and 15–30 cm depths using stainless-steel cores with the volume of 147 cm3 (75 mm height and 50 mm diameter). Bulk density (BD) was determined using the core method as explained by [30]. Total porosity (TP) was calculated based on the bulk density values and particle density (assumed to be 2.65 g cm−3). Cone penetration resistance (PR) was measured using a hand-held digital cone-tipped penetrometer (Field Scout, SC 900 Soil Compaction Meter; Spectrum Technologies, Inc., Plainfield, IL, USA). Four PR measurements per replicated treatment were recorded on a line transect to 30 cm soil depth with 2.5 cm vertical depth intervals.

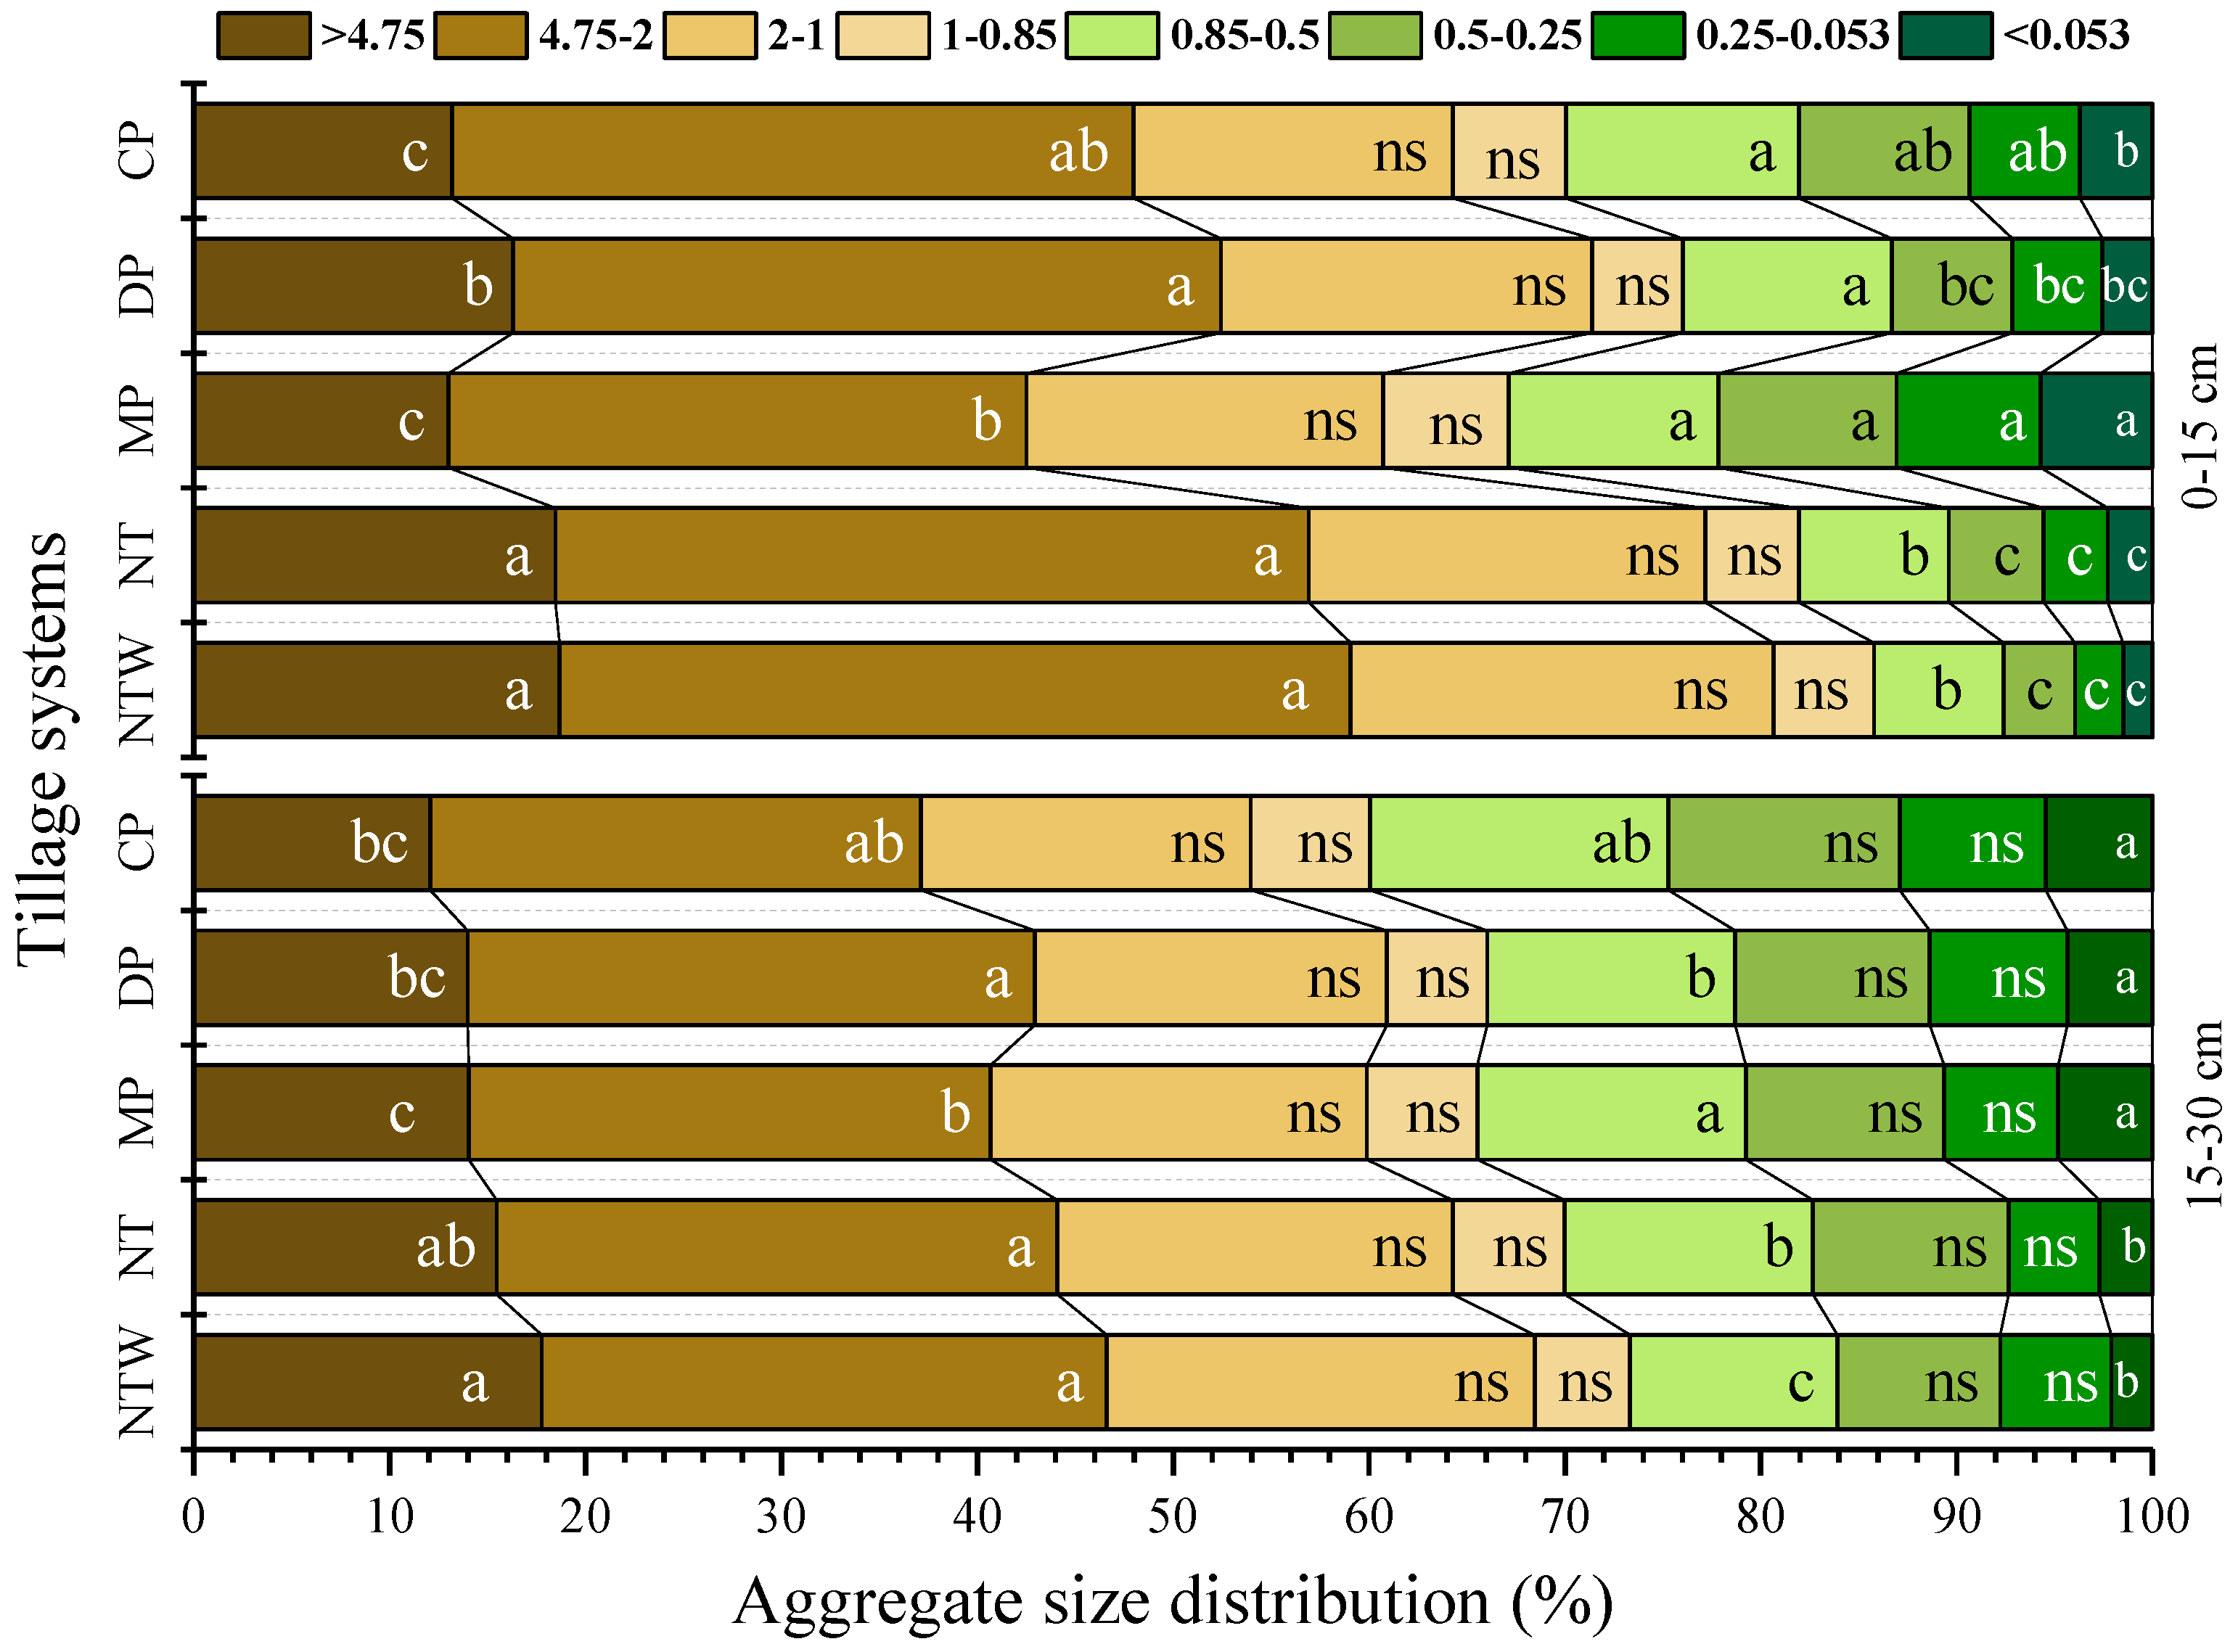
2.3. Wet Aggregate Stability and Dry Aggregate Size Distribution

Wet aggregate stability (WAS) was determined using a commercial wet sieving apparatus (08.13, Eijkelkamp Agrisearch Equipment, Giesbeek, The Netherlands). Four grams of air-dried aggregates of 1–2 mm in size were uniformly placed on 0.26-mm sized sieves and wetted from the bottom by capillary motion. Sieves were placed into recessed holders of the apparatus and were raised and lowered in distilled water for 3 min at an oscillation rate of 35 times per minute, as explained in [31]. After 3 min of wet sieving, the unstable fraction of the aggregates that passed through the sieves were collected, oven-dried, and weighed. The water stable fraction of aggregates that remained on the sieves was resumed sieving in distilled water containing 2 g L−1 of sodium hydroxide (dispersant agent) until only sand particles were left on the sieves. Sand particles were collected and weighed. The soil particles from water stable aggregates were oven-dried and weighed, and 0.2 g of the dispersant agent was subtracted from the over-dry weight of samples. The fraction of stable aggregates was calculated as:
WAS% = (Remained on sieve − Sand)/(Total sample − Sand) × 100
Dry aggregate size distribution analysis was conducted, using bulk samples collected with a flat head shovel and located in a metal container to avoid the disturbance of aggregates during the transportation. Air-dried soil samples were sieved through an 8-mm sieve and 100 g of subsamples were placed on top of the sieves with openings of 4.75, 2, 1, 0.85, 0.5, 0.25, and 0.05 mm. Samples were sieved for 5 min using a vertical sieving apparatus (model 18480, CSC Scientific, Fairfax, VA, USA) adjusted to the amplitude of 0.1 mm. The soil aggregates remaining on each sieve were collected and weighed. Geometric mean diameter (GMD) was calculated by applying a probit transform to the percent oversize values. Plotting the probit transformed cumulative fraction oversize (x axis) and log10 sieve size (y axis), and fitting a least squares linear regression, a simple linear equation was derived. Substituting 0.5 for x in the resulting equation, the log diameter of 50% oversize, or GMD, was obtained [32]. Mean weight diameter (MWD) was calculated from the following equation, as explained by [33]:
MWD = i = 1 n x i ¯ w i
where xi is the mean diameter (mm) of size class, and wi is the soil mass fraction remained on the sieve (g g−1).

2.4. Water Infiltration and Field-Saturated Hydraulic Conductivity

Water infiltration was measured in the field [34] using a double ring infiltrometer (Turf-Tec International, model IN7-W, Tallahassee, FL, USA) of 102 mm in height, and 305 and 153 mm for the outer and inner ring diameters, respectively. The infiltrometer was inserted into the soil at a depth of about 40 mm, and the constant head of water was maintained at both rings 50 mm above the soil surface to avoid the flow divergence in the inner ring. The water infiltration was continued until the steady state infiltration was obtained. The infiltration data were fitted to Philip’s model [35] using the least square method to obtain sorptivity (S, LT−0.5) and transmissivity (A, LT−1) parameters.
i = 1 2 S t 0.5 + A
I = S t 0.5 + A t
where i (LT−1) is the infiltration rate, I (L) is the cumulative infiltration, and t (T) is the time passed.
The field-saturated one-dimensional hydraulic conductivity (Kfs) (LT−1) was measured based on the methodology explained by [34].
K fs = q s [ H C 1 d + C 2 a ] + { 1 [ α * ( C 1 d + C 2 a ) ] } + 1
where, qs (LT−1) is the quasi-steady infiltration rate, a (L) is the ring radius, H (L) is the height of the water column, d (L) is the depth of ring insertion into the soil, C1 = 0.316π and C2 = 0.184π are quasi-empirical constants, and α* (L−1) is the soil macroscopic capillary length which was assumed to be 0.012 mm h−1 based on the textural and structural characteristics of the study soil.

2.5. Statistical Analysis

The experimental design consisted of five tillage systems replicated randomly in four complete blocks, thereby creating a randomized complete block design (RCBD). MIXED ANOVA procedure was conducted in SAS [36] using DandA.sas” macro [37] (http://dawg.utk.edu). Least square means were separated by Fisher’s protected least significant difference test (LSD) at p < 0.05 significance level. Tillage treatment was considered as fixed effect and replication was considered as random effect. The significance of sampling depth and tillage × depth interaction was obtained by considering depth as a sub-plot fixed effect.

3. Results and Discussion

3.1. Effect of Tillage Systems on Soil Hydro-Physical Properties

Bulk density (BD) measured 45 days after tillage operations significantly varied among tillage systems (Table 1). At 0–15 cm, DP significantly reduced BD and increased total porosity (TP) compared with NT and NTW, while MP resulted in intermediate BD and TP. Previous studies also showed a higher near-surface soil compaction in NT compared to reduced and conventional tillage systems [13,38]. At 15–30 cm, BD differences were not significant among tillage managements. The magnitude of differences in BD among tillage systems can also be affected by the time of sampling. Bulk density is generally the lowest immediately after tillage operation and gradually increases during the growing season, due to climatic factors and the mechanical load exerted on the soil surface [39]. Results indicate that MP, despite being the most intensive tillage system, did not result in a long-lasting reduction in bulk density. Forty-five days after the tillage operation, MP resulted in statistically similar BD to NT and NTW at surface depth and in an even higher mean value at subsurface depth. This can be related to the higher soil compactibility of plowed soil than no-till soil, as reported by [40]. In contrast, DP resulted in a lower BD compared to NT systems at 0–15 cm.
Cone penetration resistance was significantly (p < 0.01) different among tillage systems only at a 0–15-cm depth (Table 1). At this depth, NT resulted in the highest PR but did not differ significantly from DP, whereas MP and CP showed significantly lower PR values. No-tillage systems (NT and NTW) with a mean value of 1.97 MPa showed 12% greater PR than the mean value (1.76 MPa) of reduced tillage systems (CP and DP), and 47% higher PR than MP. At 15–30 cm, despite the non-significant PR differences among tillage systems, DP and NT had numerically the highest values, while MP had the numerically the lowest value, as clearly shown in the depth distribution profile (Figure 2). Cone penetration resistance at 15–30 cm was significantly (p < 0.01) higher than at 0–15 cm of soil depth. However, the management–depth interaction was not significant. Higher PR in NT compared with different tilled systems within tillage depth was reported by several past studies [41,42]. Reference [21] reported a greater PR at the top 30 cm of a NT silt loam soil compared with CP across three levels of corn residue removal at different experimental sites. Previous studies mentioned 2.0 MPa as a threshold for PR, beyond which the excessive soil strength may restrict the proper root extension and water and nutrient uptake by crops [43]. It is well recognized that the temporal variation in PR is highly consistent with changes in soil moisture content [44]. In dry periods of growing season, the PR in our rainfed cropping systems, particularly in NT systems, frequently raised above the 2 MPa threshold level. However, the above-state average soybean yield under all tillage systems in our experiment (Figure 6) indicates that an increase in PR did not limit crop productivity. This could be due to the physiological adaptation of the root system, such as increasing root thickness and extending roots through existing bio-pores to cope with the high PR [38].
Wet aggregate stability (WAS) differed significantly (p < 0.05) among tillage systems at both sampling depths (Figure 3). At 0–15 cm, no-tillage systems (NT and NTW) resulted in a 27% greater WAS than reduced tillage systems (CP and DP) and 37% greater than MP. At 15–30 cm, NT had significantly higher fraction of WAS compared with CP, DP, and MP. The mean WAS at surface depth was not significantly different from the subsurface soil depth. Wet aggregate stability is known as one of the most responsive soil properties to the adoption of no-tillage system [6]. Higher WAS in NT and NTW can be ascribed to the preservation of aggregate structure as a result of the reduced mechanical soil disturbance and a better protection of aggregate-protected soil organic carbon [45]. On a fine loamy soil in a semi-arid climate, Reference [46] observed a linear relationship between the ascending rate of wheat straw addition and aggregate stability. However, in our experiment, additional biomass input by wheat cover crop in NTW did not increase the WAS beyond that in NT.
Dry aggregate size distribution was significantly affected by tillage systems at both soil depths (Figure 4). At 0–15 cm, geometric mean diameter (GMD) and mean weight diameter (MWD) were significantly higher under NTW and NT than reduced tillage treatments (CP and DP) and MP. In accordance with [47], at 0–15 cm, the proportion of macroaggregates (MA: >2 mm) was significantly higher under NT and NTW than under CP and MP, whereas DP showed an intermediate value. Similar results were also reported by [48]. On a sandy loam, Reference [38] observed a significantly higher fraction of macroaggregates in NT at all depth increments on top 18 cm. The fraction of small macroaggregates (SMA: 0.25–2 mm) and microaggregates (MIA: 0.05–0.25 mm) in our study were conversely greater under CP and MP compared with NT and NTW (Table 2). The result indicates a better macroaggregation under long-term NT systems compared with tilled systems. Greater residue retention by NT systems has frequently been reported to increase the biological activities, especially at soil surface layer, which in turn accelerates the formation of macroaggregates by releasing binding agents [49]. The mean value of GMD of two NT managements was 43% greater than the mean GMD of reduced tillage systems (DP and CP), and 84% greater than MP. However, dry aggregate within 0.85–1 mm and 1–2 mm size classes remained unchanged at both depths among tillage systems. In our study, the effect of tillage system on soil aggregation was extended beyond surface depth to 15–30 cm soil depth. The differences in GMD and MWD at 15–30 cm soil depth was mainly affected by the significant difference in the proportion of macroaggregates. The mean MWD was 13% greater at surface depth than the subsurface depth. Moldboard plow at both depths had a significantly greater fraction of silt and clay size particles (<0.05 mm) [50,51]. Our result on the distribution of aggregate size classes is in agreement with the finding of Reference [52], who concluded that the lack of aggregate disturbance by tillage and additional residue production promotes the macroaggregation in NT systems.
Despite the normality of distribution (Shapiro-Wilk p > 0.05), no significant differences in any measured hydraulic parameters were observed among treatments. As shown in Figure 5, soil hydraulic properties including initial and cumulative infiltration and field-saturated hydraulic conductivity varied considerably across four replicates. The highest variations were observed in NT and NTW managements. This may be attributed to the heterogeneous distribution of macropores [34]. Continuous macropores with radii greater than about 0.08 mm have the capacity to conduct the almost entire flow in saturated condition [53]. Though statistically not significant, the mean values of initial infiltration rate followed the order: NTW > NT > DP > CP > MP. The residue cover retained on the soil surface due to reduced or no soil manipulation preserves the pore continuity at the soil–atmosphere interface, which could be the reason for the numerically higher initial water infiltration in less intense tillage treatments. Additionally, root density could be higher near soil surface under NT, particularly when managed under cover crop, which has a soil loosening effect that increases the soil porosity and consequently the water percolation [54]. Cumulative infiltration after 230 min of each individual measurement was highest in NTW and lowest with CP. The order of magnitudes in cumulative infiltration among treatments was: NTW > DP > NT > MP > CP. Field-saturated hydraulic conductivity, however, was greatest under DP and lowest under CP and MP. Order of magnitude for Kfs was: DP > NTW > NT > MP > CP. Reference [55] also observed no significant difference in water infiltration and hydraulic conductivity among different long-term tillage systems, even though they found higher numerical values in MP than NT system. A disruption of aggregates at the soil surface by raindrop impact can substantially decrease water infiltration and hydraulic conductivity, irrespective of the structural characteristics of the soil matrix. Based on our visual observation from the study site, rainfall occurring shortly after tillage operations can noticeably decrease the water infiltration under tiled systems. This effect may vary with tillage intensity. Increased water infiltration and saturated hydraulic conductivity under long-term NT can be ascribed to a better soil surface protection as well as to a large and continuous pore system formed by soil fauna and root activity [56]. In contrast, some studies have reported a higher hydraulic conductivity in conventional tillage than NT or reduced tillage systems [57]. Sorptivity (S), defined as the ability of soil to imbibe water, is known to be related to the initial infiltration rate and influenced by the antecedent soil moisture content [58]. Our calculated sorptivity parameter correlated well with initial infiltration rate (r = 0.92). In accordance with the findings of [59], NTW with sorptivity of 440 mm h−0.5 had the greatest capacity among all managements to absorb water in initial stages of infiltration process. NTW was followed by NT with mean S value of 410 mm h−0.5. Reduced tillage systems (CP and DP) exhibited intermediate S values (292 and 283 mm h−0.5 respectively) while MP had the lowest mean S value (240 mm h−0.5). Our results indicate that, despite an overall positive effect, long-term no-tillage may not considerably improve water infiltration and transmission compared with tillage treatments. Results also suggest that the addition of winter wheat cover crop may not significantly increase the potential of NT for improving soil hydraulic properties.

3.2. Effect of Tillage Systems on Soybean Yield

The highest soybean yield in experiment year (2015) was observed in CP (3.47 Mg ha−1) and DP (3.46 Mg ha−1), producing 10% higher yield than NTW (3.15 Mg ha−1), while NT (3.28 Mg ha−1) and MP (3.31 Mg ha−1) resulted in intermediate values (Figure 6). Similar results were also observed from 5-year mean soybean yield, even though NT had slightly higher yield than MP and NTW. However, yield differences among tillage systems were only significant in 2015. No significant relationships were found between soil hydro-physical properties associated with tillage systems and soybean yield neither in the experiment year (2015), nor during the last five years (2011–2015). This can be explained by the fact that except for significantly higher macroaggregation and aggregate stability with two no-tillage systems (NT and NTW), no other measured soil physical properties favorably changed with NT management. For example, no-till systems on average had higher BD and cone PR and lower TP compared with tilled systems. Moreover, no-tillage systems did not show statistically higher values of water infiltration and transmission than other tillage systems. Among soil properties, soybean yield showed the highest inverse correlation with BD (r = −0.31) at 0–15 cm depth. These results indicate that despite the minimal effect of soil physical properties on soybean yield, soil compaction was most likely to negatively affect the soybean yield. [60] reported that in a silt loam soil, increased root impedance in water deficit periods because of reduced soil moisture content was the main reason for soybean yield loss. Previous studies have shown that no-tillage may increase [61,62] or decrease [63] crop yield compared with tilled systems. In a meta-analysis conducted on 678 studies worldwide, reference [24] showed a general decline in legumes yield under NT compared with conventional tillage. The only positive yield response to NT system they observed was from the rainfed cropping systems in dry climates. Our results corroborate that long-term NT alone or with simplified cover cropping may not produce greater yield than conventional and reduced tillage systems in the humid semi-tropical climate, as in our study location. Field-specific additional conservation practices such as multispecies cover cropping and main crop rotations with higher potential of below and above ground biomass production may be required to improve productivity of no-tillage monoculture soybean system.

4. Conclusions

The effect of long-term tillage systems including no-tillage, chisel plow, disk plow and moldboard plow with winter fallow, and no-tillage with winter wheat cover crop on soil hydro-physical properties and soybean yield was evaluated on a silt loam soil in Jackson, TN, USA. Results showed that 37 years of no-till on a continuous soybean had a positive effect on soil macroaggregation and aggregate stability, both at surface and subsurface soil layers. However, the incorporation of winter wheat cover crop with NT had no positive effect on the aforementioned properties compared to NT with winter fallow. The effect of tillage systems on bulk density and cone penetration resistance were confined to 15 cm topsoil. No-till systems (NT and NTW) resulted in higher bulk density relative to reduced (CP and DP) and conventional tillage (MP) systems. Hydraulic properties showed a general improvement under no-tillage managements, even though differences were not statistically significant due to the high spatial variability among replicates. During the study period, reduced tillage systems (CP and DP) resulted in higher soybean yield than the most and least intensive tillage treatments. Long-term no-tillage neither effectively alleviated soil compaction nor improved root penetrability, hydraulic properties, and soybean yield relative to reduced and conventional tillage systems. These results corroborate that no-tillage, even after a long-term application, when adopted under a soybean monocropping system with simplified cover cropping may not result in significant improvement in soil quality and crop yield. This study indicates that sustainable food production in no-till cropping systems demands for the incorporation of locally-suited improved ancillary practices, such as diversified cropping systems and multispecies cover cropping, to improve the soil quality and enhance the soil resilience in climatic extremes.

Author Contributions

J.L., A.N., and X.Y., conceptualization; A.N. data collection, data analysis, and writing original draft; J.L., X.Y., and P.A. funding acquisition, and methodology; D.D.T. design and maintenance of the experiment; J.L. project supervision; S.J. methodology, writing, and editing.

Funding

This research was supported by Conservation Innovation Grants (CIG), NRCS, USDA [69-3A75-13-238].

Conflicts of Interest

The authors declare no conflict of interest.

References

  1. Dubois, O. The State of the World’s Land and Water Resources for Food and Agriculture: Managing Systems at Risk; Earthscan: London, UK, 2011. [Google Scholar]
  2. Rockström, J.; Williams, J.; Daily, G.; Noble, A.; Matthews, N.; Gordon, L.; Wetterstrand, H.; DeClerck, F.; Shah, M.; Steduto, P. Sustainable intensification of agriculture for human prosperity and global sustainability. Ambio 2017, 46, 4–17. [Google Scholar] [CrossRef] [PubMed]
  3. Paudel, B.; Radovich, T.J.; Chan-Halbrendt, C.; Crow, S.; Tamang, B.; Halbrendt, J.; Thapa, K. Effect of conservation agriculture on maize-based farming system in the mid-hills of Nepal. Procedia Eng. 2014, 78, 327–336. [Google Scholar] [CrossRef]
  4. Van den Putte, A.; Govers, G.; Diels, J.; Gillijns, K.; Demuzere, M. Assessing the effect of soil tillage on crop growth: A meta-regression analysis on European crop yields under conservation agriculture. Eur. J. Agron. 2010, 33, 231–241. [Google Scholar] [CrossRef]
  5. Barzegar, A.; Asoodar, M.; Khadish, A.; Hashemi, A.; Herbert, S. Soil physical characteristics and chickpea yield responses to tillage treatments. Soil Tillage Res. 2003, 71, 49–57. [Google Scholar] [CrossRef]
  6. Blanco-Canqui, H.; Francis, C.A. Building resilient soils through agroecosystem redesign under fluctuating climatic regimes. J. Soil Water Conserv. 2016, 71, 127A–133A. [Google Scholar] [CrossRef]
  7. Uzun, O.; Kaplan, S.; Basaran, M.; Deviren Saygın, S.; Youssef, F.; Nouri, A.; Ozcan, A.U.; Erpul, G. Spatial distribution of wind-driven sediment transport rate in a fallow plot in Central Anatolia, Turkey. Arid Land Res. Manag. 2017, 31, 125–139. [Google Scholar] [CrossRef]
  8. Nouri, A.; Youssef, F.; Basaran, M.; Lee, J.; Saxton, A.M.; Erpul, G. The Effect of Fallow Tillage Management on Aeolian Soil Losses in Semiarid Central Anatolia, Turkey. Agrosyst. Geosci. Environ. 2018, 1. [Google Scholar] [CrossRef]
  9. Wade, T.; Claassen, R.L.; Wallander, S. Conservation-Practice Adoption Rates Vary Widely by Crop and Region; United States Department of Agriculture, Economic Research Service: Washington, DC, USA, 2015.
  10. Denton, H.; Tyler, D. Making no-till “conventional” in Tennessee. Mak. Conserv. Tillage Conv. Build. Future 2002, 25, 53–58. [Google Scholar]
  11. Boyer, C.N.; Lambert, D.M.; Larson, J.A.; Tyler, D.D. Investment Analysis of Cover Crop and No-Tillage Systems on Tennessee Cotton. Agron. J. 2018, 110, 331–338. [Google Scholar] [CrossRef]
  12. Howard, D.; Gwathmey, C.; Roberts, R.; Lessman, G. Potassium fertilization of cotton produced on a low K soil with contrasting tillage systems. J. Prod. Agric. 1998, 11, 74–79. [Google Scholar] [CrossRef]
  13. Mbuthia, L.W.; Acosta-Martínez, V.; DeBruyn, J.; Schaeffer, S.; Tyler, D.; Odoi, E.; Mpheshea, M.; Walker, F.; Eash, N. Long term tillage, cover crop, and fertilization effects on microbial community structure, activity: Implications for soil quality. Soil Biol. Biochem. 2015, 89, 24–34. [Google Scholar] [CrossRef]
  14. Bottinelli, N.; Angers, D.A.; Hallaire, V.; Michot, D.; Le Guillou, C.; Cluzeau, D.; Heddadj, D.; Menasseri-Aubry, S. Tillage and fertilization practices affect soil aggregate stability in a Humic Cambisol of Northwest France. Soil Tillage Res. 2017, 170, 14–17. [Google Scholar] [CrossRef]
  15. Kibet, L.C.; Blanco-Canqui, H.; Jasa, P. Long-term tillage impacts on soil organic matter components and related properties on a Typic Argiudoll. Soil Tillage Res. 2016, 155, 78–84. [Google Scholar] [CrossRef]
  16. Parkin, G.; von Bertoldi, A.P.; McCoy, A.J. Effect of tillage on soil water content and temperature under freeze–thaw conditions. Vadose Zone J. 2013, 12. [Google Scholar] [CrossRef]
  17. Lentz, R.D.; Bjorneberg, D.L. Polyacrylamide and straw residue effects on irrigation furrow erosion and infiltration. J. Soil Water Conserv. 2003, 58, 312–318. [Google Scholar]
  18. Acar, M.; Celik, I.; Günal, H. Effects of long-term tillage systems on aggregate-associated organic carbon in the eastern Mediterranean region of Turkey. Eurasian J. Soil Sci. 2018, 7, 51–58. [Google Scholar] [CrossRef]
  19. Al-Kaisi, M.; Douelle, A.; Kwaw-Mensah, D. Soil microaggregate and macroaggregate decay over time and soil carbon change as influenced by different tillage systems. J. Soil Water Conserv. 2014, 69, 574–580. [Google Scholar] [CrossRef] [Green Version]
  20. Alam, M.K.; Salahin, N.; Islam, S.; Begum, R.; Hasanuzzaman, M.; Islam, M.; Rahman, M. Patterns of change in soil organic matter, physical properties and crop productivity under tillage practices and cropping systems in Bangladesh. J. Agric. Sci. 2017, 155, 216–238. [Google Scholar] [CrossRef]
  21. Villamil, M.B.; Little, J.; Nafziger, E.D. Corn residue, tillage, and nitrogen rate effects on soil properties. Soil Tillage Res. 2015, 151, 61–66. [Google Scholar] [CrossRef] [Green Version]
  22. Nakajima, T.; Lal, R. Tillage and drainage management effect on soil gas diffusivity. Soil Tillage Res. 2014, 135, 71–78. [Google Scholar] [CrossRef]
  23. Kroulík, M.; Hůla, J.; Šindelář, R.; Illek, F. Water infiltration into soil related to the soil tillage intensity. Soil Water Res. 2007, 2, 15–24. [Google Scholar] [CrossRef]
  24. Pittelkow, C.M.; Linquist, B.A.; Lundy, M.E.; Liang, X.; Van Groenigen, K.J.; Lee, J.; Van Gestel, N.; Six, J.; Venterea, R.T.; Van Kessel, C. When does no-till yield more? A global meta-analysis. Field Crops Res. 2015, 183, 156–168. [Google Scholar] [CrossRef] [Green Version]
  25. Nouwakpo, S.K.; Song, J.; Gonzalez, J.M. Soil structural stability assessment with the fluidized bed, aggregate stability, and rainfall simulation on long-term tillage and crop rotation systems. Soil Tillage Res. 2018, 178, 65–71. [Google Scholar] [CrossRef]
  26. Mendoza, R.; Franti, T.; Doran, J.W.; Powers, T.O.; Zanner, C. Tillage effects on soil quality indicators and nematode abundance in Loessial soil under long-term no-till production. Commun. Soil Sci. Plant Anal. 2008, 39, 2169–2190. [Google Scholar] [CrossRef]
  27. Blanco-Canqui, H.; Lal, R. Soil and crop response to harvesting corn residues for biofuel production. Geoderma 2007, 141, 355–362. [Google Scholar] [CrossRef]
  28. Spiegel, H.; Dersch, G.; Hösch, J.; Baumgarten, A. Tillage effects on soil organic carbon and nutrient availability in a long-term field experiment in Austria. Die Bodenkultur 2007, 58, 47–58. [Google Scholar]
  29. López-Garrido, R.; Madejón, E.; León-Camacho, M.; Girón, I.; Moreno, F.; Murillo, J. Reduced tillage as an alternative to no-tillage under Mediterranean conditions: A case study. Soil Tillage Res. 2014, 140, 40–47. [Google Scholar] [Green Version]
  30. Grossman, R.; Reinsch, T. 2.1 Bulk density and linear extensibility. Methods Soil Anal. Part 4 Phys. Methods 2002, 4, 201–228. [Google Scholar]
  31. Kemper, W.; Rosenau, R. Aggregate Stability and Size Distribution. Methods Soil Anal. 1986, 9, 425–442. [Google Scholar]
  32. Larney, F.J.; Lindwall, C.W.; Bullock, M.S. Fallow management and overwinter effects on wind erodibility in southern Alberta. Soil Sci. Soc. Am. J. 1994, 58, 1788–1794. [Google Scholar] [CrossRef]
  33. Youker, R.; McGuinness, J. A short method of obtaining mean weight-diameter values of aggregate analyses of soils. Soil Sci. 1957, 83, 291–294. [Google Scholar] [CrossRef]
  34. Reynolds, W.; Elrick, D.; Youngs, E.; Amoozegar, A.; Booltink, H.; Bouma, J. 3.4 Saturated and field-saturated water flow parameters. Methods Soil Anal. 2002, 4, 797–801. [Google Scholar]
  35. Philip, J.R. The theory of infiltration: 4. Sorptivity and algebraic infiltration equations. Soil Sci. 1957, 84, 257–264. [Google Scholar] [CrossRef]
  36. SAS Institute. Base SAS 9.4 Procedures Guide: Statistical Procedures; SAS Institute: Cary, NC, USA, 2017. [Google Scholar]
  37. Saxton, A. DandA. sas: Design and Analysis Macro Collection Version 2.11; University of Tennessee: Knoxville, TN, USA, 2013. [Google Scholar]
  38. Fernández-Ugalde, O.; Virto, I.; Bescansa, P.; Imaz, M.; Enrique, A.; Karlen, D. No-tillage improvement of soil physical quality in calcareous, degradation-prone, semiarid soils. Soil Tillage Res. 2009, 106, 29–35. [Google Scholar]
  39. Leij, F.J.; Ghezzehei, T.A.; Or, D. Modeling the dynamics of the soil pore-size distribution. Soil Tillage Res. 2002, 64, 61–78. [Google Scholar] [CrossRef]
  40. Blanco-Canqui, H.; Stone, L.; Schlegel, A.J.; Lyon, D.; Vigil, M.; Mikha, M.; Stahlman, P.; Rice, C. No-till induced increase in organic carbon reduces maximum bulk density of soils. Soil Sci. Soc. Am. J. 2009, 73, 1871–1879. [Google Scholar] [CrossRef]
  41. Schjønning, P.; Rasmussen, K.J. Soil strength and soil pore characteristics for direct drilled and ploughed soils. Soil Tillage Res. 2000, 57, 69–82. [Google Scholar]
  42. Tabaglio, V.; Gavazzi, C.; Menta, C. Physico-chemical indicators and microarthropod communities as influenced by no-till, conventional tillage and nitrogen fertilisation after four years of continuous maize. Soil Tillage Res. 2009, 105, 135–142. [Google Scholar] [CrossRef]
  43. Carter, M.; Sanderson, J.; Ivany, J.; White, R. Influence of rotation and tillage on forage maize productivity, weed species, and soil quality of a fine sandy loam in the cool–humid climate of Atlantic Canada. Soil Tillage Res. 2002, 67, 85–98. [Google Scholar] [CrossRef]
  44. Salem, H.M.; Valero, C.; Muñoz, M.Á.; Rodríguez, M.G.; Silva, L.L. Short-term effects of four tillage practices on soil physical properties, soil water potential, and maize yield. Geoderma 2015, 237, 60–70. [Google Scholar] [CrossRef] [Green Version]
  45. Kihara, J.; Martius, C.; Bationo, A.; Thuita, M.; Lesueur, D.; Herrmann, L.; Amelung, W.; Vlek, P.L. Soil aggregation and total diversity of bacteria and fungi in various tillage systems of sub-humid and semi-arid Kenya. Appl. Soil Ecol. 2012, 58, 12–20. [Google Scholar] [CrossRef]
  46. Barzegar, A.; Yousefi, A.; Daryashenas, A. The effect of addition of different amounts and types of organic materials on soil physical properties and yield of wheat. Plant Soil 2002, 247, 295–301. [Google Scholar] [CrossRef]
  47. Mikha, M.M.; Rice, C.W. Tillage and manure effects on soil and aggregate-associated carbon and nitrogen. Soil Sci. Soc. Am. J. 2004, 68, 809–816. [Google Scholar] [CrossRef]
  48. Angers, D.; Samson, N.; Legere, A. Early changes in water-stable aggregation induced by rotation and tillage in a soil under barley production. Can. J. Soil Sci. 1993, 73, 51–59. [Google Scholar] [CrossRef] [Green Version]
  49. Six, J.; Elliott, E.; Paustian, K. Soil macroaggregate turnover and microaggregate formation: A mechanism for C sequestration under no-tillage agriculture. Soil Biol. Biochem. 2000, 32, 2099–2103. [Google Scholar] [CrossRef]
  50. Hamidi, A.; Jedari, S. Investigating the consolidation behavior of contaminated clay. Sharif Civ. Eng. J. 2011, 29, 29–35. [Google Scholar]
  51. Farahani, C.J.M. Permeability and Compression Characteristics of Clay Contaminated with Kerosene and Gasoil. Mapta 2018, 1, 26–36. [Google Scholar]
  52. Singh, B.; Malhi, S. Response of soil physical properties to tillage and residue management on two soils in a cool temperate environment. Soil Tillage Res. 2006, 85, 143–153. [Google Scholar] [CrossRef]
  53. Brady, N.C.; Weil, R. Nature and Properties of Soils, The Pearson New International Edition; Pearson Higher: London, UK, 2013. [Google Scholar]
  54. De Rouw, A.; Huon, S.; Soulileuth, B.; Jouquet, P.; Pierret, A.; Ribolzi, O.; Valentin, C.; Bourdon, E.; Chantharath, B. Possibilities of carbon and nitrogen sequestration under conventional tillage and no-till cover crop farming (Mekong valley, Laos). Agric. Ecosyst. Environ. 2010, 136, 148–161. [Google Scholar] [CrossRef]
  55. Blanco-Canqui, H.; Wienhold, B.J.; Jin, V.L.; Schmer, M.R.; Kibet, L.C. Long-term tillage impact on soil hydraulic properties. Soil Tillage Res. 2017, 170, 38–42. [Google Scholar] [CrossRef]
  56. Strudley, M.W.; Green, T.R.; Ascough, J.C., II. Tillage effects on soil hydraulic properties in space and time: State of the science. Soil Tillage Res. 2008, 99, 4–48. [Google Scholar] [CrossRef]
  57. Soracco, C.G.; Villarreal, R.; Lozano, L.A.; Vittori, S.; Melani, E.M.; Marino, D.J. Glyphosate dynamics in a soil under conventional and no-till systems during a soybean growing season. Geoderma 2018, 323, 13–21. [Google Scholar] [CrossRef]
  58. Kumar, S.; Anderson, S.H.; Udawatta, R.P.; Kallenbach, R.L. Water infiltration influenced by agroforestry and grass buffers for a grazed pasture system. Agrofor. Syst. 2012, 84, 325–335. [Google Scholar] [CrossRef]
  59. Huang, M.; Liang, T.; Wang, L.; Zhou, C. Effects of no-tillage systems on soil physical properties and carbon sequestration under long-term wheat–maize double cropping system. Catena 2015, 128, 195–202. [Google Scholar] [CrossRef] [Green Version]
  60. Bacigaluppo, S.; Bodrero, M.; Balzarini, M.; Gerster, G.; Andriani, J.; Enrico, J.; Dardanelli, J. Main edaphic and climatic variables explaining soybean yield in Argiudolls under no-tilled systems. Eur. J. Agron. 2011, 35, 247–254. [Google Scholar] [CrossRef]
  61. Franchini, J.C.; Debiasi, H.; Junior, A.A.B.; Tonon, B.C.; Farias, J.R.B.; de Oliveira, M.C.N.; Torres, E. Evolution of crop yields in different tillage and cropping systems over two decades in southern Brazil. Field Crops Res. 2012, 137, 178–185. [Google Scholar] [CrossRef]
  62. Nouri, A.; Lee, J.; Yin, X.; Tyler, D.D.; Saxton, A.M. Thirty-four years of no-tillage and cover crops improve soil quality and increase cotton yield in Alfisols, Southeastern USA. Geoderma 2019, 337, 998–1008. [Google Scholar] [CrossRef]
  63. Karlen, D.L.; Kovar, J.L.; Cambardella, C.A.; Colvin, T.S. Thirty-year tillage effects on crop yield and soil fertility indicators. Soil Tillage Res. 2013, 130, 24–41. [Google Scholar] [CrossRef] [Green Version]
  64. USDA-NASS. Quick Stats; USDA-NASS: Washington, DC, USA, 2016.
Figure 1. Experimental design of the long-term soybean tillage experiment at the West Tennessee Research and Education Center, Jackson, TN, USA.
Sustainability 10 04696 g001
Figure 2. Depth distribution of cone penetration resistance (PR) as affected by tillage systems. CP, chisel plow; DP, disk plow; MP, moldboard plow; NT, no-tillage; NTW, no-tillage with winter wheat cover crop. Horizontal bars on Y-axis are the LSD values (p < 0.05) at each depth increment. * is significant at p < 0.05; ** is significant at p < 0.01.
Sustainability 10 04696 g002
Figure 3. Wet aggregate stability as affected by different tillage systems at two sampling depths. Means followed by different letters within each sampling depth are significantly different based on Fisher’s Least Significant Difference (LSD) at p < 0.05.
Sustainability 10 04696 g003
Figure 4. Distribution of all aggregate size classes at 0–15 and 15–30 cm soil depths under five tillage systems. CP, chisel plow; DP, disk plow; MP, moldboard plow; NT, no-tillage; NTW, no-tillage with winter wheat cover crop. Different letters in bars indicate significant difference among treatments at each specific size class within each depth (p < 0.05). ns: not significant (p < 0.05).
Sustainability 10 04696 g004
Figure 5. Initial and cumulative infiltration, field-saturated hydraulic conductivity and sorptivity as affected by tillage systems. CP, chisel plow; DP, disk; MP, moldboard plow; NT, no-tillage; NTW, no-tillage with winter wheat cover crop. Normality of distribution was accepted by Shapiro-Wilk (p > 0.05). Treatment means were not significant across tillage treatments for all measured parameters based on Fisher’s Least Significant Difference (LSD) (p < 0.05).
Sustainability 10 04696 g005
Figure 6. Soybean grain yield as influenced by tillage systems in 2015 and mean soybean yield during the last five years (2011–2015). The vertical error bars represent the standard error. The horizontal solid line represents the mean soybean yield in Tennessee in 2015 and dashed line represents the mean soybean yield in the US in 2015 [64]. Different letters on the bars are significantly different based on Fisher’s Least Significant Difference (LSD) at p < 0.05. ns, not significant.
Sustainability 10 04696 g006
Table 1. Bulk density (BD), penetration resistance (PR), and total porosity (TP), as affected by tillage systems at 0–15 and 15–30 cm soil depths.
BDPRTP
(Mg m−3)(MPa)(%)
Tillage treatments0–15 cm
CP1.47(0.005) a1.60(0.08) cd44.6(0.18) b
DP1.43(0.01) b1.92(0.15) ab45.9(0.49) a
MP1.45(0.009) ab1.34(0.07) d45.2(0.33) ab
NT1.46(0.01) a2.17(0.15) a44.9(0.45) b
NTW1.48(0.006) a1.77(0.11) bc44.1(0.24) b
15–30 cm
CP1.50(0.03) ns2.96(0.30) ns43.4(1.32) ns
DP1.44(0.03)3.11(0.09)45.7(1.30)
MP1.50(0.01)2.56(0.18)43.4(0.31)
NT1.46(0.03)3.08(0.07)44.9(1.19)
NTW1.49(0.01)2.74(0.26)43.7(0.26)
ANOVA (p value)
Depth (A)0.030.0010.03
Depth (B)0.450.110.44
Depth0.21<0.00010.21
T*D0.740.530.74
CP, chisel plow; DP, disk plow; MP, moldboard plow; NT, no-tillage; NTW, no-tillage with winter wheat cover crop. Values in parenthesis are standard errors. Means followed by different letters within a column in each soil depth are significantly different based on Fisher’s Least Significant Difference (LSD) at p < 0.05. ns, not significant.
Table 2. Parameters derived from dry aggregate size fractionation as affected by tillage and cropping managements. GMD, geometric mean diameter; MWD, mean weight diameter; MA, fraction of macroaggregates (>2 mm); SMA, fraction of small macroaggregates (0.25–2 mm); MIA, fraction of microaggregates (0.05–0.25 mm).
GMD (mm)MWD (mm)MA%SMA%MIA%
Management0–15 cm soil depth
CP 1.45(0.11) bc2.50(0.07) c47.97(2.63) cd42.68(0.94) a5.65(1.15) ab
DP1.82(0.12) b2.77(0.07) b52.45(1.90) bc40.40(1.35) ab4.60(0.78) bc
MP1.26(0.09) c2.34(0.08) c42.52(1.92) d44.42(1.57) a7.35(0.76) a
NT2.32(0.19) a2.99(0.05) a56.91(1.11) ab37.53(0.63) b3.26(0.43) c
NTW2.35(0.13) a3.04(0.05) a58.33(1.58) a36.51(2.28) b2.44(0.34) c
15–30 cm soil depth
CP1.29(0.06) bc2.34(0.05) bc40.69(1.49) bc48.67(1.01) ns5.82(0.48) ns
DP1.34(0.13) bc2.39(0.11) b42.95(2.32) ab45.68(1.04)7.03(0.59)
MP1.13(0.01) c2.14(0.06) c37.11(1.09) c49.98(0.38)7.45(0.65)
NT1.51(0.05) b2.51(0.02) ab44.09(0.96) ab48.57(1.88)4.63(0.79)
NTW1.76(0.10) a2.68(0.10) a46.59(1.38) a45.63(1.64)5.68(1.08)
ANOVA (p value)
Depth (A)0.0001<0.00010.00040.0090.004
Depth (B)0.0010.0040.0090.120.05
Depth<0.0001<0.0001<0.0001<0.00010.004
T*D0.020.170.150.090.14
CP, chisel plow; DP, disk; MP, moldboard plow; NT, no-tillage; NTW, no-tillage with winter wheat cover crop. Values in parenthesis are standard errors. Means followed by different letters within a column in each soil depth are significantly different based on Fisher’s Least Significant Difference (LSD) at p < 0.05. ns, not significant.

