Firm Size and the Business Model for Sustainable Innovation


Department of Graphic Design and Engineering Projects, Faculty of Engineering in Bilbao, University of the Basque Country, 48013 Bilbao, Spain
*
Author to whom correspondence should be addressed.
Sustainability 2018, 10(12), 4785; https://doi.org/10.3390/su10124785
Submission received: 21 October 2018
/
Revised: 10 December 2018
/
Accepted: 11 December 2018
/
Published: 14 December 2018
(This article belongs to the Collection Firm Size and Sustainable Innovation Management)
Abstract
:Companies innovate towards sustainability because this may allow them to improve both their socio-environmental and economic performance. Firms that lead the way evolve towards a sustainable business model. However, small and large businesses face different challenges. This research therefore analyses the role of firm size in the business model developed towards sustainable innovation. The sample was obtained from the database of companies that make up the Global Reporting Initiative. The projects presented in the reports were seen as vehicles to support sustainable innovation. The method used was quantitative content analysis. The results show that the size of the company influences on how the supply chain and the financial elements of the business model are developed.
Keywords:
sustainable innovation; business model; firm-size; SME; MNE; innovation projects; GRI; content analysis; SEM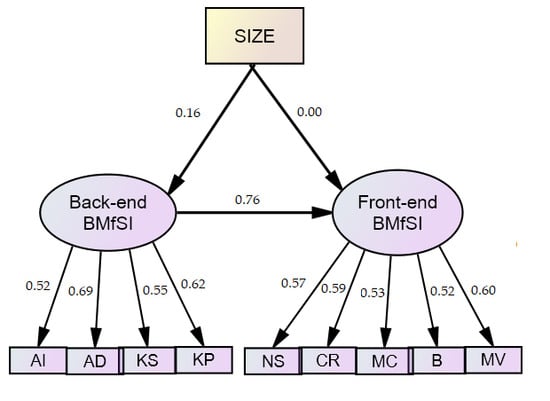
1. Introduction
Innovation is a topic of great interest because it gives companies a competitive advantage, and it can modify the structure of an industry and the economy of a country [1]. In particular, innovation for sustainability has enabled companies to perform better in the social and environmental dimensions while improving their financial performance [2]. Most companies innovate incrementally: first, to comply with regulations and avoid waste; second, to improve their supply chain; third, to design new products or services; and finally, for the most sophisticated innovation stage, the conversion of the business model [3,4,5].
The decision to implement these changes may be reactive due to pressure from stakeholders. It can also be a strategic decision of a proactive or anticipatory nature [3,6], such as, for example, in the case of companies preparing for the transition to a circular economy [7]. Innovation in the business model can be considered a key driver for competitive strategy [8,9,10,11] because it is a more effective mechanism than innovation in the product or operations. In comparison with the company’s competitors, more costs can be reduced, new markets can be exploited [12] or radical changes can be created in existing markets [3].
Size has a moderating effect on the transformation of the business model [13], according to a study by Zott and Amit [14]. Large companies have more resources to undertake new products or projects which, if successful, can be implemented on a larger scale and made profitable through better access to large markets [15]. In contrast, Uhlaner et al. [6] argue that SMEs transform their business model faster because they are more flexible, and managers are closer to operational levels, being able to make decisions more dynamically [16,17,18]. Bocken et al. [10] also assert that start up and small businesses can quickly change their business model towards sustainability. Once proven successful, they force large companies to change and it is these that could deliver sustainability on a larger scale. Although there is no clear consensus regarding the effect of size on innovation for sustainability, the authors agree that SMEs and large firms innovate differently and face different challenges [3]. In particular, large companies need to reduce their organizational inertia [19,20] and the SMEs must increase their cooperative capacity to overcome their lack of resources and capacities.
The results show that the size of the company influences on how the supply chain and the financial elements of the business model are developed. This quantitative empirical study complements one of the most cited theories with regard to the business model for sustainable innovation. Boons and Lüdeke-Freund [21] formulated four propositions for sustainable innovation, one for each element of the business model. First, we have derived hypotheses from their propositions. Second, we use quantitative content analysis to translate the theoretical assumptions into statistical analysis. Up to now, empirical studies describing sustainable business models are case studies [22]. Our study provides the quantitative demonstration which serves to generalize the results.
This paper consists of the following parts. The literature review explains the role that size plays in each of the components of the sustainable business model and sets out the various hypotheses. Section 3 explains why it is necessary to analyze projects in order to observe innovation towards sustainability. It also explains the use of corporate GRI reports and exemplifies the method of analysis to collect the data. Section 4 presents the analysis of the results and Section 5 discusses the results in light of the literature review. Section 6 presents the main conclusions, theoretical contributions, and recommendations for future approaches.
2. Literature Review
Geissdoerfer et al. [11] compiled the main business model definitions proposed in the last decade, from the conceptualization of Stubbs and Cocklin [23] to the definition put forward by Evans et al. [24]. Some of the elements common to all these definitions are: the integration of environmental and social activities, the consideration of globalization and localization processes, consideration of new stakeholders, the temporal impact, the use of indicators, the internalization of socio-environmental costs and the fundamental role played by innovation so that all these elements combine to create truly sustainable value [21].
Geissdoerfer et al. [11] also distinguished four types of innovation in business models: start up, transformation in the business model, diversification in the business model, and merge or acquisition of the business model. In our study, we start from the assumption that firm size plays an important role in this classification. A start up can be a small company, whilst transformation of the business model can also be carried out by SMEs. However, innovation through diversification, as well as the merger and acquisition of new business models, are more typical of large companies because they have more resources to implement these changes. An alternative to the lack of resources in SMEs to innovate through for diversification or acquisition may be the diffusion of the business model by replicability and mimicry in different markets [25].
Gauthier and Gilomen [26] identified another typology based on how companies modify the elements of their business model. In their research, they analyzed 13 participating organizations in two sustainable urban projects. The results indicate that organizations mainly apply adjustments, innovation, and redesign in the business model. Adjustment occurs when a company makes small changes to one business model element, such as value proposition in order to participate in sustainability-oriented projects. Business model innovation is said to have occurred if a company modifies several of its business model elements, such as the supply chain and the consumer interface. Finally, redesign occurs if a company reconfigures all of the business model elements to deliver new value propositions to the market. This type of innovation depends to a greater extent on whether the company adopts accommodative, reactive, or proactive behavior to gain a competitive advantage while providing sustainability [27].
Once companies have assumed that innovating the business model towards sustainability is a strategic decision that offers opportunities, the next question would be: how to innovate? And considering the size of an organization, in what part of the business processes should resources be invested to improve the capture and delivery of value? And furthermore, what requirements should the business model meet in order to innovate towards sustainability and, at the same time, be successful in the market?
Some of the most frequently cited answers to these questions are provided by Boons and Lüdeke-Freund [21]. They propose several requirements for sustainable innovation in each of the four main blocks of the business model: the value proposition, the supply chain, the consumer interface, and the financial model. Adopting the concepts of Boons and Lüdeke-Freund [21] as well as those of Osterwalder and Pigneur [28], several business model canvases have been proposed. These include the flourishing business canvas [29], the triple-layered business model canvas [30], and the circular business model canvas [7]. The aim of these tools is to encourage companies to rethink the way in which they configure their activities to deliver value. In our study, we also took into account the proposal of Boons and Lüdeke-Freund [21]. However, we believe that, in each of the four blocks, large companies, and SMEs face different challenges, and these differences have not been considered in the above-mentioned literature. In the following section, we will explain the particularities of organizations according to their size.
2.1. Firm Size and the Value Proposition for Sustainable Innovation
The literature reveals a trend towards the notion of a positive relationship between the size of a firm and its innovative activities towards sustainability. This argument is based on the fact that large companies have more resources and intentions to innovate their value proposition [6,20], with the objective of increasing the portfolio of products and services they offer to consumers [31].
Another literature stream asserts that sustainability-oriented SMEs have a competitive advantage when their value proposition is based on delivering materials or intermediate products to larger firms using a business-to-business (B2B) configuration [32], or in alliances with other SMEs to complement capabilities [3,33].
The literature also recognizes that large, sustainability-oriented companies succeed with a customer-oriented product configuration (B2C) whilst medium-sized companies are successful when they direct their innovation towards their role as suppliers (B2B). However, it is also true that a B2C configuration could work in a small company. This happens in two cases, the first when an SME innovates its business model to deliver a product with radical innovation [3,15] and the second when we talk about a sustainable venture [19]. The entry of new products alters the market and can cause large companies to gradually imitate these new products or services. However, large firms do not rapidly imitate this approach of adopting technologies or disruptive models because their organization is different, they have more inertia, and decisions are made at various levels.
Bocken et al. [10] propose that one of the ways to innovate in value proposition is through the delivery of functionality, rather than product. In this model, the product is still important, but the owner of the product is not the customer, but the company. Whilst the customer would pay for the experience or use of the product, they would not pay for ownership. Large companies could better sustain this archetype because they have the resources and technologies to manage all the physical assets that customers would use. However, SMEs also play a role in this scenario because, thanks to their flexibility, they are better able to participate in the maintenance, repair, and upgradability of the goods.
As can be observed in Box 1, Boons and Lüdeke-Freund [21] proposed two requirements that need to be met by the value proposition for sustainable innovation. The first requirement is that the value proposition has clear metrics of its ecological and/or social value. This is necessary because, as Veit et al. [34] explain, customers demand more transparency in the process of creating and sourcing products. The information they receive has an impact on their perception of the firm’s sustainability and hence their loyalty to the brand.
Box 1. Value proposition: requirements for sustainable innovation.
“The value proposition provides measurable ecological and/or social value in concert with economic value. The value proposition reflects a business-society dialog concerning the balance of economic, ecological and social needs as such values are temporally and spatially determined. For existing products, a particular balance is embedded in existing practices of actors in the production and consumption system; for new products or services, such a balance is actively being struck among participants in the evolving alternative network of producers, consumers, and other associated actors.” (Boons and Lüdeke-Freund [21] p. 13)
The second requirement is that a social dialogue exists and that this is reflected in a balance between the actors in the generation of the value proposition.
For the first requirement—i.e., the existence of social and environmental metrics in the value proposition—it is necessary for companies to have integrated environmental management or accounting systems in their operations that record the data so that they can be transmitted to the end customer. For example, Phillip’s “Pay per Lux” is a PSS performance model based on which customers pay for a promised level of luminance in a building [35]. In this type of business model, data management is necessary so that the customer is aware of consumption and the revenue of the company. There is evidence that, unlike large firms, small firms lack “environmental management system” technology (EMS) information systems [36]. Some reasons for this include the high cost, the difficulty of implementation, and the incompatibility between the rigidity of the systems and the flexibility of the SMEs. Technological sophistication for storing information—which is more common in large enterprises—allows data to be collected and transmitted to the consumer [37,38].
Authors such as Hockerts and Wüstenhagen [19] argue that large companies invest more in social dialogue because they are more exposed in large and diverse markets. In these companies, reputation is an intangible asset that they wish to protect and promote with innovation projects related to the community [39], as well as with innovation projects that make it possible to adjust to legislative regulations in different environments [40] in order to avoid a bad image derived from legal problems. Some ways of communicating sustainability-oriented innovation are, for example, eco labelling, corporate reports, indicators, etc.
The social dialogue between SMEs is different, where the activity is more directed towards the local market, and is close or very specific, and in these cases it may be the client who takes the initiative to advise what innovations are needed [24]. This type of dialogue is evidenced by the fact that, in general, SMEs are reactive and make innovations at the customer’s request. This makes sense, because having a B2C configuration, it is the customer who requests changes and turns the SME into a reactive rather than proactive operation. According to the taxonomy of circular business models, SMEs optimize materials because they “produce on demand” [7].
The next requirement of the value proposition for sustainable innovation is the evidence of a balance between the stakeholders involved in the value chain or the consumption. The purpose of creating a balance in consumption is to maximize the use of products through the sharing of underutilized products between the community or between companies, by, for instance, peer-to-peer collaboration of cars, energy, computers, or clothing [7]. The use of technology platforms allows various types of organizations to participate in these models regardless of size. However, in this type of collaboration, the revenue is also shared, so large companies acquire and merge these new models as soon as they are identified. In this point, large firms have a negative relationship with sustainability due to their greater bargaining power, which means they tend to obtain greater profits than their suppliers or even their own customers [31]. In contrast, SMEs are more dependent on other companies to undertake innovation projects.
Hypothesis 1a (H1a):
The size of the company influences how it measures and communicates its social and environmental values.
Hypothesis 1b (H1b):
The size of the company influences the establishment of balance among the members of the value chain and consumption.
2.2. Firm Size and the Supply Chain for Sustainable Innovation
Innovating in the supply chain is one of the first steps companies take on their way to sustainability [2,3,4]. This strategy may arise from the obligation to comply with legislation, or from pressure from stakeholders. Companies also innovate in their supply chain to maximize material and energy efficiency, generate less waste, create less pollution, and reduce costs through the optimized use of materials [3,7,10].
As can be observed in Box 2, according to Boons and Lüdeke-Freund [21], it is necessary to work with suppliers committed to sustainable innovation. However, the size of an organization significantly shapes its strategic behavior within the industry [41].
Box 2. Supply chain: requirements for sustainable innovation.
“The supply chain involves suppliers who take responsibility towards their own as well as the focal company’s stakeholders. The focal company does not shift its own socio-ecological burdens to its suppliers. This condition requires that a firm actively engages suppliers into sustainable supply chain management, which includes, for example, forms of social issue management and materials cycles that avoid/reuse wastes.” (Boons and Lüdeke-Freund [21] p. 13)
Large companies and SMEs have different perspectives on partners in their supply chains [32]. For SMEs, collaboration and coopetition are fundamental mechanisms in innovation towards sustainability [3,6,17,33,36,41,42,43,44,45]. Thanks to the increased decision-making power of the owners, small businesses are dynamic and respond quickly to changing environments. However, unlike large companies, they lack the personnel with specific skills to innovate. Cooperation helps to overcome these limitations [3,36], and to integrate external knowledge [5,45,46] in order to increase their capacity for innovation. Similarly, partnering helps SMEs to reduce costs in co-production [42] and to obtain more profits, particularly when they are part of networks, R&D consortia, or innovation clusters together with brokers or technology institutes and universities [39,45].
On the other hand, authors such as Bouncken and Fredrich [31] argue that large companies have more options for choosing suppliers. The greater the enterprise, the greater the density of the employee network, and its favorable position in the industrial network gives it more bargaining power [41]. According to Triguero et al. [44] SMEs prefer to associate with large firms, because they perceive them as more stable for doing business, and exchange or cooperation activities are more reciprocal [41]. Huergo [37] also acknowledges the advantages of large companies due to their diversity of options, along with vertical or horizontal integration, but does not consider this factor to be determinant in the success of innovations for sustainability.
In SMEs, the lack of knowledge of new suppliers and the contraposition of objectives towards sustainable innovation can lead to the failure of innovation projects [33]. This is one of the reasons why SMEs prefer to ally with local and close partners [6,36]. Veit et al. [34] consider that locality and sustainability are connected. The partnership between geographically close SMEs is beneficial because it can result in a decrease in energy consumption due to the transport of materials, it may solve labor and social problems close to SMEs, and it may activate local trade [3].
Large companies need small companies as providers to make their supply chain more dynamic. SMEs, thanks to their organizational flexibility, can respond to the needs of large companies faster than the company itself, providing innovative or intermediate products to generate modular assemblies [32].
The second requirement proposed by Boons and Lüdeke-Freund [21] for a sustainable innovation-oriented supply chain, is that companies do not divert their socio-environmental duties to suppliers. In this respect, it is argued that larger companies can better manage their environmental impacts: they have EMS (environmental management systems) in place, certifications and quality systems; they use indicators to monitor their activities [47], manage waste, improve their energy efficiency [3], prevent pollution in production, use alternative energies, and recycle [20]. Large companies are more exposed and in order to reduce pressure from stakeholders, they need to be perceived as an organization geared towards reducing negative environmental impacts [29]. To lower manufacturing costs, large companies tend to outsource production, pollution and poor working conditions to suppliers located in developing countries, where sustainability regulations fail to protect the rights of society and the environment. However, today’s media and social networks can quickly spread word of the problems originating at the manufacturing site and these become associated with the company that sells the product to the end customer. Veit et al. [34] refer to this phenomenon as “association by guilt”. Large companies are increasingly forced to extend to their suppliers the same sustainability parameters that their buyers desire.
SMEs are less subject to environmental regulations in comparison with larger companies. Their smaller organizational structure is not always compatible with the formalities of an EMS or with quality protocols [3]. Moreover, due to their size, they produce a lower volume of waste and have less environmental impact.
Hypothesis 2a (H2a):
The size of the company influences the mechanisms of collaboration with key partners.
Hypothesis 2b (H2b):
The size of the company influences the diversion of social and environmental burdens to the rest of the supply chain.
2.3. Firm Size and the Customer Interface for Sustainable Innovation
The prestige of a company is an intangible capital that wants to maintain, or better still, increase when innovating for sustainability [34]. As can be observed in Box 3, Boons and Lüdeke-Freund [21] recommend that customers and stakeholders be encouraged to take responsibility for their consumption. For this, it is necessary for the company to know what could stimulate a client to participate proactively in the reduction of the socio-environmental impact of their own consumption. Lewadowski et al. [7] and Bocken et al. [10] advocate the implementation of a take-back system in the business, so that customers return the products after first use. To achieve this, it is necessary that there is a change of attitude in the consumer, achieved through environmental awareness campaigns in which customers engage and know the full history of the manufacture of goods that are produced both locally and globally.
Box 3. Customer interface: requirements for sustainable innovation.
“The customer interface motivates customers to take responsibility for their consumption as well as for the focal company’s stakeholders. The focal company does not shift its own socioecological burdens to its customers. Customer relationships are set up with recognition of the respective sustainability challenges of differently developed markets as well as company-specific challenges resulting from its individual supply chain configuration.” (Boons and Lüdeke-Freund [21] p. 13)
The study by Pekovik and Rolland [48] suggests that company size is a contextual factor influencing customer-oriented sustainable innovation, favoring large companies. Large companies, being more exposed to public opinion, invest a great deal of effort into preserving the prestige of their brand in the face of sustainability [6]. They also have greater resources to monitor patterns of change in the market. Customers prefer to participate in innovation projects with larger companies because their brand is more known and reliable [46]. For a large company, it is easier to attract specialized personnel to manage the dynamics of innovation, the transmission of information, and the capacity to absorb knowledge [46]. On the other hand, small firms have more difficulty in convincing customers to buy into the idea of sustainable innovation due to lack of technical skills, poor management capacity in innovation projects, and lack of necessary infrastructure.
Although they have fewer resources, SME companies do understand that integrating the client is an indispensable factor for innovation and sustainability [33]. SMEs can overcome the lack of resources and knowledge when they interact directly with their customers, for example, on ICT-based technology platforms.
Customers bring to SMEs new ideas regarding their product [39] and create a social learning network among various stakeholders. In SMEs, owners or managers are closer to their customers and, once knowledge is internalized and transferred, they can make decisions faster and get products to market more rapidly than large companies. When it comes to sustainability, the market niches are different. An SME with good sustainability performance interacts with customers who prefer to purchase local and environmentally-friendly products [34] and, rather than expand into new markets, prefer to innovate within their niche. In short, it appears that to motivate clients to be sustainable, the advantage of the large firms is that they have more options and resources. The advantage of SMEs is that they can interact with their close customers, retain their loyalty, and respond in less time [34].
Consumers want to feel that companies are taking responsibility for their pollution, even in the place of production. When this is not the case, the brand loses social capital, prestige, and market value [6,20]. With these risks in mind, and to avoid the association by guilt [34], large companies invest more resources to innovate in cleaner infrastructure, by, for example, encouraging cleaner production, implementation of environmental monitoring systems (EMS), innovative packaging, or awareness-raising campaigns for customers to return disused products for recycling by manufacturers [29].
In contrast, SME companies are less exposed. The production and generation of waste is also lower. SMEs are often suppliers to large companies and are limited to meeting their customer’s requirements. Lack of resources and technological systems limit the creation of indicators to monitor their own waste.
Hypothesis 3a (H3a):
The size of the company influences the adoption of strategies to motivate customers towards sustainability.
Hypothesis 3b (H3b):
The size of the company influences the adoption of strategies to outsource socio-environmental burdens to customers.
Hypothesis 3c (H3c):
The size of the company influences the communication with customers on the social and environmental impact.
2.4. Firm Size and the Financial Model for Sustainable Innovation
As can be observed in Box 4, at least two requirements should be met in the financial model: Accounting for socio-environmental impacts and a fair distribution of economic costs and benefits among actors in the value chain [21].
Box 4. Financial model: requirements for sustainable innovation.
“The financial model reflects an appropriate distribution of economic costs and benefits among actors involved in the business model and accounts for the company’s ecological and social impacts.” (Boons and Lüdeke-Freund [21] p. 13)
It is easier for large companies to attract investors [36]. They are also more informed about how to receive subsidized loans to implement sustainability-oriented innovations [37]. The fixed cost structure in large companies is more complex [36], and therefore one of the first initiatives is the implementation of lifecycle costing since by virtue of valuing cost in environmental analysis they also improve financial performance [3].
According to Hockerts and Wüstenhagen [19], in comparison with small companies, large companies tend to innovate more towards the integration of environmental accounting systems. This criterion is shared by Johnson [47] who argues that socio-environmental accounting and involvement in creating corporate reports are positively associated with size. For example, when a company accounts for its energy expenditure, it is more likely to have initiatives to save energy, save costs, have more financial benefits, and commit to innovation for sustainability [6].
Biondi et al. [5] propose that to improve environmental performance a good alternative is to implement technological solutions either as environmental management software to account for impacts [36] or as organizational innovations such as ISO or EMAS [3]. Lewandowski et al. [7] go further, and propose that the existing metrics are insufficient for a sustainable future, and it is necessary to complement these with percentages of the income obtained from, for instance, repair, reuse, and second hand use. Generally, large companies are the first to adopt these innovations to increase the perception that they are environmentally friendly [44].
The second requirement is the appropriate distribution of costs and benefits among the actors involved in the value chain. While large companies attract more investors [36], it is also true that profits are more committed to shareholders, and CEOs have less say in how they are distributed. In addition, large companies have more bargaining power vis-à-vis their suppliers or the SMEs participating in the market, and are therefore in a stronger position to take advantage in order to recover the economic benefits [31].
In contrast, SMEs are much more dependent on their partners and wish to maintain good relations within their network and the markets in which they operate, which are usually closer [36]. For example, family business managers have more decision-making power over a diverse range of stakeholders and use this to maintain their reputation.
Hypothesis 4a (H4a):
The size of the company influences the implementation of socio-environmental impact accounting systems.
Hypothesis 4b (H4b):
The size of the company influences the appropriate distribution of economic costs and benefits along the value chain.
3. Materials and Methods
Yang et al. [38] argue that innovation is a multidimensional construct, which requires changes in products, processes, and organizational nature. Therefore, any study of innovation should take into account inputs, outputs, intermediate outputs, and mediators.
In research on innovation, the indicators most commonly used to measure innovation are R&D expenditure [16,37,49,50], the number of patents [3,20], publications, or the number of personnel hired for research. However, these indicators, although related, do not mean that they materialize into an innovation. R&D expenditure is only an input to the innovation process [16,50] and has no linear relationship with the innovation itself [37]. Moreover, unlike large companies, SMEs do not always record their innovative investments in R&D [49]. Patents are a moderator but not necessarily a direct indicator of innovation [20,37]. Innovation goes beyond an invention [3] because it must be put into practice in the market [16]. For these reasons, it is necessary to look for more complementary indicators, particularly in the field of sustainability.
One of the indicators that fits the argument of Yang et al. [38] is that of the project. The project is a temporary organization that uses company resources to implement changes inside or outside the company. According to Stock et al. [16] (p. 539), innovation dynamics require a series of projects over time and cite Barnett and Clarck [51] (p. 264) who stated that “the entire sweep of technological changes over the past hundred years is, in essence, the sum of thousands of individuals product development projects in thousands of firms”.
In the same line of thought, Yu et al. [20] argue that projects are vehicles for exploring sustainable innovations whilst Rahman et al. [49] suggest that a company’s capacity to manage projects affects its capacity to innovate towards sustainability.
For this study, we have decided to analyze the projects carried out by companies related to the Global Reporting Initiative (GRI). In her study on SMEs and sustainable innovation, Bos-Brouwers [36] argues that corporate reports are a source of information that reflects the issues that companies are interested in communicating and implementing in socio-environmental concerns.
Gray et al. [52] were the first to create a database based on corporate reports for research purposes. This method has particularly been used in research on accounting, communication, and sustainability. There are important efforts to motivate companies to adopt the IR framework of GRI to show their efforts towards sustainability [53]. However, these reports are not without debate. Studies such as that of Lock and Seele [54] have employed the content analysis method to assess the credibility of reports. In their study, company size is not a determining factor, but their results suggest that lack of understanding and standardization do have an effect on credibility. This study will also contribute to this debate because a methodical analysis of the projects reflected in the GRI reports allows for inferring, firstly, whether the company is innovating its products, its processes or its image and, secondly, the level of innovation towards sustainability.
In order to analyze the projects disclosed in GRI companies, we have used quantitative content analysis [55,56] as a method. According to Neuendorf [56] and Krippendorff [55], in order to carry out this analysis, evaluation criteria must be created based on the literature. When the criteria are met, the data should be coded within variables. After that, the variables should be treated with statistical techniques, appropriate to the purpose of the study. To examine how projects fit with the notion of innovation towards sustainability, a checklist derived from the literature review has been created (Table A1). The check-list is made up of the requirements that need to be met for a business model for sustainable innovation (BMfSI) in order to innovate towards sustainability. The business model is recognized as an analytical tool [21,57] that connects the strategy with the operative level, serves to examine business units that co-exist within the company [14], and can be applied to assess innovation projects [58].
The GRI database is publicly accessible (http://database.globalreporting.org) and contains the corporate reports of the companies, classified by year, size, country and region. For this study, all the integrated corporate reports named G4 were downloaded. This type of report contains information on the three dimensions: economic, social, and environmental. The documents were downloaded only once, in October 2015. A total of 174 available reports were downloaded and the projects described in each one were reviewed. The projects are varied in nature. Some companies undertook product or service innovations, others improved their supply chain, whilst some companies undertook projects only to enhance their image within the community or to implement environmental monitoring systems. Thanks to the check-list derived from the theoretical framework, the projects could be graded. In total, 255 projects were found and analyzed. The analysis and coding of projects was carried out by four people with academic and professional training in Project Management. The projects were analyzed from January to March 2016. In order to calibrate the responses and reach consensus on the criteria, six meetings were held.
The most appropriate way to measure the size of a company is still an issue that has not been sufficiently resolved. However, Dang et al. [59] conducted one of the few comparative studies and while recognizing that no measure captures all the characteristics of a company, they suggested some criteria on how to measure company size according to the purpose of the research. For example, total assets give an indication of the total resources with which a company has to operate, market capital indicates growth opportunities, and total sales are used to give information regarding other competitors that have a product in the market.
From the point of view of sustainability and innovation, some types of measures are more relevant than others. For example, the number of employees in SMEs influences their ability to innovate cooperatively, as well as their flexibility in decision-making. On the other hand, large companies have more capacity to attract employees with more skills or knowledge in research and sustainable development.
Total assets are also a measure of interest, and according to Dang et al. [59] this can be an index of diversification and investment policies. Innovation in any of the components of a business model requires resources and management support.
Another measure, such as market cap, is also appropriate because it may represent mergers and acquisitions. If a large company identifies new business models in start-up companies, it is very likely that it will acquire them.
For this study we have considered, for guidance, the approach employed by Dang et al. [59] and adopted the perspective of the Global Reporting Initiative, based on local or European Union regulations.
To define the size of the company, the GRI database uses the following criteria (https://www.globalreporting.org/SiteCollectionDocuments/GRI-Data-Legend-Sustainability-Disclosure-Database-Profiling.pdf):
Box 5 illustrates the analysis of a project reported by the Royal BAM Group (http://database.globalreporting.org/reports/31213/). The top of the box is a copy of part of the company’s GRI report. The lower part shows the evaluation of the research team. It reflects the assessment of the implementation of the requirements of the business model for sustainable innovation (BMfSI).
Box 5. Assessment of the low energy asphalt innovation project guided by the requirements of business model for sustainable innovation (BMfSI).
Extracted from the GRI Memory of the Company Royal BAM Group
In general BAM emits greenhouse gasses through the nature of its business. Production of asphalt is one of BAM’s carbon intensive activities. BAM can further improve the emissions from its asphalt plants by producing more low energy asphalt (LEAB), which currently awaits wider market acceptance, particularly from governmental clients.
LEAB stands for low energy asphalt concrete. Using LEAB, BAM offers an innovative technology that contributes positively to the natural and living environment. LEAB is sustainable asphalt that lasts as long as conventional asphalt concrete and is just as resistant to road damage, but results in a cleaner living environment. The LEAB-mixture is made at a lower temperature (100 instead of 160 degrees centigrade), resulting in 30–40% energy saving and 30% reduction of CO2 emissions. In addition, the mixture consists of 60% recycled asphalt that is, in turn, fully recyclable. Up to now 250,000 tonnes of LEAB have been applied in more than 150 infrastructure projects, of which 118,000 tonnes were used in 2014.
In order to investigate the potential of this new type of asphalt to create value for society, BAM commissioned a true price study. The study indicated that placing LEAB instead of conventional stone mastic (matrix) asphalt (STAB) creates an estimated €257,000 less negative impact on the environment per kilometer of highway. This equals the monetized environmental externalities (often referred to as ‘environmental cost’) of energy use of about 120 Dutch households per year. To calculate the true price, the main environmental impacts of asphalt production were measured and translated into societal costs. The results show that the production, use, and end-of-life treatment of LEAB asphalt is associated with 30 per cent lower environmental costs than conventional asphalt. Coincidentally, this equals the reduction in energy and CO2 reduction, but is composed of other factors. This makes LEAB an undeniable proposition amongst other government procurers, since it has the same quality, an equal or lower market price, and a better environmental performance than conventional asphalt.
The study provided BAM with insight into the size of environmental impacts occurring in the asphalt production chain, and made those impacts comparable (…) Energy use, material use, and ecotoxicity are the largest remaining environmental externalities for LEAB. True price methods support better decision making. The results help BAM to steer future innovations and prove that sustainable innovations, such as LEAB, can create value for society without causing additional financial costs.
……
On 6 March 2014, BAM and six other parties in the construction supply chain, signed a letter of intent with the municipality of Amsterdam to make supply chains more sustainable. The parties will cooperate on closing the raw material loops in demolition, refurbishment and new construction projects. This initiative fits in with the efforts of the municipality and BAM to create a ‘circular economy’ in which they minimize consumption of raw materials and energy … BAM uses a tool to measure supplier performance. During project preparation, implementation and follow-up, the tool assesses suppliers against the themes of safety, quality, total cost, logistics and engineering, and process. Operating companies have the opportunity to add any specific criteria. On a scale of 1 to 4, each supplier has to score at least 3 for each criterion. In 2014 a total of 5372 supplier performance assessments were carried out.
In 2014 BAM approached approximately 1600 of its largest suppliers in the Netherlands to request and assist them to calculate their emissions and propose reduction measures … By means of a survey amongst its A-list suppliers, BAM attempted to measure its impact on suppliers’ performance on relevant themes. For example, suppliers were asked to what extent their work with and for BAM has led to increased safety or decreased energy usage. BAM will use the results to highlight its value creation process with its supply chain.
Evaluation of the Components of the Business Model for Sustainable Innovation.
- Measurable ValueThe value proposition provides to users a measurable ecological and/or social value in concert with economic value = 1
- BalanceA balance between stakeholders is not embedded in the design, production, and consumption = 0
- Key PartnersInvolves suppliers who take responsibility for their own as well as the focal company’s stakeholder = 1
- Shift socio-ecological burdens to its suppliersThe company does not shift its own socio-ecological burdens to its suppliers = 1
- Motivates Consumer for their consumptionDoes not motivate user to take responsibility for their consumption as well as for the focal company’s stakeholders = 0
- Shifts their own socio-ecological burden to its customer:Does not shift their own socio-ecological burden to its customer = 1
- Customer Relationship:Are not set up with recognition of the respective sustainability challenges = 0
- Distribution of economic costs and benefits:Inappropriate distribution of economic cost and benefits = 0
- Accounting for impacts:Accounts for the ecological and social impacts = 1
Taking into consideration the list of statistical techniques proposed by Neuendorf [56] (p. 170) and the purpose of our study, we have decided to do three analyses. First an ANOVA (F-test) to find the relationships between the firm size and each of the characteristics of the business model. Second, a factor analysis to find the relationships among the set of variables of the business model. Finally, a SEM to find causal relationships between the size and the factors that emerge from the factor analysis.
On the other hand, as a limitation of the study, we point out that the non-random selection of the sample and the possible omission of variables in the model could have originated the presence of endogeneity. However, given that dependent variables and possible endogenous regressors follow a binomial distribution, it has been decided not to implement corrective measures in this respect since there is widespread skepticism in the literature about whether the application of any of the correction alternatives really generates estimates consistent with these conditions [60,61,62].
4. Results
As a starting point, the size factor is expected to have a positive value in the inclusion of sustainability: the larger the company, the more sustainability can be observed.
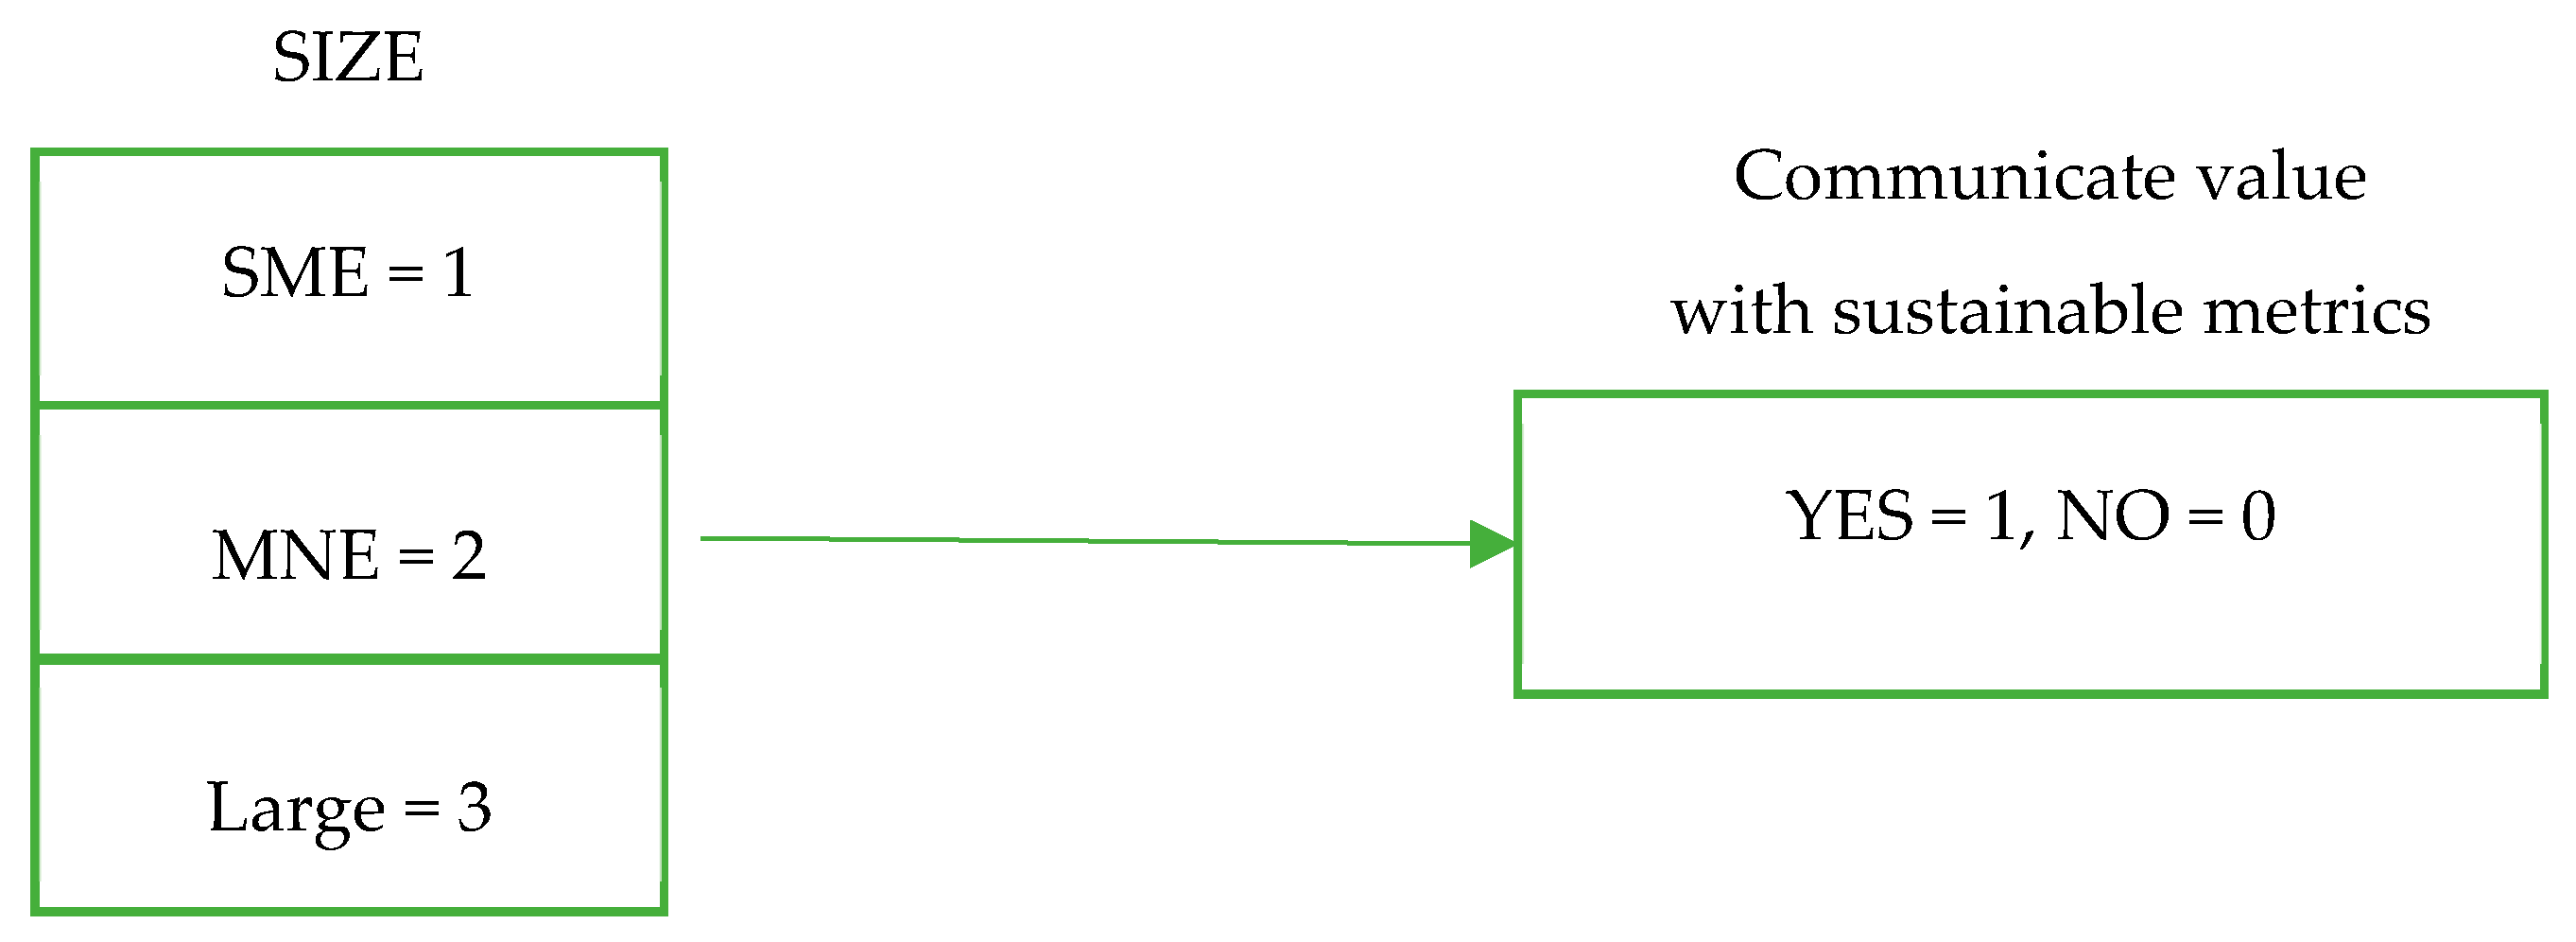
Size is an independent and trichotomic variable. It represents three categories of companies according to their size: (small and medium SME = 1, multinational (MNE) = 2, and large = 3).
Table 3 describes the requirements of the components of the business model for sustainable innovation (BMfSI) and how to assess them. Each variable represents a requirement with two values (meets requirement = 1, does not meet requirement = 0). For example, the variable “measurable value” assumes a value of 1 when the company provides customers with sustainability metrics alongside economic metrics. When the company does not meet this criterion, the variable assumes the value 0. The format of this argument is represented in the structure of Figure 2. The arrow indicates the direct effect of size on communication to the company’s customers through socio-environmental metrics. The appropriate technique for analysis is a one-way ANOVA (F-test).
Ten variables were created for the analysis. The trichotomous variable SIZE is independent. The following nine variables belong to the business model for sustainable innovation (BMfSI) that has been used to put forward the hypotheses. Table 3 summarizes the variables, along with the frequency of valuations.
The ANOVA (F-test) makes multiple pairwise comparisons. This test compares the means of the three categories: Category 1 is made up of SME (small and medium-sized) companies, Category 2 of MNE (multinational) companies, and Category 3 includes large companies.
The null and alternative hypotheses are presented in the following way:
- Null: The average number of companies that include sustainability criteria for innovation is the same in the SME, large, and MNE categories (μSME = μLARGE = μMNE).
The mean of the categories (SME, large, and MNE) are equal and therefore the differences found can be explained by chance. In other words, the null hypothesis states that the categories come from populations with equal means.
- Alternative: The average number of companies that include sustainability criteria for sustainability differs between the SME, large, and MNE categories.
The alternative hypothesis is that at least one of the categories (SME, large, and MNE) has a mean that differs significantly from the rest.
As shown in Table 4, the null hypothesis is accepted for three variables:
- Balance (F = 0.95, Sig = 0.392 > 0.05)
- Motivates customers to take responsibility for their consumption (F = 0.135, Sig = 0.874 > 0.05)
- It does not divert burdens to customers (F = 1.866, Sig = 0.157 > 0.05)
In these three cases, the mean of the three categories are the same (μSME = μLARGE = μMNE). This means that the size of the company does not have a statistically significant effect on its behavior.
For the remaining variables, the null hypothesis is rejected and the alternative hypothesis is accepted: at least one of the categories (SME, large, or MNE) has a mean that is different from the rest.
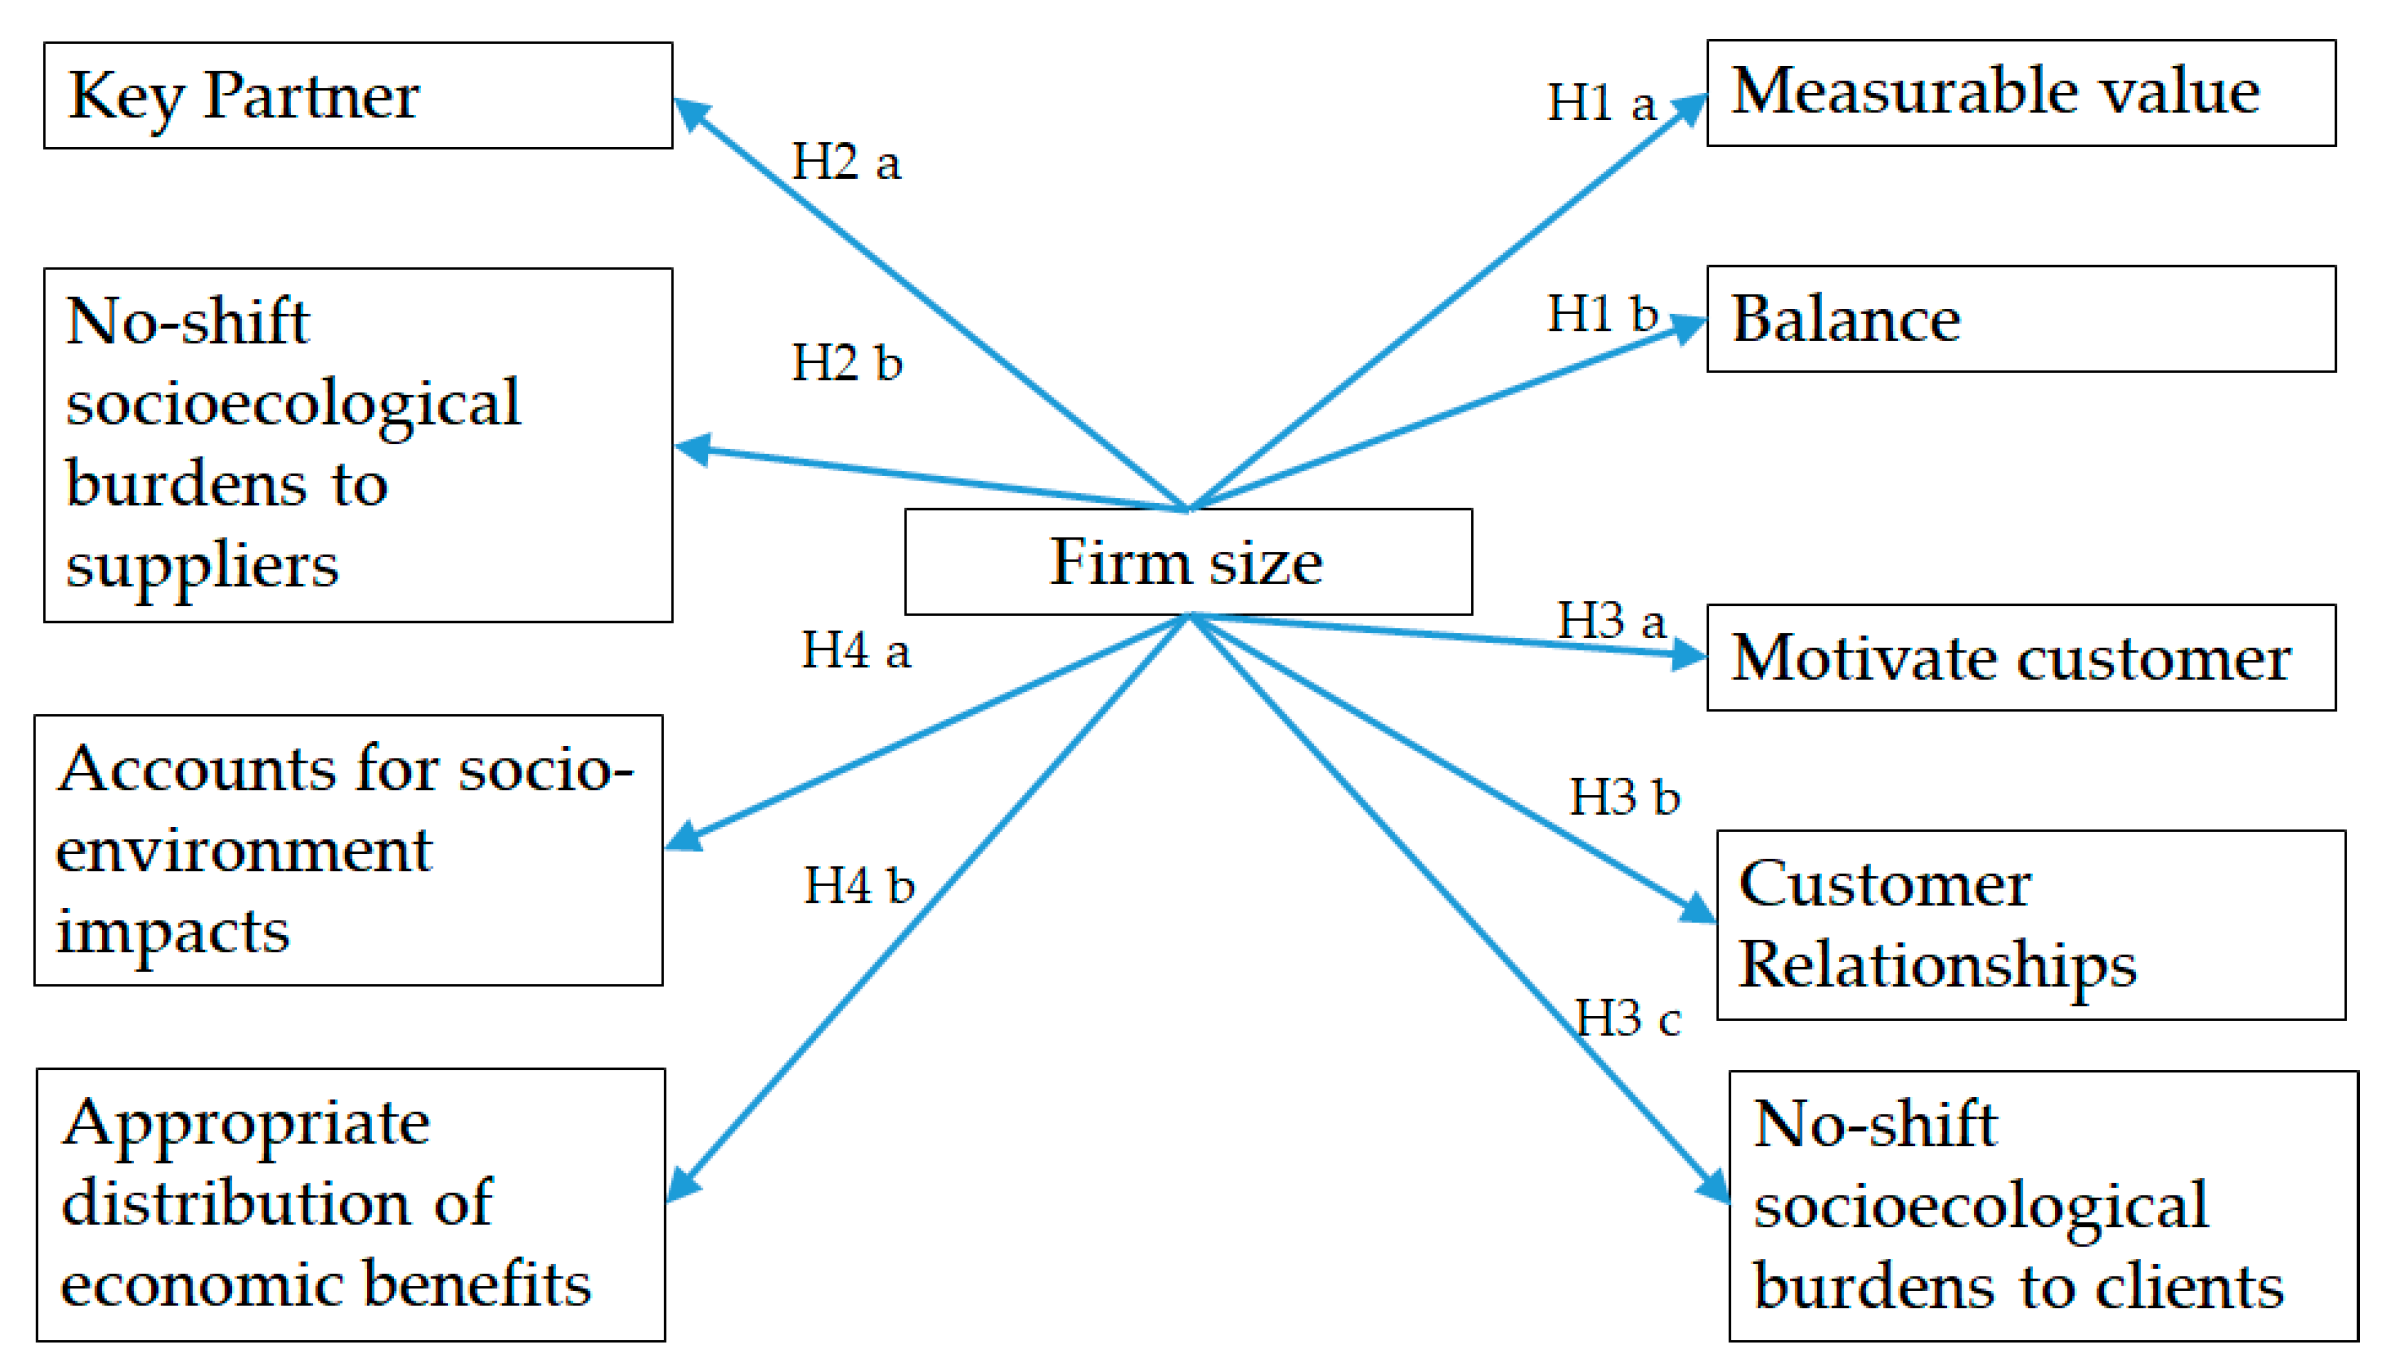
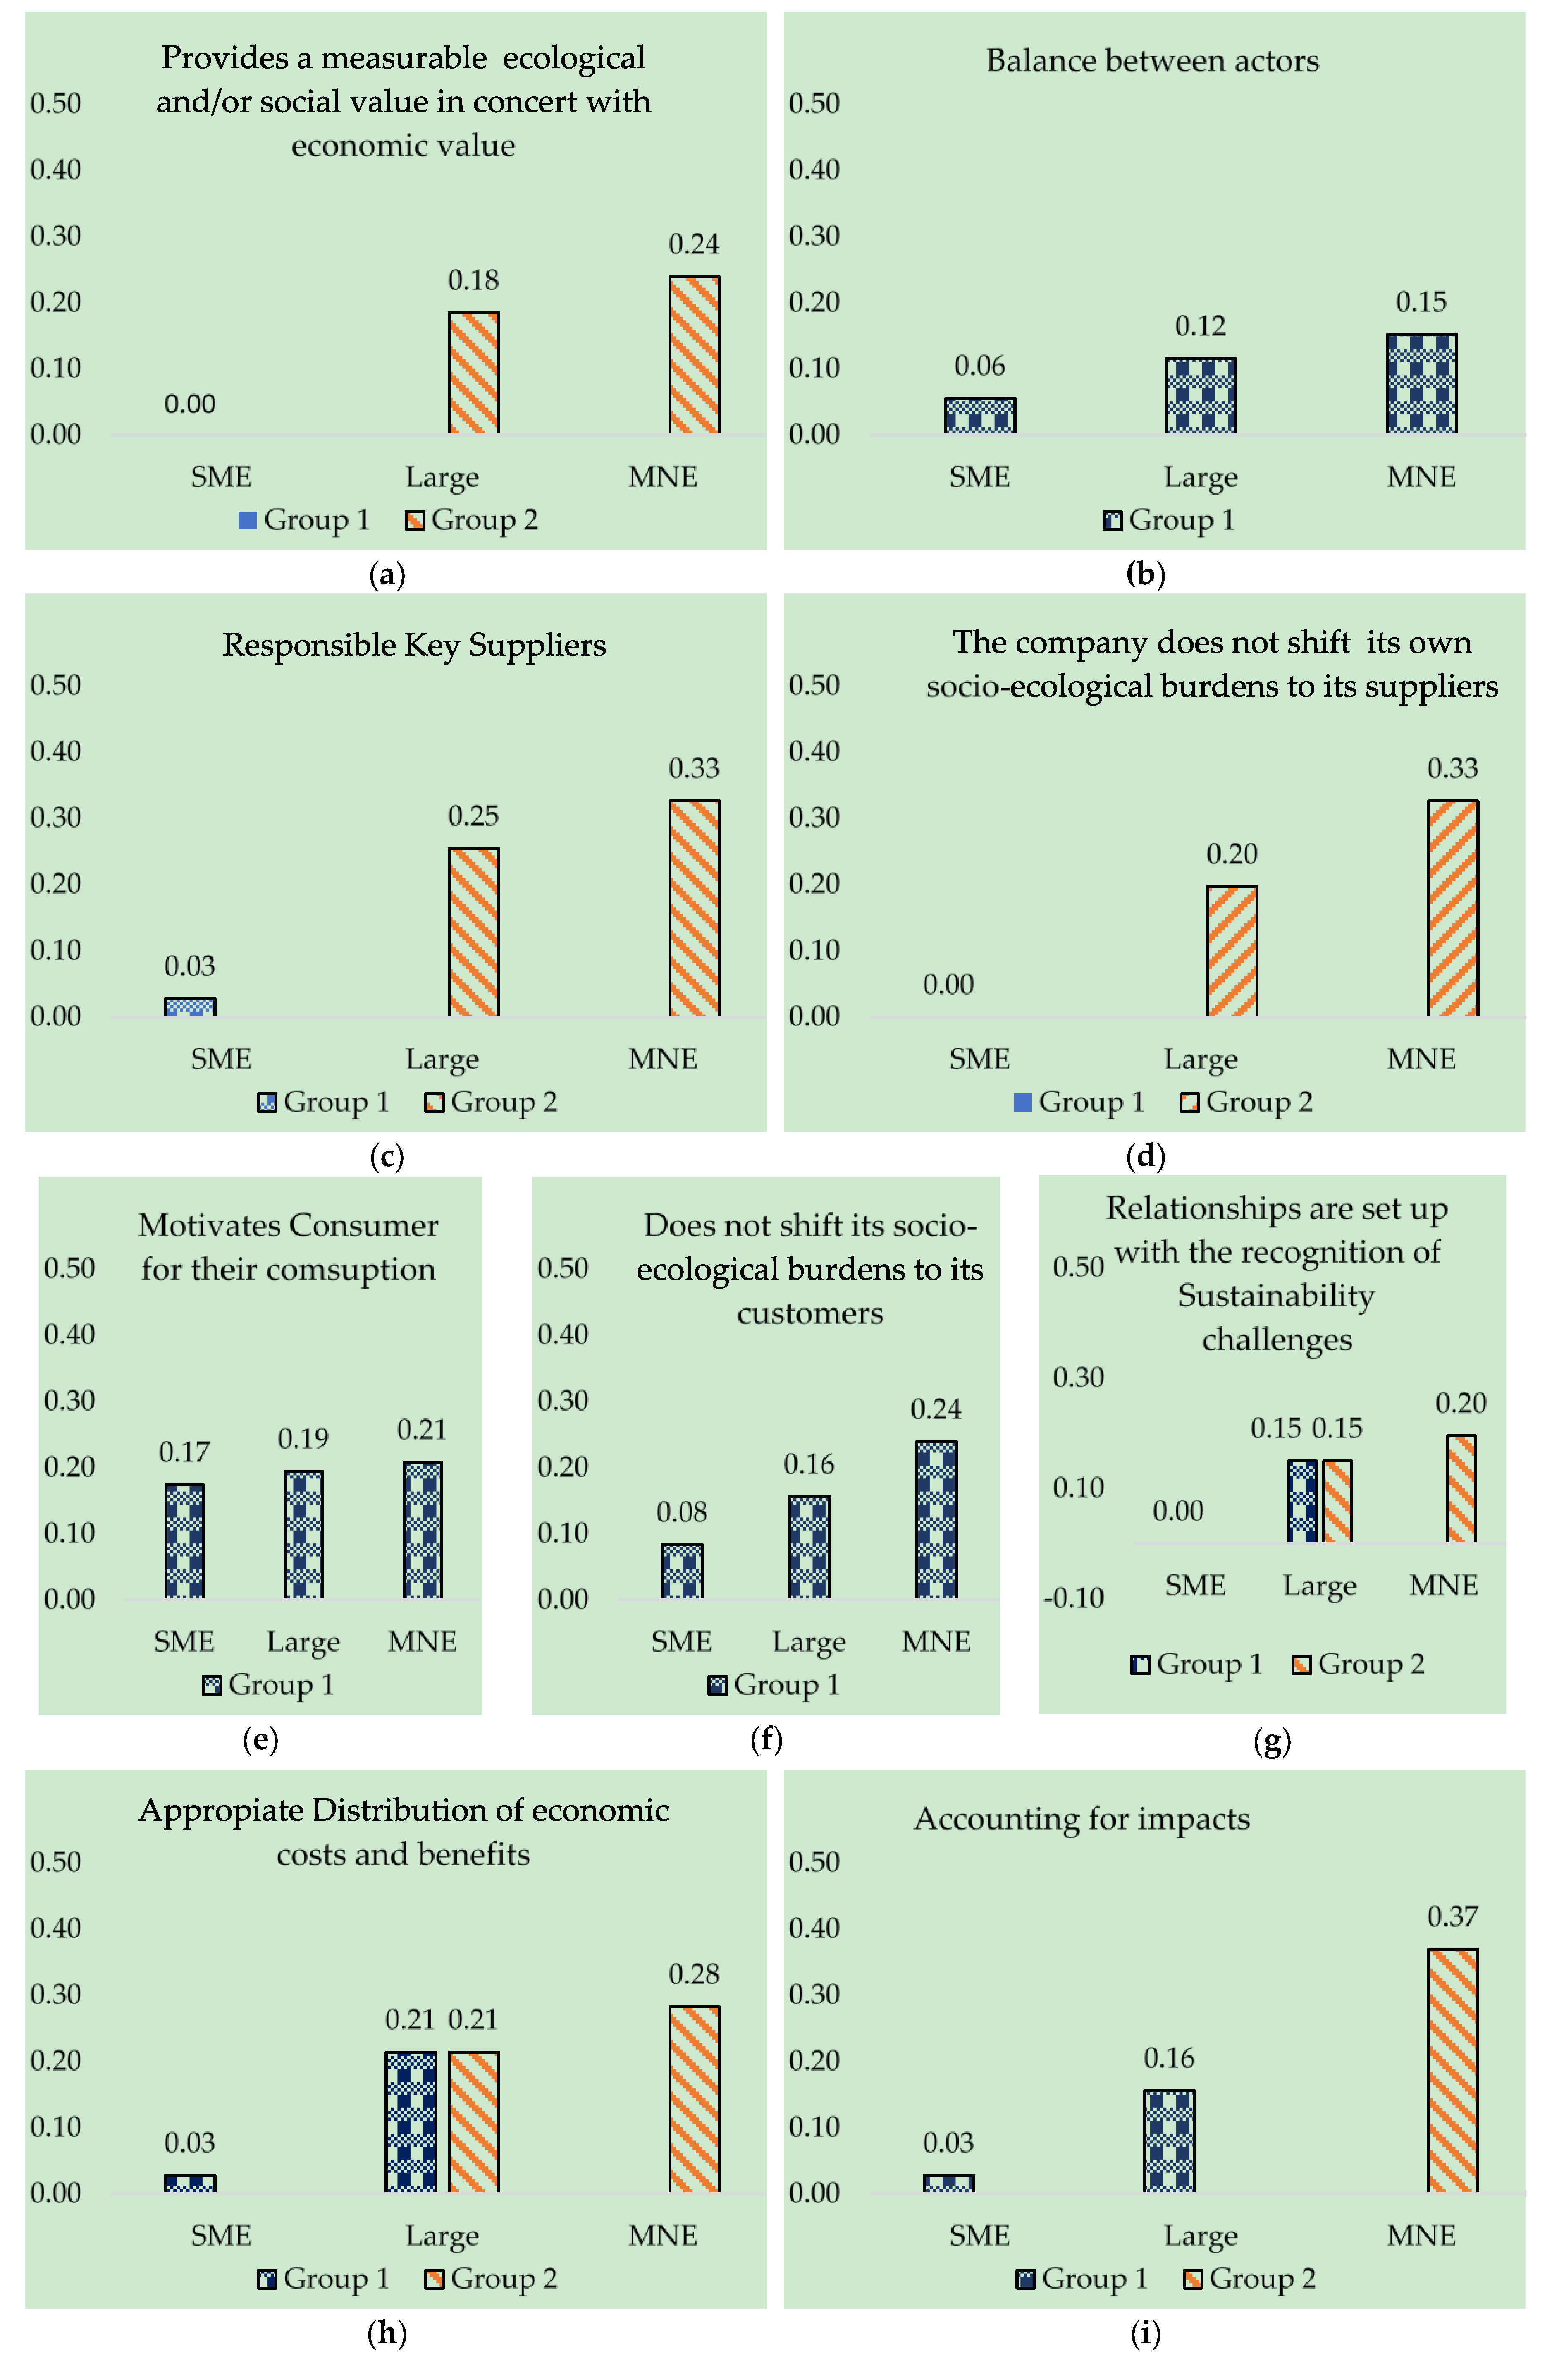
The ANOVA test (F-test) indicates whether the mean of at least one of the three categories (SME, large, or MNE) is different from the rest, but does not indicate which mean. In order to know in which categories the differences are found, it is necessary to conduct a post-hoc comparison. The post-hoc Scheffe test was used for this purpose. The results are presented in the tables in Table A2, Table A3, Table A4, Table A5 and Table A6 and, for clarity the results are also displayed in Figure 3.
When the mean of one category is (statistically) equal to the mean of another category, the columns have the same color and are associated in a group. For example, in Figure 3c the large bar and the MNE bar have the same color. This means that there is no statistical difference between them (μLARGE = μMNE) and therefore the large category and the MNE category are associated in a single group. The SME bar has another color, its mean is smaller μSME < (μLARGE = μMNE) and thus forms a separate group.
In Figure 3a,c,d two groups are formed, the mean of the SMEs group is lower than the mean of group two, formed by the companies large and MNEs μSME < (μLARGE = μMNE). Figure 3b and Figure 4e,f show again the results of the ANOVA (F-test) in Table 3: There are no significant differences between the means of the three categories (μSME = μLARGE = μMNE).
In the case of Figure 3h,g, two groups are also formed, both of which contain the large companies. This indicates that the mean of large firms is statistically equal to the mean of SME and MNE firms. However, the mean of MNE companies is higher than the mean of SME companies, (μSME = μLARGE) < (μLARGE = μMNE).
Figure 3i indicates that the impacts accounting variable is the same for SME and large companies, which form a group with a lower mean than the impact accounting variable in MNE companies (μSME = μLARGE) < μMNE. Table 5 below summarizes the results of the H1–H4 hypotheses and the comparison between categories.
Figure 4 shows the accepted hypotheses with a thick arrow and the rejected hypotheses with a dashed line.
To understand the relationships between dependent variables, we conducted an exploratory factorial analysis with the SPSS tool. The extraction method is the principal components and varimax rotation method. The results revealed two factors with a total variance of 50.35% (Table 6).
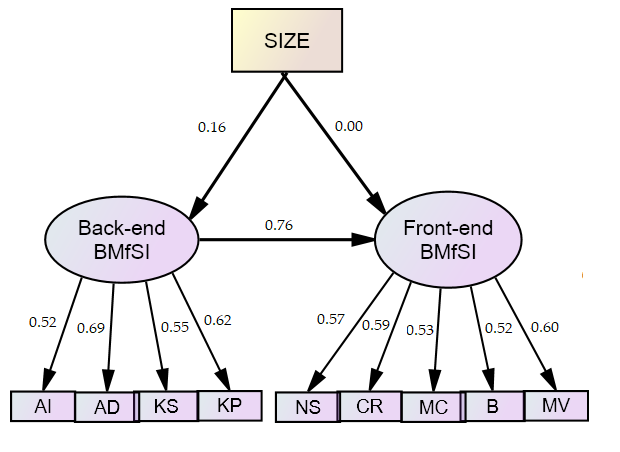
We have named the first factor ‘front-end development of the business model innovation for sustainable innovation (BMfSI)’ and the second factor ‘back-end development of the business model for sustainable innovation (BMfSI)’ (Figure 5). These names correspond to the theoretical constructs of Günzel and Holm [63]. Back-end groups the elements on the left of the business model canvas, which emphasize efficiency, and front-end groups the elements on the right of the business model canvas that emphasize value delivery [28] (p. 49) and customer-oriented innovation [64,65]. The front-end factor BMfSI groups the first five variables of Table 6, and back-end groups the last four variables.
In order to analyze whether firm size has an effect on the back-end and front-end development of the business model for sustainable innovation, a model of structural equations has been proposed. The tool used was AMOS V20 and the results are displayed in Figure 6. The company size variable has an effect on the latent variable back-end development. However, it does not have a statistically significant effect on the latent variable front-end development.
Back-end = 0.16 SIZE − 0.76 Front-end + error1
Front-end = 0.76 Back-end + error2
5. Discussion
The aim of this paper was to examine the effect of company size on innovation towards sustainability. We used the business model for sustainable innovation (BMfSI) developed by Boons and Lüdeke-Freund [21] to analyze the extent to which projects are used to implement sustainability aspects. The data collected in the evaluation of the companies were codified as variables and a quantitative analysis was subsequently conducted in order to draw conclusions.
Factor analysis related the variables and found two constructs, named front-end and back-end development of the BMfSI, based on the concepts of Osterwalder [28] (p. 49) as well as Günzel and Holm [63]. The analysis of the structural equations indicates an effect from the size of the company to the back-end development of the business model. This part of the business model focuses on innovation oriented to improve efficiency [28] (p. 49). The evidence shows that size plays an important role in innovating with the archetype “maximising material and energy efficiency” [10]. The reasons for this effect lie in the availability, by large firms, of resources to carry out technological innovations, attract qualified employees, and implement quality or data management systems.
We found that size does not have a direct effect on the front-end development of the business model for sustainable innovation. This opens up interesting avenues for customer-oriented innovation and experimentation in both large companies and SMEs [63].
In addition, the results suggest that there is a causality from the Back-end development to the front-end development of the BMfSI. The path to innovation in existing companies first moves through the efficiency of the supply chain, subsequently modifying customer-oriented products/services until innovation of the business model is finally complete. These data confirm the arguments put forward by Eccless and Serafein [2] as well as Nidumolu et al. [4].
With respect to the value proposition, large firms deliver more socio-environmental metrics in their value proposition than SMEs. Exposure to larger markets and the pressure exerted by stakeholders create a need to reduce the risk of losing prestige, which is the social capital needed to keep operating. Therefore, large companies invest more in socio-environmental accounting systems, fair trade certifications, or better working conditions. Small businesses have a lower budget for these activities, which may be one of the reasons for not providing this information to clients.
The results show that size does not influence the balance between participants in the consumption and creation of the value proposition. The theory suggests that large firms enjoy greater market power, allowing them to enter into agreements that are in their favor [31]. However, when innovating towards sustainability, Huergo [37] does not consider size to be a determining factor for success. The results suggest that the firms, regardless of their size, do not show characteristics that allow to market products or service that promote functionality over ownership, or sharing to maximize use.
With regard to sustainable innovation in the supply chain, the results indicate that size has a favorable influence on large companies. Factors such as the ease of choosing between several suppliers [31], a favorable position in the industrial network [41], and a lower risk in collaboration alternatives give more opportunities to large firms to choose partners who are committed to socio-environmental objectives.
The results also indicate that large companies are more active in not diverting socio-environmental burdens to suppliers. Some mechanisms for preventing this distribution of burdens include: EMS systems along with quality, energy saving, and recycling programs [20].
The size of the firm does not establish statistical differences in terms of the interface with the client. Firms do not divert burdens to the customers or motivate them to take responsibility for their own consumption. This may be due, in the case of large companies, to their greater public exposure, and in the case of SMEs, to the proximity to their markets.
Size does influence the financial model of sustainability. Accounting for socio-environmental impacts is more frequent in multinational firms. The latter have a business culture more accustomed to working with information technologies interconnected at a global level, and with systems that have control by means of indicators on the saving of materials, energy saving, or the reduction of pollution.
The equitable distribution of economic benefits is lower in SMEs. One of the reasons for this result could be that small businesses perform economically worse than larger businesses. When a company implements a successful business model for sustainable innovation, it is easier to access large markets, capitalize on their investment, and distribute profits [37].
6. Conclusions
This study made use of the analytical tool known as the business model for sustainable innovation (BMfSI) in order to observe the differences between large and small companies with regard to their socio-environmental behavior. This model describes the requirements towards sustainability that must be integrated into its four components: value proposition, supply chain, consumer interface, and financial nodel. An analysis of the fulfillment of these requirements in the reports of the GRI initiative has allowed for examining the behavior of the companies studied here. The method used was quantitative content analysis.
Geissdoerfer et al. [11] states that there is a gap between the design and implementation of sustainable business models. In order to help organizations address this gap, they introduced several research questions, which included the following: What are the challenges an organization faces when creating new, sustainable business models? To partially answer this question, we considered the possibility that firm size plays a key role.
The results suggest that company size is a differentiating element in innovative behavior towards sustainability. This distinction in favor of large companies is mainly evident in the supply chain and the financial model. Important elements such as the measurement and publication of socio-environmental indicators, the involvement of suppliers, and the active inclusion of customers so that they form part of the recycling chain, are issues that should be encouraged for innovation towards sustainability, particularly in the case of small businesses.
The present research, which is of a quantitative empirical nature, complements one of the most cited theories within this area of study. Boons and Lüdeke-Freund [21] formulated four propositions for sustainable innovation, one for each element of the business model. We have derived hypotheses from their propositions and the results have revealed differences due to the size effect. Up to now, empirical studies describing sustainable business models are case studies [22]. Our study provides the quantitative demonstration which serves to generalize the results.
Denchev et al. [66], also called for the use of more mixed methods to advance our understanding in the area of sustainable business models. The proposed method in this paper, that combines quantitative and qualitative approach, would be replicable in other studies.
In addition, we have demonstrated that projects can be objects of study, complementary to traditional indicators of innovation such as investment in R&D or the number of patents.
The results highlight several points where regulations can help accelerate the transition to a more sustainable economy. First, it is important to encourage and monitor the use of data management systems for production traceability and socio-environmental impact. In large companies, due to their potential environmental impact given their larger production, these systems must be efficiency oriented. In addition to impact, metrics should also account for material recovery volume. One example could be the percentage of profits from the recovery of refurbished, reused or second-hand material. In SMEs, IT systems (for instance blockchain) should have a peer-to-peer orientation to enhance collaboration.
The sustainable metrics generated by the companies must be delivered to the consumers so that they know what value proposition they receive, along with the unnecessary elements that produce negative environmental impact. Existing technologies already record the data that allow us to observe the pattern and amount of consumption. In a sustainable economy every citizen should be aware, not only of their annual consumption in economic terms, but also of their socio-environmental consumption.
Regulatory policies should begin to play a more proactive role in considering the expansion and widespread presence of business models for sustainability. Today there is a reactive role, and with the scalability of start-ups, mimicry or replicability is not promoted through collaboration, an example of which is given in the case of shielding the taxi sector from the market entry of Cabify or Uber. In this case, a proactive approach could have been adopted by motivating the traditional taxi sectors to adopt technologies that innovate their business model instead of waiting for large companies, with their already consolidated model, to compete in the market. A proactive policy accelerates the path towards sustainability, influences the balance of stakeholders and the more equitable distribution of benefits and tax revenues.
This study has limitations, the main one being that the data were obtained from documents published by the companies themselves, which gives rise to the possibility of bias. However, in our results, it is possible to distinguish the areas of the business model in which sustainability is reflected and where there is considerable room for improvement. On the other hand, and as mentioned above, a limitation of the study is the potential existence of endogeneity.
Future research is needed to advance in the implementation of business models, including focusing on socio-environmental metrics to improve efficiency in large companies, along with cooperation dynamics that could improve innovation in SMEs. It is also necessary to find ways in which experimentation or innovation at the front-end of the business model could lead to innovation at the back-end of the business model.
Author Contributions
The two authors designed the research, conducted the research and investigation process, contributed to the data analysis, and participated in the preparation and revision of the manuscript.
Funding
This research was funded by the European Partnership for Project and Innovation Management EUROPIM, supported by the German Academic Exchange Service and the Federal Ministry of Education and Research (BMBF), Funding-ID 57172312.
Acknowledgments
The authors are grateful for the work carried out by the coders to obtain the data, to Jose Oleaga for his feedback, and the comments made by the anonymous reviewers to improve this document.
Conflicts of Interest
The authors declare no conflict of interest.
Appendix A

Table A1.
Requirements of a business model for sustainable innovation.
| Variable | Assessment | Value |
|---|---|---|
| Size | SME (small and medium) | 1 |
| MNE (multinational) | 2 | |
| Large enterprise | 3 | |
| Measurable value | The value proposition does not provide users with a measurable ecological and/or social value in concert with economic value | 0 |
| The value proposition provides users with a measurable ecological and/or social value in concert with economic value | 1 | |
| Balance | A particular balance is not embedded in the design, production, and consumption. | 0 |
| A particular balance is embedded in the design, production, and consumption. | 1 | |
| Key partners | Does not involve suppliers who take responsibility for their own as well as the focal company’s stakeholder | 0 |
| Involves suppliers who take responsibility for their own as well as the focal company’s stakeholder | 1 | |
| Shift socio-ecological burdens to its suppliers | The company shifts its own socio-ecological burdens to its suppliers | 0 |
| The company does not shift its own socio-ecological burdens to its suppliers | 1 | |
| Motivates consumer for their consumption | Does not motivate user to take responsibility for their consumption as well as for the focal company’s stakeholders | 0 |
| Motivates user to take responsibility for their consumption as well as for the focal company’s stakeholders | 1 | |
| Shift their own socio-ecological burden to its customer | does shift their own socio-ecological burden to its customer | 0 |
| Does not shift their own socio-ecological burden to its customer | 1 | |
| Customer relationship | Are not set up with recognition of the respective sustainability challenges | 0 |
| Are set up with recognition of the respective sustainability challenges | 1 | |
| Distribution of economic costs and benefits | Inappropriate distribution | 0 |
| Appropriate distribution | 1 | |
| Accounting for impacts | Does not account for the ecological and social impacts | 0 |
| Accounts for the ecological and social impacts | 1 |
Appendix B
Table A2.
Post-hoc Scheffe test.
| Multiple Comparisons | |||||||
|---|---|---|---|---|---|---|---|
| Scheffe | |||||||
| Dependent Variable | (I) SIZE (Tamaño) | (J) SIZE (Tamaño) | Mean Difference (I–J) | Std. Error | Sig. | 95% Confidence Interval | |
| Lower Bound | Upper Bound | ||||||
| Measurable value | SME | MNE | −0.239 * | 0.082 | 0.016 | −0.44 | −0.04 |
| Large | −0.185 * | 0.068 | 0.025 | −0.35 | −0.02 | ||
| MNE | SME | 0.239 * | 0.082 | 0.016 | 0.04 | 0.44 | |
| Large | 0.054 | 0.061 | 0.678 | −0.10 | 0.21 | ||
| Large | SME | 0.185 * | 0.068 | 0.025 | 0.02 | 0.35 | |
| MNE | −0.054 | 0.061 | 0.678 | −0.21 | 0.10 | ||
| Balance | SME | MNE | −0.097 | 0.071 | 0.395 | −0.27 | 0.08 |
| Large | −0.060 | 0.058 | 0.589 | −0.20 | 0.08 | ||
| MNE | SME | 0.097 | 0.071 | 0.395 | −0.08 | 0.27 | |
| Large | 0.037 | 0.053 | 0.787 | −0.09 | 0.17 | ||
| Large | SME | 0.060 | 0.058 | 0.589 | −0.08 | 0.20 | |
| MNE | −0.037 | 0.053 | 0.787 | −0.17 | 0.09 | ||
| Key partners | SME | MNE | −0.298 * | 0.093 | 0.006 | −0.53 | −0.07 |
| Large | −0.227 * | 0.076 | 0.013 | −0.41 | −0.04 | ||
| MNE | SME | 0.298 * | 0.093 | 0.006 | 0.07 | 0.53 | |
| Large | 0.072 | 0.069 | 0.585 | −0.10 | 0.24 | ||
| Large | SME | 0.227 * | 0.076 | 0.013 | 0.04 | 0.41 | |
| MNE | −0.072 | 0.069 | 0.585 | −0.24 | 0.10 | ||
| Shifts socio-ecological burdens to its suppliers | SME | MNE | −0.326 * | 0.086 | 0.001 | −0.54 | −0.11 |
| Large | −0.197 * | 0.071 | 0.022 | −0.37 | −0.02 | ||
| MNE | SME | 0.326 * | 0.086 | 0.001 | 0.11 | 0.54 | |
| Large | 0.130 | 0.064 | 0.130 | −0.03 | 0.29 | ||
| Large | SME | 0.197 * | 0.071 | 0.022 | 0.02 | 0.37 | |
| MNE | −0.130 | 0.064 | 0.130 | −0.29 | 0.03 | ||
| Motivates consumer for their consumption | SME | MNE | 0.021 | 0.089 | 0.974 | −0.20 | 0.24 |
| Large | −0.014 | 0.074 | 0.983 | −0.20 | 0.17 | ||
| MNE | SME | −0.021 | 0.089 | 0.974 | −0.24 | 0.20 | |
| Large | −0.034 | 0.067 | 0.877 | −0.20 | 0.13 | ||
| Large | SME | 0.014 | 0.074 | 0.983 | −0.17 | 0.20 | |
| MNE | 0.034 | 0.067 | 0.877 | −0.13 | 0.20 | ||
| Shift their own socio-ecological burden to its customer | SME | MNE | −0.156 | 0.082 | 0.164 | −0.36 | 0.05 |
| Large | −0.073 | 0.067 | 0.557 | −0.24 | 0.09 | ||
| MNE | SME | 0.156 | 0.082 | 0.164 | −0.05 | 0.36 | |
| Large | 0.083 | 0.061 | 0.395 | −0.07 | 0.23 | ||
| Large | SME | 0.073 | 0.067 | 0.557 | −0.09 | 0.24 | |
| MNE | −0.083 | 0.061 | 0.395 | −0.23 | 0.07 | ||
| Customer relationship | SME | MNE | −0.196 * | 0.076 | 0.038 | −0.38 | −0.01 |
| Large | −0.150 | 0.062 | 0.057 | −0.30 | 0.00 | ||
| MNE | SME | 0.196 * | 0.076 | 0.038 | 0.01 | 0.38 | |
| Large | 0.045 | 0.057 | 0.726 | −0.09 | 0.18 | ||
| Large | SME | 0.150 | 0.062 | 0.057 | 0.00 | 0.30 | |
| MNE | −0.045 | 0.057 | 0.726 | −0.18 | 0.09 | ||
| Distribution of economic costs and benefits | SME | MNE | −0.255 * | 0.088 | 0.016 | −0.47 | −0.04 |
| Large | −0.186 * | 0.072 | 0.038 | −0.36 | −0.01 | ||
| MNE | SME | 0.255 * | 0.088 | 0.016 | 0.04 | 0.47 | |
| Large | 0.069 | 0.066 | 0.578 | −0.09 | 0.23 | ||
| Large | SME | 0.186 * | 0.072 | 0.038 | 0.01 | 0.36 | |
| MNE | −0.069 | 0.066 | 0.578 | −0.23 | 0.09 | ||
| Accounting for impacts | SME | MNE | −0.342 * | 0.082 | 0.000 | −0.54 | −0.14 |
| Large | −0.128 | 0.068 | 0.169 | −0.30 | 0.04 | ||
| MNE | SME | 0.342 * | 0.082 | 0.000 | 0.14 | 0.54 | |
| Large | 0.213 * | 0.061 | 0.003 | 0.06 | 0.36 | ||
| Large | SME | 0.128 | 0.068 | 0.169 | −0.04 | 0.30 | |
| MNE | −0.213 * | 0.061 | 0.003 | −0.36 | −0.06 | ||
* The mean difference is significant at the 0.05 level.
Table A3.
Value proposition: means for groups in homogeneous subsets. Uses harmonic mean sample size = 54.252.
Table A3.
Value proposition: means for groups in homogeneous subsets. Uses harmonic mean sample size = 54.252.
| Value Proposition | ||||||
|---|---|---|---|---|---|---|
| Measurable Value | Balance | |||||
| SIZE (Size) | N | Subset for Alpha = 0.05 | SIZE (Size) | N | Subset for Alpha = 0.05 | |
| 1 | 2 | 1 | ||||
| SME | 36 | 0.00 | SME | 36 | 0.06 | |
| Large | 173 | 0.18 | Large | 173 | 0.12 | |
| MNE | 46 | 0.24 | MNE | 46 | 0.15 | |
| Next | 1.000 | 0.748 | Next | 0.288 | ||
Table A4.
Supply chain: means for groups in homogeneous subsets. Uses harmonic mean sample size = 54.252.
Table A4.
Supply chain: means for groups in homogeneous subsets. Uses harmonic mean sample size = 54.252.
| Supply Chain | |||||||
|---|---|---|---|---|---|---|---|
| Key Partners | Shifts Socio-Ecological Burdens to Its Suppliers | ||||||
| SIZE (Size) | N | Subset for Alpha = 0.05 | SIZE (Size) | N | Subset for Alpha = 0.05 | ||
| 1 | 2 | 1 | 2 | ||||
| SME | 36 | 0.03 | SME | 36 | 0.00 | ||
| Large | 173 | 0.25 | Large | 173 | 0.20 | ||
| MNE | 46 | 0.33 | MNE | 46 | 0.33 | ||
| Next | 1.000 | 0.670 | Next | 1.000 | 0.218 | ||
Table A5.
Customer interface: means for groups in homogeneous subsets. Uses harmonic mean sample size = 54.252.
Table A5.
Customer interface: means for groups in homogeneous subsets. Uses harmonic mean sample size = 54.252.
| Motivates Consumer for Their Consumption) | Shifts Their Own Socio-Ecological Burden to Its Customer | Customer Relationship | |||||||
|---|---|---|---|---|---|---|---|---|---|
| SIZE (Size) | N | Subset for Alpha = 0.05 | SIZE (Size) | N | Subset for Alpha = 0.05 | SIZE (Size) | N | Subset for Alpha = 0.05 | |
| 1 | 1 | 1 | 2 | ||||||
| MNE | 46 | 0.17 | SME | 36 | 0.08 | SME | 36 | 0.00 | |
| SME | 36 | 0.19 | Large | 173 | 0.16 | Large | 173 | 0.15 | 0.15 |
| Large | 173 | 0.21 | MNE | 46 | 0.24 | MNE | 46 | 0.20 | |
| Next | 0.907 | Next | 0.089 | Next | 0.074 | 0.787 | |||
Table A6.
Financial model: means for groups in homogeneous subsets. Uses harmonic mean sample size = 54.252.
Table A6.
Financial model: means for groups in homogeneous subsets. Uses harmonic mean sample size = 54.252.
| Financial Model | |||||||
|---|---|---|---|---|---|---|---|
| Distribution of Economic Costs and Benefits | Accounting for Impacts | ||||||
| SIZE (Size) | N | Subset for Alpha = 0.05 | SIZE (Size) | N | Subset for Alpha = 0.05 | ||
| 1 | 2 | 1 | 2 | ||||
| SME | 36 | 0.03 | SME | 36 | 0.03 | ||
| Large | 173 | 0.21 | 0.21 | Large | 173 | 0.16 | |
| MNE | 46 | 0.28 | MNE | 46 | 0.37 | ||
| Next | 0.051 | 0.664 | Next | 0.198 | 1.000 | ||
References
- Schumpeter, J. Creative destruction. Capital. Social. Democr. 1942, 825, 82–85. [Google Scholar]
- Eccles, R.G.; Serafeim, G. The performance frontier: Innovating for a sustainable strategy. Harv. Bus. Rev. 2013, 91, 17–18. [Google Scholar]
- Klewitz, J.; Hansen, E.G. Sustainability-oriented innovation of SMEs: A systematic review. J. Clean. Prod. 2014, 65, 57–75. [Google Scholar] [CrossRef]
- Nidumolu, R.; Prahalad, C.K.; Rangaswami, M.R. Why sustainability is now the key driver of innovation. Harv. Bus. Rev. 2009, 87, 56–64. [Google Scholar]
- Biondi, V.; Iraldo, F.; Meredith, S. Achieving sustainability through environmental innovation: The role of SMEs. Int. J. Technol. Manag. 2002, 24, 612–626. [Google Scholar] [CrossRef]
- Uhlaner, L.M.; Berent-Braun, M.M.; Jeurissen, R.J.; de Wit, G. Beyond size: Predicting engagement in environmental management practices of Dutch SMEs. J. Bus. Ethics 2012, 109, 411–429. [Google Scholar] [CrossRef]
- Lewandowski, M. Designing the business models for circular economy-towards the conceptual framework. Sustainability 2016, 8, 43. [Google Scholar] [CrossRef]
- Lüdeke-Freund, F. Towards a Conceptual Framework of ‘Business Models for Sustainability’. In Proceedings of the 14th European Roundtable on Sustainable Consumption and Production (ERSCP) & 6th Environmental Management for Sustainable Universities (EMSU), Delft, The Netherlands, 25–29 October 2010. [Google Scholar]
- Anwar, M. Business model innovation and SMEs performance-Does competitive advantage mediate? Int. J. Innov. Manag. 2018, 22. [Google Scholar] [CrossRef]
- Bocken, N.M.; Short, S.W.; Rana, P.; Evans, S. A literature and practice review to develop sustainable business model archetypes. J. Clean. Prod. 2014, 65, 42–56. [Google Scholar] [CrossRef]
- Geissdoerfer, M.; Vladimirova, D.; Evans, S. Sustainable business model innovation: A review. J. Clean. Prod. 2018, 198, 401–416. [Google Scholar] [CrossRef]
- Bashir, M.; Verma, R. Why business model innovation is the new competitive advantage. IUP J. Bus. Strateg. 2017, 14, 7. [Google Scholar]
- Hartmann, M.; Oriani, R.; Bateman, H. The performance effect of business model innovation: An empirical analysis of pension funds. In Proceedings of the 35th DRUID Celebration Conference, Barcelona, Spain, 17–19 June 2013. [Google Scholar]
- Zott, C.; Amit, R. Business model design and the performance of entrepreneurial firms. Organ. Sci. 2007, 18, 181–199. [Google Scholar] [CrossRef]
- Halme, M.; Korpela, M. Responsible innovation toward sustainable development in small and medium-sized enterprises: A resource perspective. Bus. Strateg. Environ. 2014, 23, 547–566. [Google Scholar] [CrossRef]
- Stock, G.N.; Greis, N.P.; Fischer, W.A. Firm size and dynamic technological innovation. Technovation 2002, 22, 537–549. [Google Scholar] [CrossRef]
- Walker, H.; Preuss, L. Fostering sustainability through sourcing from small businesses: Public sector perspectives. J. Clean. Prod. 2008, 16, 1600–1609. [Google Scholar] [CrossRef]
- Widya-Hasuti, A.; Mardani, A.; Streimikiene, D.; Sharifara, A.; Cavallaro, F. The Role of Process Innovation between Firm-Specific Capabilities and Sustainable Innovation in SMEs: Empirical Evidence from Indonesia. Sustainability 2018, 10, 2244. [Google Scholar] [CrossRef]
- Hockerts, K.; Wüstenhagen, R. Greening Goliaths versus emerging Davids—Theorizing about the role of incumbents and new entrants in sustainable entrepreneurship. J. Bus. Ventu. 2010, 25, 481–492. [Google Scholar] [CrossRef]
- Yu, G.J.; Kwon, K.M.; Lee, J.; Jung, H. Exploration and Exploitation as Antecedents of Environmental Performance: The Moderating Effect of Technological Dynamism and Firm Size. Sustainability 2016, 8, 200. [Google Scholar] [CrossRef]
- Boons, F.; Lüdeke-Freund, F. Business models for sustainable innovation: State-of-the-art and steps towards a research agenda. J. Clean. Prod. 2013, 45, 9–19. [Google Scholar] [CrossRef]
- Battistella, C.; Cagnina, M.; Cicero, L.; Preghenella, N. Sustainable Business Models of SMEs: Challenges in Yacht Tourism Sector. Sustainability 2018, 10, 3437. [Google Scholar] [CrossRef]
- Stubbs, W.; Cocklin, C. Conceptualizing a “sustainability business model”. Organ. Environ. 2008, 21, 103–127. [Google Scholar] [CrossRef]
- Evans, S.; Vladimirova, D.; Holgado, M.; Van Fossen, K.; Yang, M.; Silva, E.A.; Barlow, C.Y. Business model innovation for sustainability: Towards a unified perspective for creation of sustainable business models. Bus. Strateg. Environ. 2017, 26, 597–608. [Google Scholar] [CrossRef]
- Schaltegger, S.; Lüdeke-Freund, F.; Hansen, E.G. Business models for sustainability: A co-evolutionary analysis of sustainable entrepreneurship, innovation, and transformation. Organ. Environ. 2016, 29, 264–289. [Google Scholar] [CrossRef]
- Gauthier, C.; Gilomen, B. Business models for sustainability: Energy efficiency in urban districts. Organ. Environ. 2016, 29, 124–144. [Google Scholar] [CrossRef]
- Schaltegger, S.; Lüdeke-Freund, F.; Hansen, E.G. Business cases for sustainability: The role of business model innovation for corporate sustainability. Int. J. Innov. Sustain. Dev. 2012, 6, 95–119. [Google Scholar] [CrossRef]
- Osterwalder, A.; Pigneur, Y. Business Model Generation: A Handbook for Visionaries, Game Changers, and Challengers; John Wiley & Sons: Hoboken, NJ, USA, 2010. [Google Scholar]
- Elkington, R.; Upward, A. Leadership as enabling function for flourishing by design. J. Glob. Responsib. 2016, 7, 126–144. [Google Scholar] [CrossRef]
- Joyce, A.; Paquin, R.L. The triple layered business model canvas: A tool to design more sustainable business models. J. Clean. Prod. 2016, 135, 1474–1486. [Google Scholar] [CrossRef]
- Bouncken, R.B.; Fredrich, V. Business model innovation in alliances: Successful configurations. J. Bus. Res. 2016, 69, 3584–3590. [Google Scholar] [CrossRef]
- Lee, K.; Go, D.; Park, I.; Yoon, B. Exploring Suitable Technology for Small and Medium-Sized Enterprises (SMEs) Based on a Hidden Markov Model Using Patent Information and Value Chain Analysis. Sustainability 2017, 9, 1100. [Google Scholar] [CrossRef]
- Yoon, B.; Shin, J.; Lee, S. Open innovation projects in SMEs as an engine for sustainable growth. Sustainability 2016, 8, 146. [Google Scholar] [CrossRef]
- Veit, C.; Lambrechts, W.; Quintens, L.; Semeijn, J. The Impact of Sustainable Sourcing on Customer Perceptions: Association by Guilt from Scandals in Local vs. Offshore Sourcing Countries. Sustainability 2018, 10, 2519. [Google Scholar] [CrossRef]
- Van Ostaeyen, J.; Van Horenbeek, A.; Pintelon, L.; Duflou, J.R. A refined typology of product–service systems based on functional hierarchy modeling. J. Clean. Prod. 2013, 51, 261–276. [Google Scholar] [CrossRef]
- Bos-Brouwers, H.E.J. Corporate sustainability and innovation in SMEs: Evidence of themes and activities in practice. Bus. Strateg. Environ. 2010, 19, 417–435. [Google Scholar] [CrossRef]
- Huergo, E. The role of technological management as a source of innovation: Evidence from Spanish manufacturing firms. Res. Policy 2006, 35, 1377–1388. [Google Scholar] [CrossRef]
- Yang, Z.; Sun, J.; Zhang, Y.; Wang, Y. Green, green, it’s green: A triad model of technology, culture, and innovation for corporate sustainability. Sustainability 2017, 9, 1369. [Google Scholar] [CrossRef]
- Halme, M.; Anttonen, M.; Kuisma, M.; Kontoniemi, N.; Heino, E. Business models for material efficiency services: Conceptualization and application. Ecol. Econ. 2007, 63, 126–137. [Google Scholar] [CrossRef]
- Santolaria, M.; Oliver-Solà, J.; Gasol, C.M.; Morales-Pinzón, T.; Rieradevall, J. Eco-design in innovation driven companies: Perception, predictions and the main drivers of integration. The Spanish example. J. Clean. Prod. 2011, 19, 1315–1323. [Google Scholar] [CrossRef]
- Xue, X.; Zhang, X.; Wang, L.; Skitmore, M.; Wang, Q. Analyzing collaborative relationships among industrialized construction technology innovation organizations: A combined SNA and SEM approach. J. Clean. Prod. 2018, 173, 265–277. [Google Scholar] [CrossRef]
- Nelson, K. How small firms innovate sustainably. Business 2004, 26, 24–26. [Google Scholar]
- Cooke, P.; Wills, D. Small firms, social capital and the enhancement of business performance through innovation programmes. Small Bus. Econ. 1999, 13, 219–234. [Google Scholar] [CrossRef]
- Triguero, Á.; Cuerva, M.C.; Álvarez-Aledo, C. Environmental Innovation and Employment: Drivers and Synergies. Sustainability 2017, 9, 2057. [Google Scholar] [CrossRef]
- Yun, J.J.; Jung, W.; Yang, J. Knowledge strategy and business model conditions for sustainable growth of SMEs. J. Sci. Technol. Policy Manag. 2015, 6, 246–262. [Google Scholar] [CrossRef]
- Song, Y.; Feng, T.; Jiang, W. The Influence of Green External Integration on Firm Performance: Does Firm Size Matter? Sustainability 2017, 9, 1328. [Google Scholar] [CrossRef]
- Johnson, M.P. Sustainability management and small and medium-sized enterprises: Managers’ awareness and implementation of innovative tools. Corp. Soc. Responsib. Environ. Manag. 2015, 22, 271–285. [Google Scholar] [CrossRef]
- Pekovic, S.; Rolland, S. Customer orientation and firm’s business performance: A moderated mediation model of environmental customer innovation and contextual factors. Eur. J. Mark. 2016, 50, 2162–2191. [Google Scholar] [CrossRef]
- Rahman, M.N.; Doroodian, M.; Kamarulzaman, Y.; Muhamad, N. Designing and validating a model for measuring sustainability of overall innovation capability of small and medium-sized enterprises. Sustainability 2015, 7, 537–562. [Google Scholar] [CrossRef]
- Bougrain, F.; Haudeville, B. Innovation, collaboration and SMEs internal research capacities. Res. Policy 2002, 31, 735–747. [Google Scholar] [CrossRef]
- Barnett, B.D.; Clark, K.B. Technological newness: An empirical study in the process industries. J. Eng. Technol. Manag. 1996, 13, 263–282. [Google Scholar] [CrossRef]
- Gray, R.; Kouhy, R.; Lavers, S. Constructing a research database of social and environmental reporting by UK companies. Account. Audit. Account. J. 1995, 8, 78–101. [Google Scholar] [CrossRef]
- Eccles, R.G.; Krzus, M.P. The Integrated Reporting Movement: Meaning, Momentum, Motives, and Materiality; John Wiley & Sons: Hoboken, NJ, USA, 2014. [Google Scholar]
- Lock, I.; Seele, P. The credibility of CSR (corporate social responsibility) reports in Europe. Evidence from a quantitative content analysis in 11 countries. J. Clean. Prod. 2016, 122, 186–200. [Google Scholar] [CrossRef]
- Krippendorff, K. Content Analysis: An Introduction to its Methodology; SAGE: Newcastle upon Tyne, UK, 2004. [Google Scholar]
- Neuendorf, K.A. The Content Analysis Guidebook; SAGE: Newcastle upon Tyne, UK, 2016. [Google Scholar]
- Upward, A.; Jones, P. An Ontology for Strongly Sustainable Business Models: Defining an Enterprise Framework Compatible with Natural and Social Science. Organ. Environ. 2016, 29, 97–123. [Google Scholar] [CrossRef]
- Reginato, J.M. Evaluating Project Robustness through the Lens of the Business Model. Int. J. Innov. Technol. Manag. 2009, 6, 155–167. [Google Scholar] [CrossRef]
- Dang, C.; Li, Z.F.; Yang, C. Measuring firm size in empirical corporate finance. J. Bank. Financ. 2018, 86, 159–176. [Google Scholar] [CrossRef]
- Dong, Y.; Lewbel, A. A simple estimator for binary choice models with endogenous regressors. Econom. Rev. 2015, 34, 82–105. [Google Scholar] [CrossRef]
- Dong, Y.; Lewbel, A. Simple Estimators for Binary Choice Models with Endogenous Regressors; University of California-Irvine, Department of Economics: Irvine, CA, USA, 2012; Available online: https://EconPapers.repec.org/RePEc:irv:wpaper:111204 (accessed on 5 December 2018).
- Baum, C.F.; Dong, Y.; Lewbel, A.; Yang, T. Binary choice models with endogenous regressors. In Proceedings of the Stata Conference, San Diego, CA, USA, 26–27 July 2012. [Google Scholar]
- Günzel, F.; Holm, A.B. One size does not fit all—Understanding the front-end and back-end of business model innovation. Int. J. Innov. Manag. 2013, 17, 1340002. [Google Scholar] [CrossRef]
- Baldassarre, B.; Calabretta, G.; Bocken, N.M.; Jaskiewicz, T. Bridging sustainable business model innovation and user-driven innovation: A process for sustainable value proposition design. J. Clean. Prod. 2017, 147, 175–186. [Google Scholar] [CrossRef]
- Pynnönen, M.; Hallikas, J.; Ritala, P. Managing customer-driven business model innovation. Int. J. Innov. Manag. 2012, 16, 1250022. [Google Scholar] [CrossRef]
- Dentchev, N.; Rauter, R.; Jóhannsdóttir, L.; Snihur, Y.; Rosano, M.; Baumgartner, R.; Nyberg, T.; Tang, X.; van Hoof, B.; Jonker, J. Embracing the variety of sustainable business models: A prolific field of research and a future research agenda. J. Clean. Prod. 2018, 194, 695–703. [Google Scholar] [CrossRef]
Figure 1.
Hypothesized model: firm size and business model for sustainable innovation.

Figure 2.
Causal structure: firm size and measurable value.

Figure 3.
Scheffe Test: Comparison of means between groups (a) Provides a measurable sustainable value; (b) There is a balance between actors; (c) Responsible key suppliers; (d) No shift of burdens to suppliers; (e) Motivates Consumers to take responsibility for their consumption (f) No shift of burdens to clients; (g) Relationships are set up with recognition of sustainability challenges; (h) Fair distribution of economic cost and benefits; (i) Accounting for socio environmental impacts.

Figure 4.
Firm size and business model for sustainable innovation: accepted and rejected hypotheses.
Figure 4.
Firm size and business model for sustainable innovation: accepted and rejected hypotheses.

Figure 5.
Graphical representation of the factor analysis output: back-end and front-end development of the business model for sustainable innovation.
Figure 5.
Graphical representation of the factor analysis output: back-end and front-end development of the business model for sustainable innovation.

Figure 6.
Firm size effect in the back-end and front-end development of the business model for sustainable innovation (BMfSI).
Figure 6.
Firm size effect in the back-end and front-end development of the business model for sustainable innovation (BMfSI).

Table 1.
Set of hypotheses derived from the literature review.
| H | Hypotheses |
|---|---|
| H1a | The size of the company influences how it measures and communicates its social and environmental values. |
| H1b | The size of the company influences the establishment of balance among the members of the value chain and consumption. |
| H2a | The size of the company influences the mechanisms of collaboration with Key partners |
| H2b | The size of the company influences the diversion of social and environmental burdens to the rest of the supply chain |
| H3a | The size of the company influences the adoption of strategies to motivate customers towards sustainability. |
| H3b | The size of the company influences the adoption of strategies to outsource socio-environmental burdens to customers. |
| H3c | The size of the company influences the communication with customers on the social and environmental impact |
| H4a | The size of the company influences the implementation of socio-environmental impact accounting systems |
| H4b | The size of the company influences the appropriate distribution of economic costs and benefits along the value chain. |
Table 2.
Definition of size according to the Global Reporting Initiative Database.
| Enterprise Category | Headcount | Turnover | Balance Sheet Total |
|---|---|---|---|
| SME | <250 | ≤€50 million OR | ≤€43 million |
| Large Enterprise | ≥250 | ≥€50 million OR | ≥€43 million |
| MNE | ≥250 AND multinational | ≥€50 million OR | ≥€43 million |
Table 3.
Firm size variable, BMfSI variables, value, and frequency.
| Variable Name | Description | Value | N |
|---|---|---|---|
| Size | SME (small and medium enterprise) | 1 | 36 |
| MNE (multinational) | 2 | 46 | |
| Large enterprise | 3 | 173 | |
| Measurable value | The value proposition does not provide users with a measurable ecological and/or social value in concert with economic value | 0 | 212 |
| The value proposition provides users with a measurable ecological and/or social value in concert with economic value | 1 | 43 | |
| Balance | A particular balance is not embedded in the design, production, and consumption | 0 | 226 |
| A particular balance is embedded in the design, production, and consumption. | 1 | 29 | |
| Key partners | Does not involve suppliers who take responsibility for their own as well as the focal company’s stakeholder | 0 | 195 |
| Involves suppliers who take responsibility for their own as well as the focal company’s stakeholder | 1 | 60 | |
| Shift socio-ecological burdens to its suppliers | The company shifts its own socio-ecological burdens to its suppliers | 0 | 206 |
| The company does not shift its own socio-ecological burdens to its suppliers | 1 | 49 | |
| Motivates consumer for their consumption | Does not motivate user to take responsibility for their consumption as well as for the focal company’s stakeholders | 0 | 204 |
| Motivates user to take responsibility for their consumption as well as for the focal company’s stakeholders | 1 | 51 | |
| Shift their own socio-ecological burden to its customer | Does shift their own socio-ecological burden to its customer | 0 | 214 |
| Does not shift their own socio-ecological burden to its customer | 1 | 41 | |
| Customer relationship | Are not set up with recognition of the respective sustainability challenges | 0 | 220 |
| Are set up with recognition of the respective sustainability challenges | 1 | 35 | |
| Distribution of economic costs and benefits | Inappropriate distribution | 0 | 204 |
| Appropriate distribution | 1 | 51 | |
| Accounting for impacts | Does not account for the ecological and social impacts | 0 | 210 |
| Accounts for the ecological and social impacts | 1 | 45 |
Table 4.
ANOVA (F-test) results.
| Sum of Squares | df | Mean Square | F | Next | ||
|---|---|---|---|---|---|---|
| Measurable value | Between groups | 1.299 | 2 | 0.649 | 4.749 | 0.009 |
| Within groups | 34.450 | 252 | 0.137 | |||
| Total | 35.749 | 254 | ||||
| Balance | Between groups | 0.190 | 2 | 0.095 | 0.941 | 0.392 |
| Within groups | 25.512 | 252 | 0.101 | |||
| Total | 25.702 | 254 | ||||
| Key partners | Between groups | 1.992 | 2 | 0.996 | 5.719 | 0.004 |
| Within groups | 43.890 | 252 | 0.174 | |||
| Total | 45.882 | 254 | ||||
| Shifts socio-ecological burdens to its suppliers | Between groups | 2.158 | 2 | 1.079 | 7.264 | 0.001 |
| Within groups | 37.427 | 252 | 0.149 | |||
| Total | 39.584 | 254 | ||||
| Motivates Consumer for their consumption | Between groups | 0.044 | 2 | 0.022 | 0.135 | 0.874 |
| Within groups | 40.756 | 252 | 0.162 | |||
| Total | 40.800 | 254 | ||||
| Shifts their own socio-ecological burden to its customer | Between groups | 0.502 | 2 | 0.251 | 1.866 | 0.157 |
| Within groups | 33.906 | 252 | 0.135 | |||
| Total | 34.408 | 254 | ||||
| Customer relationship | Between groups | 0.864 | 2 | 0.432 | 3.713 | 0.026 |
| Within groups | 29.332 | 252 | 0.116 | |||
| Total | 30.196 | 254 | ||||
| Distribution of economic costs and benefits | Between groups | 1.415 | 2 | 0.707 | 4.527 | 0.012 |
| Within groups | 39.385 | 252 | 0.156 | |||
| Total | 40.800 | 254 | ||||
| Accounting for impacts | Between groups | 2.583 | 2 | 1.292 | 9.441 | 0.000 |
| Within groups | 34.476 | 252 | 0.137 | |||
| Total | 37.059 | 254 | ||||
Table 5.
Results of the statistical hypotheses testing.
| H | Size Effect | Dependent Variable | Comparison of the Means between Categories |
|---|---|---|---|
| H1a | Accepted | The company includes socio-environmental metrics in the value proposition | (Large = MNE) > SME |
| H1b | Rejected | There is a Balance between Stakeholders | Large = MNE = SME |
| H2a | Accepted | Includes Responsible Suppliers | (Large = MNE) > SME |
| H2b | Accepted | Does not divert waste to suppliers | (Large = MNE) > SME |
| H3a | Rejected | Motivates customers to take responsibility for their consumption | Large = MNE = SME |
| H3b | Rejected | Does not divert waste to customers | Large = MNE = SME |
| H3c | Accepted | Customer relations are established with the recognition of the sustainability challenge. | (MNE = Large) > (Large = SME) |
| H4a | Accepted | Appropriate distribution of resources | (MNE = Large) > (Large = SME) |
| H4b | Accepted | Accounts for socio-environmental impacts | MNE > (Large = SME) |
Table 6.
Factor analysis rotated component matrix a.
| Label | Variable Name | Component | |
|---|---|---|---|
| Front-End BMfSI | Back-End BMfSI | ||
| CR | Customer relationships | 0.687 | |
| B | Balance | 0.682 | |
| MV | Measurable value | 0.649 | |
| MC | Motivates consumers for their consumption | 0.609 | |
| NS | Shifts their own socio-ecological burden to its customer | 0.604 | |
| KS | Shifts their own socio-ecological burden to its providers | 0.841 | |
| KP | Key partners | 0.820 | |
| AD | Distribution of economic cost and benefits | 0.596 | |
| AI | Accounting for impacts | 0.535 | |
a. Extraction method: principal component analysis. Rotation method: varimax with Kaiser normalization. Rotation converged in three iterations. Suppressed values below 0.5 KMO (Kaiser–Mayer–Olkin test for sampling adequacy): 0.812. Total variance explained: 50.35% Minimum Eigen Value: 1.
Table 7.
Fit measurement statistics.
| Statistic | Value |
|---|---|
| χ2 | 48.441, p = 0.04 |
| N | >200 |
| χ2/gl | 1.514 |
| GFI | 0.965 |
| AGFI | 0.939 |
| RMR | 0.007 |
| RMSEA | 0.045 |
Table 8.
Regression weights.
| Est | S.E. | C.R. | p | Label | Std Est | |
|---|---|---|---|---|---|---|
| Back-end BMfSI ← SIZE | 0.044 | 0.020 | 2.183 | 0.029 | par_9 | 0.163 |
| Front-end BMfSI ← Back-end | 0.873 | 0.162 | 5.400 | *** | par_10 | 0.758 |
| Measurable value ← Front-end | 1.000 | 0.604 | ||||
| Balance ← Front-end | 0.733 | 0.115 | 6.369 | *** | par_1 | 0.522 |
| Motivates consumers for their consumption ← Front-end | 0.936 | 0.151 | 6.216 | *** | par_2 | 0.529 |
| Customer relationships← Front-end | 0.905 | 0.133 | 6.784 | *** | par_3 | 0.595 |
| Shifts their own socio-ecological burden to its customer ← Front-end | 0.933 | 0.145 | 6.414 | *** | par_4 | 0.574 |
| Key partners ← Back-end | 1.335 | 0.218 | 6.137 | *** | par_5 | 0.618 |
| Shifts their own socio-ecological burden to its providers ← Back-end | 1.110 | 0.195 | 5.692 | *** | par_6 | 0.553 |
| Distribution of economic cost and benefits ← Back-end | 1.413 | 0.227 | 6.222 | *** | par_7 | 0.694 |
| Accounting for impacts ← Back-end | 1.000 | 0.515 |
*** 0.001 level.
© 2018 by the authors. Licensee MDPI, Basel, Switzerland. This article is an open access article distributed under the terms and conditions of the Creative Commons Attribution (CC BY) license (http://creativecommons.org/licenses/by/4.0/).
Share and Cite
MDPI and ACS Style
Aguilar-Fernández, M.E.; Otegi-Olaso, J.R. Firm Size and the Business Model for Sustainable Innovation. Sustainability 2018, 10, 4785. https://doi.org/10.3390/su10124785
AMA Style
Aguilar-Fernández ME, Otegi-Olaso JR. Firm Size and the Business Model for Sustainable Innovation. Sustainability. 2018; 10(12):4785. https://doi.org/10.3390/su10124785
Chicago/Turabian StyleAguilar-Fernández, María E., and José Ramon Otegi-Olaso. 2018. "Firm Size and the Business Model for Sustainable Innovation" Sustainability 10, no. 12: 4785. https://doi.org/10.3390/su10124785
Note that from the first issue of 2016, this journal uses article numbers instead of page numbers. See further details here.