The Evolution of International Scientific Collaboration in Fuel Cells during 1998–2017: A Social Network Perspective


1
School of Economics and Management, University of Shanxi, Taiyuan 030006, China
2
School of Management and Economics, Beijing Institute of Technology, Beijing 100081, China
3
School of Information Resource Management, Renmin University of China, Beijing 100872, China
*
Author to whom correspondence should be addressed.
Sustainability 2018, 10(12), 4790; https://doi.org/10.3390/su10124790
Submission received: 2 November 2018
/
Revised: 9 December 2018
/
Accepted: 11 December 2018
/
Published: 15 December 2018
(This article belongs to the Special Issue International Perspectives on Sustainable Energy Transition)
Abstract
:International scientific collaboration has played an important role in the development of fuel cell technology. In this paper, we employ bibliometric methods and social network analysis to explore the patterns and dynamics of scientific collaboration network of fuel cells. A total of 20,358 international collaborative publications in the fuel cell field published during 1998–2017 were collected from Web of Science. We use a series of indicators to address multiple facets of research collaboration and evolution patterns. Results show that international collaboration has been increasing and the characteristics of the scientific network have changed over time. The collaboration network presented a highly uneven distribution, while the sign of decline began to show. The trend of consolidation was presented with one cluster around North America–Asia, one around Europe, and a small emerging collaborating cluster around West Asia. European and North American countries had relatively higher international collaboration rate than Asian countries but lower publishing volume. Two modes of international collaboration exist: Germany, France and UK collaborate with a wide range of countries, while Singapore, Australia, South Korea and Taiwan concentrate on collaborating with few main countries. Microbial fuel cell had developed as a new prominent area in the international collaboration, and the most popular catalysts were nanoparticle and graphene/carbon nanotubes. This study presents a picture of international collaboration from multi-dimension view and provides insights in facilitating more vigorous collaborations in fuel cells.
1. Introduction
In recent years, United Nations Climate Change Conferences [1] have set out a framework of actions so as to mitigate global greenhouse gas emissions, strengthen global responses in climate change threats, and promote energy and environment sustainability. The object is to achieve a global low carbon economy by 2050. For this reason, fuel cells have been attracting significant attention as highly efficient and eco-friendly new energy technologies. Fuel cells are commonly considered as promising in a wide range of high-tech sectors, especially in the context of pressing global challenges related to energy, transportation, clean electricity and climate change. Many countries, with investments from governments, have devoted in the research and development (R&D) in fuel cells. In recent years, fuel cells have made a leap forward in technology development, which has been successfully used in a wide range of applications from large stationary solutions to small milliwatt scale system [2]. One of the main applications is the power generator, which combines heat and power systems for both residential and commercial needs [3]. Fuel cells can also be applied in mobile applications such as transportation systems, portable electronic equipment, military projects and automotive vehicles, which have generated a considerable amount of industry and policy interests over the past two decades [3,4,5,6]. Therefore, fuel cells are not only an economically competitive option for sustainable energy conversion, but also one of the most important pillars of the future sustainable energy system.
However, the R&D of fuel cell technology is still facing great challenges. Some bottleneck technologies such as the operating temperature, catalyst cost and electrical conductivity are still waiting to be resolved [7,8], which tremendously restrain the chance of commercialization for fuel cell technology. Most research projects still rely on the regulatory and R&D funding of governments. Therefore, so as to inspire further development of fuel cell research field, international scientific collaboration should also be highly valued.
International scientific collaboration is one of the main forms of global knowledge innovation. Research collaboration among authors from different countries can facilitate the improvement of research quality, advance the efficiency of scientific production, and foster breakthroughs in shorter time [9,10]. Many countries have actively advanced international collaboration to share knowledge, create projects and participate in research communities [11,12,13]. As a rapidly developing and emerging technology, fuel cells require extensive international collaboration to foster more efficient research outcomes. Hence, from the perspective of international co-authorship, the understanding of cross-nation scientific collaboration in the fuel cell field would help to gain useful intelligence on international capabilities, promote the collaborative innovation of different countries, and improve the efficiency of collaborative innovation. Thereby it can enhance the practicality of fuel cell technology and promote its further commercial development. Furthermore, promoting the technology development via international collaboration research in the fuel cell field is in line with two of the 17 Sustainable Development Goals (SDGs): ensure access to affordable, reliable, sustainable and modern energy for all; take urgent action to combat climate change and its impacts by regulating emissions and promoting developments in renewable energy.
In response to the increasing importance of fuel cells, a number of studies have been conducted with the goal of understanding how knowledge in fuel cells is developed in scientific spheres. Arunachalam and Viswanathan analyzed the publication activities and identified knowledge flow in the fuel cell field [14]. Suominen and Tuominen characterized fuel cells using bibliometric as well as patent data [15]. Girap and Cindrella explored the characteristics and development of fuel cells at the country, institution and theme levels [16,17]. Klitkou and Chen undertook bibliometric analysis in fuel cells to assess the knowledge base and research capacity of a country [18,19]. Suominen used a combination of basic bibliometric analysis and network visualization tools to identify the growing fuel cell research trend [20]. Ogawa et al. explored the extent and types of interdisciplinary practices in fuel cell and detected emerging technologies of different fuel cell types [21]. Research collaboration in fuel cells has also been the topic in bibliometrics. However, the majority of studies have analyzed and evaluated the knowledge landscape and research trends of fuel cell research; there have been limited studies on international collaboration aspects of fuel cells.
During recent decades, many studies have shown the high volume and velocity of international co-authored publications in all scientific fields [22,23,24], which lead to the dynamics of scientific collaboration a remarkable indicator of knowledge innovation and technology development [25]. Motivated by the emphasis of new energy technologies in global scientific research and the emergence of several developing countries into the research frontier of fuel cells, an accurate measurement of collaboration patterns for the fuel cell field is important for policymakers. To achieve this goal, we, in this study, create a cross-nation co-authoring network in the fuel cell field to reveal the patterns and underlying dynamics of international collaboration. Various aspects of collaboration are explored: collaboration networks, collaboration communities, collaboration types, collaboration degree, and collaboration themes. Through the study, we answer the following research questions:
- What is the distribution status of the international scientific collaboration intensity of fuel cell?
- What are the characteristics of international collaboration development of fuel cells among countries?
- How does the international scientific collaboration of fuel cells change over time? And how to cluster among countries?
- How does the main research areas of the international scientific collaboration of fuel cells evolve?
The remainder of this study is structured as follows: Section 2 introduces the data and methods gathered for the study. Section 3 presents the observations and findings of the evolution and the characteristics of international scientific collaboration network of fuel cells. Concluding remarks are provided in the last section.
2. Materials and Methods
2.1. Data
In this study, data is searched in the database of Science Citation Index Expanded (SCI-E), Social Sciences Citation Index (SSCI), Conference Proceedings Citation Index-Science (CPCI-S), Conference Proceedings Citation Index-Social Science and Humanities (CPCI-SSH), Current Chemical Reactions (CCR-E) and Index Chemicus (IC) which are all sub-databases in Web of Science. The results were retrieved by using a search algorithm of “fuel cell” or “fuel cells” being mentioned in the title, abstract or keywords of a publication during 1998–2017. A total of 99,820 publications met the selection criteria. We collected the international collaborative publications of which addresses of the authors resided in different countries and then established a collaborative papers library with 20,358 articles in total. Articles that originated from England, Scotland, Northern Ireland and Wales were grouped as the United Kingdom (UK).
2.2. Methods
For the study, the set of data was imported to the Bibexcel to carry out the bibliometric analysis. Bibexcel is a versatile bibliometric tool offering the user flexibility in data management and analysis [26]. It was applied for evaluating the research status and trends in the study period. We also divided the data into four-time intervals: 1998–2002, 2003–2007, 2008–2012 and 2013–2017, which aimed to mitigate the impact of annual fluctuation in the data and to keep the international collaboration analysis to a practical abstraction level. Bibexcel was used to extract basic information of countries from publications in each five-year dataset and analyze the number of co-publications across countries.
Co-authorship analysis is an approach to weight the countries based on their co-authoring in publication and demonstrate them in a network structure [27]. In previous co-authoring network studies, the Gini index was used as a measure of the distribution in productivity and network structure [28,29,30]. In our study, the Gini index is here applied to calculate the equilibrium degree in international collaborative research. The index is calculated as:
where Ci is the share of co-authoring of the ith group of countries and n is the number of groups of countries.
The diversity of international collaboration of countries was measured by using the entropy index, following the example of prior spatial diversity analysis of network communities [31]. In this study, the entropy of country c is calculated by:
where is the number of links between country i and country c divided by the total number of links from country c, and m is the total number of countries collaborating with country c.
Bibexcel was also used to identify the co-authoring of countries in one publication. These data are then processed and exported from Bibexcel to Ucinet 6 [32] for further network analysis. In this study, the co-authoring network is modeled as weighted undirected networks. Based on the network, we performed the following network measures:
- Nodes refer to countries in the co-authoring network. Number of nodes represents the absolute scale of the network during a focused time interval.
- Neighbor nodes refer to the nodes that directly connected to the target node. Number of neighbor nodes represents the scale of the scientific collaboration of a focused node.
- Average node degree is defined as the sum of neighbor nodes per node in the network divided by the total number of nodes, which represents the average number of partners per node in the overall network.
- Links refer to the co-authoring relationship between the connected countries. Number of links represents the number of connections among all nodes in the whole network. For a single node, this measure indicates the sum of connections between the focused node and its neighbor nodes.
- Average link strength is defined as the total number of connections among all nodes in the network divided by the number of existing pairs of nodes in the network. For a given node, it refers to the average number of connections between the target node and each of its neighbor nodes in the network, which indicates the average collaborative frequency of a country with its partner countries.
- Density is defined as the number of existing pairs of nodes divided by the number of all potential pairs of nodes, which evaluates the extensiveness and evolutionary trend of partnership in the overall international collaboration network.
- Centrality indicates the position of a country in the international collaboration network. Three centrality measures—degree centrality, betweenness centrality and closeness centrality—are used in our analysis. Degree centrality refers to the total number of connections between the focused node and other nodes, which reflects the node’s popularity by accessing more information from other nodes. Betweenness centrality is the frequency that the focused node lies on the shortest paths between other pairs of nodes, which reflects the node’s ability to control the information. Closeness centrality is the sum of the distances between focused nodes and all other nodes in a network, which reflects its ability to obtain and disseminating information.
- Clustering coefficient is a measure of the probability that any two neighbors of a mutual node are connected. When the entire network has a high clustering coefficient, it has a tendency to form cliques. As for nodes, a higher clustering coefficient indicates that the node has a higher tendency to form cliques.
- Average path length refers to the mean of the shortest paths between all pairs of nodes, which measures the overall connectedness of the network and also the network efficiency.
For visualization, three maps are used. The first one is the evolution map of collaborating countries which is visualized by VOSviewer [33]. The map is made by the weighted undirected network, which includes all collaborating countries that co-author with other countries. Thus, the countries that have no international collaboration are ruled out. The size of nodes in the network diagrams is proportional to its total number of co-publications for each country, while the weight of edges between nodes is proportional to the collaboration volume. Modular function in the VOSviewer is used to detect the clusters of nodes. The function runs at a resolution of 1 to draw out underlying network structures. The nodes are colored based on the modularity class they belong to.
The second visualization method is used to reveal different collaborative characteristics of countries by jointly analyzing the global share of total publication and the share of international collaborative publication. The visualization maps of these indicators at the national level provide insights in comprehending the underlying feature of different countries in the development of fuel cell technology.
The last visualization is an evolution map of common themes of collaboration. The dynamic change of the research themes is presented by the detection of thematic areas and its origins and interrelationships. A thematic area is defined as a set of evolved themes across different time intervals. In this visualization method, an evolution map is constructed in order to detect the thematic areas by demonstrating the transitions of concepts between time intervals. In thematic evolution map, in which the color of nodes represents the same thematic area of concepts, the distance between nodes indicates the relationship between concepts. The sunburst chart is then used to depict the evolution of collaborative themes of countries in different time intervals.
3. Results
3.1. General Trends of Fuel Cell International Collaboration
The interest of international scientific collaboration in the fuel cell field has increased substantially within the entire study period from 1998 to 2017. The per year total number of publications (TP), the total number of international collaborative publications (TICP) and the share of international collaborative publications (SICP) are shown in Figure 1. The results show that the values of TP and TICP increased stably during the study period. TP showed a 13-fold increase from 546 in 1998 to 9733 in 2017. TICP showed a similar increasing trend with total publications from 89 in 1998 to 2548 in 2017. The value of TICP was 20,358 between the years 1998 and 2017, which accounts for 20.39% of the total publications. Figure 1 also highlights per year SICP of total publications. From 1998 to 2004, SICP showed a tremendous fluctuation, which reached the highest of 22.27% in 2001 and hit the bottom of 14.6% in 2004. From 2005 to 2017, SICP exhibited an overall upward trend with slight fluctuation, which increased from 15.60% in 2005 to 26.18% in 2017.
As shown in Table 1, the total number of collaborating countries (TCC) grew from 27 in 1998 to 92 in 2017 with an average annual growth rate of 6.67%. TCC in 2015 was the highest (97). The total number of bilateral relations (TBR) in 2017 was 778, which was nearly 19-fold increase than that in 1998 (39). These results show that, as more countries participate in international collaboration, the range of cross-nation collaboration has become wider.
A ranking of top 10 productive countries in fuel cell international co-publication is shown in Figure 2. Countries include USA, China, Germany, UK, France, Japan, South Korea, Canada, Italy and Spain are ranked by their overall co-publication volume with 29.2%, 27.56%, 12.38%, 11.58%, 10%, 9.35%, 8.58%, 8%, 6.92% and 6.31% of the total international publications respectively. North America, Europe and East Asia had played a dominant role in the international scientific collaboration of fuel cells. China and South Korea showed the most evident growth compared with other countries in the last two decades. China had surpassed the USA as the most productive country in international collaboration since 2014. The ranking of South Korea had risen from the 14th in 1998 to top ten since 2003.
3.2. Network Analysis of Fuel Cell International Collaboration
3.2.1. Network Distribution
We use the Gini index to elaborate on the distribution of international collaboration network. The increase in the Gini index means that there is an increasingly uneven distribution in the scientific publication output among collaborating countries, and thus the research would be more densely distributed among a relatively small number of countries. The decrease of the Gini index would suggest the opposite. The results in Table 2 show that the uneven distribution of the collaboration network increased first and then decreased during the last two decades. Specifically, the Gini index was 0.38 in 1998 and gradually increased to 0.692 in 2015, and finally decreased to 0.662 in 2017.
As we can see, the number of collaborating countries was small in 1998, the Gini index was small and thus the scientific output ability of each country was relatively balanced. During 1998–2004, the Gini index increased significantly, indicating that a research gap among collaborating countries was gradually formed. During 2005–2015, the Gini index surpassed 0.6, which indicated a significant uneven distribution of scientific output among collaborating countries. The research gap was increasing between strong and weak countries in the network. The reason might be that developed economies such as the USA, Japan and Europe as well as emerging economies such as China and South Korea had taken fuel cell technology and research in their strategic plan at the early time. As a result, they performed high research and publishing capacity in early years and played a dominant role in international collaboration. After 2015, the Gini index began to decrease gradually, which indicated the absolute dominance of leading countries in the whole network was weakening, and the gap of publishing capacity between strong and weak countries was gradually narrowing. More new countries had realized the importance of fuel cell technology and were trying to catch-up through international collaboration. Although the index had declined slightly, a large research gap among collaborating countries still existed.
3.2.2. Characteristics of Countries
Table A1 in Appendix A shows the description of network characteristics of the top ten countries with the largest collaboration scale in each time interval. These results clearly show the expansion of collaboration scale of each country in the networks over time. Specifically, the USA had become the country with the largest quantity of international partners and was the largest collaboration partner in the collaboration network. China stood out not only because of the increase of partner countries but also because of the deeper extent of collaboration established with its partners. Judging from the results of entropy, the UK continually climbed and maintained the highest, meaning that the UK researchers had broadly diversified collaboration with researchers in other countries. Germany, France and Spain also had diversified international collaboration networks. By contrast, the entropy of the USA obviously decreased with time, which reflected the reduction in the diversity of collaboration and the concentration tendency of collaboration. The diversity of China had increased slightly but still retained at a low level, which focused on deep collaboration with minority key partners. Results of the clustering coefficient show that there was an increasing trend of forming cliques in Germany, France, Italy, Spain and Japan. India had the highest tendency to form cliques in the network.
Table A1 also shows the degree centrality of these countries. From 1998 to 2002, Germany and USA showed the first tier degree centrality. Subsequently, China’s degree centrality significantly increased and also joined the first tier. From 2013 to 2017, China took the first place in the collaboration network, meanwhile, the influence of USA was still strong. From the perspective of betweenness centrality, we can see that Germany exhibited higher betweenness centrality alongside France from 1998 to 2002. From 2003 to 2012, there were three new countries with high betweenness centrality coming into sight, including USA, UK and Japan. From 2013 to 2017, China began to show high betweenness centrality, and France exhibited the highest betweenness centrality, which means France played a significant role as intermediary and bridge in fuel cell international collaboration. It should be noted that, apart from the top ten countries mentioned in the table, the betweenness centrality of Turkey and South Africa showed a remarkable increase. The betweenness centrality of Turkey grew from 0 in 1998–2002 to 216.04 in 2013–2017, and the betweenness centrality of South Africa grew from 0 in 1998–2002 to 191.16 in 2013–2017. A further analysis shows that both of them were creating a large research collaboration network, including developed economies such as USA, Japan, Canada, UK and Germany, the emerging economies such as China, South Korea and India, and undeveloped economies such as Pakistan and Vietnam. This result shows that Turkey and South Africa had become new intermediaries that connect different countries widely. In addition, the closeness centrality of USA had remained in first place in the collaboration network over the past 20 years, which indicated its dominance of information exchange in the collaboration network.
3.2.3. Evolution of Networks
Table 3 shows the results of evolution analysis of the overall collaboration network within these time intervals. We can see that the network grew with the increase of new entrants and links, which also explains how the density of the networks increased. The results of the clustering coefficient show that countries in the networks have an increasing tendency to collaborate as groups. The table also shows that the average path length consistently declined from 2.208 to 1.991. It suggests that the number of intermediaries required to establish a connection between any two nodes in the network was declining and the collaboration networks were becoming more efficient. In addition, the average node degree and the average link strength increased gradually over all time intervals. From 1998 to 2002, a country had 7.16 partners and collaborated with each partner 2.7 times on average. Then, in 2013–2017, the figures had grown to 21.576 and 12.354 respectively.
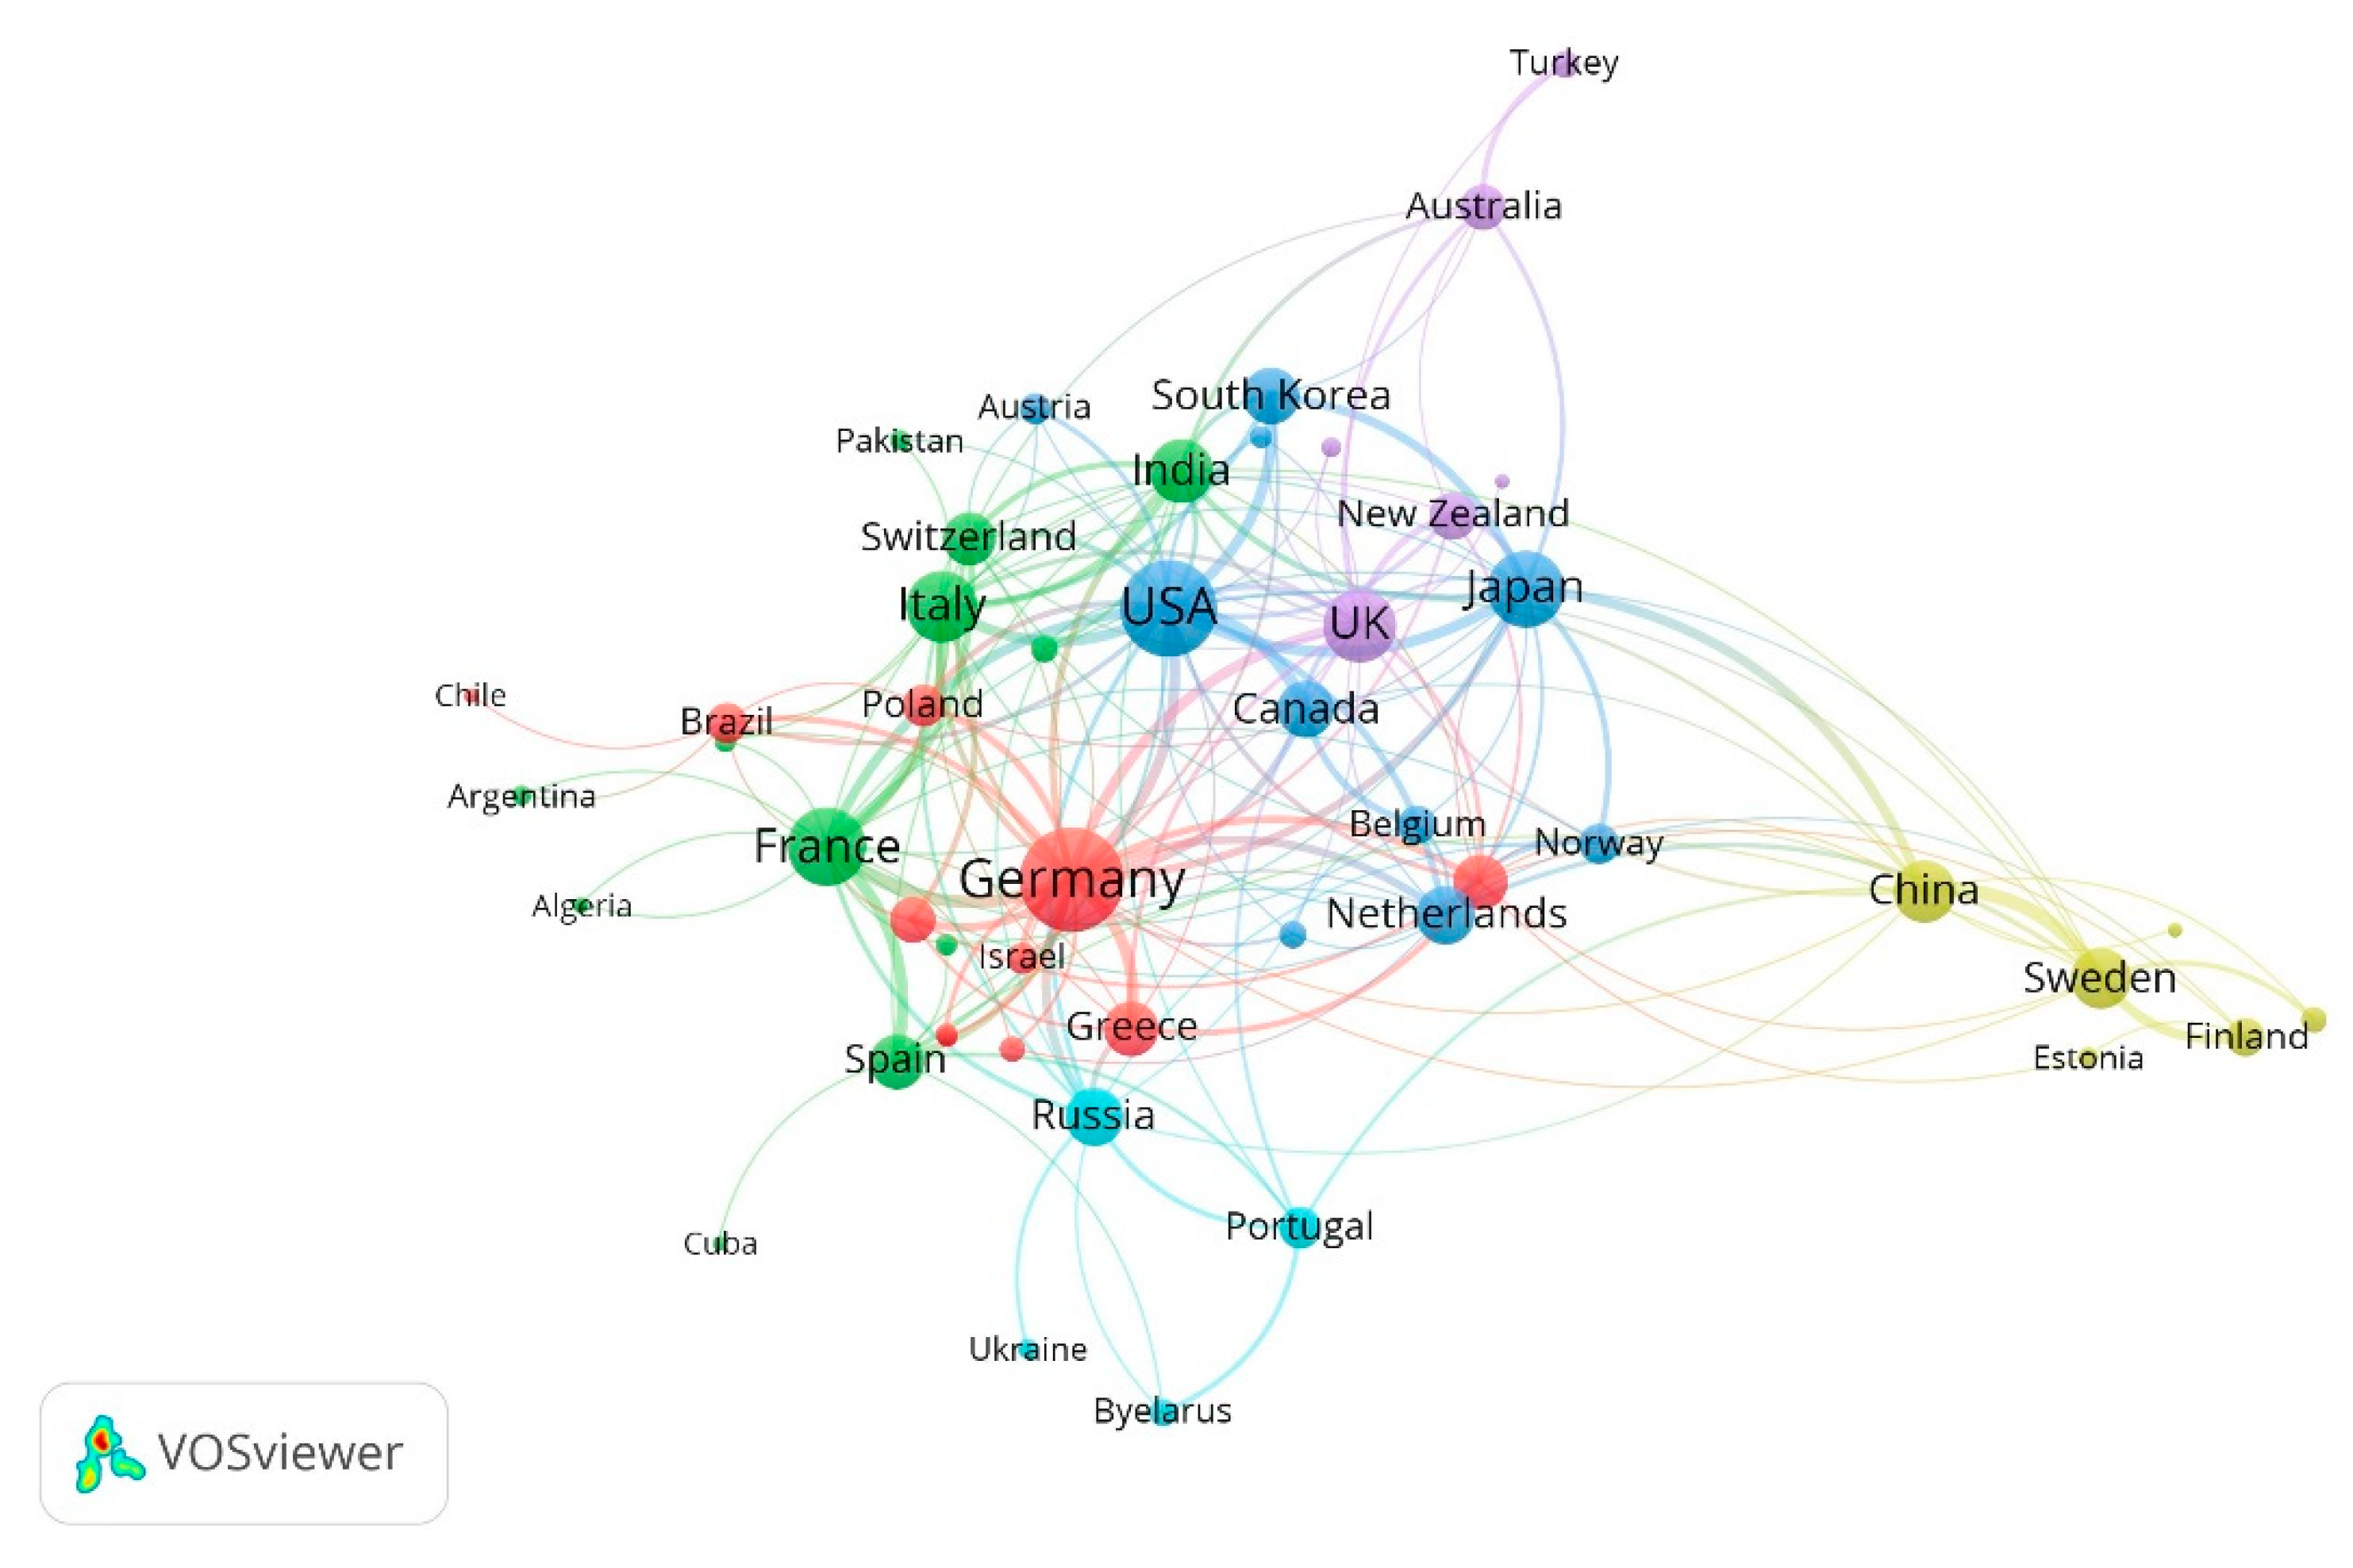
Figure 3, Figure 4, Figure 5 and Figure 6 display the collaboration networks of partner countries in each time interval. Firstly, as shown in Figure 3, a network was created with 50 nodes and 484 links during 1998–2002. Data showed that 59 countries published fuel cell-related research during this time interval, which indicates that 84.75% of them had joined the international collaboration. According to the algorithm of community detection, a multi-polar network structure was identified in the diagram, where USA, Germany, France, Japan, and the UK were significant core nodes. Judging from the communities in the network, some results can be given. The collaboration network of USA contained main partners from North America, Asia and Europe. European communities were dominated by four distinct countries, i.e., Germany, France, UK and Russia. China formed a collaboration community with several Nordic countries.
As depicted in Figure 4, the number of nodes and density significantly increased in the time interval during 2003–2007 relative to the former period. The network was created with 75 nodes and 2244 links. Data showed that 83 countries published fuel cell related research during this time interval, which indicates that 90.36% of them had joined the international collaboration. Compared with the previous network diagram, a trend of consolidation was presented in the network in this time interval. The USA, China, Japan, Canada and South Korea with several Asia countries merged into a large developing community. Germany, France, UK and several Nordic countries remained as separate European communities. In this period, as the new entrants searching for partner countries, all existing communities presented in Figure 4 were expanding in scale.
The continuous expansion of the fuel cell international collaboration network is shown in Figure 5. The network was created with 95 nodes and 7474 links during 2008–2012. There were 98 countries that published fuel cell-related research during this time interval, which indicates that 96.94% of them had joined the international collaboration. The number of collaborating countries and links had both increased and the network was further integrated. The USA-led community showed the formation of strong connections among USA, Canada and several Asian countries. Especially, a significant increase of collaboration intensity was occurring between China and USA, forming the strongest bilateral relation in the collaboration network. In Europe, the two communities driven by France and Germany had merged into one and the intensity of links within the community had also increased.
Finally, the network between 2013 and 2017 is visualized in Figure 6, which was created with 118 nodes and 15,727 links. There were 119 countries that published fuel cell related research during this time interval, which indicates that 99.16% of them had joined the international collaboration. Figure 6 also shows that the European community formed a strong collaboration cluster, possibly owing to the policy efforts made by the European Union and national governments. With the rise of China, a strong collaborative relationship continued to be maintained among USA, Canada, Japan, South Korea, Australia and Singapore. Interestingly, a number of West Asian countries shown in Figure 6 had emerged as a clique which connected to the China-USA network (green area in Figure 6). It should be noted that there was a rapid increase in the number of international publications in Saudi Arabia, which was highly related to the implementation of a series of Saudi Arabia’s fuel cell plans. Moreover, the sharp decrease of oil price and the raising awareness of resource preservation had driven Saudi Arabia to take actions that aim to transit from the oil-dependent economy to a sustainable energy economy.
3.3. Degree of International Collaboration at Country Level
Figure 7 jointly presents the global share of total publications for each country (TP%) and the share of multinational publications in a country’s total number of publications (ICP%) within each time interval. The size of each bubble in the figure indicates the contribution of international publications of each country in each time interval. Figure 7 reveals that these two indicators were negatively correlated, countries with fewer outputs showed a greater dependence on international collaboration. USA was the most productive country in total output during 1998–2012, while China surpassed the USA as the most productive country with striking growth rate during 2013–2017. Meanwhile, Asian countries achieved fast growth, especially Japan, South Korea and India, showing a relatively high volume of output. China, Japan and South Korea showed a relatively low level of international collaboration in each time interval, which indicates that their research mainly relied on domestic research. In terms of cross-nation collaboration rate, European and North American countries were relatively higher than that of Asian countries. From the global scope, there was a generally rising tendency of international collaboration. The average international collaboration rate of countries had increased from 40.3% in 1998–2002 to 68.57% in 2013–2017.
Statistical analysis of countries showed that the top twenty-five productive countries, as shown in Table A2 (in Appendix A), contribute about 90.11% and 92.05% to the international collaborative publications and overall publications, respectively. Table A2 provides an extensive list of the important contributors (top five countries and top five institutions) in the most productive twenty-five countries over the entire study period, as well as the entropy of each country. The entropy and top 5 aggregate international co-authorships observed of Germany (22.07, 52.3%), France (20.56, 54.7%) and the UK (28.23, 58.1%) suggest that these countries had relatively more diverse and balanced collaboration compared to others. The entropy and top 5 aggregate international co-authorships of Singapore (4.59, 89.2%), Australia (5.86, 86.3%), South Korea (6.9, 83%) and Taiwan (5.93, 82.7%) imply that their collaboration research was more concentrated to their important partner countries. Table A2 also shows that USA and China were the largest partners of each other, and 41.3% of international publications of South Korea were co-authored with the USA. The main partner of Australia and Singapore was China, such that, the collaboration rate with China accounts for 49.8% and 54.7% of their total international publication volume respectively. The collaboration rate of Taiwan with USA and China was 64.7% of its total international collaboration volume. Among the collaborating institutions, leading contributors are recognized as Chinese Acad Sci (China), Nanyang Technol Univ (Singapore), Georgia Inst Technol (USA), Harbin Inst Technol (China), Tsinghua Univ (China), Tech Univ Denmark (Denmark), CSIC (France), Natl Res Council Canada (Canada), Forschungszentrum Julich (Germany) and Univ Queensland (Australia).
3.4. Semantic Term Maps of Fuel Cell International Research Areas
Four semantic maps of keywords of international publications in each time interval in Figure 8, Figure 9, Figure 10 and Figure 11 provide clues for the dynamics of hot areas in fuel cell international scientific collaboration. The thematic area is defined by keywords that occur at least ten times. Three prominent thematic areas were recognized in the first time interval (Figure 8), and two of them—solid oxide fuel cell and transport and hydrogen fuel cell—were the main research areas during the entire study period. The largest thematic area (Figure 8) combined two themes, i.e., catalyst and direct methanol fuel cell, which had developed into two distinct thematic areas in the second period (Figure 9), i.e., (a) catalyst, and (b) direct methanol fuel cell and proton electrolyte membrane fuel cell. Then, these two thematic areas continued to break into three thematic areas in the third period (Figure 10), i.e., (a) catalyst, (b) proton electrolyte membrane fuel cell, and (c) direct methanol fuel cell. Finally, they evolved into three new thematic areas in the fourth period (Figure 11), i.e., (a) nanoparticles, (b) graphene and carbon nanotubes, and (c) proton electrolyte membrane fuel cell and direct methanol fuel cell. With the elapse of time, five thematic areas (proton electrolyte membrane fuel cell; direct methanol fuel cell; nanoparticle; graphene and carbon nanotubes and microbial fuel cell) were newly emerged and formed an expanded version of the original thematic areas. In terms of catalyst, research focus related to catalyst had shifted from platinum to nanoparticle, graphene and carbon nanotubes over time. In addition, research on microbial fuel cell had developed as a new prominent thematic area in international scientific collaboration during the last ten years. These results indicate that there had been remarkable expansion and diversification of research output of thematic areas during these time intervals.
The evolution of the research themes of the international collaboration of the top ten countries is also investigated. Figure 12 illustrates the share of international co-publication of each country in total international co-publications, together with the share of each theme in a country’s international collaborative themes within each time interval. Several previous collaborative themes of these countries usually included solid oxide fuel cell, phosphoric acid fuel cell, molten carbonate fuel cell, direct methanol fuel cell, as well as proton electrolyte membrane fuel cell. Whereas most recent studies focused on solid oxide fuel cell, hydrogen fuel cell, and microbial fuel cell. Canada, Italy, USA, and South Korea focused on hydrogen fuel cells, hydrogen production, transport and fuel cell application more than other countries. The UK, USA, and South Korea carried out collaborative research on microbial fuel cell at a relatively early time, and continuously maintained a high level of collaboration. In addition, China showed the most frequent collaboration in the research of catalyst, followed by USA, South Korea, and Japan.
4. Conclusions
In this study, a systematic bibliometric analysis of fuel cell international scientific collaboration is provided from a quantitative perspective. Social network analysis is conducted to analyze the collaboration among countries and co-occurrence of keywords. Following conclusions are drawn from the analysis of fuel cell international collaborative publications from 1998 to 2017.
Owing to the rapid development and research enthusiasm for fuel cell technology globally, fuel cell international collaborative publications had shown a steady increase, and the share of international collaboration publications also showed an overall upward trend. The share of fuel cell international collaborative publications in the total fuel cell publications had also increased from less than 16% in 1998 to more than 26% in 2017. This shows that international collaboration had played an important role in fostering global fuel cell innovation.
The USA, China, Germany, UK, France, Japan, South Korea, Canada, Italy and Spain were the top 10 productive countries in international collaboration. China and South Korea presented the most significant growth during 2000–2017. Meanwhile, China had surpassed the USA as the most important player in international collaboration since 2014.
During the past twenty years, more and more new countries had become involved in the international collaboration of fuel cells. Shown in Table 1 and Table 2, though the number of new entrants had increased significantly and an obvious catching-up process of weak countries was happening in recent years, a large research gap among collaborating countries still existed.
The USA had the largest quantity of partners and China’s collaboration with its partners was the deepest. France, USA, UK, China, Germany and Japan played important intermediary and bridge in fuel cell international collaboration. Turkey and South Africa had become new intermediaries that connect different countries widely. From the perspective of network efficiency, we discover a significant increase in average node degree and average link strength, the reducing of average distance is also discovered. An increasing trend of cliques forming is observed in the networks, which might due to the catching-up of new entrants by building partnerships among existing countries. The collaboration networks had evolved from a multi-polar network into a dominant structure with a strong collaboration system, where two strong clusters had formed around North America-Asia and Europe, and a small cluster had formed around West Asia.
Countries with fewer outputs show a greater dependence on international collaboration. European and North American countries had a higher degree of international collaboration in each time interval. Asian countries showed a relatively high level of output, but a relatively low level of international collaboration, which indicates that their research mainly relied on domestic collaboration. The results also show that there existed a generally rising tendency towards international collaboration in countries.
Among countries that had involved in international collaboration development of fuel cells, some countries actively seek international collaboration, such as the Germany, France and UK, who collaborated with a wide range of countries. While other countries may be more concentrate on collaborating with few main countries, such as Singapore, Australia, South Korea and Taiwan, who selectively collaborated with only a few countries.
Based on the keyword analysis, we have identified major research areas and shifts of key areas in fuel cell international collaboration research. Main thematic areas include solid oxide fuel cell, transport and hydrogen fuel cell, catalyst, proton electrolyte membrane fuel cell and direct methanol fuel cell. Emerging popular themes including new-type catalysts were developed to improve efficiency and reduce costs, such as nanoparticle and graphene. In addition, microbial fuel cell had been developed as a new prominent area in international collaborative research.
The development and innovation of fuel cell technology is an important part to achieve global sustainability in energy consumption and environmental preservation. The findings of our work provide guidance for researchers and policymakers to make the better decision in research development and policy-making. The study may help governments identify their positions in international scientific collaboration activities, and increase awareness of partner actions in order to utilize resources worldwide and compete in the R&D of fuel cells globally. On one hand, researchers from strong countries in the fuel cell field, especially community leading countries should enhance their international collaboration to foster the breakthrough of fuel cell technology innovation. On the other hand, the collaboration between strong and weak countries should be further enhanced to facilitate the adoption of advanced solutions in less developed countries, such that, the optimal solution of energy sustainability can achieve a better global application and benefit the world.
The research framework presented in this paper provide an integrated pattern of evolution analysis of international scientific collaboration. It can also be applied for similar analysis in other technical fields. Nevertheless, this paper has its limitations. First, this study is constrained by data. Literature data only show part of the scientific collaboration between countries. Further study should incorporate other forms of collaboration and interactions such as patent data, demonstration and commercial project data into the analysis of international collaboration. The second issue is related to the utilization of measures. It is considered that other measures and visualization methods may provide insights from different angles, which will be worthwhile to be explored in future work. Another limitation is that we have primarily examined the evolutionary dynamics of international collaboration from the perspective of network structure. Other factors such as geographic proximities and national policies are also important for the formation and evolution of the scientific collaboration network. How these factors influence the international collaboration development has not been fully analyzed. We leave these topics for future research.
Author Contributions
The manuscript was approved by all authors for publication. X.S. conceived and designed the study. X.S. and L.C. performed the experiments and wrote the paper. X.S. and J.J. reviewed and edited the manuscript. I would like to declare on behalf of my co-authors that the work described was original research that has not been published previously, and not under consideration for publication elsewhere, in whole or in part.
Funding
This research was funded by the Social Science Planning Project in Shandong Province of China, grant number 18DGLJ01, and the International Graduate Exchange Program of Beijing Institute of Technology.
Conflicts of Interest
The authors declare no conflict of interest.
Appendix A
Table A1 shows the description of network characteristics of the top ten countries with the largest collaboration scale in each time interval. It contains seven measures, respectively including neighbor nodes, average link strength, entropy, clustering coefficient, degree centrality, betweenness centrality, and closeness centrality.

Table A1.
Network characteristics of countries in four-time intervals.
| Time Interval | Country | Neigh. Nodes | Aver. Link Strength | Entropy | Clus. Coeff. | DC | BC | CC |
|---|---|---|---|---|---|---|---|---|
| 2013–2017 | USA | 80 | 49.06 | 7.39 | 0.34 | 3925 | 611.16 | 75.97 |
| UK | 71 | 24.52 | 26.15 | 0.39 | 1741 | 560.12 | 71.78 | |
| Germany | 70 | 25.97 | 22.86 | 0.41 | 1818 | 368.59 | 71.34 | |
| China | 68 | 60.9 | 7.66 | 0.42 | 4141 | 563.37 | 70.48 | |
| France | 65 | 22.97 | 22.33 | 0.42 | 1493 | 791.55 | 69.23 | |
| Spain | 65 | 16.2 | 21.77 | 0.44 | 1053 | 353.15 | 69.23 | |
| Italy | 61 | 18.21 | 15.83 | 0.49 | 1111 | 170.9 | 67.63 | |
| South Korea | 61 | 20.97 | 8.85 | 0.44 | 1279 | 362.49 | 67.24 | |
| Japan | 60 | 21.03 | 10.54 | 0.47 | 1262 | 402.06 | 66.86 | |
| India | 58 | 11.95 | 16.6 | 0.5 | 693 | 251.83 | 66.48 | |
| 2008–2012 | USA | 69 | 32.03 | 11.25 | 0.27 | 2210 | 828.1 | 79 |
| Germany | 57 | 17.81 | 19.67 | 0.36 | 1015 | 367.56 | 71.76 | |
| France | 57 | 15.77 | 19.35 | 0.35 | 899 | 498.47 | 71.76 | |
| Japan | 54 | 13.3 | 10.21 | 0.39 | 718 | 348.14 | 69.63 | |
| UK | 50 | 14.62 | 27.59 | 0.44 | 731 | 239.32 | 68.12 | |
| Canada | 49 | 11.76 | 8.56 | 0.42 | 576 | 230.13 | 67.14 | |
| China | 46 | 37.87 | 7.8 | 0.48 | 1742 | 229.55 | 66.2 | |
| Italy | 45 | 13.27 | 13.32 | 0.47 | 597 | 113.84 | 65.73 | |
| Spain | 44 | 10.59 | 16.45 | 0.44 | 466 | 165.42 | 64.83 | |
| India | 39 | 6.79 | 12.27 | 0.53 | 265 | 164.34 | 62.67 | |
| 2003–2007 | USA | 49 | 13.65 | 16.6 | 0.25 | 669 | 514.74 | 74.75 |
| Germany | 46 | 8.3 | 18.52 | 0.28 | 382 | 394.37 | 72.55 | |
| UK | 41 | 6.66 | 24.75 | 0.31 | 273 | 354.03 | 69.16 | |
| France | 38 | 6.89 | 13.85 | 0.34 | 262 | 277.92 | 67.27 | |
| Japan | 34 | 7.03 | 10.03 | 0.39 | 239 | 226.16 | 63.79 | |
| Canada | 34 | 6.35 | 7.93 | 0.38 | 216 | 128.07 | 64.35 | |
| Italy | 28 | 5.64 | 9.85 | 0.44 | 158 | 80.9 | 60.66 | |
| Spain | 26 | 5.81 | 13.25 | 0.42 | 151 | 117.38 | 59.68 | |
| Sweden | 26 | 4.73 | 12.99 | 0.5 | 123 | 76.26 | 59.68 | |
| Greece | 25 | 2.72 | 8.06 | 0.45 | 68 | 108.25 | 58.73 | |
| 1998–2002 | Germany | 27 | 4.59 | 19.97 | 0.27 | 124 | 245.27 | 69.01 |
| USA | 25 | 4.12 | 15.67 | 0.31 | 103 | 171.2 | 67.12 | |
| France | 23 | 2.74 | 9.85 | 0.27 | 63 | 218.54 | 62.82 | |
| UK | 22 | 2.55 | 15.52 | 0.33 | 56 | 169.8 | 62.82 | |
| Japan | 19 | 3.05 | 11.07 | 0.43 | 58 | 63.02 | 59.04 | |
| Italy | 17 | 2.82 | 9.6 | 0.43 | 48 | 45.53 | 56.98 | |
| India | 14 | 2.57 | 10.62 | 0.51 | 36 | 31.57 | 56.32 | |
| Netherlands | 14 | 2.07 | 8.85 | 0.41 | 29 | 42.5 | 56.32 | |
| Denmark | 13 | 2.15 | 10.05 | 0.41 | 28 | 73.25 | 53.26 | |
| China | 12 | 2.83 | 4.59 | 0.44 | 34 | 82.69 | 53.85 |
Note: Neigh. Nodes: neighbor nodes; Aver. Link Strength: average link strength; Clus. Coeff.: clustering coefficient; DC: degree centrality; BC: betweenness centrality; CC: closeness centrality.
Table A2 provides an extensive list of the important contributors (top five countries and top five institutions) in the most productive twenty-five countries over the entire study period, as well as the entropy of each country.
Table A2.
Diversity of international partners of top 25 productive countries.
| Country | Entropy | Countries (% Int. Pub.) of Origin of Co-Authors | Domestic and Foreign Institutions of Affiliation of Co-Authors |
|---|---|---|---|
| USA | 9.48 | China (32.9%); South Korea (12%); Canada (7%); Japan (7%); Germany (6.5%) | Georgia Inst Technol (4.9%); Penn State Univ (4.6%); Chinese Acad Sci (4.1%); Univ S Carolina (3%); MIT (2.8%) |
| China | 8.04 | USA (35.2%); Australia (10%); Japan (8.9%); UK (8%); Canada (7.5%) | Chinese Acad Sci (13.3%); Harbin Inst Technol (5.1%); Nanyang Technol Univ (5.1%); Tsinghua Univ (4.7%); Univ Sci Technol China (4.6%) |
| Germany | 22.07 | USA (15.4%); China (11.4%); France (11%); UK (7.5%); Italy (7%) | Forschungszentrum Julich (11.7%); Tech Univ Munich (4.8%); Tech Univ Berlin (4%); Karlsruhe Inst Technol (3.3%); Univ Stuttgart (3.3%) |
| UK | 28.23 | China (19.7%); USA (14.9%); Germany (8.5%); Spain (8.2%); Italy (6.8%) | Univ London Imperial Coll Sci Technol Med (11.7%); Univ ST Andrews (8.3%); Univ Birmingham (6%); Univ Cambridge (6%); Newcastle Univ (5.3%) |
| France | 20.56 | Germany (13.7%); Italy (13.4%); USA (12.3%); Spain (10%); China (5.3%) | CNRS (8.4%); Univ Poitiers (7.6%); Univ Grenoble Alpes (4.2%); CSIC (3.8%); Univ Montpellier 2 (3.3%) |
| Japan | 10.66 | China (26%); USA (21.6%); South Korea (10%); Australia (6.2%); UK (5.4%) | Natl Inst Mat Sci (10.2%); Kyushu Univ (8.5%); Tohoku Univ (8.1%); Univ Tokyo (6.9%); Natl Inst Adv Ind Sci Technol (6.2%) |
| South Korea | 6.9 | USA (41.3%); China (16%); Japan (11%); India (8.9%); UK (5.8%) | Chonbuk Natl Univ (8.5%); Korea Inst Sci Technol (7.3%); Korea Adv Inst Sci Technol (6.6%); Seoul Natl Univ (6.3%); Hanyang Univ (5.6%) |
| Canada | 9.69 | China (25.5%); USA (25.2%); Germany (6.5%); UK (5.7%); France (5.4%) | Natl Res Council Canada (14.5%); Univ Waterloo (10.8%); Univ British Columbia (7.6%); Univ Alberta (7%); Simon Fraser Univ (4.8%) |
| Italy | 14.87 | USA (20.5%); France (19%); Germany (12.3%); UK (10.4%); Spain (8.6%) | CNR (10.1%); Univ Roma Tor Vergata (9.5%); Univ Genoa (8%); Politecn Milan (6.5%); Univ Padua (6.3%) |
| Spain | 19.92 | France (15.9%); UK (14.3%); Germany (11.6%); USA (10.6%); Italy (9.7%) | CSIC (24.9%); Univ La Laguna (5.6%); Univ Barcelona (5%); Univ Alicante (4.2%); Univ Politecn Valencia (4.2%) |
| Australia | 5.86 | China (49.8%); USA (11.1%); Japan (10.5%); UK (7.6%); Singapore (7.3%) | Univ Queensland (23.2%); Curtin Univ (19.3%); Monash Univ (10.2%); Nanyang Technol Univ (7%); Univ New S Wales (6.3%) |
| India | 15.29 | USA (19.6%); South Korea (17.2%); Germany (9.6%); Japan (9.3%); UK (8%) | Indian Inst Technol (16.8%); Indian Inst Sci (4.4%); Anna Univ (4.1%); Chonbuk Natl Univ (3.9%); Madurai Kamaraj Univ (3.9%) |
| Singapore | 4.59 | China (54.7%); Australia (11.7%); USA (11.1%); UK (7.3%); South Korea (4.4%) | Nanyang Technol Univ (65%); Natl Univ Singapore (27.6%); Chinese Acad Sci (6.6%); Astar (4.7%); Sun Yat Sen Univ (4%) |
| Sweden | 13.41 | China (32.7%); Finland (9.3%); Germany (8.7%); UK (8.7%); Pakistan (8.6%) | Lund Univ (19.5%); Royal Inst Technol (19.5%); Chalmers (14.3%); Royal Inst Technol KTH (10.9%); Hubei Univ (8.2%) |
| Switzerland | 13.56 | Germany (24.9%); USA (20.9%); France (10.6%); Italy (10%); Denmark (8%) | Paul Scherrer Inst (26.8%); Ecole Polytech Fed Lausanne (22.8%); ETH (16.7%); Swiss Fed Inst Technol (9.1%); EMPA (7.4%) |
| Russia | 13.54 | Germany (26.9%); France (17.8%); USA (13.1%); Greece (8.8%); UK (7.3%) | Russian Acad Sci (29.9%); Moscow Mv Lomonosov State Univ (18.6%); Boreskov Inst Catalysis (7%); Forschungszentrum Julich (7%); Univ Thessaly (6.5%) |
| Denmark | 14.89 | USA (19.8%); Germany (19.1%); China (15.1%); Sweden (9%); Switzerland (8.7%) | Tech Univ Denmark (56.8%); Aalborg Univ (8.5%); Univ Copenhagen (7.3%); Riso Natl Lab (6%); Aarhus Univ (4.7%) |
| Taiwan | 5.93 | China (36.3%); USA (28.4%); India (6.8%); Canada (6.6%); Japan (4.6%) | Natl Taiwan Univ (19.2%); Natl Cheng Kung Univ (12%); Natl Taiwan Univ Sci Technol (11.8%); Yuan Ze Univ (10.3%); Natl Taipei Univ Technol (6.5%) |
| Brazil | 12.41 | France (17.7%); USA (15.2%); Italy (13.2%); Germany (11%); Spain (8.6%) | Univ Sao Paulo (30%); Scuola Sci Mat (6.2%); Univ Poitiers (5.6%); Univ Fed Santa Catarina (4.5%); Ipen Cnen Sp (4.3%) |
| Netherlands | 17.29 | Germany (22.6%); USA (13.6%); UK (12%); Italy (10.6%); France (10.4%) | Delft Univ Technol (22.8%); Univ Twente (10%); Eindhoven Univ Technol (9.4%); Wageningen Univ (6.8%); Leiden Univ (6.4%) |
| Saudi Arabia | 14.65 | Egypt (19.4%); USA (18.4%); China (17.2%); South Korea (14.5%); Japan (9.3%) | King Saud Univ (26.2%); King Abdulaziz Univ (20.8%); King Abdullah Univ Sci Technol (12.5%); Chonbuk Natl Univ (7.4%); Menia Univ (7.4%) |
| Portugal | 16.4 | Spain (21.7%); Germany (12.9%); USA (9.6%); Russia (9.3%); Byelarus (8.5%) | Univ Aveiro (44.7%); Univ Porto (16.8%); CSIC (9.8%); Univ Lisbon (7.2%); Belarusian State Univ (6.2%) |
| Iran | 11.78 | USA (24.8%); Canada (16.8%); Malaysia (14.7%); South Korea (8%); Switzerland (7.2%) | Islamic Azad Univ (13%); Amirkabir Univ Technol (12%); Univ Tehran (9.3%); Tarbiat Modares Univ (7.2%); Univ Teknol Malaysia (6.7%) |
| Poland | 17.58 | Germany (15.5%); Italy (14.4%); USA (14.4%); France (12.5%); Japan (12%) | Agh Univ Sci Technol (21.5%); Polish Acad Sci (16.6%); Warsaw Univ Technol (12.5%); Univ Warsaw (11.7%); Gdansk Univ Technol (10%) |
| Belgium | 16.68 | China (19.3%); France (17.3%); Australia (14.6%); USA (14.6%); Germany (10.7%) | Univ Ghent (29.5%); Katholieke Univ Leuven (14%); Univ Queensland (12%); Univ Liege (7.7%); Univ Antwerp (7.4%) |
Note: % Int. Pub.: share of international publications in a country’s total number of co-publications.
References
- Sustainable Innovation Forum 2017. Available online: http://www.cop-23.org/ (accessed on 1 November 2018).
- Cropper, M.A.J.; Geiger, S.; Jollie, D.M. Fuel cells: A survey of current developments. J. Power Sources 2004, 131, 57–61. [Google Scholar] [CrossRef]
- Karim, N.A.; Kamarudin, S.K. An overview on non-platinum cathode catalysts for direct methanol fuel cell. Appl. Energy 2013, 103, 212–220. [Google Scholar] [CrossRef]
- Andújar, J.M.; Segura, F. Fuel cells: History and updating. A walk along two centuries. Renew. Sustain. Energy Rev. 2009, 13, 2309–2322. [Google Scholar] [CrossRef]
- Ahmad, M.M.; Kamarudin, S.K.; Daud, W.R.W.; Yaakub, Z. High power passive μDMFC with low catalyst loading for small power generation. Energy Convers. Manag. 2010, 51, 821–825. [Google Scholar] [CrossRef]
- Basri, S.; Kamarudin, S.K. Process system engineering in direct methanol fuel cell. Int. J. Hydrogen Energy 2011, 36, 6219–6236. [Google Scholar] [CrossRef]
- Sharaf, O.Z.; Orhan, M.F. An overview of fuel cell technology: Fundamentals and applications. Renew. Sustain. Energy Rev. 2014, 32, 810–853. [Google Scholar] [CrossRef]
- Das, V.; Padmanaban, S.; Venkitusamy, K.; Selvamuthukumaran, R.; Blaabjerg, F.; Siano, P. Recent advances and challenges of fuel cell based power system architectures and control—A review. Renew. Sustain. Energy Rev. 2017, 73, 10–18. [Google Scholar] [CrossRef]
- Manganote, E.J.T.; Araujo, M.S.; Schulz, P.A. Visualization of ranking data: Geographical signatures in international collaboration, leadership and research impact. J. Informetr. 2014, 8, 642–649. [Google Scholar] [CrossRef]
- Coccia, M.; Wang, L. Evolution and convergence of the patterns of international scientific collaboration. Proc. Natl. Acad. Sci. USA 2016, 113, 2057–2061. [Google Scholar] [CrossRef]
- Dawes, S.S.; Gharawi, M.A.; Burke, G.B. Transnational public sector knowledge networks: Knowledge and information sharing in a multi-dimensional context. Gov. Inf. Q. 2012, 29, 112–120. [Google Scholar] [CrossRef]
- Kim, K.W. Measuring international research collaboration of peripheral countries: Taking the context into consideration. Scientometrics 2006, 66, 231–240. [Google Scholar] [CrossRef]
- Hagedoorn, J.; Link, A.N.; Vonortas, N.S. Research partnerships1. Res. Policy 2000, 29, 567–586. [Google Scholar] [CrossRef]
- Arunachalam, S.; Viswanathan, B. A historiographic analysis of fuel-cell research in Asia–China racing ahead. Curr. Sci. India 2008, 95, 36–49. [Google Scholar]
- Suominen, A.; Tuominen, A. Analyzing the Direct Methanol Fuel Cell technology in portable applications by a historical and bibliometric analysis. J. Bus. Chem. 2010, 7, 117–130. [Google Scholar]
- Girap, P.; Kumar, A.; Mohan, L.; Surwase, G.; Kademani, B.S. Scientometric dimensions of fuel cell research as reflected in INIS database. SRELS J. Inf. Manag. 2011, 48, 329–348. [Google Scholar]
- Cindrella, L.; Fu, H.Z.; Ho, Y.S. Global thrust on fuel cells and their sustainability–an assessment of research trends by bibliometric analysis. Int. J. Sustain. Energy 2014, 33, 125–140. [Google Scholar] [CrossRef]
- Klitkou, A.; Nygaard, S.; Meyer, M. Tracking techno-science networks: A case study of fuel cells and related hydrogen technology R&D in Norway. Scientometrics 2007, 70, 491–518. [Google Scholar]
- Chen, H.Q.; Wang, X.; He, L.; Chen, P.; Wan, Y.; Yang, L.; Jiang, S. Chinese energy and fuels research priorities and trend: A bibliometric analysis. Renew. Sustain. Energy Rev. 2016, 58, 966–975. [Google Scholar] [CrossRef]
- Suominen, A. Phases of growth in a green tech research network: A bibliometric evaluation of fuel cell technology from 1991 to 2010. Scientometrics 2014, 100, 51–72. [Google Scholar] [CrossRef]
- Ogawa, T.; Takeuchi, M.; Kajikawa, Y. Comprehensive analysis of trends and emerging technologies in all types of fuel cells based on a computational method. Sustainability 2018, 10, 458. [Google Scholar] [CrossRef]
- Luukkonen, T.; Persson, O.; Sivertsen, G. Understanding patterns of international scientific collaboration. Sci. Technol. Hum. Values 1992, 17, 101–126. [Google Scholar] [CrossRef]
- Laudel, G. Collaboration, creativity and rewards: Why and how scientists collaborate. Int. J. Technol. Manag. 2001, 22, 762–781. [Google Scholar] [CrossRef]
- Puuska, H.M.; Muhonen, R.; Leino, Y. International and domestic co-publishing and their citation impact in different disciplines. Scientometrics 2014, 98, 823–839. [Google Scholar] [CrossRef]
- Coccia, M.; Bozeman, B. Allometric models to measure and analyze the evolution of international research collaboration. Scientometrics 2016, 108, 1065–1084. [Google Scholar] [CrossRef]
- Persson, O.; Danell, R.; Schneider, J.W. How to use Bibexcel for various types of bibliometric analysis. In Celebrating Scholarly Communication Studies: A Festschrift for Olle Persson at His 60th Birthday; ISSI: Lund, Sweden, 2009; pp. 9–24. [Google Scholar]
- Glänzel, W. National characteristics in international scientific co-authorship relations. Scientometrics 2001, 51, 69–115. [Google Scholar] [CrossRef]
- Franceschet, M. Collaboration in computer science: A network science approach. J. Am. Soc. Inf. Sci. Technol. 2011, 62, 1992–2012. [Google Scholar] [CrossRef]
- Barnett, G.A.; Park, H.W.; Jiang, K.; Tang, C.; Aguillo, I.F. A multi-level network analysis of web-citations among the world’s universities. Scientometrics 2014, 99, 5–26. [Google Scholar] [CrossRef]
- Kim, J.; Tao, L.; Lee, S.H.; Diesner, J. Evolution and structure of scientific co-publishing network in Korea between 1948–2011. Scientometrics 2016, 107, 27–41. [Google Scholar] [CrossRef]
- Dehdarian, M.A. Three Essays on Methodologies for Dynamic Modeling of Emerging Socio-Technical Systems: The Case of Smart Grid Development. Doctoral Dissertation, Ecole Polytechnique Fédérale de Lausanne, Lausanne, Switzerland, 2017. [Google Scholar]
- Borgatti, S.P.; Everett, M.G.; Freeman, L.C. Ucinet 6 for Windows: Software for Social Network Analysis; Analytic Technologies: Harvard, MA, USA, 2002. [Google Scholar]
- Van Eck, N.; Waltman, L. Software survey: VOSviewer, a computer program for bibliometric mapping. Scientometrics 2009, 84, 523–538. [Google Scholar] [CrossRef]
Figure 1.
Total number of publications, total number of international collaborative publications and share of international collaborative publications in fuel cells from 1998 to 2017.
Figure 1.
Total number of publications, total number of international collaborative publications and share of international collaborative publications in fuel cells from 1998 to 2017.
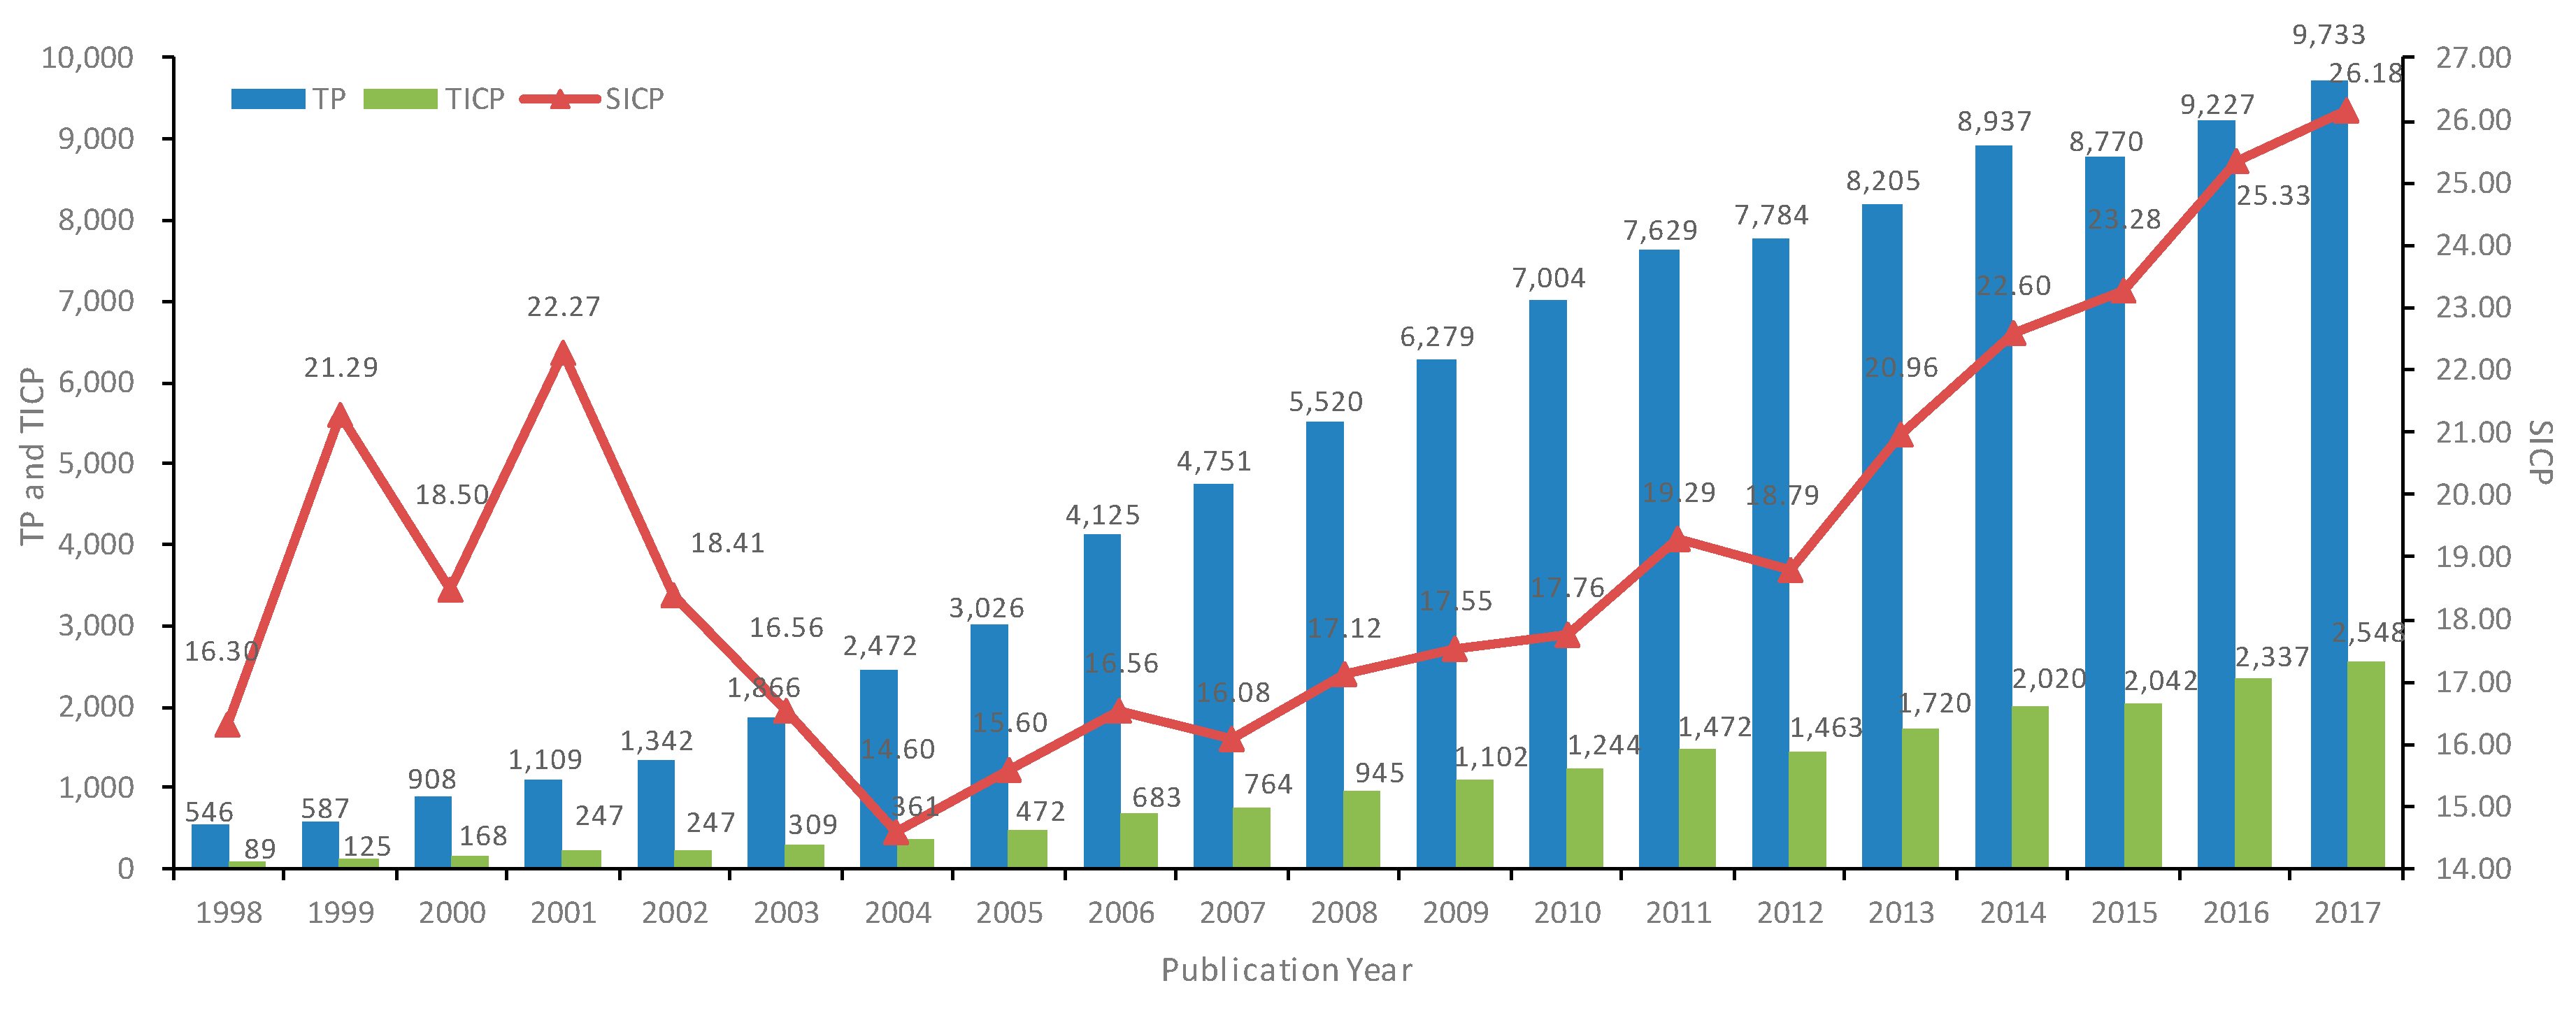
Figure 2.
Top 10 productive countries of international co-publications from 1998 to 2017.
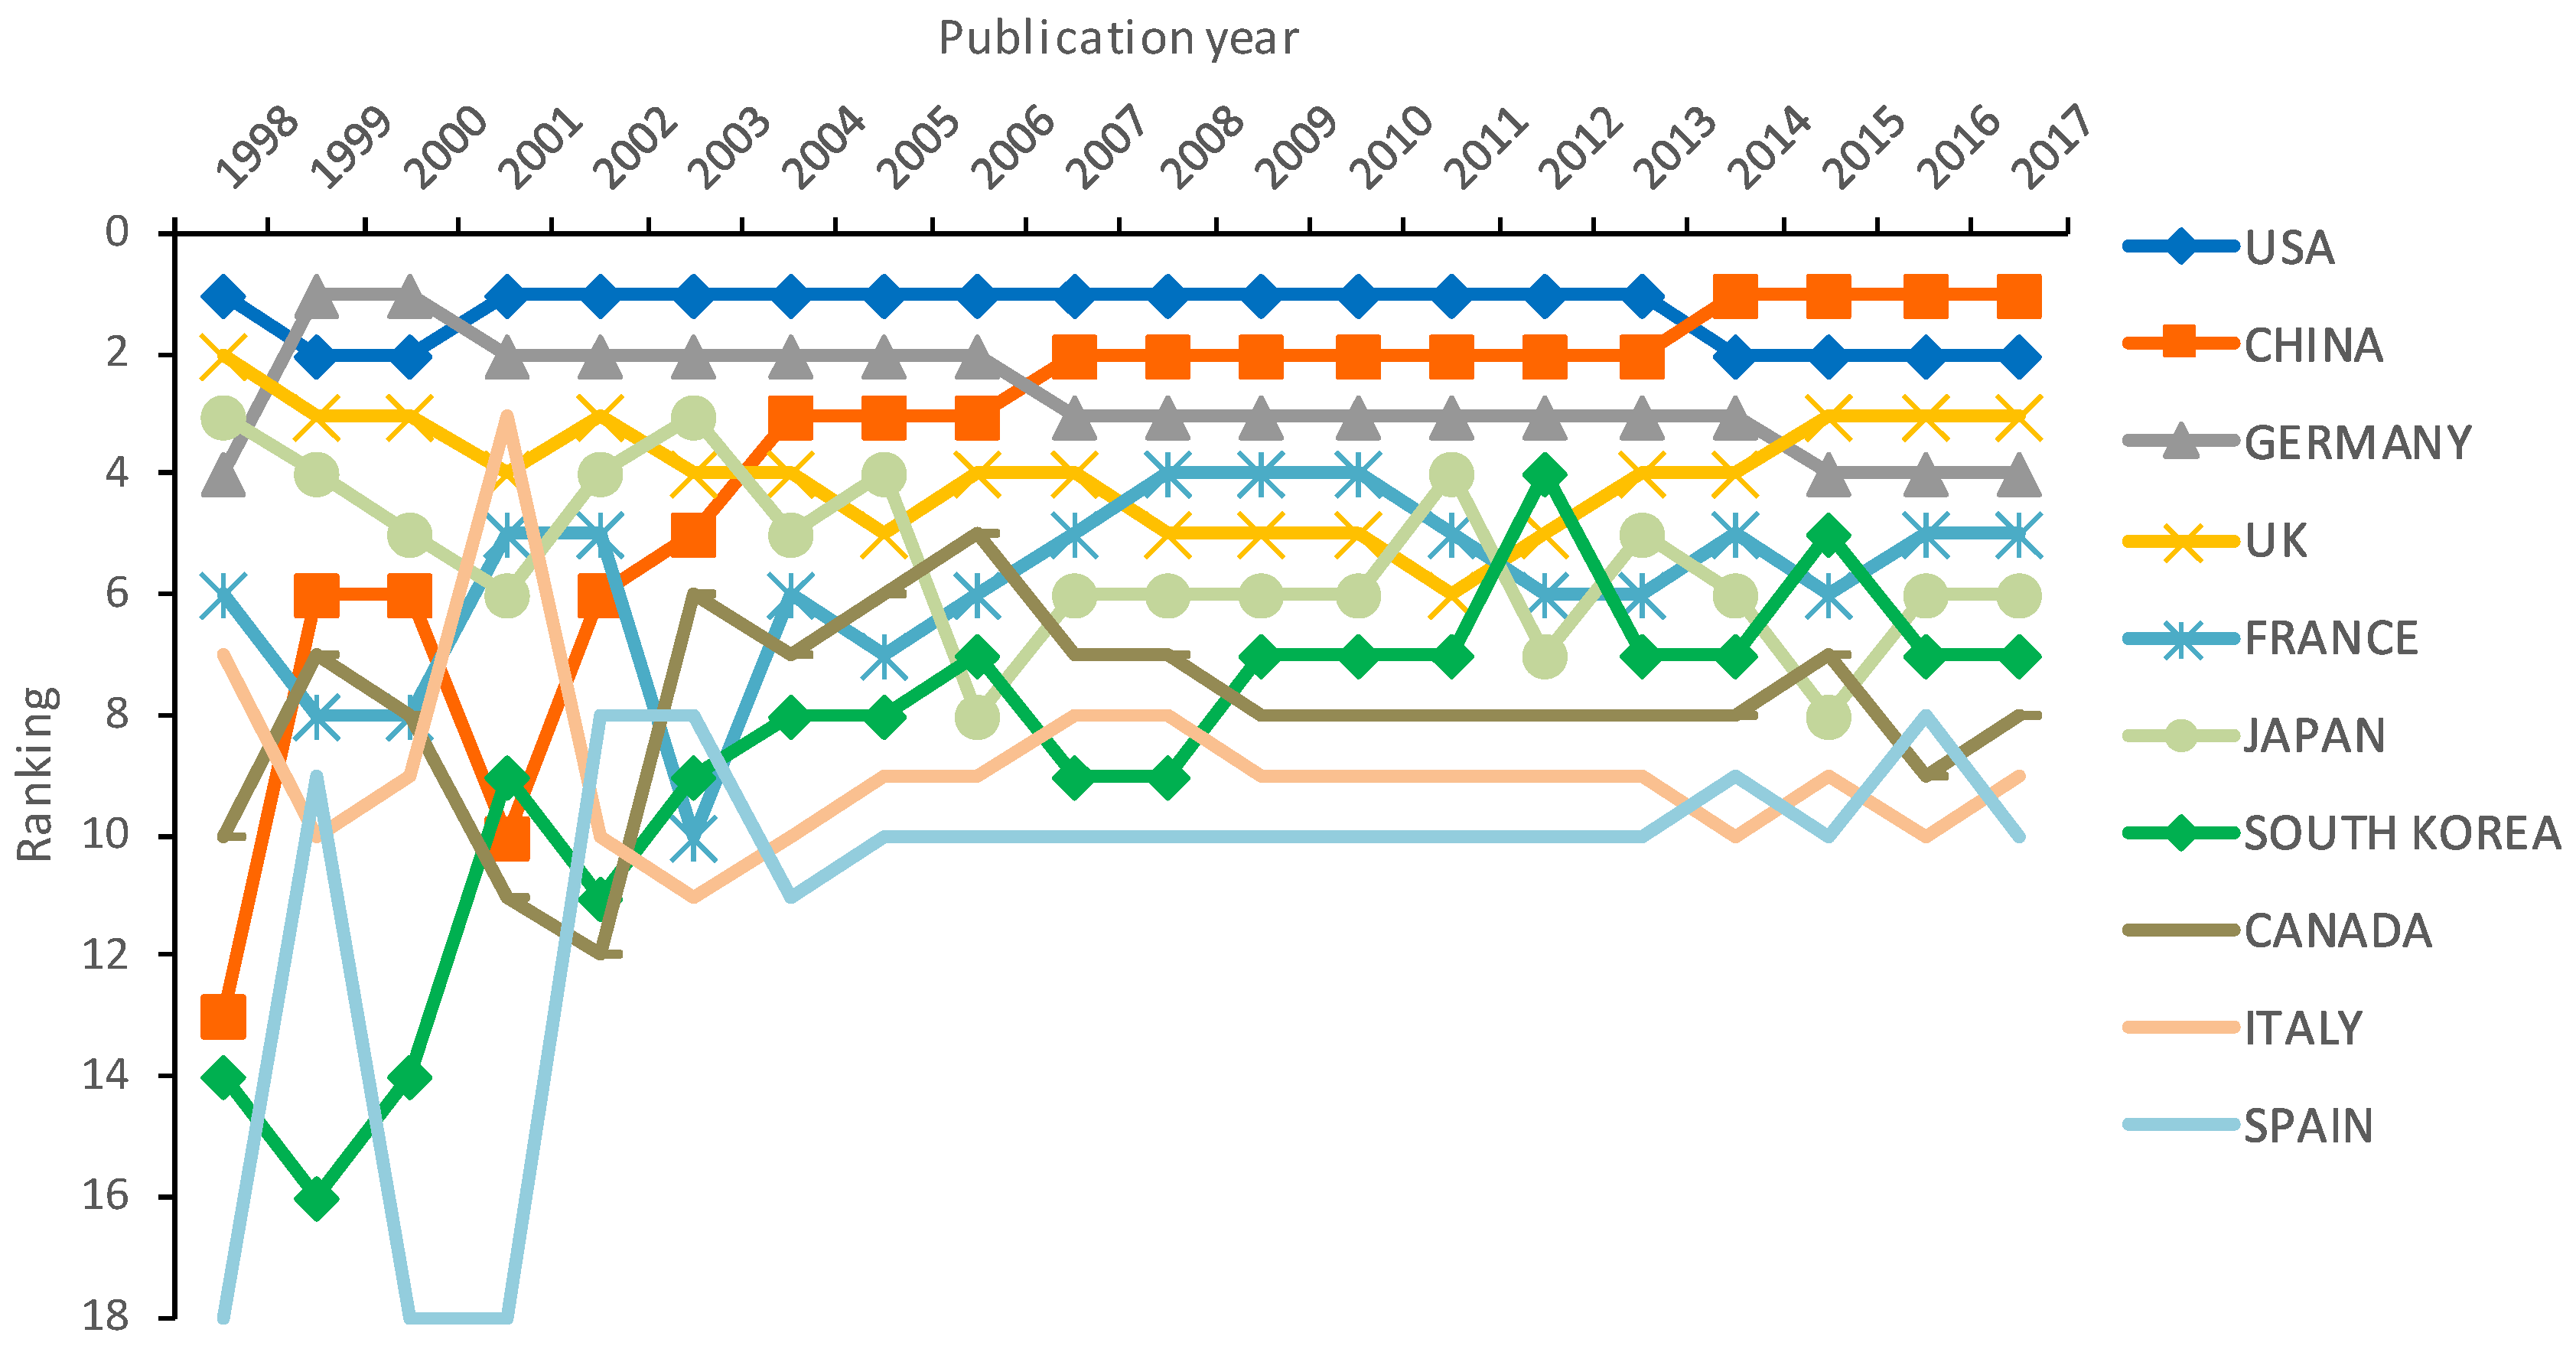
Figure 3.
Network diagram of international collaboration during 1998–2002.

Figure 4.
Network diagram of international collaboration during 2003–2007.

Figure 5.
Network diagram of international collaboration during 2008–2012.
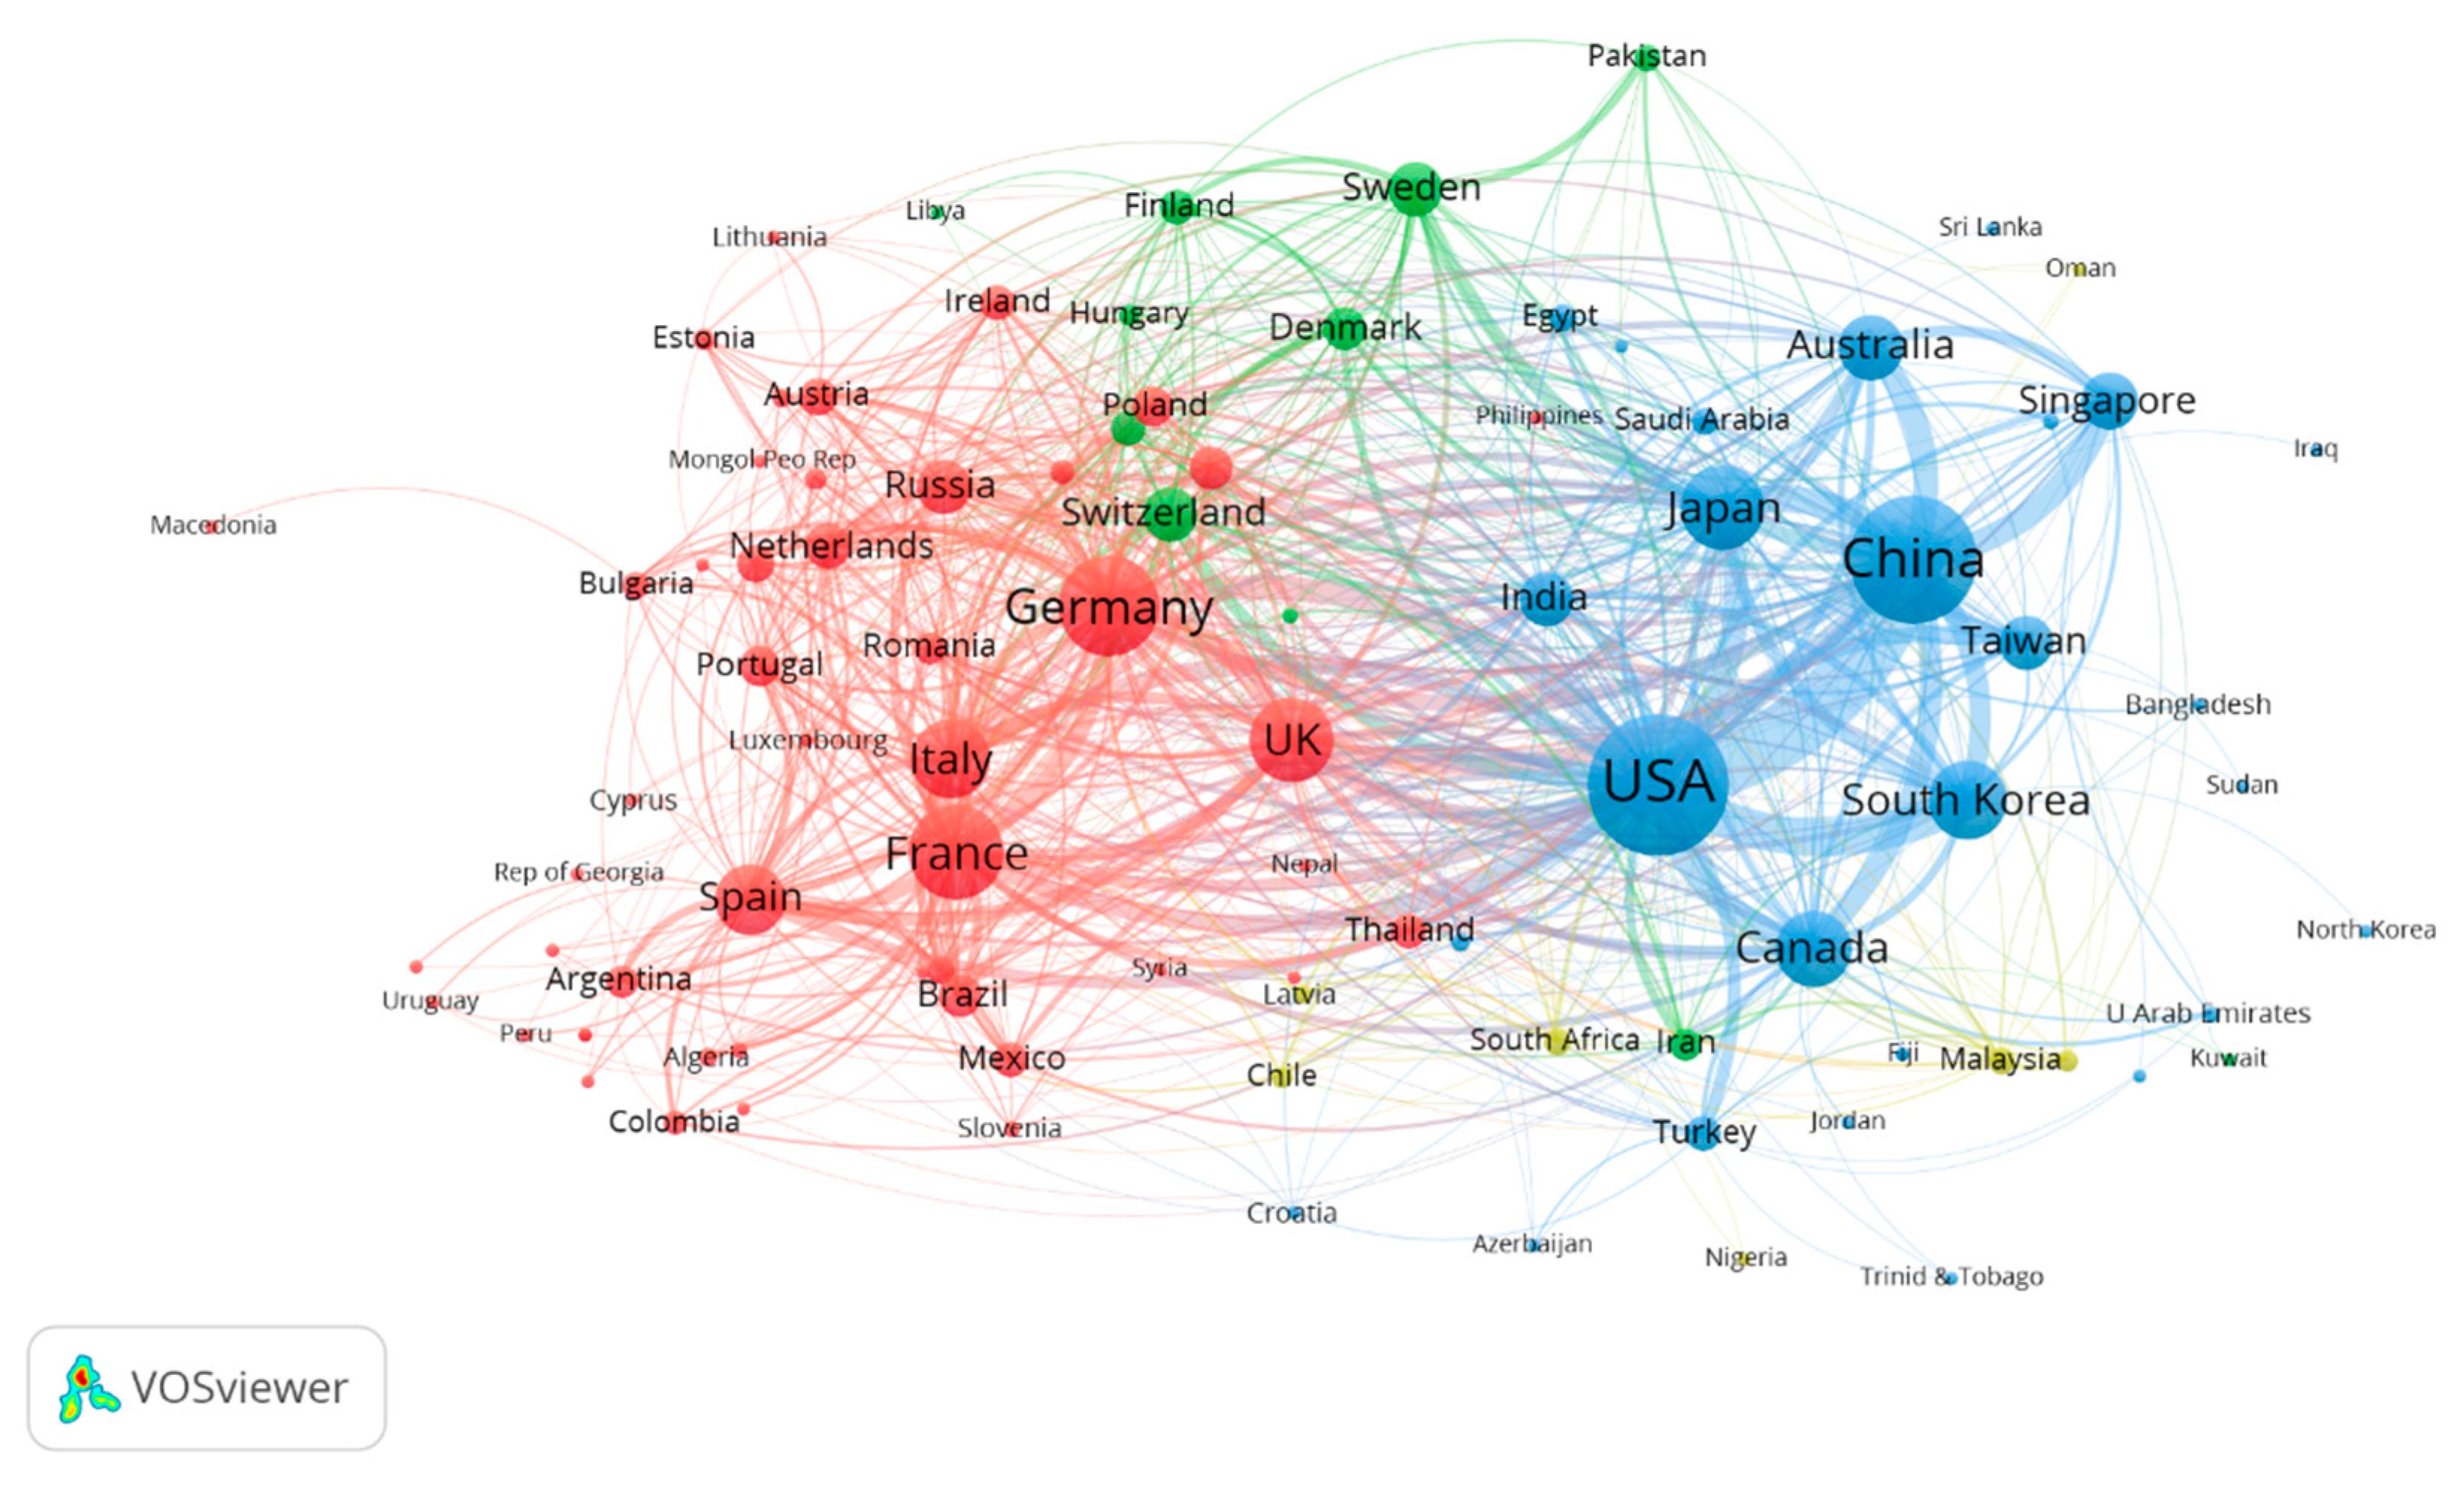
Figure 6.
Network diagram of international collaboration during 2013–2017.
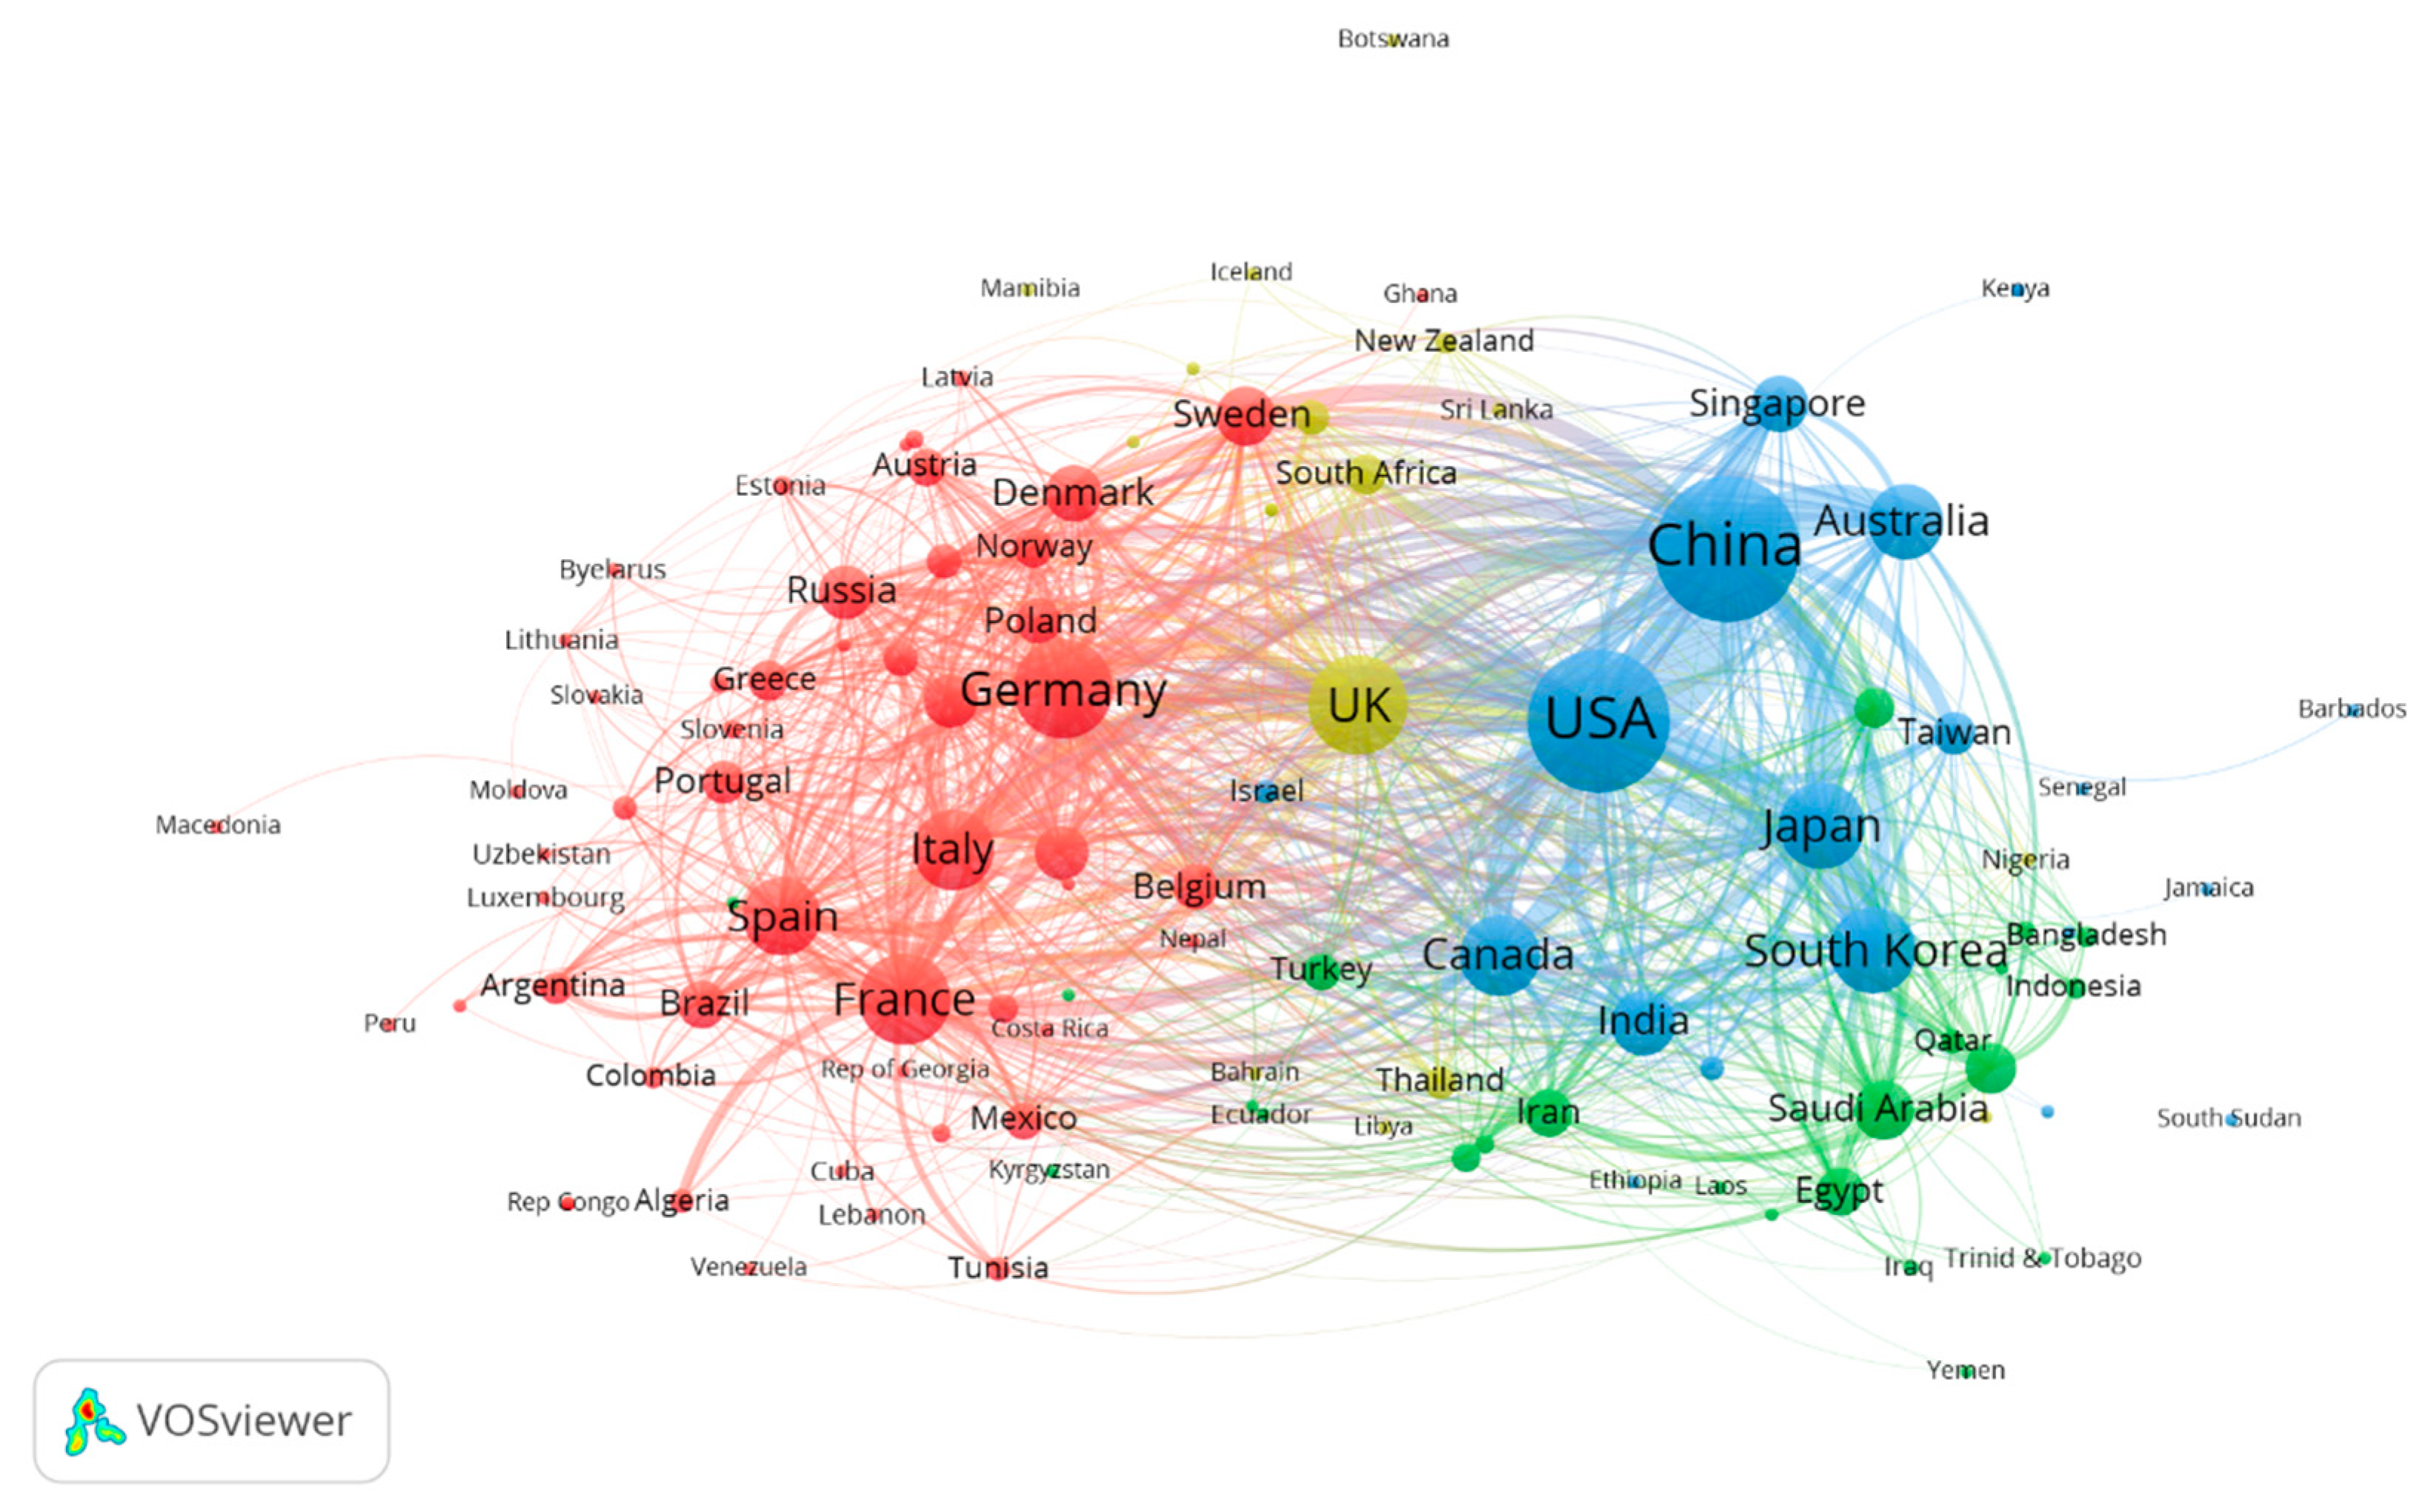
Figure 7.
The share of international collaborative publications in each country compared to the global share of total publications of countries in five-year time intervals.
Figure 7.
The share of international collaborative publications in each country compared to the global share of total publications of countries in five-year time intervals.

Figure 8.
Semantic term map of 876 international co-publications during 1998–2002.
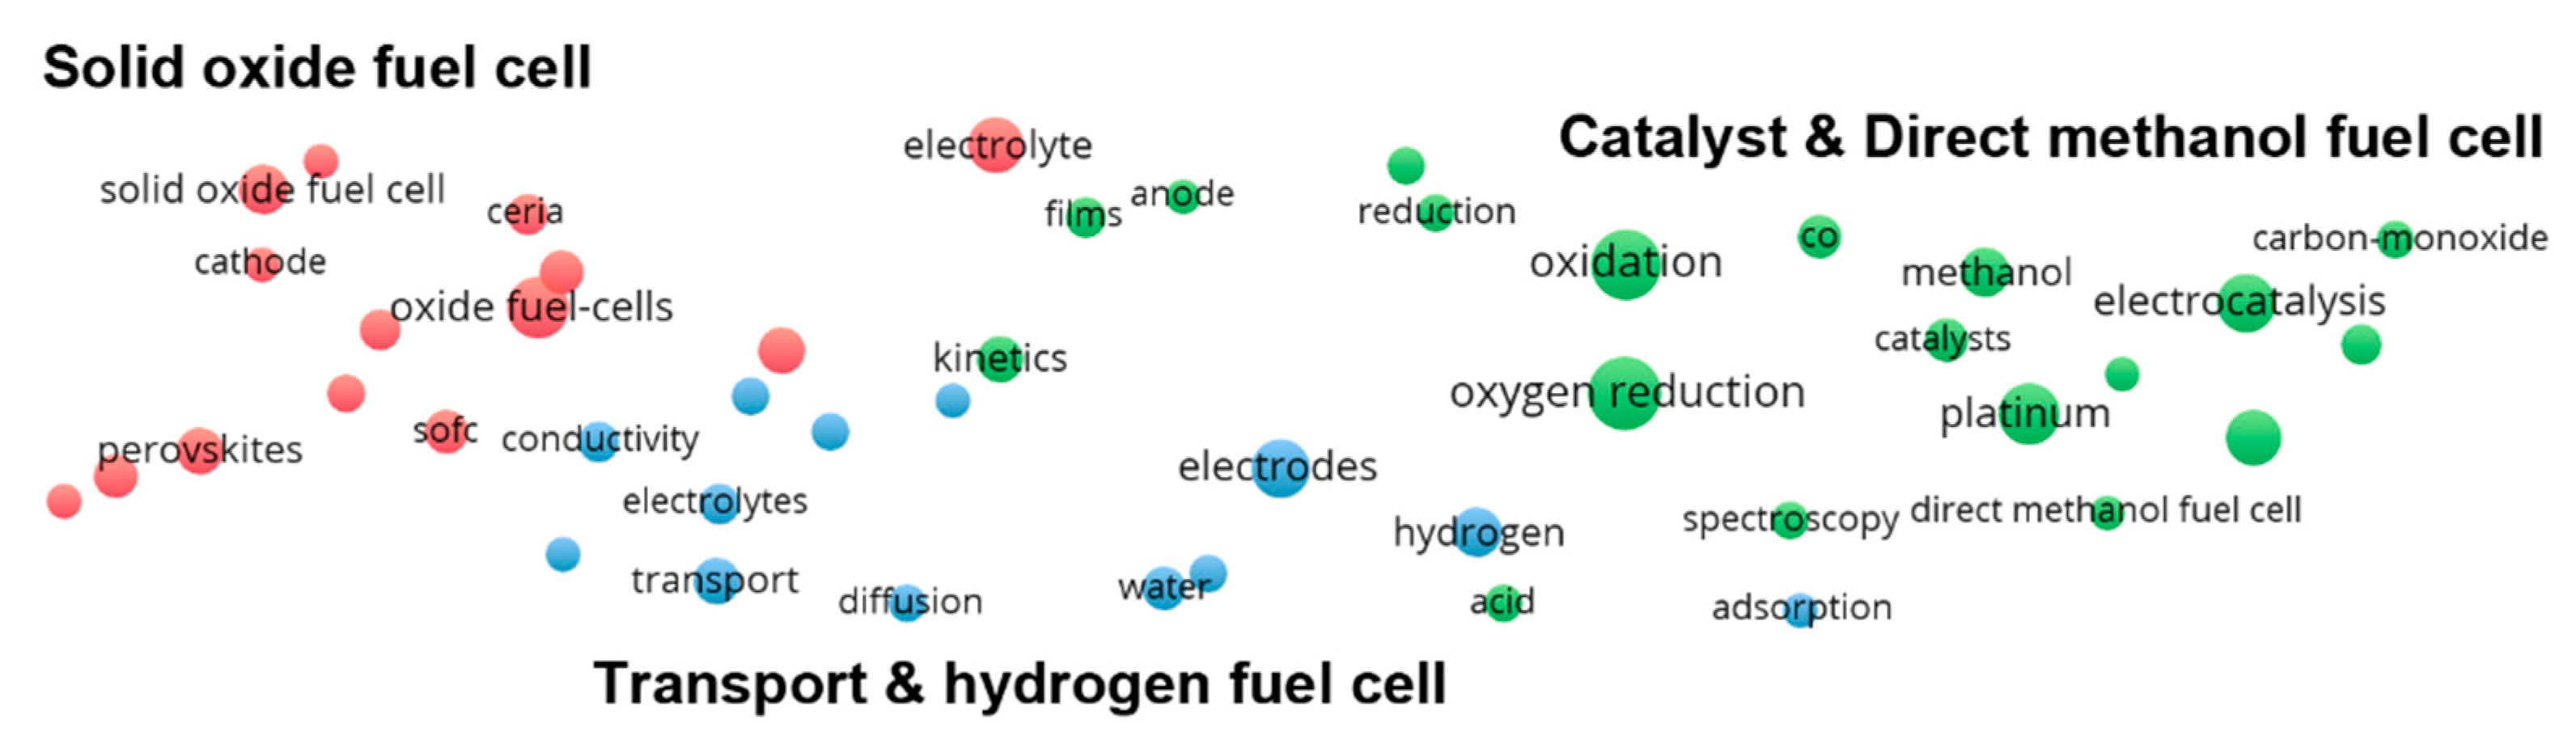
Figure 9.
Semantic term map of 2589 international co-publications during 2003–2007.

Figure 10.
Semantic term map of 6226 international co-publications during 2008–2012.
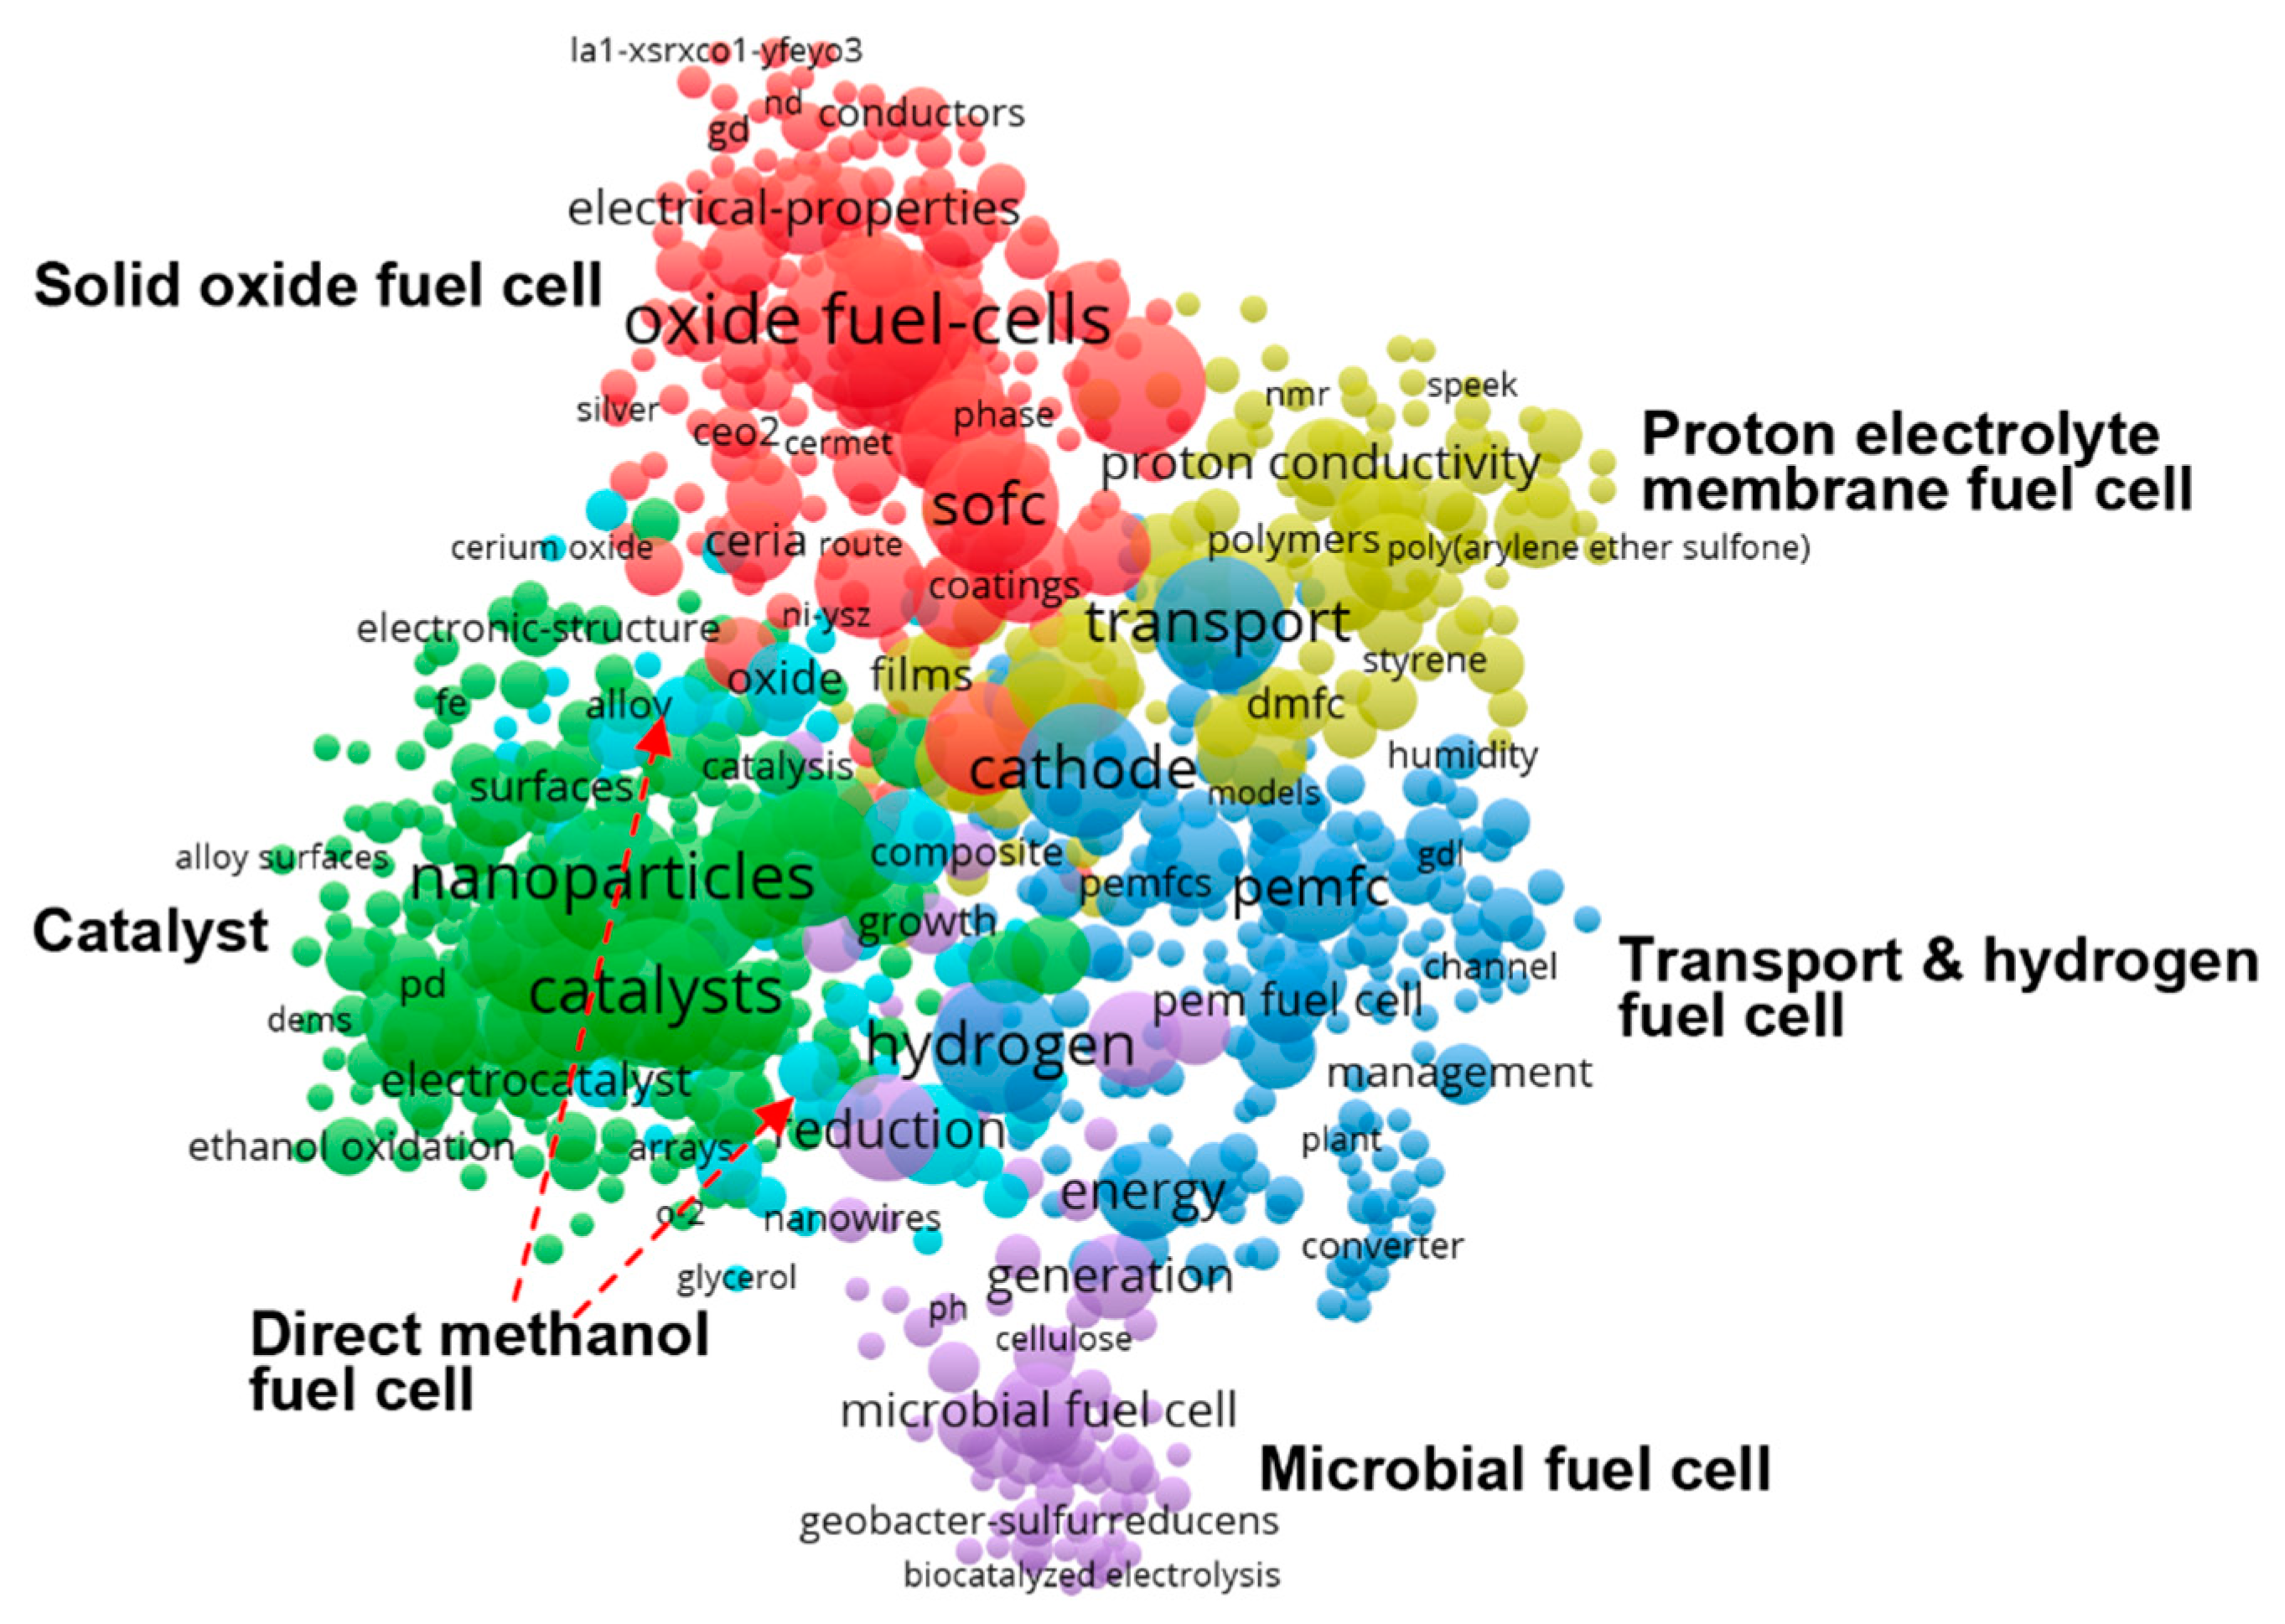
Figure 11.
Semantic term map of 10,667 international co-publications during 2013–2017.
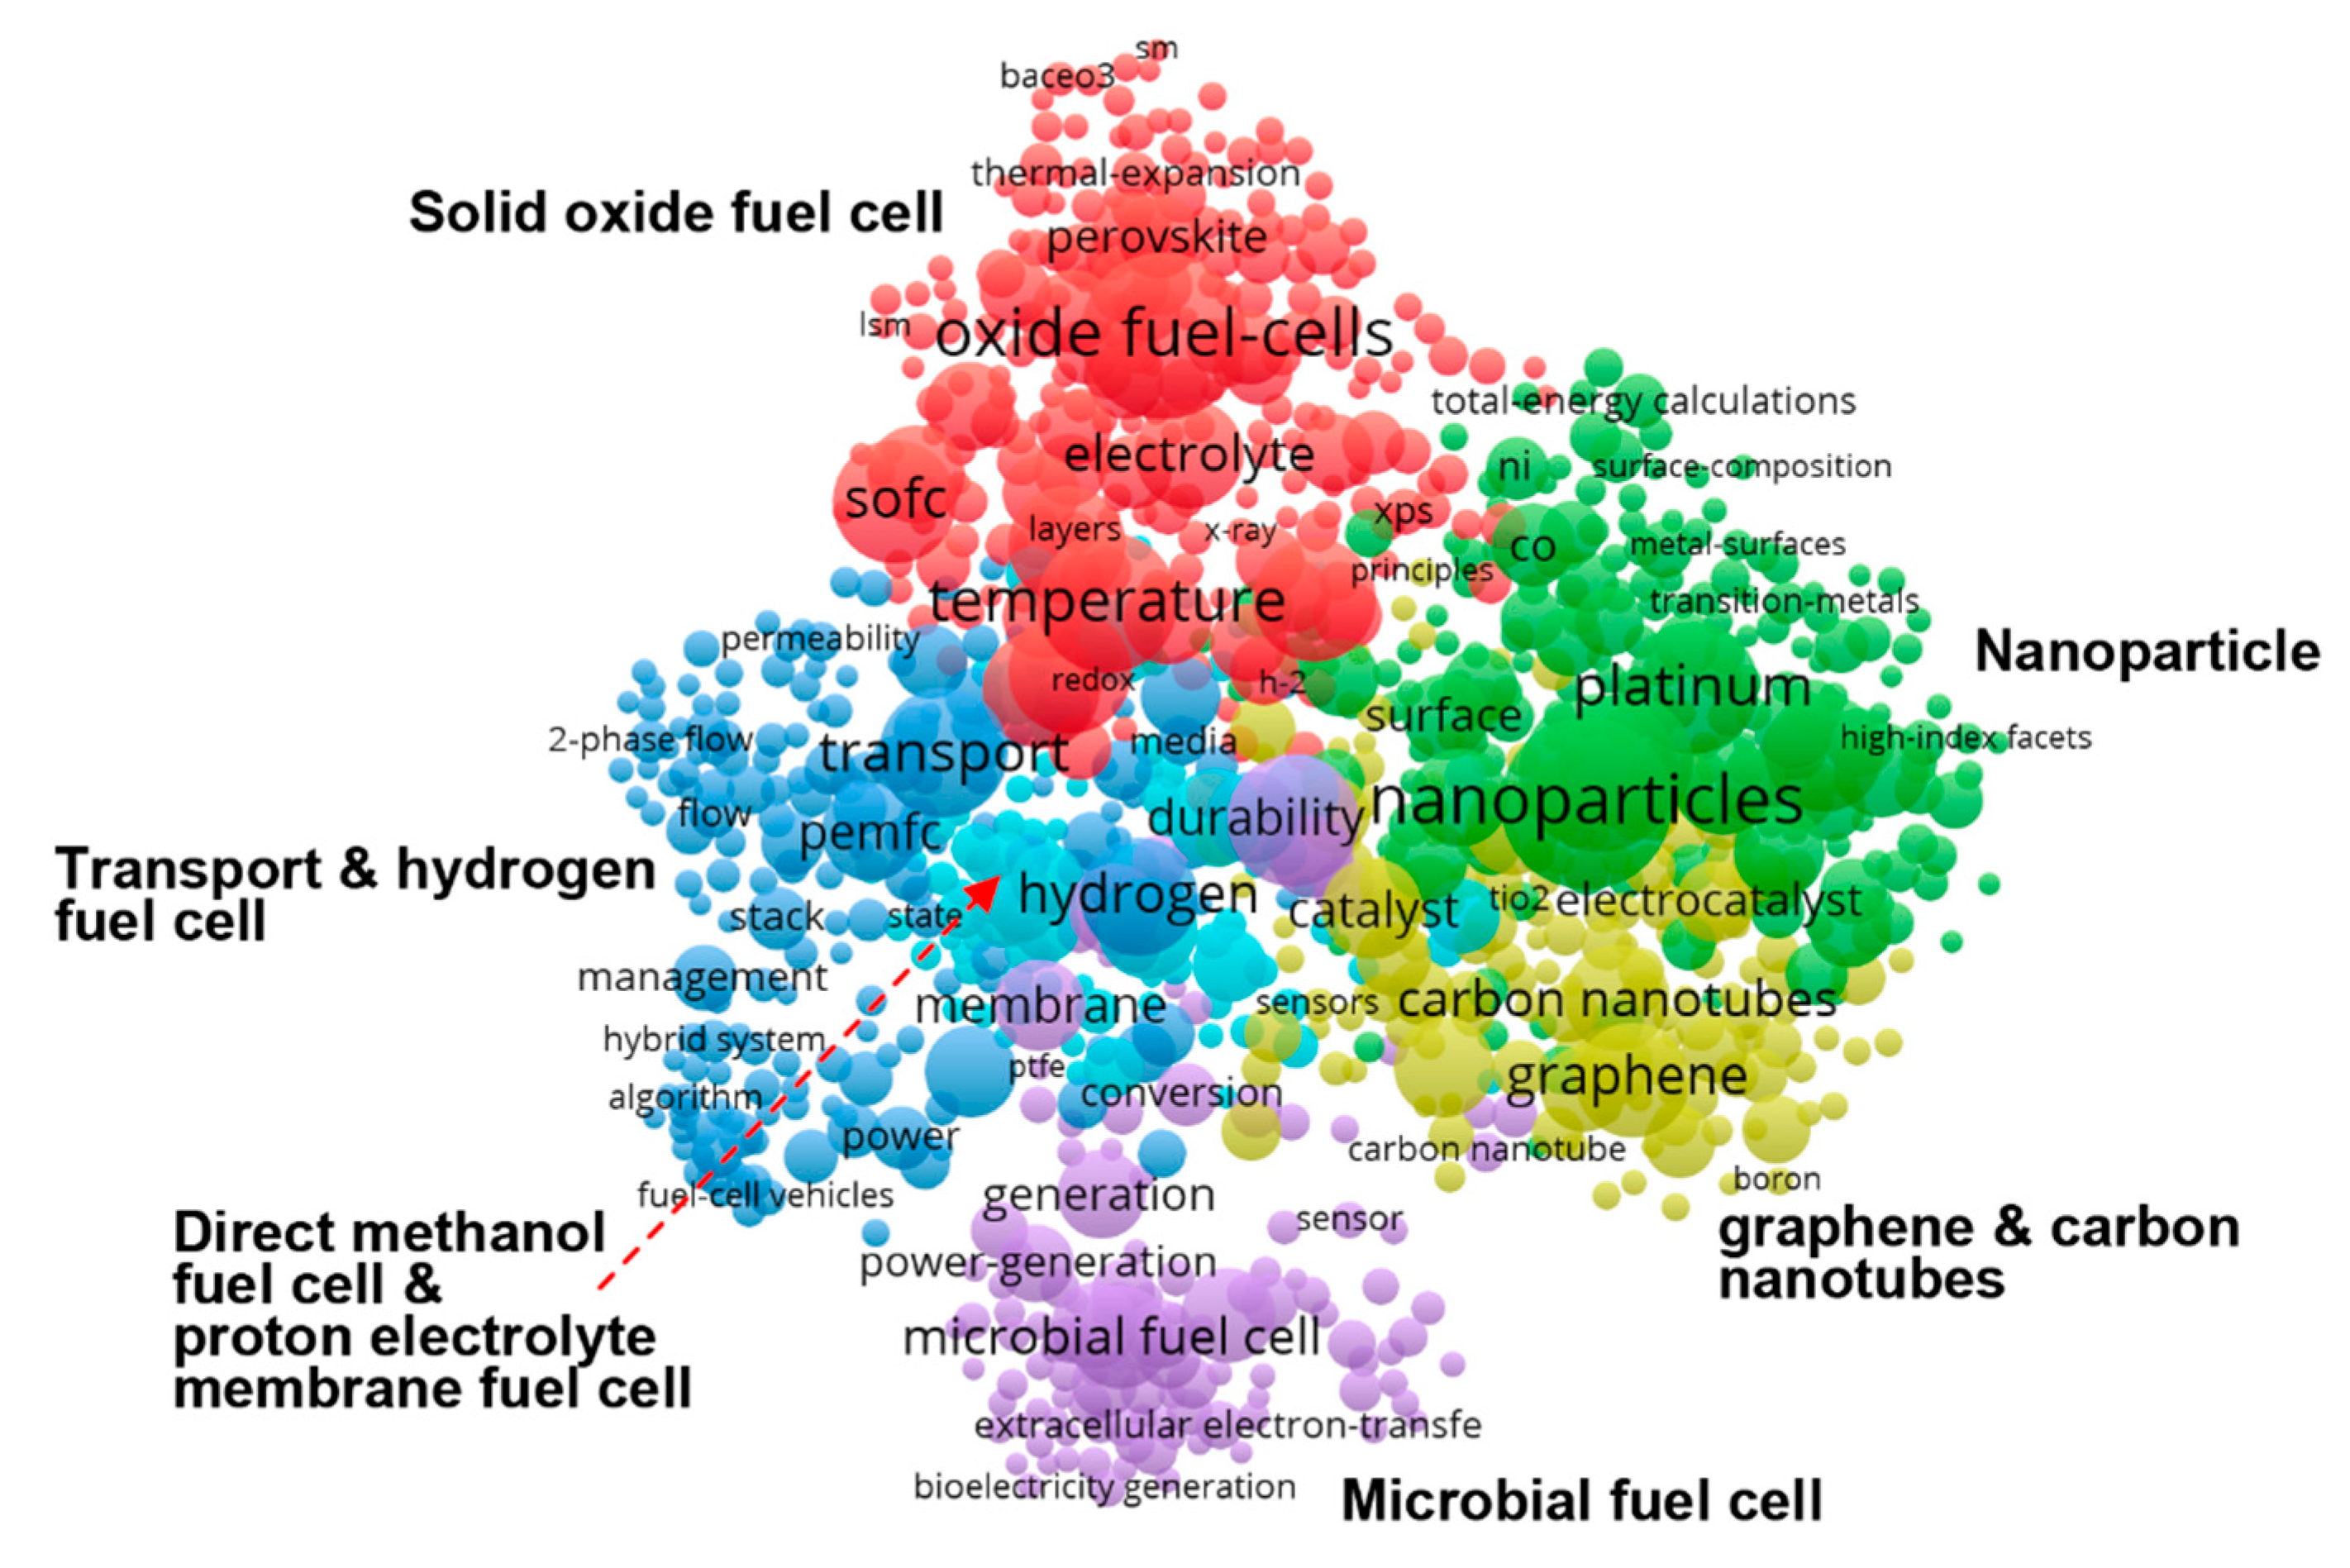
Figure 12.
Sunburst charts of the evolution of collaborative themes of top ten countries in five-year time intervals. (Note: solid oxide fuel cell: SOFC; direct methanol fuel cell: DMFC; molten carbonate fuel cell: MCFC; proton electrolyte membrane fuel cell: PEMFC; phosphoric acid fuel cell: PAFC; hydrogen fuel cell: HFC; microbial fuel cell: MFC).
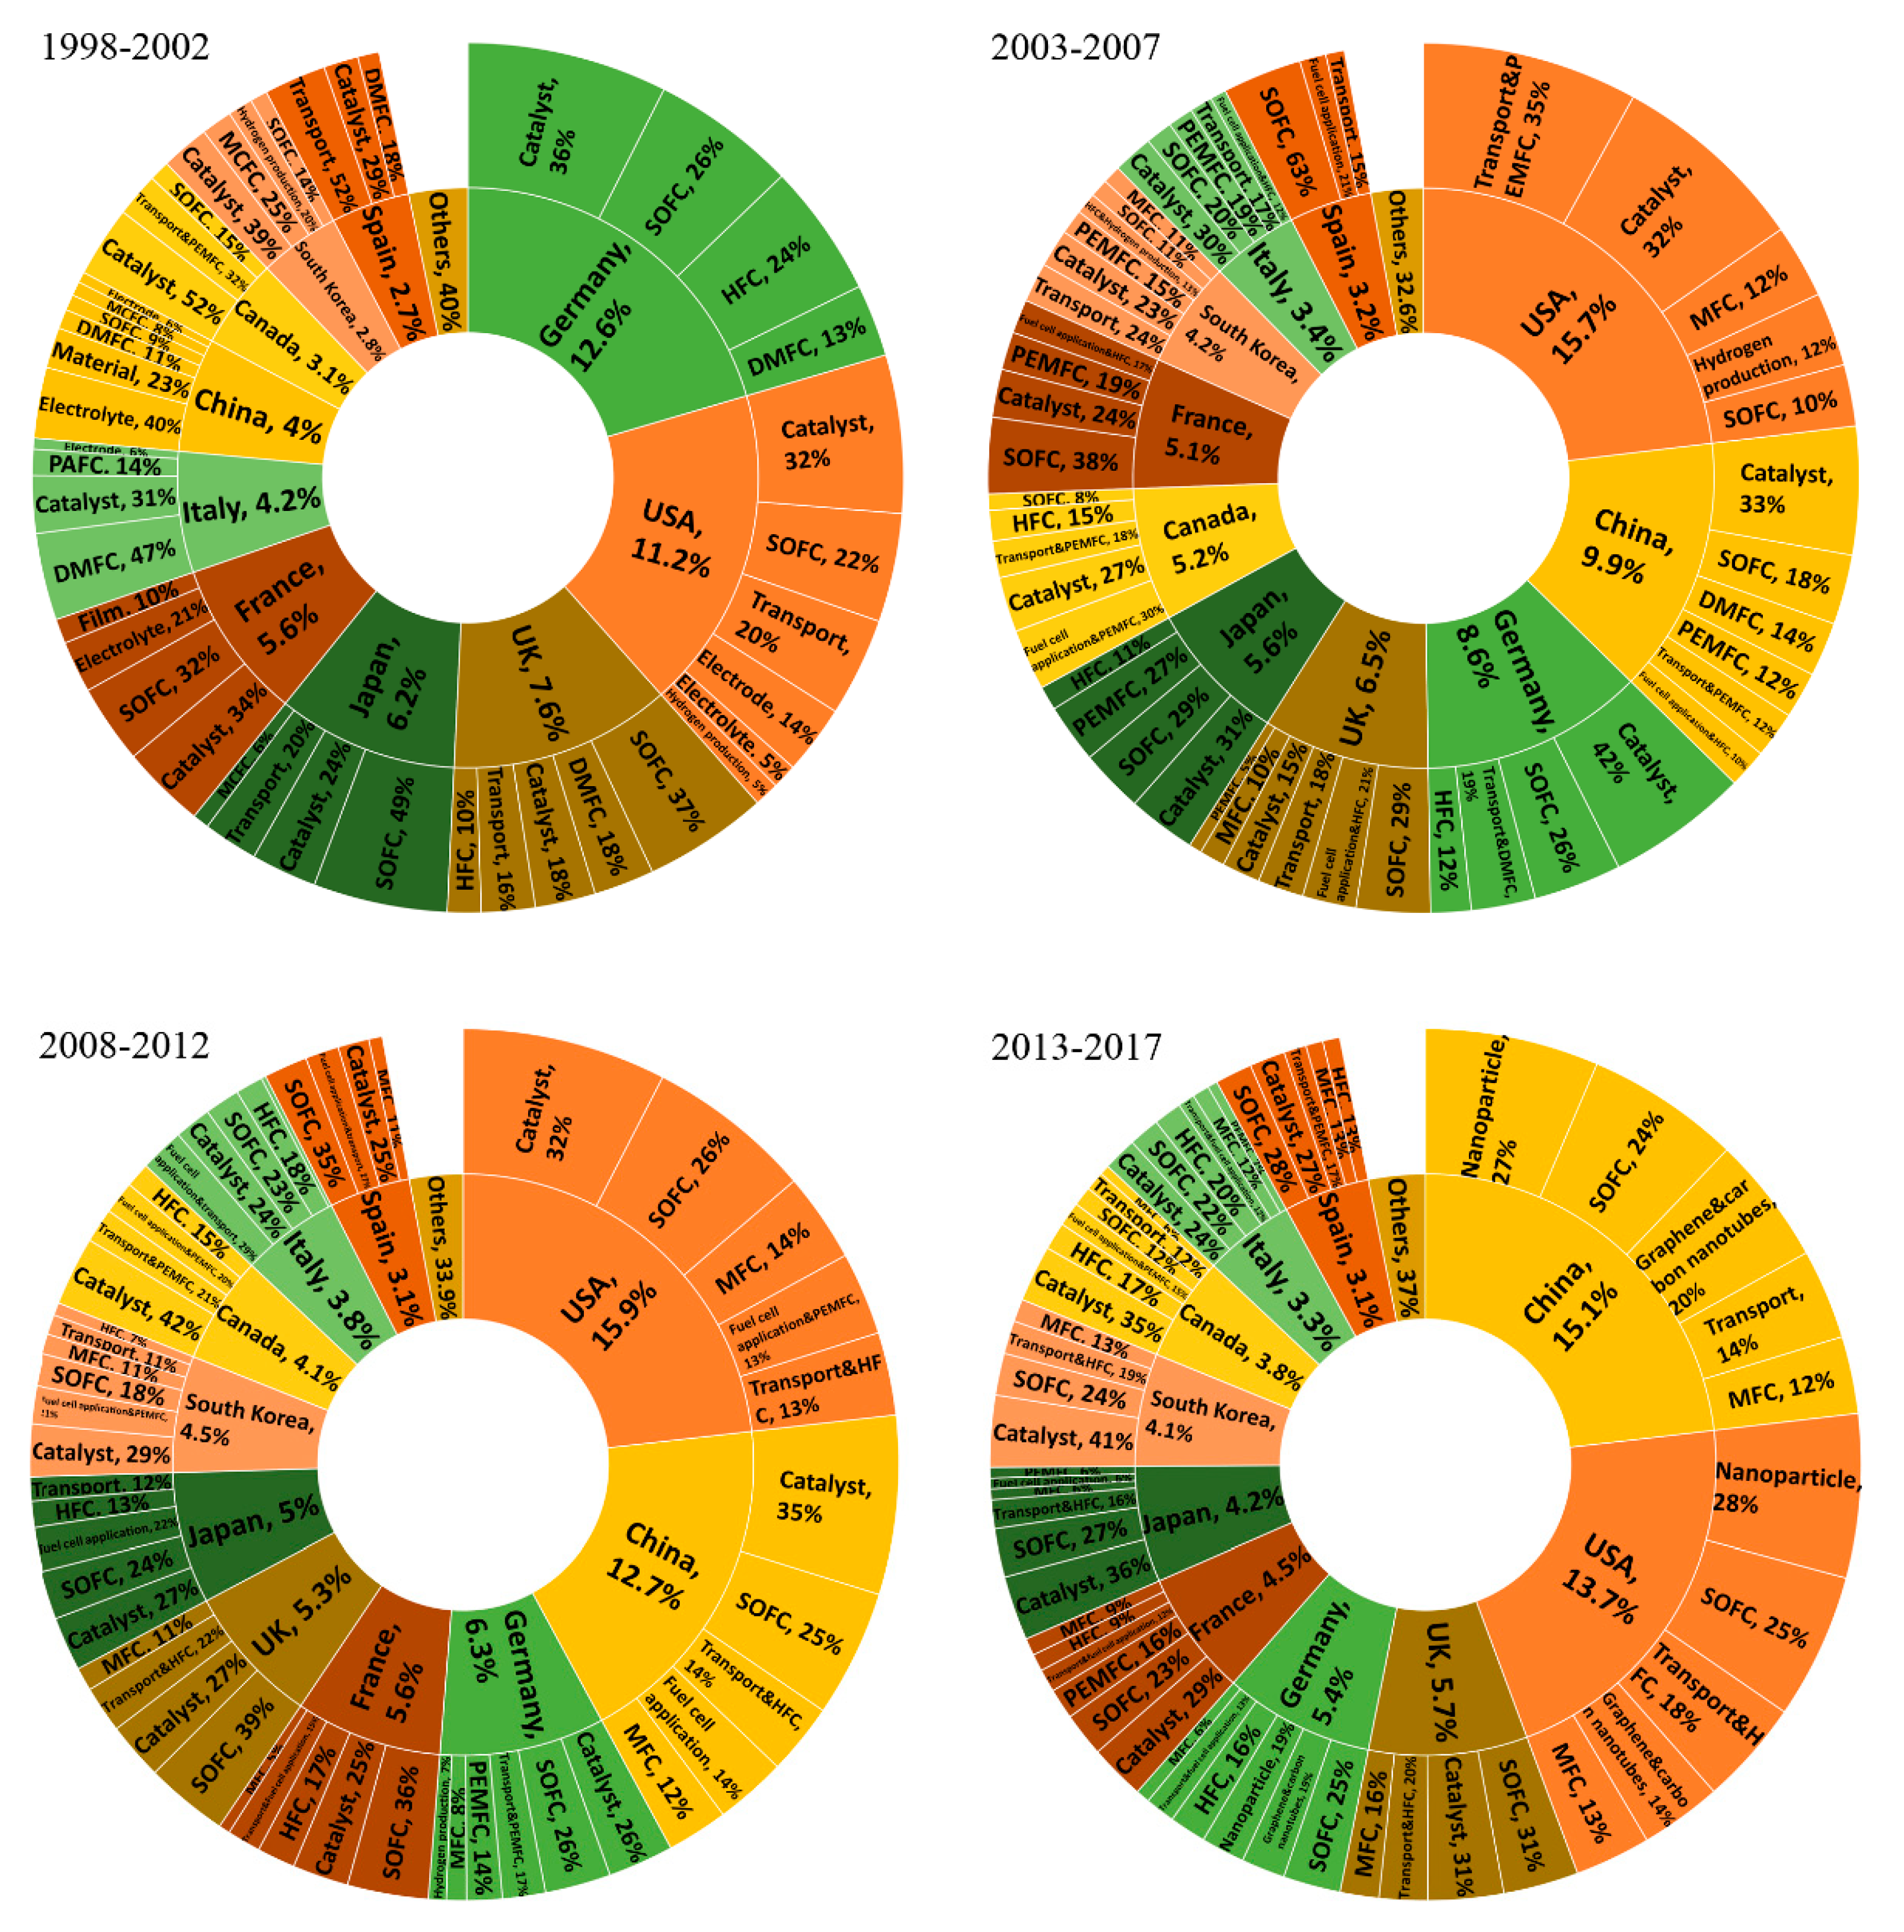
Table 1.
Number of collaborating countries and bilateral relations from 1998 to 2017.
| Year | 1998 | 1999 | 2000 | 2001 | 2002 | 2003 | 2004 | 2005 | 2006 | 2007 |
| TCC | 27 | 32 | 35 | 36 | 44 | 44 | 52 | 53 | 57 | 58 |
| TBR | 39 | 59 | 66 | 73 | 97 | 102 | 147 | 158 | 239 | 235 |
| Year | 2008 | 2009 | 2010 | 2011 | 2012 | 2013 | 2014 | 2015 | 2016 | 2017 |
| TCC | 70 | 75 | 77 | 80 | 76 | 88 | 89 | 97 | 85 | 92 |
| TBR | 295 | 384 | 410 | 438 | 434 | 535 | 594 | 640 | 709 | 778 |
Table 2.
Gini index of international collaboration network from 1998 to 2017.
| Year | 1998 | 1999 | 2000 | 2001 | 2002 | 2003 | 2004 | 2005 | 2006 | 2007 |
| Gini | 0.380 | 0.455 | 0.485 | 0.472 | 0.512 | 0.546 | 0.585 | 0.625 | 0.628 | 0.652 |
| Year | 2008 | 2009 | 2010 | 2011 | 2012 | 2013 | 2014 | 2015 | 2016 | 2017 |
| Gini | 0.654 | 0.657 | 0.660 | 0.668 | 0.656 | 0.677 | 0.675 | 0.692 | 0.673 | 0.662 |
Table 3.
Evolution characteristics of the network in five-year time intervals.
| Measure | 1998–2002 | 2003–2007 | 2008–2012 | 2013–2017 |
|---|---|---|---|---|
| Number of nodes | 50 | 75 | 95 | 118 |
| Number of links | 484 | 2244 | 7474 | 15,727 |
| Density | 0.146 | 0.149 | 0.176 | 0.184 |
| Clustering coefficient | 0.650 | 0.713 | 0.739 | 0.770 |
| Average path length | 2.208 | 2.088 | 1.992 | 1.991 |
| Average node degree | 7.160 | 11.040 | 16.589 | 21.576 |
| Average link strength | 2.704 | 5.420 | 9.485 | 12.354 |
© 2018 by the authors. Licensee MDPI, Basel, Switzerland. This article is an open access article distributed under the terms and conditions of the Creative Commons Attribution (CC BY) license (http://creativecommons.org/licenses/by/4.0/).
Share and Cite
MDPI and ACS Style
Shi, X.; Cai, L.; Jia, J. The Evolution of International Scientific Collaboration in Fuel Cells during 1998–2017: A Social Network Perspective. Sustainability 2018, 10, 4790. https://doi.org/10.3390/su10124790
AMA Style
Shi X, Cai L, Jia J. The Evolution of International Scientific Collaboration in Fuel Cells during 1998–2017: A Social Network Perspective. Sustainability. 2018; 10(12):4790. https://doi.org/10.3390/su10124790
Chicago/Turabian StyleShi, Xuan, Lingfei Cai, and Junzhi Jia. 2018. "The Evolution of International Scientific Collaboration in Fuel Cells during 1998–2017: A Social Network Perspective" Sustainability 10, no. 12: 4790. https://doi.org/10.3390/su10124790
Note that from the first issue of 2016, this journal uses article numbers instead of page numbers. See further details here.