A Strategy-Based Model for Low Carbon Cities

Abstract
1. Introduction
2. Literature Review
3. Methods
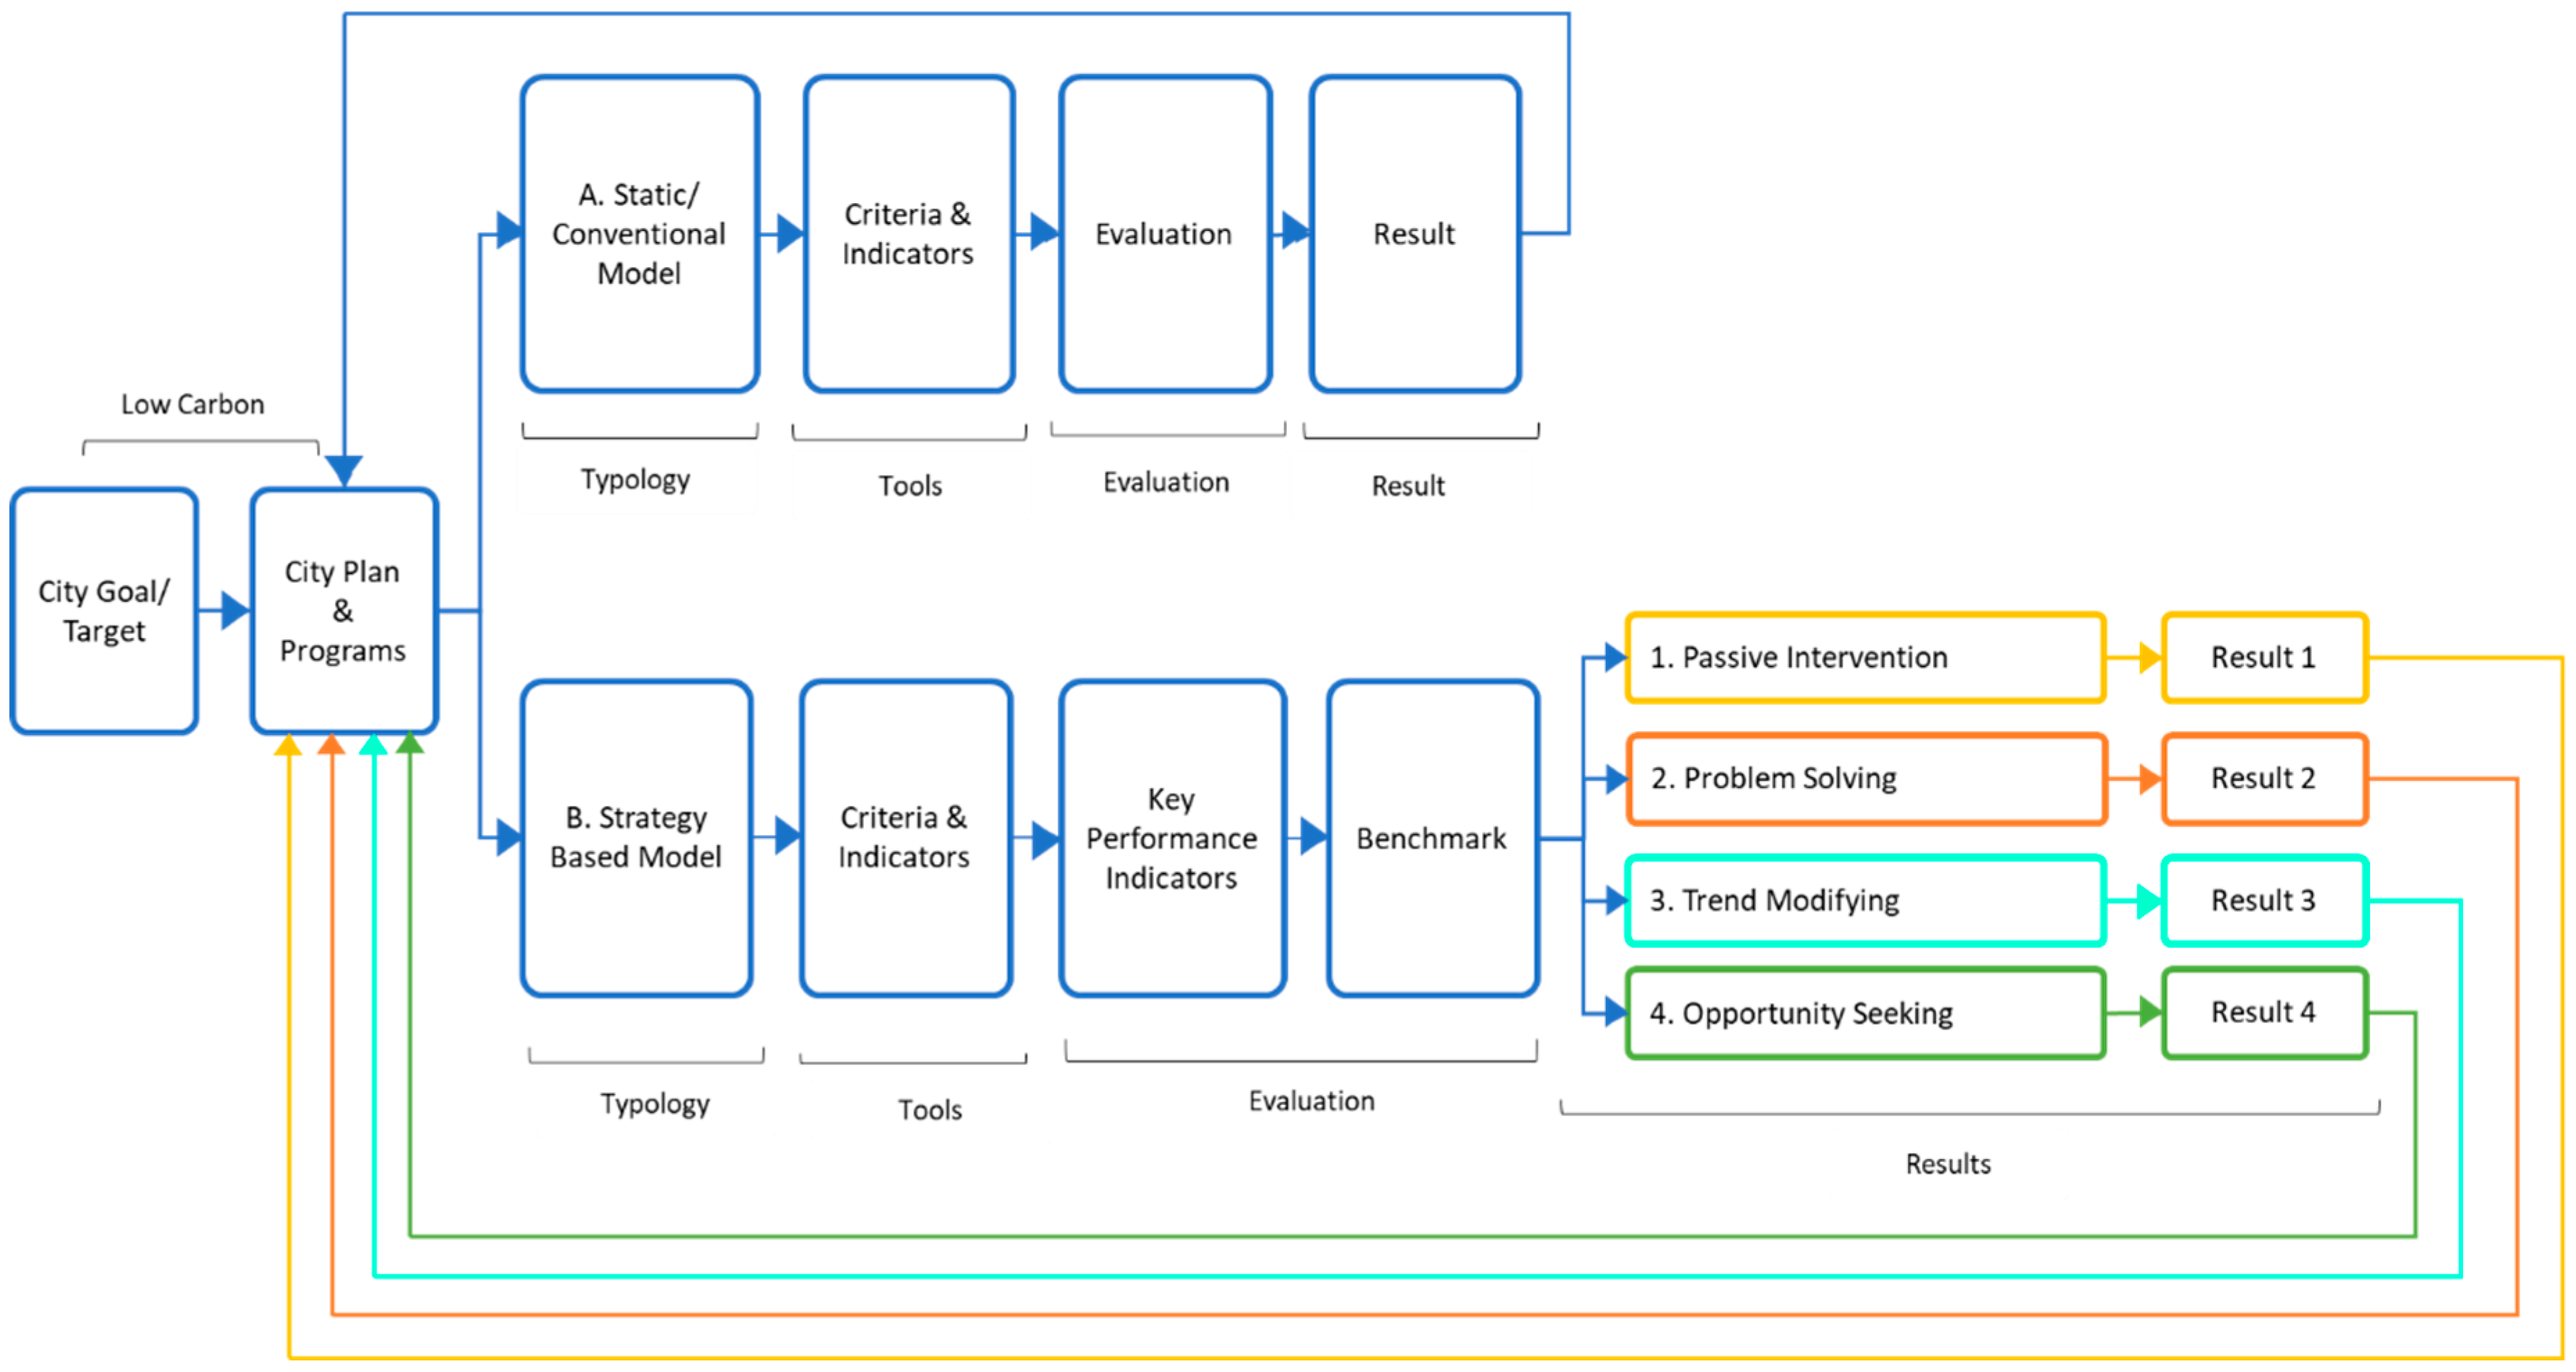
3.1. Model Building Process
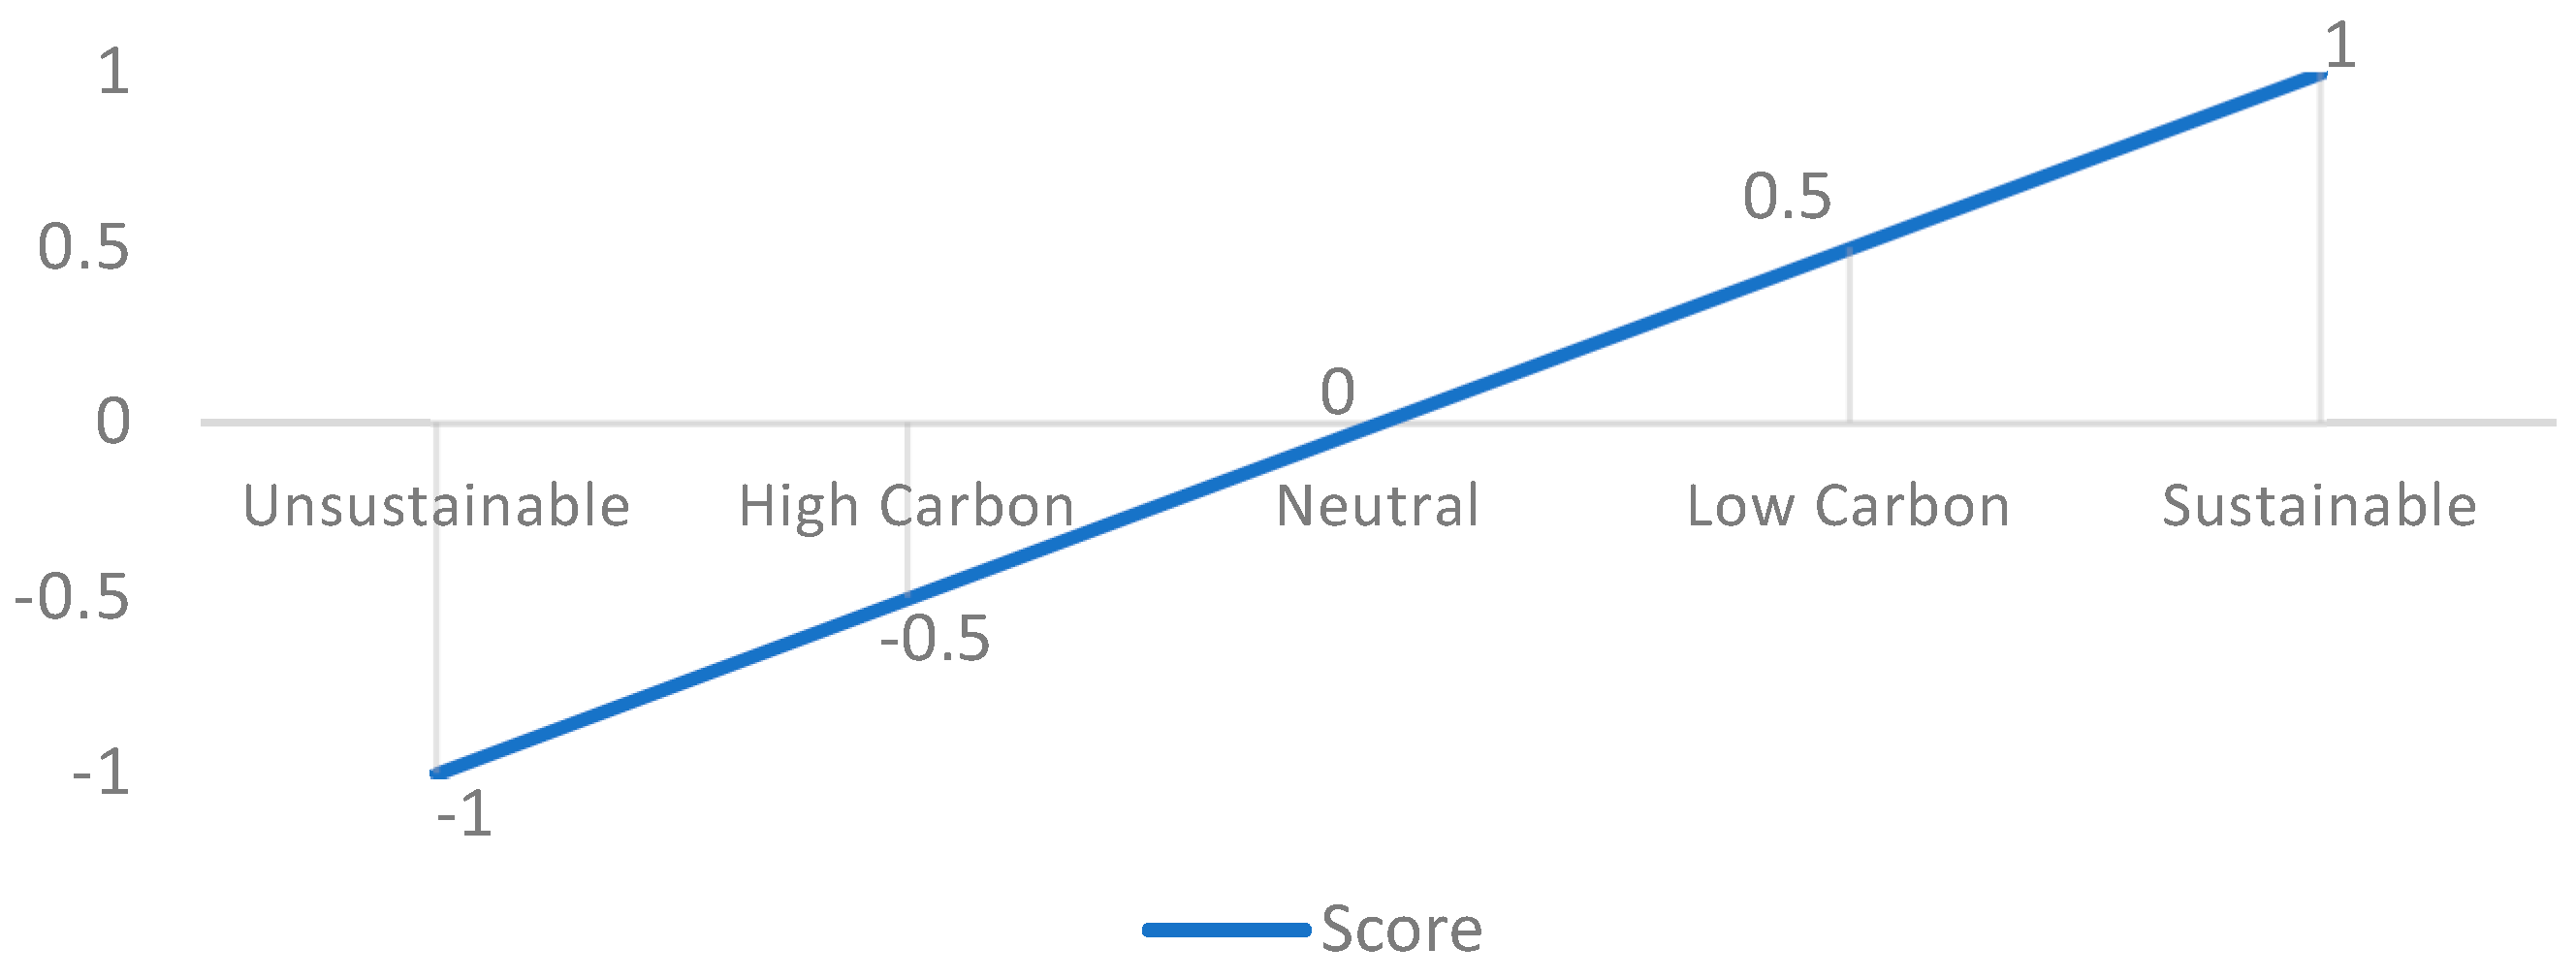
3.2. Score Calculation
3.3. Model Application
4. Results
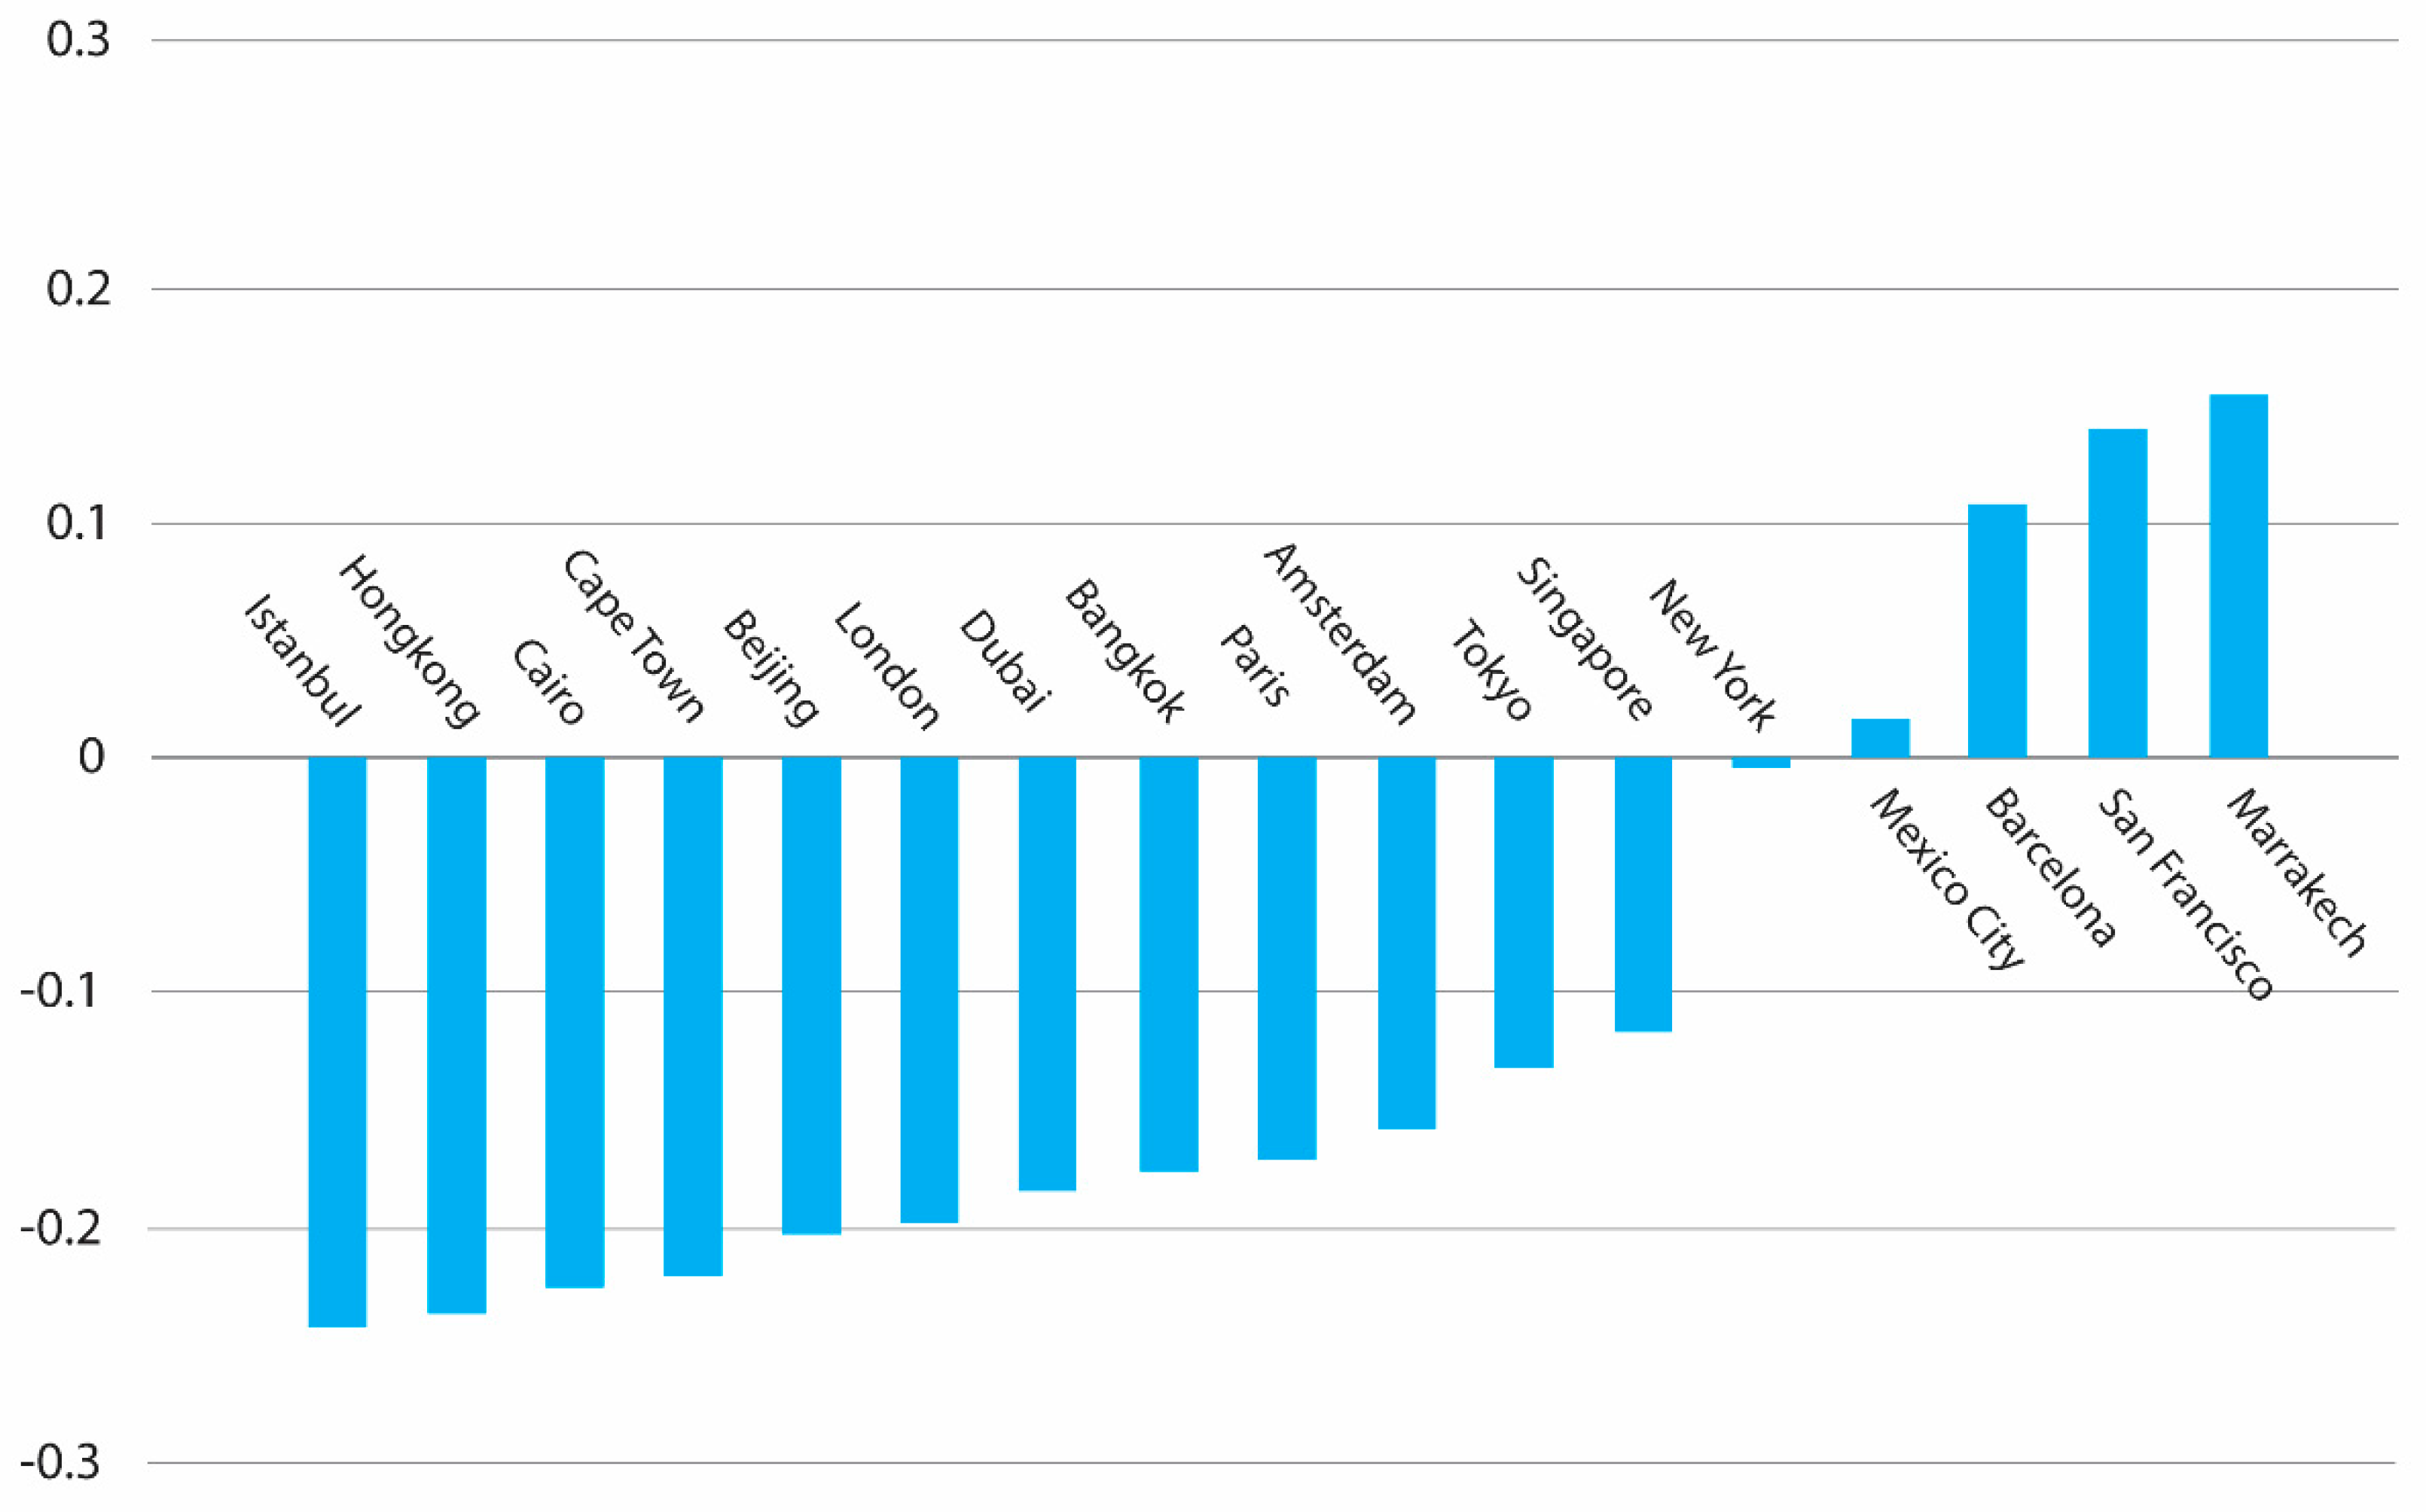
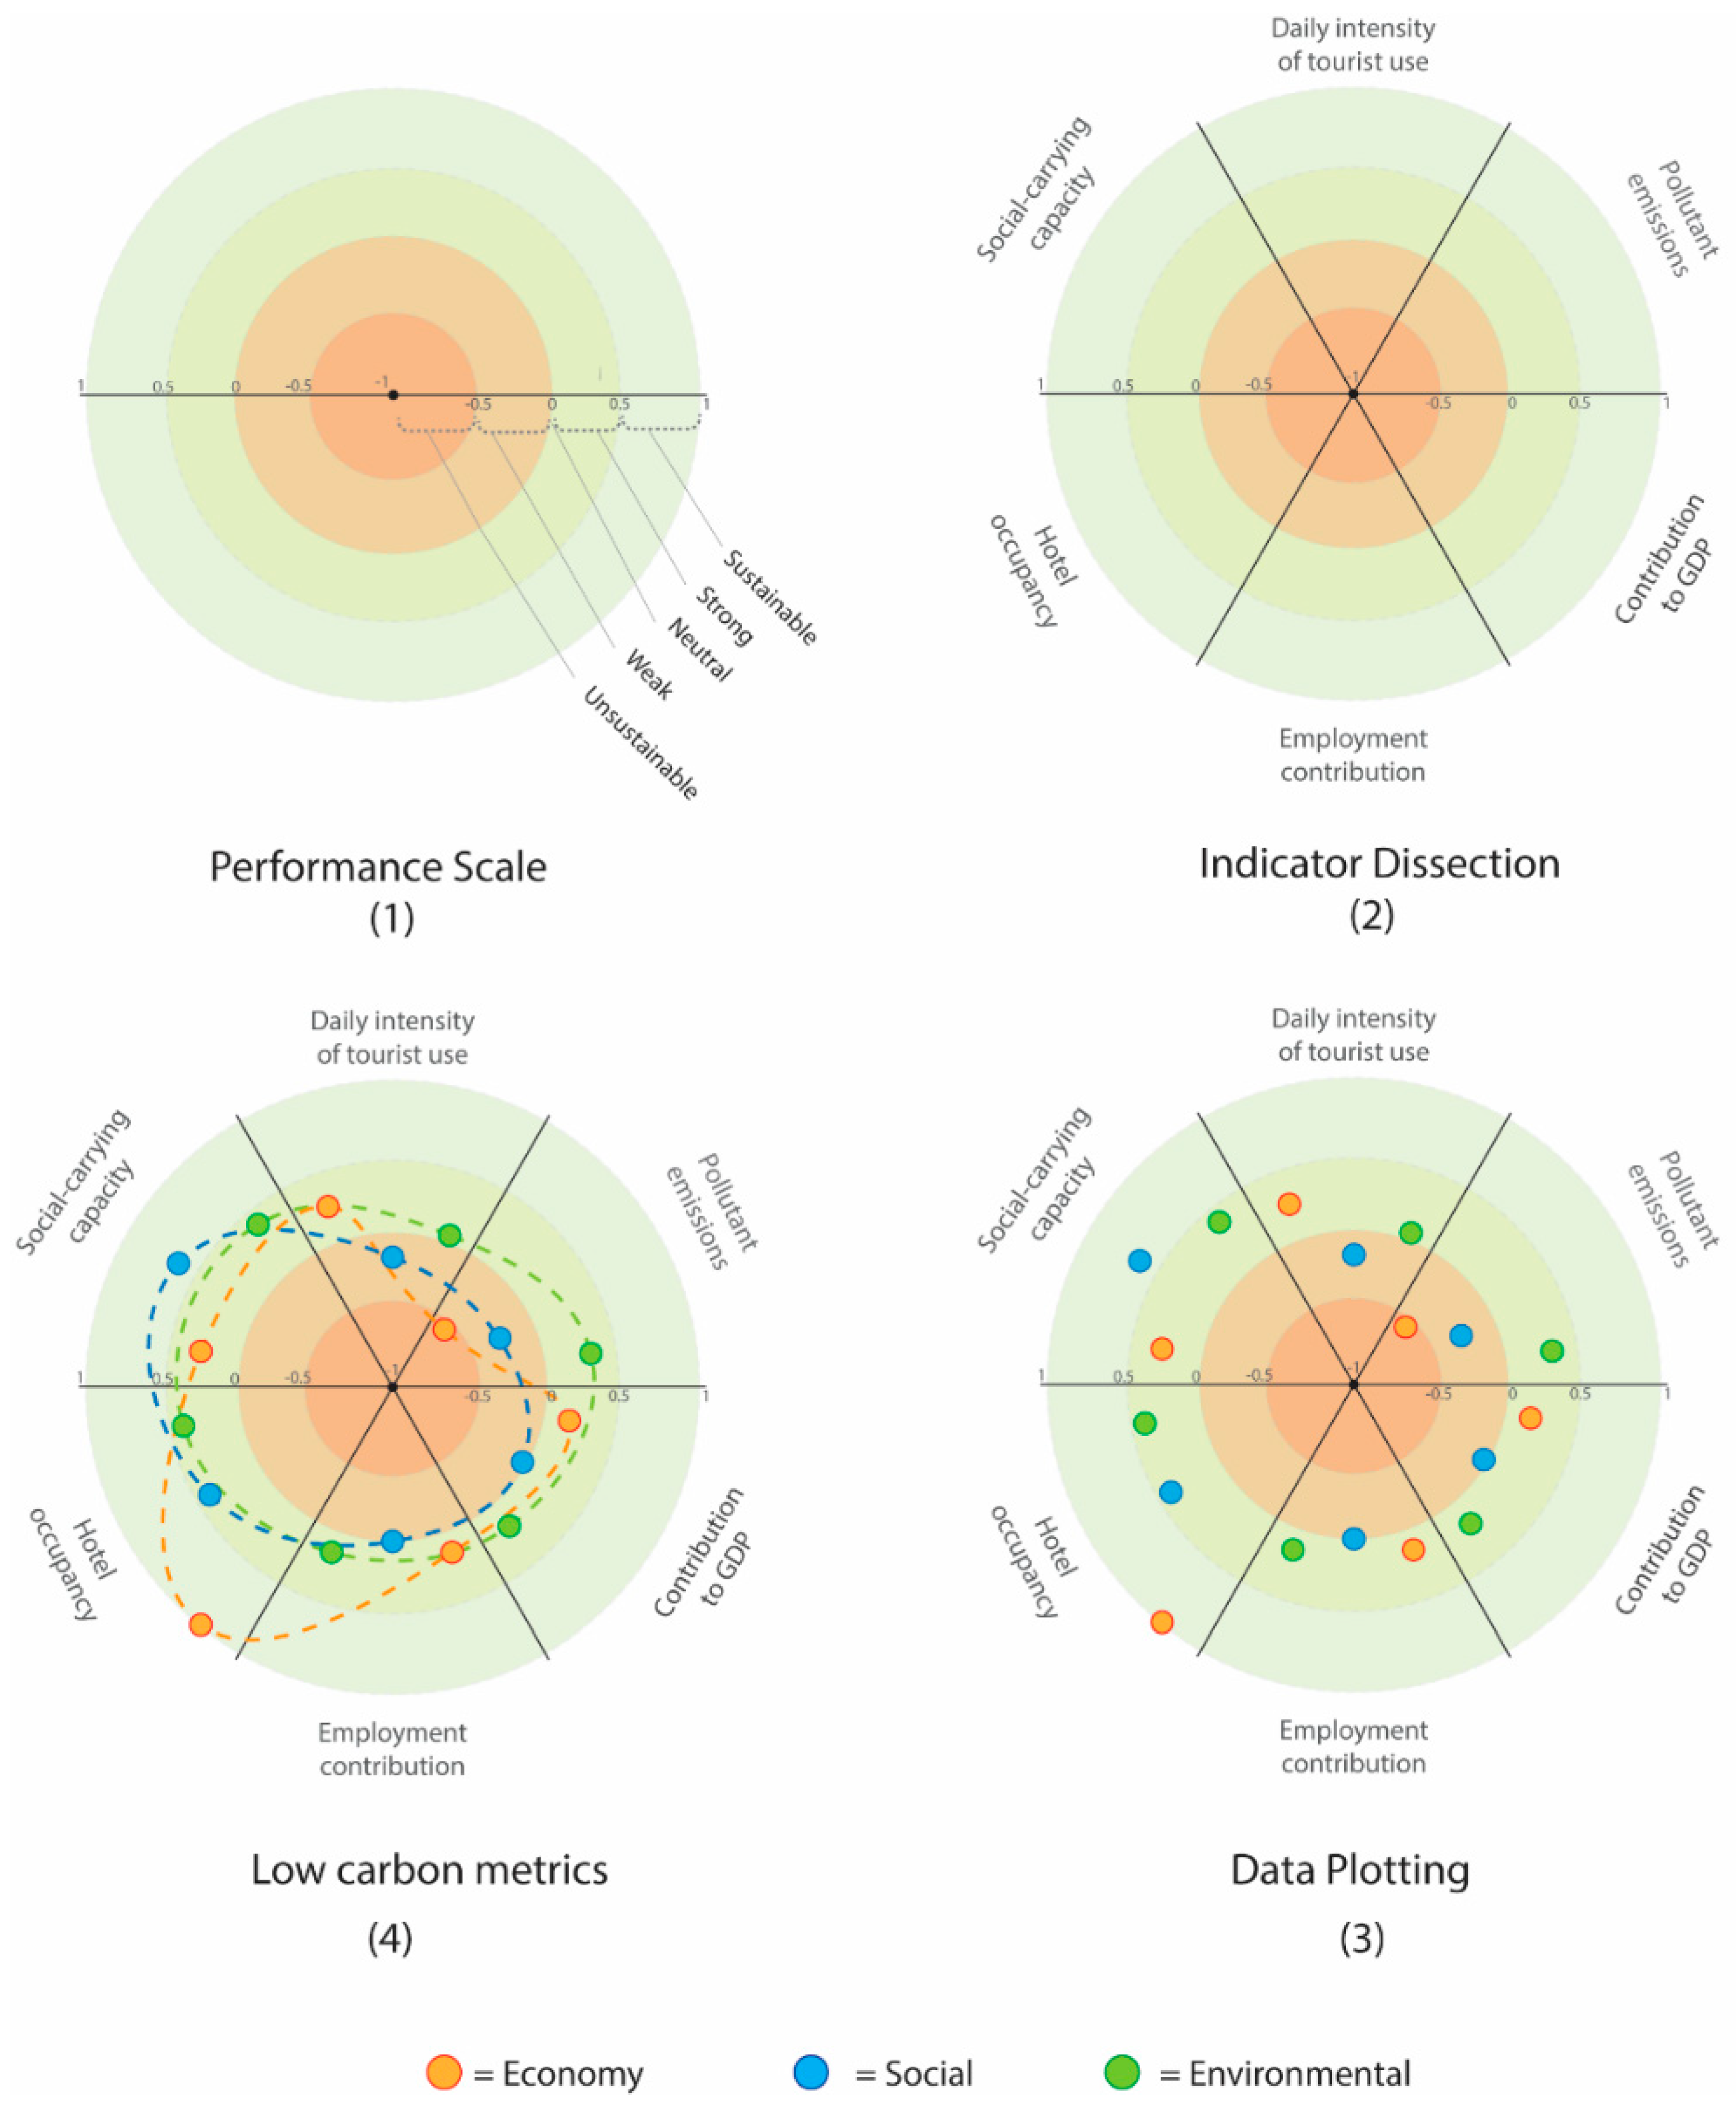
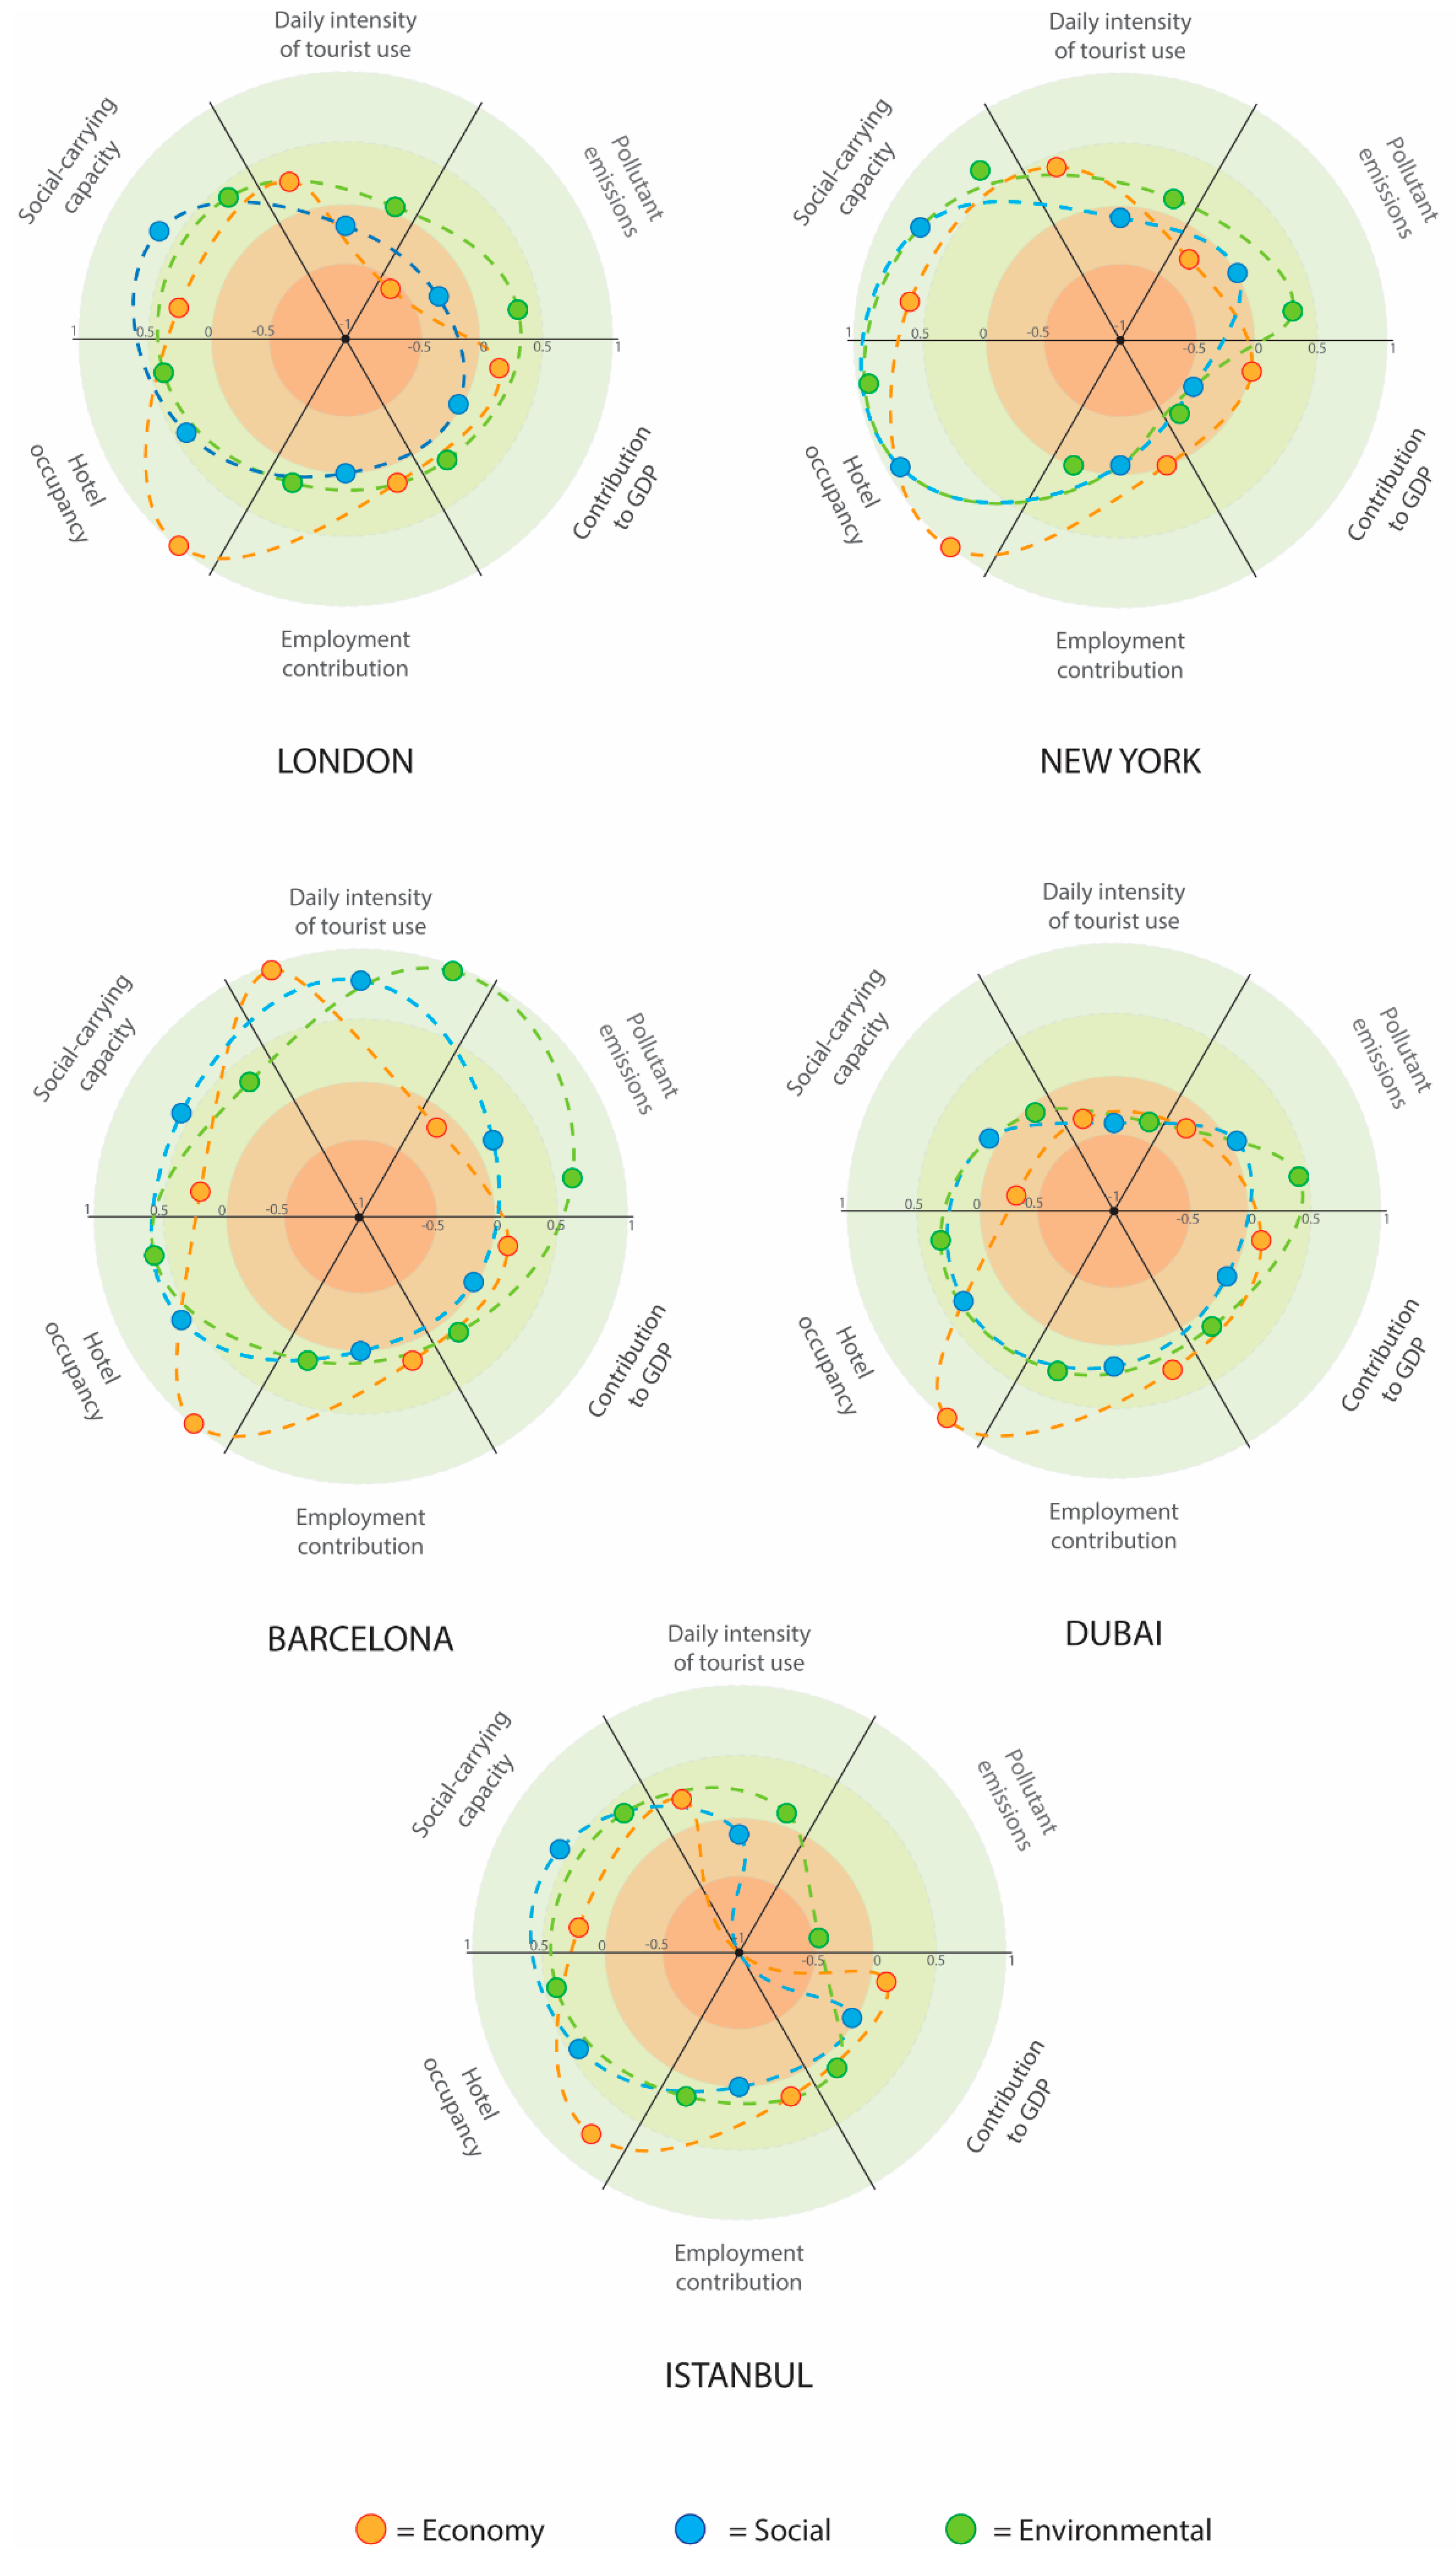
4.1. Static Model
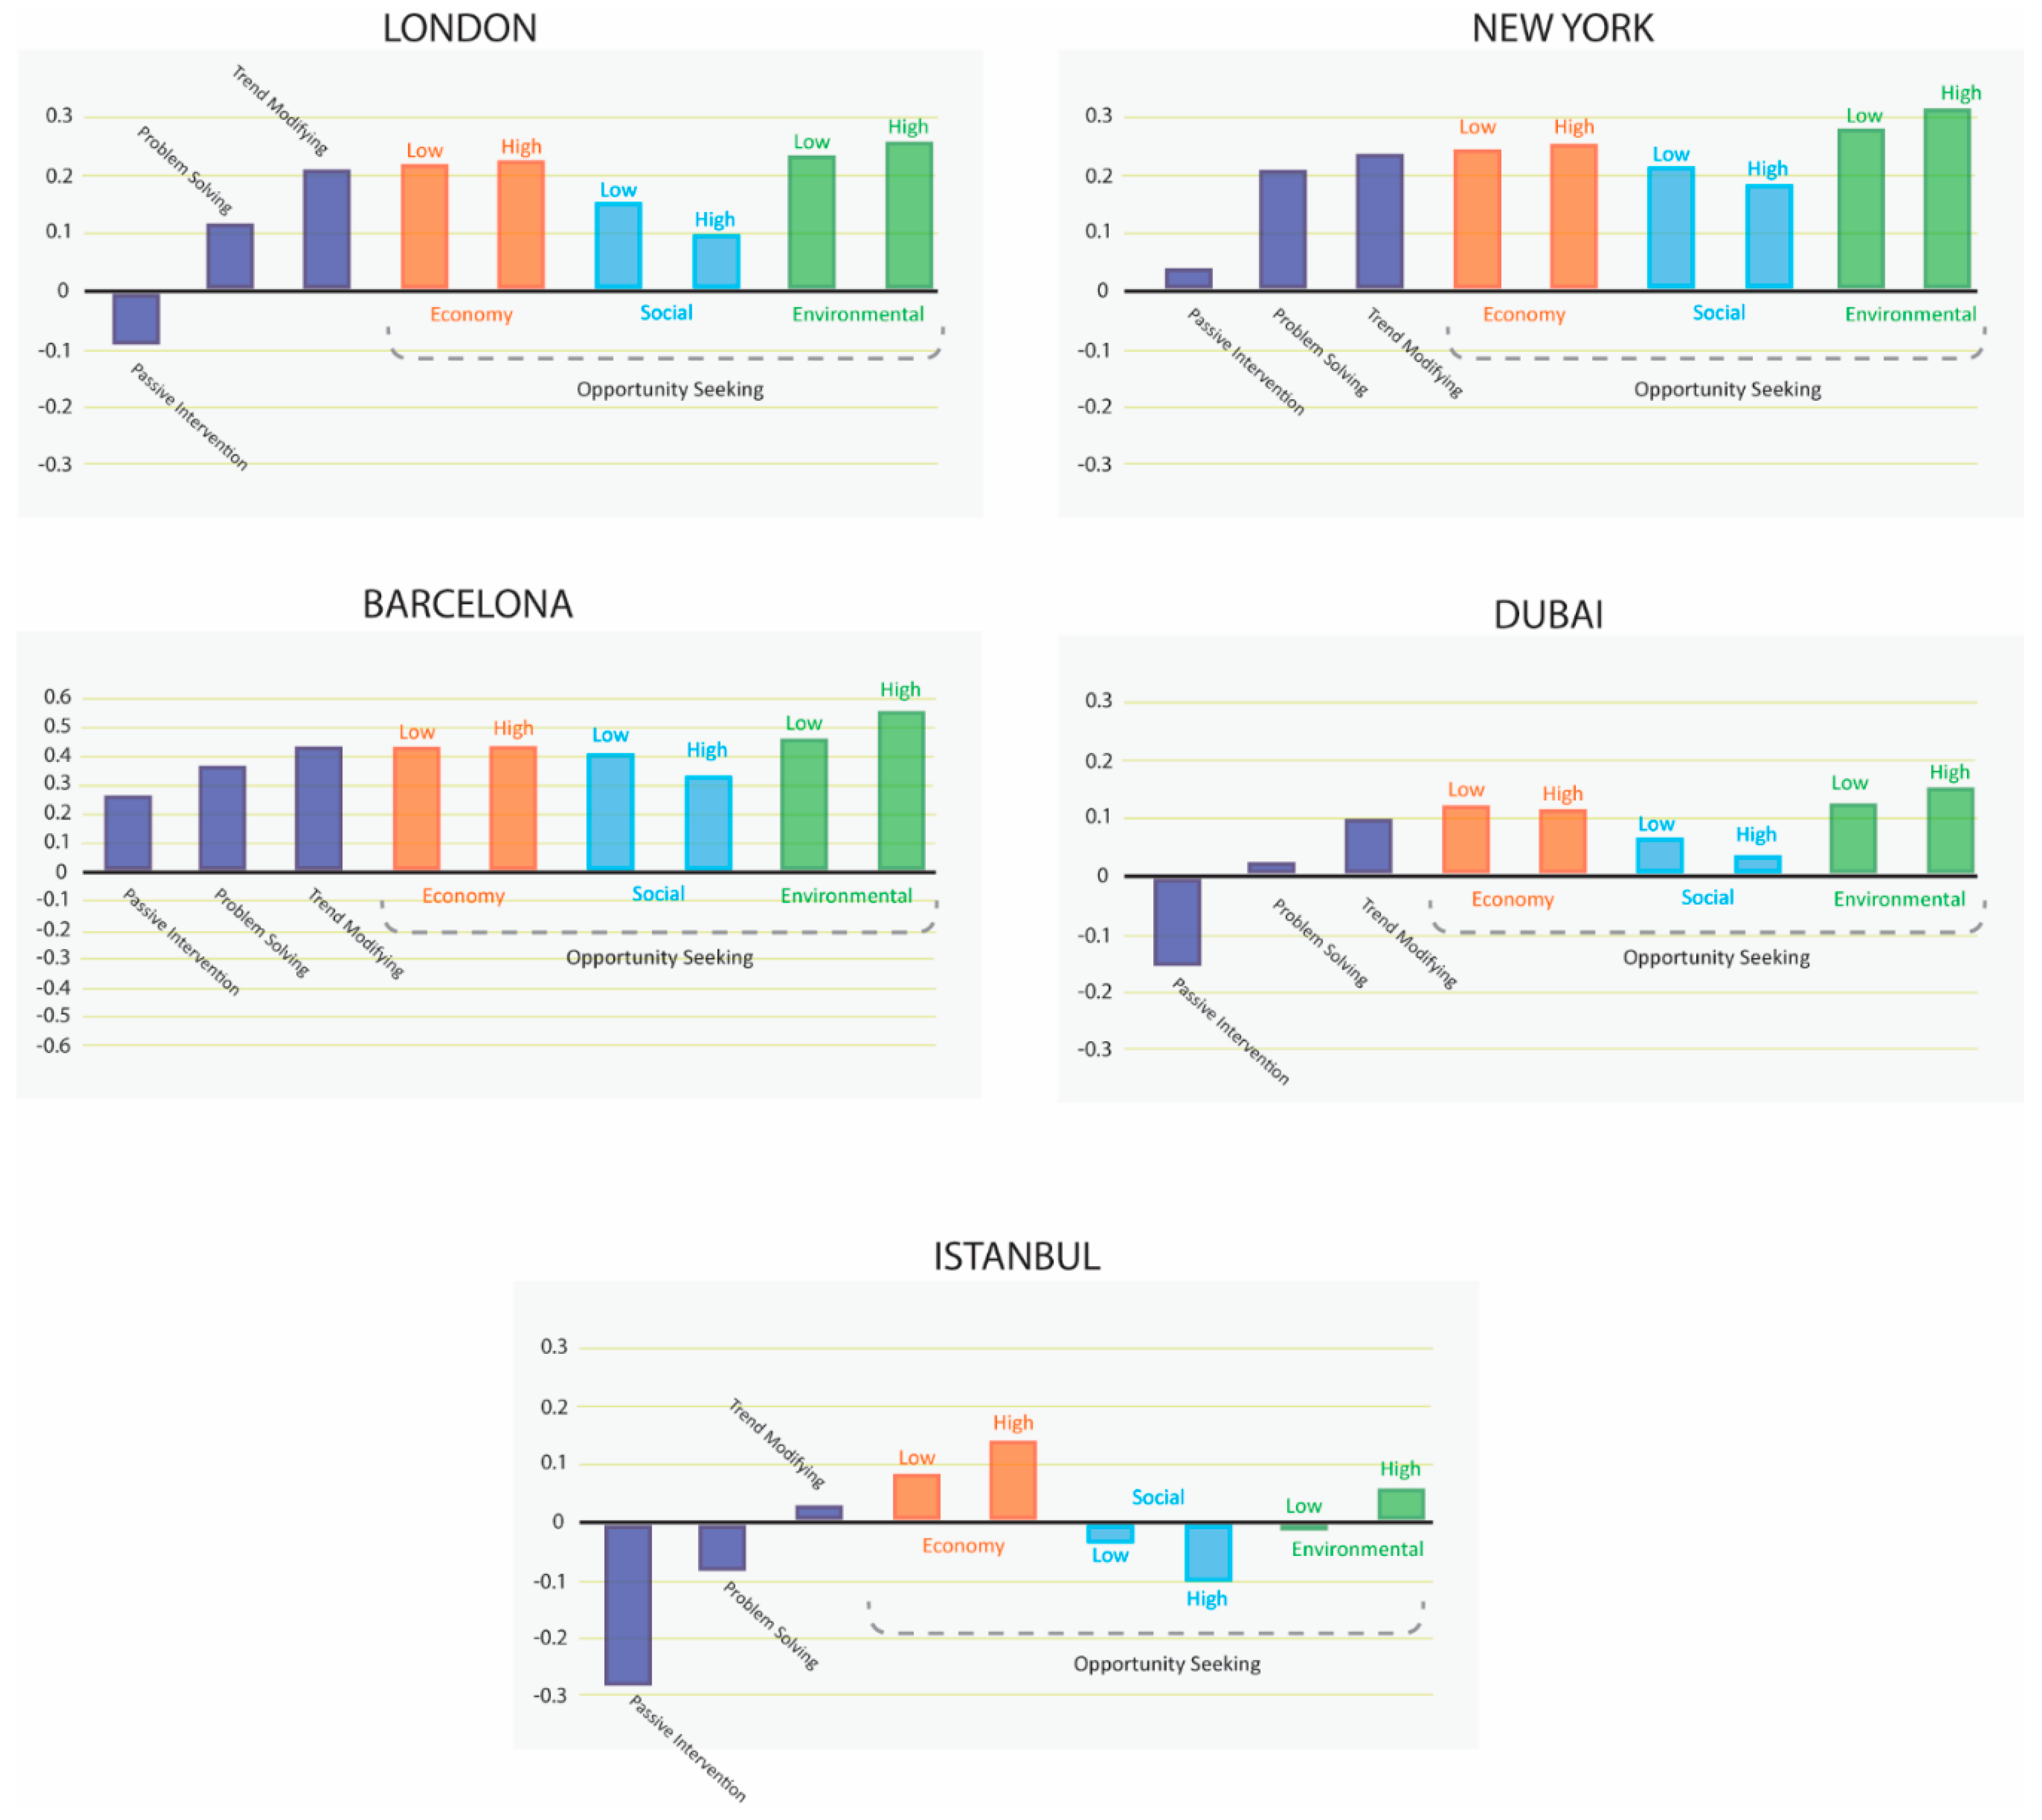
4.2. Dynamic Model
5. Discussion
5.1. Economy
5.2. Social
5.3. Environmental
6. Conclusions
Author Contributions
Conflicts of Interest
References
- GEF—World Bank. Urban Sustainability Framework; GEF—World Bank: Washington, DC, USA, 2018. [Google Scholar]
- IPCC. Climate Change 1992: The 1990 and 1992 IPCC Assessment Reports. Overview and Policymaker Sumaries and 1992 IPCC Suplement; IPCC: Geneva, Switzerland, 1992; Volume 360. [Google Scholar]
- IPCC. Synthesis Report; IPCC: Geneva, Switzerland, 2014. [Google Scholar]
- Martínez-Zarzoso, I.; Maruotti, A. The impact of urbanization on CO2 emissions: Evidence from developing countries. Ecol. Econ. 2011, 70, 1344–1353. [Google Scholar] [CrossRef]
- Yang, X.; Lou, F.; Sun, M.; Wang, R.; Wang, Y. Study of the relationship between greenhouse gas emissions and the economic growth of Russia based on the Environmental Kuznets Curve. Appl. Energy 2017, 193, 162–173. [Google Scholar] [CrossRef]
- Azizalrahman, H.; Hasyimi, V. A model for urban sector drivers of carbon emissions. Sustain. Cities Soc. 2019, 44, 46–55. [Google Scholar] [CrossRef]
- Han, R.; Tang, B.-J.; Fan, J.-L.; Liu, L.-C.; Wei, Y.-M. Integrated weighting approach to carbon emission quotas: An application case of beijing-tianjin-hebei region. J. Clean. Prod. 2016, 131, 448–459. [Google Scholar] [CrossRef]
- Tan, S.; Yang, J.; Yan, J.; Lee, C.; Hashim, H.; Chen, B. A holistic low carbon city indicator framework for sustainable development. Appl. Energy 2015, 185, 1919–1930. [Google Scholar] [CrossRef]
- Qi, Y.; Wen, F.; Wang, K.; Li, L.; Singh, S. A fuzzy comprehensive evaluation and entropy weight decision-making based method for power network structure assessment. Int. J. Eng. Sci. Technol. 2010, 2, 92–99. [Google Scholar] [CrossRef]
- Azizalrahman, H.; Hasyimi, V. Towards a generic multi-criteria evaluation model for low carbon cities. Sustain. Cities Soc. 2018, 39, 275–282. [Google Scholar] [CrossRef]
- Zhang, Y.; Yi, W.; Li, B. The impact of urbanization on carbon emission: Empirical evidence in Beijing. Energy Procedia 2015, 75, 2963–2968. [Google Scholar] [CrossRef]
- Yang, G.; Sun, T.; Wang, J.; Li, X. Modeling the nexus between carbon dioxide emissions and economic growth. Energy Policy 2015, 86, 104–117. [Google Scholar] [CrossRef]
- Sadorsky, P. The effect of urbanization on CO2 emissions in emerging economies. Energy Econ. 2014, 41, 147–153. [Google Scholar] [CrossRef]
- Yeh, J.; Liao, C. Impact of population and economic growth on carbon emissions in Taiwan using an analytic tool STIRPAT. Sustain. Environ. Res. 2017, 27, 41–48. [Google Scholar] [CrossRef]
- Horng, J.-S.; Hu, M.-L.; Teng, C.-C.; Lin, L. Energy saving and carbon reduction management indicators for natural attractions: A case study in Taiwan. J. Sustain. Tour. 2012, 20, 1125–1149. [Google Scholar] [CrossRef]
- Shahbaz, M.; Chaudhary, A.R.; Ozturk, I. Does urbanization cause increasing energy demand in Pakistan? Empirical evidence from STIRPAT model. Energy 2017, 122, 83–93. [Google Scholar] [CrossRef]
- Peterson, G.D.; Cumming, G.S.; Carpenter, S.R. Scenario Planning: A Tool for Conservation in an Uncertain World. Essay 358 Conserv. Biol. Conserv. Biol. 2003, 17, 358–366. [Google Scholar] [CrossRef]
- Swart, R.; Raskin, P.; Robinson, J. The problem of the future: Sustainability science and scenario analysis. Glob. Environ. Chang. 2004, 14, 137–146. [Google Scholar] [CrossRef]
- Turnpenny, J.; O’Riordan, T.; Haxeltine, A. Developing Regional and Local Scenarios for Climate Change Mitigation and Adaptation; Tyndall Centre for Climate Research: Norwich, UK, 2005; p. 67. [Google Scholar]
- Shimada, K.; Tanaka, Y.; Gomi, K.; Matsuoka, Y. Developing a long-term local society design methodology towards a low-carbon economy: An application to Shiga Prefecture in Japan. Energy Policy 2007, 35, 4688–4703. [Google Scholar] [CrossRef]
- Gomi, K.; Shimada, K.; Matsuoka, Y. A low-carbon scenario creation method for a local-scale economy and its application in kyoto city. Energy Policy 2010, 38, 4783–4796. [Google Scholar] [CrossRef]
- Freeman, R.; Yearworth, M. Climate change and cities: Problem structuring methods and critical perspectives on low-carbon districts. Energy Res. Soc. Sci. 2017, 25, 48–64. [Google Scholar] [CrossRef]
- Akgün, A.A.; van Leeuwen, E.; Nijkamp, P. A multi-actor multi-criteria scenario analysis of regional sustainable resource policy. Ecol. Econ. 2012, 78, 19–28. [Google Scholar] [CrossRef]
- Becker, W.; Saisana, M.; Paruolo, P.; Vandecasteele, I. Weights and importance in composite indicators: Closing the gap. Ecol. Indictors 2017, 80, 12–22. [Google Scholar] [CrossRef] [PubMed]
- Jose, V.R.R.; Nau, R.F.; Winkler, R.L. Scoring Rules, Generalized Entropy, and Utility Maximization. Oper. Res. 2008, 56, 1146–1157. [Google Scholar] [CrossRef]
- Xing, Z. Low-carbon Cities Evaluation Model Based on RS and SVM. J. Appl. Sci. Eng. Innov. 2018, 5, 51–54. [Google Scholar]
- OECD. Green Growth in Stockholm, Sweden; OECD: Paris, France, 2013. [Google Scholar]
- Spano, M.; Gentile, F.; Davies, C.; Lafortezza, R. The DPSIR framework in support of green infrastructure planning: A case study in Southern Italy. Land Use Policy 2017, 61, 242–250. [Google Scholar] [CrossRef]
- Padilla-Rivera, A.; Amor, B.; Blanchet, P. Evaluating the Link between Low Carbon Reductions Strategies and Its Performance in the Context of Climate Change: A Carbon Footprint of a Wood-Frame Residential Building in Quebec, Canada. Sustainability 2018, 10, 20. [Google Scholar] [CrossRef]
- UNWTO. Tourism Highlights 2017 Edition; UNWTO: Madrid, Spain, 2017. [Google Scholar]
- WTTC. City Travel & Tourism Impact 2017 Executive Summary; WTTC: London, UK, 2017. [Google Scholar]
- WTTC. Travel & Tourism: Global Economic Impact & Issue 2018; WTTC: London, UK, 2017. [Google Scholar]
- UNEP-WTO. Making tourism more sustainable. A guide for policy makers. Environment 2005, 54, 222. [Google Scholar]
- Zhou, N.; He, G.; Williams, C.; Fridley, D. ELITE cities: A low-carbon eco-city evaluation tool for China. Ecol. Indicators 2015, 48, 448–456. [Google Scholar] [CrossRef]
- ILO. ILO Guidelines on Decent Work and Socially Responsable Tourism; International Labour Office: Geneva, Switzerland, 2017. [Google Scholar]
- Fong, W.-K.; Matsumoto, H.; Lun, Y.-F. Application of system dynamics model as decision making tool in urban planning process toward stabilizing carbon dioxide emissions from cities. Build. Environ. 2009, 44, 1528–1537. [Google Scholar] [CrossRef]
- De Vaz, E.N.; Nijkamp, P.; Painho, M.; Caetano, M. A multi-scenario forecast of urban change: A study on urban growth in the algarve. Landscape Urban Plan. 2012, 104, 201–211. [Google Scholar] [CrossRef]
- Fang, D.; Zhang, X.; Yu, Q.; Chen, T.; Tian, L. A novel method for carbon dioxide emission forecasting based on improved Gaussian processes regression. J. Clean. Prod. 2018, 173, 143–150. [Google Scholar] [CrossRef]
- Law, A.; DeLacy, T.; McGrath, G.M. A green economy indicator framework for tourism destinations A green economy indicator framework for tourism destinations. J. Sustain. Tour. 2017, 9582, 1434–1455. [Google Scholar] [CrossRef]
- Hodson, M.; Marvin, S.; Bulkeley, H. The intermediary organisation of low carbon cities: A comparative analysis of transitions in greater london and greater manchester. Urban Stud. 2013, 50, 1403–1422. [Google Scholar] [CrossRef]


| Indicators | Symbol | Effect | Parameter | Benchmark | Source |
|---|---|---|---|---|---|
| Daily intensity of tourist uses | I1 | + | Total tourists per unit area | 89.41 tourist/km/day | [31] |
| Pollutant emissions | I2 | - | Level of CO2 | 2.19 ton/capita | [34] |
| Contribution of tourism to GDP | I3 | + | Percentage of GDP attributable to the activities of hotels and restaurants | 10.4% | [33] |
| Employment contribution | I4 | + | Percentage of employees in the tourism sector with respect to the total volume of employment in the city | 9.9% | [35] |
| Hotel occupancy | I5 | + | % average of room usage | 71.23% | [31] |
| Social-carrying capacity | I6 | - | Ratio of tourists to locals | 4.5% | [31] |
| Indicators | Symbol | Economy | Social | Environmental | |||
|---|---|---|---|---|---|---|---|
| Low | High | Low | High | Low | High | ||
| Intensity of tourist use | I1 | +10% | +20% | −25% | −50% | −10% | −20% |
| Pollutant emissions | I2 | −5% | −10% | +5% | +10% | +25% | +50% |
| Contribution of tourism to GDP | I3 | +5% | +10% | −5% | −10% | +5% | +10% |
| Employment contribution | I4 | +5% | +10% | −5% | −10% | +5% | +10% |
| Hotel occupancy | I5 | +5% | +10% | −5% | −10% | −5% | −10% |
| Social-carrying capacity | I6 | −10% | −20% | +10% | +20% | +10% | +20% |
| KPI | Passive Intervention | Problem Solving | Trend Modifying | Opportunity Seeking | ||
|---|---|---|---|---|---|---|
| ECONOMY | SOCIAL | ENVIRONMENT | ||||
| Result 1 | Result 2 | Result 3 | Result 4 | |||
| A. LONDON | ||||||
| I1 | −0.225 | 0.000 | 0.175 | 0.287 | −0.106 | 0.062 |
| I2 | −0.279 | −0.279 | −0.407 | −0.548 | −0.267 | 0.296 |
| I3 | −0.500 | 0.000 | 0.063 | 0.132 | −0.006 | 0.132 |
| I4 | −0.476 | 0.000 | 0.067 | 0.141 | −0.007 | 0.141 |
| I5 | 0.508 | 0.508 | 0.971 | 1.000 | 0.461 | 0.461 |
| I6 | 0.458 | 0.458 | 0.404 | 0.345 | 0.523 | 0.464 |
| Total | −0.086 | 0.114 | 0.212 | 0.226 | 0.100 | 0.259 |
| B. NEW YORK | ||||||
| I1 | 0.058 | 0.095 | 0.313 | 0.453 | −0.036 | 0.173 |
| I2 | −1.000 | 0.000 | −0.100 | −0.210 | 0.010 | 0.450 |
| I3 | −0.398 | −0.398 | −0.375 | −0.350 | −0.400 | −0.350 |
| I4 | −0.136 | −0.136 | −0.082 | −0.023 | −0.141 | −0.023 |
| I5 | 1.000 | 1.000 | 1.000 | 1.000 | 0.949 | 0.949 |
| I6 | 0.686 | 0.688 | 0.656 | 0.622 | 0.725 | 0.691 |
| Total | 0.035 | 0.208 | 0.235 | 0.249 | 0.184 | 0.315 |
| C. BARCELONA | ||||||
| I1 | 1.000 | 1.000 | 1.000 | 1.000 | 0.775 | 1.000 |
| I2 | 0.126 | 0.128 | 0.041 | −0.055 | 0.137 | 0.520 |
| I3 | −0.307 | 0.000 | 0.063 | 0.132 | −0.006 | 0.132 |
| I4 | −0.333 | 0.000 | 0.067 | 0.141 | −0.007 | 0.141 |
| I5 | 0.600 | 0.600 | 1.000 | 1.000 | 0.553 | 0.553 |
| I6 | 0.464 | 0.465 | 0.411 | 0.353 | 0.529 | 0.470 |
| Total | 0.258 | 0.366 | 0.430 | 0.428 | 0.330 | 0.469 |
| D. DUBAI | ||||||
| I1 | −0.323 | −0.323 | −0.295 | −0.277 | −0.340 | −0.313 |
| I2 | −1.000 | 0.000 | −0.100 | −0.210 | 0.010 | 0.450 |
| I3 | 0.012 | 0.012 | 0.076 | 0.146 | 0.006 | 0.146 |
| I4 | 0.156 | 0.156 | 0.239 | 0.331 | 0.148 | 0.331 |
| I5 | 0.392 | 0.392 | 0.844 | 1.000 | 0.347 | 0.347 |
| I6 | −0.081 | −0.081 | −0.189 | −0.308 | 0.049 | −0.070 |
| Total | −0.141 | 0.026 | 0.096 | 0.114 | 0.036 | 0.148 |
| E. ISTANBUL | ||||||
| I1 | 0.025 | 0.025 | 0.210 | 0.330 | −0.088 | 0.091 |
| I2 | −1.000 | −1.000 | −1.000 | −1.000 | −1.000 | −0.469 |
| I3 | −0.307 | 0.000 | 0.063 | 0.132 | −0.006 | 0.132 |
| I4 | −0.476 | 0.000 | 0.067 | 0.141 | −0.007 | 0.141 |
| I5 | −0.395 | 0.000 | 0.412 | 0.866 | −0.041 | −0.041 |
| I6 | 0.472 | 0.475 | 0.422 | 0.364 | 0.538 | 0.480 |
| Total | −0.280 | −0.083 | 0.029 | 0.139 | −0.101 | 0.056 |
© 2018 by the authors. Licensee MDPI, Basel, Switzerland. This article is an open access article distributed under the terms and conditions of the Creative Commons Attribution (CC BY) license (http://creativecommons.org/licenses/by/4.0/).
Share and Cite
Hasyimi, V.; Azizalrahman, H. A Strategy-Based Model for Low Carbon Cities. Sustainability 2018, 10, 4828. https://doi.org/10.3390/su10124828
Hasyimi V, Azizalrahman H. A Strategy-Based Model for Low Carbon Cities. Sustainability. 2018; 10(12):4828. https://doi.org/10.3390/su10124828
Chicago/Turabian StyleHasyimi, Valid, and Hossny Azizalrahman. 2018. "A Strategy-Based Model for Low Carbon Cities" Sustainability 10, no. 12: 4828. https://doi.org/10.3390/su10124828
APA StyleHasyimi, V., & Azizalrahman, H. (2018). A Strategy-Based Model for Low Carbon Cities. Sustainability, 10(12), 4828. https://doi.org/10.3390/su10124828