Article

Infrastructural and Human Factors Affecting Safety Outcomes of Cyclists

by
Sergio Useche
1,*,
Luis Montoro
2,
Francisco Alonso
1 and
Oscar Oviedo-Trespalacios
3
1
DATS Development and Advising in Traffic Safety Research Group, INTRAS Research Institute on Traffic and Road Safety, University of Valencia, Carrer del Serpis 29, 3rd Floor, 46022 Valencia, Spain
2
FACTHUM.Lab Human Factor and Road Safety Research Group, INTRAS Research Institute on Traffic and Road Safety, University of Valencia, Carrer del Serpis 29, 1st Floor, FACTHUM.Lab, 46022 Valencia, Spain
3
Centre for Accident Research and Road Safety—Queensland (CARRS-Q), Faculty of Health, Queensland University of Technology (QUT), 130 Victoria Park Rd, Kelvin Grove, QLD 4059, Australia
*
Author to whom correspondence should be addressed.
Sustainability 2018, 10(2), 299; https://doi.org/10.3390/su10020299
Submission received: 11 January 2018 / Revised: 21 January 2018 / Accepted: 22 January 2018 / Published: 24 January 2018
(This article belongs to the Section Environmental Sustainability and Applications)

Abstract

:
The increasing number of registered road crashes involving cyclists during the last decade and the high proportion of road crashes resulting in severe injuries and fatalities among cyclists constitutes a global issue for community health, urban development and sustainability. Nowadays, the incidence of many risk factors for road crashes of cyclists remains largely unexplained. Given the importance of this issue, the present study has been conducted with the aim of determining relationships between infrastructural, human factors and safety outcomes of cyclists. Objectives: This study aimed, first, to examine the relationship between key infrastructural and human factors present in cycling, bicycle-user characteristics and their self-reported experience with road crashes. And second, to determine whether a set of key infrastructural and human factors may predict their self-reported road crashes. Methods: For this cross-sectional study, a total of 1064 cyclists (38.8% women, 61.2% men; M = 32.8 years of age) from 20 different countries across Europe, South America and North America, participated in an online survey composed of four sections: demographic data and cycling-related factors, human factors, perceptions on infrastructural factors and road crashes suffered. Results: The results of this study showed significant associations between human factors, infrastructural conditions and self-reported road crashes. Also, a logistic regression model found that self-reported road crashes of cyclists could be predicted through variables such as age, riding intensity, risky behaviours and problematic user/infrastructure interactions. Conclusions: The results of this study suggest that self-reported road crashes of cyclists are influenced by features related to the user and their interaction with infrastructural characteristics of the road.

1. Introduction

Road crashes have been a substantial concern for public health agencies (government, public entities, healthcare system, etc.) and society for the last half century. However, despite the bicycle being older than every motorized vehicle as a transport mode, the problem of cyclists’ injuries or fatalities as a result of road crashes has been accentuated as a public health problem during the last few years [1]. Consequently, the amount of evidence available for explaining, predicting and preventing road crashes involving cyclists is relatively scarce, especially in developing countries where bicycle usage has exponentially increased [2]. On the other hand, although high-income countries have a broader and longer tradition of using bicycles [3,4], the mechanisms by which human and infrastructural factors act on crash causation are not completely understood.
Considering that, especially in cities, the number of bicycle users, their average daily journeys and distances travelled have been constantly growing and the need for analysing the factors that affect cyclists’ crash rates is increasingly relevant [5,6]. For instance, in the case of Spain, in the period 2008–2013, 25,439 cyclists were involved in crashes resulting in injuries or fatalities [7,8]. Furthermore, only in 2015, from the total of 59,148 road crashes involving injuries or fatalities, 3.85% (2277) of them involved cyclists, leaving as a result 48 dead cyclists—47 men and 1 woman [9]. As for the zones in which crashes occur, urban centres have a higher percentage of crashes (70.7%) and injury or fatality victims (67.4%), compared to country roads, which report 29.3% of crashes and 32.6% of victims. Moreover, 47.2% of severe injuries of cyclists occur on conventional urban roads [7].
Although the overall rates of road crashes (especially involving motorized vehicles) have been decreasing in the last 40 years, the number of cyclist injuries and fatalities as a result of road crashes has been systematically increasing [10]. The reasons for this increase are worth researching and should not be disregarded. In addition, the subsequent health and financial costs of road crashes involving cyclists are considerably elevated [11], especially considering two facts: first, compared to crashes suffered by motor vehicle-users, cyclists have a greater physical vulnerability, even when they were properly using passive-safety elements [12,13]; and second, in most countries cyclists do not need to have crash insurance [14] and often their medical care is subsidized by public healthcare systems [11].
Bicycle-using is widely promoted as a cheap, environmentally responsible and alternative transport mode to conventional motorized vehicles [15] and this has resulted—in many cases—in a disproportionate and sometimes disorganized growth of bicycle users. This situation has implied a significant increase in the need for studies seeking to explore different road system factors associated to road crashes suffered by cyclists, including infrastructure [12,16] and rider behaviour [17]. In this sense, one factor with a greater attributed influence on traffic injuries suffered by cyclists is risky cyclist behaviour [18]. It is estimated that 40% of the crashes suffered by cyclists are preceded by one or more risky cyclist behaviours, especially traffic violations or distracted riding [17]. Furthermore, risky behaviour on the road may be influenced by several variables, such as problematic interactions with other road users, infrastructure problems and the lack of a cycling culture among the population [19,20,21,22,23].
Nevertheless, research linking risky cyclist behaviour with road crashes is scarce [24,25], compared to the number of empirical studies explaining traffic crashes involving motorized vehicle drivers. Generally, this limits our capacity to design evidence-based cyclist injury prevention programs [26,27,28]. In this regard, it is necessary to identify human and infrastructural factors influencing cyclist safety outcomes to support road safety [29,30,31].

Objectives

The objectives of this study focus on first, the relationship between key infrastructural and risk-related human factors present in cycling, characteristics of cyclists and their crash rates. And second, whether infrastructural and human factors on the road are associated with traffic crash rates reported by cyclists, through a predictive model for explaining traffic safety outcomes.

2. Methods and Materials

2.1. Sample

Participants in this study were bicycle users (n = 1064) of 20 different countries from Europe, South America and North America, comprised of 413 women (38.8%) and 651 men (61.2%), with an average of M = 32.83 (SD = 12.63) years of age. The mean time participants used a bicycle per week was M = 6.71 (SD = 6.34) h, i.e., M = 0.96 h or 57.6 min per day. The average length for each bicycle journey was M = 47.60 (SD = 42.68) min, or M = 0.80 h.

2.2. Study Design and Procedure

For this cross-sectional study, participants completed an online questionnaire. A cross-sectional design was selected to maximize sample size in a narrow timeframe of data collection. Participants were informed that their responses would be anonymous and only used for research purposes. The importance of answering honestly to all questions was emphasized, as well as the non-existence of wrong or right answers. Participants were required to indicate their voluntary informed consent before proceeding with the questionnaire. Surveys were fully completed by n = 1064 cyclists, with a 42.6% response rate from approximately 2500 questionnaires that were initially delivered.

2.3. Description of the Questionnaire

The questionnaire was written in Spanish and consisted of various sections: Its initial part addressed individual/demographic variables, such as age, gender and city of residence and cycling-related factors, such as the frequency, length and habits associated to bicycle-using.
The second part examined participants’ self-reported risky behaviours on the road using the Cyclist Behaviour Questionnaire (CBQ) [26], which is specifically designed for measuring high-risk riding behaviours (errors and violations) among bicycle users. This Likert scale is composed of 44 items, distributed in three factors: Violations (V), consisting of 16 items, Errors (E), composed by 16 items and Positive Behaviours (PB), consisting of 12 items. A global score of “Risk Behaviours” was built through the summing of Errors and Violations reported by respondents. The entire questionnaire used a frequency-based response scale of 5 levels: 0 = never, 1 = hardly ever, 2 = sometimes, 3 = frequently, 4 = almost always.
The third part of the survey measured participants’ perceptions about infrastructural conditions and other road users. Firstly, a set of Likert-type items was used to measure the following factors in a scale from 0 (none existing) to 4 (highly present in their habitual cycling experience): the avoidance of cycling under adverse weather conditions, signalizing and infrastructure problems on roads frequented by participants, density of traffic and complexity of urban roads, perceived respect for priority at intersections and overcrowding of bicycle use in their cities/towns of residence. Secondly, a set of dichotomous items (Yes/No) addressed potential negative interactions participants recently experienced in terms of: problematic interactions with other road users, problematic interactions with obstacles on the road and the perception of environmental overstimulation through visual elements present on their circulation roads.
Finally, the fourth part of the questionnaire consisted of a series of questions related to participants’ road crash rates (regardless of severity) suffered over a period of five years (e.g., how many crashes have you suffered when cycling in the last 5 years?).

2.4. Ethics

This study was granted ethics clearance by the Research Ethics Committee for Social Science in Health of the University Research Institute on Traffic and Road Safety at the University of Valencia. This study was deemed in accordance with the ethical principles of the Declaration of Helsinki. The study used an informed consent statement containing ethical principles, data treatment details, explaining the objective of the study, the mean duration of the survey, the personal data treatment and the voluntary nature of the study, which was presented to participants before undertaking the questionnaire. The informed consent statement also advised that identifying data would not be used as participation was anonymous.

2.5. Statistical Analysis (Data Processing)

Basic descriptive analyses were performed in order to obtain raw and standardized scores for study variables. Further, descriptive statistics (means, standard deviations) and Pearson’s (bivariate) correlational analysis were performed to obtain, respectively, basic study factors and associations between study variables. The association between independent study variables and self-reported road crash rates of cyclists (dependent variable) was tested using logistic regression (Logit), using a significance parameter of p < 0.05. All statistical analyses were performed using ©IBM SPSS (Statistical Package for Social Sciences), version 23.0 (IBM, Armonk, NY, USA).

3. Results

3.1. Descriptive Statistics and Study Variable Scores

The mean of self-reported cycling crashes suffered in the last 5 years was M = 0.65 (SD = 0.98). Regarding risky behaviour, the mean for self-reported risky behaviours when cycling (scale 0–4) was M = 1.26 (SD = 0.73) and avoidance of cycling under adverse weather conditions (scale 0–4) was M = 2.75 (SD = 1.25). The mean score obtained for perceived signalizing and infrastructure problems of roads frequented by participants (scale 0–4) was M = 3.44 (SD = 0.80). Perceived density of traffic and complexity of urban roads (scale 0–4) had a mean value of M = 3.38 (SD = 0.91). The perceived respect for priority at intersections (scale 0–4) scored a mean of M = 1.29 (SD = 1.17). In addition, the perceived overcrowding of bicycle’ use in city/town of residence (scale 0–4) presented a mean value of M = 2.27 (SD = 1.14), as shown in Table 1.
Regarding categorical (dichotomous) indicators, 83.6% of cyclists reported frequent problematic interactions with other road users. Furthermore, 84% of participants had problematic interactions with obstacles on the road. On the other hand, only 34.7% of respondents reported perceiving environmental overstimulation through billboards or visual elements on the road.

3.2. Correlation Analysis

The bivariate (Pearson) correlation analysis (see Table 1), allowed identification of significant associations between infrastructural and human demographic factors and traffic safety outcomes. Specifically, age was negatively and significantly related to average hours riding per week, self-reported risky behaviours on the road and self-reported road crashes suffered in the previous five years. On the other hand, age was positively correlated with avoidance, perceived overcrowding of bicycle use and environmental overstimulation. Regarding risky behaviours, significant associations were found for perceived complexity of urban roads [−], perceived respect for priority in crossings [−], avoidance [−] and for self-reported road crash rates [+]. Self-reported road crash rates were also associated with intensity [+], overcrowding of bicycle use [+], avoidance [+] and perceived respect for priority in crossings by other road users [−].

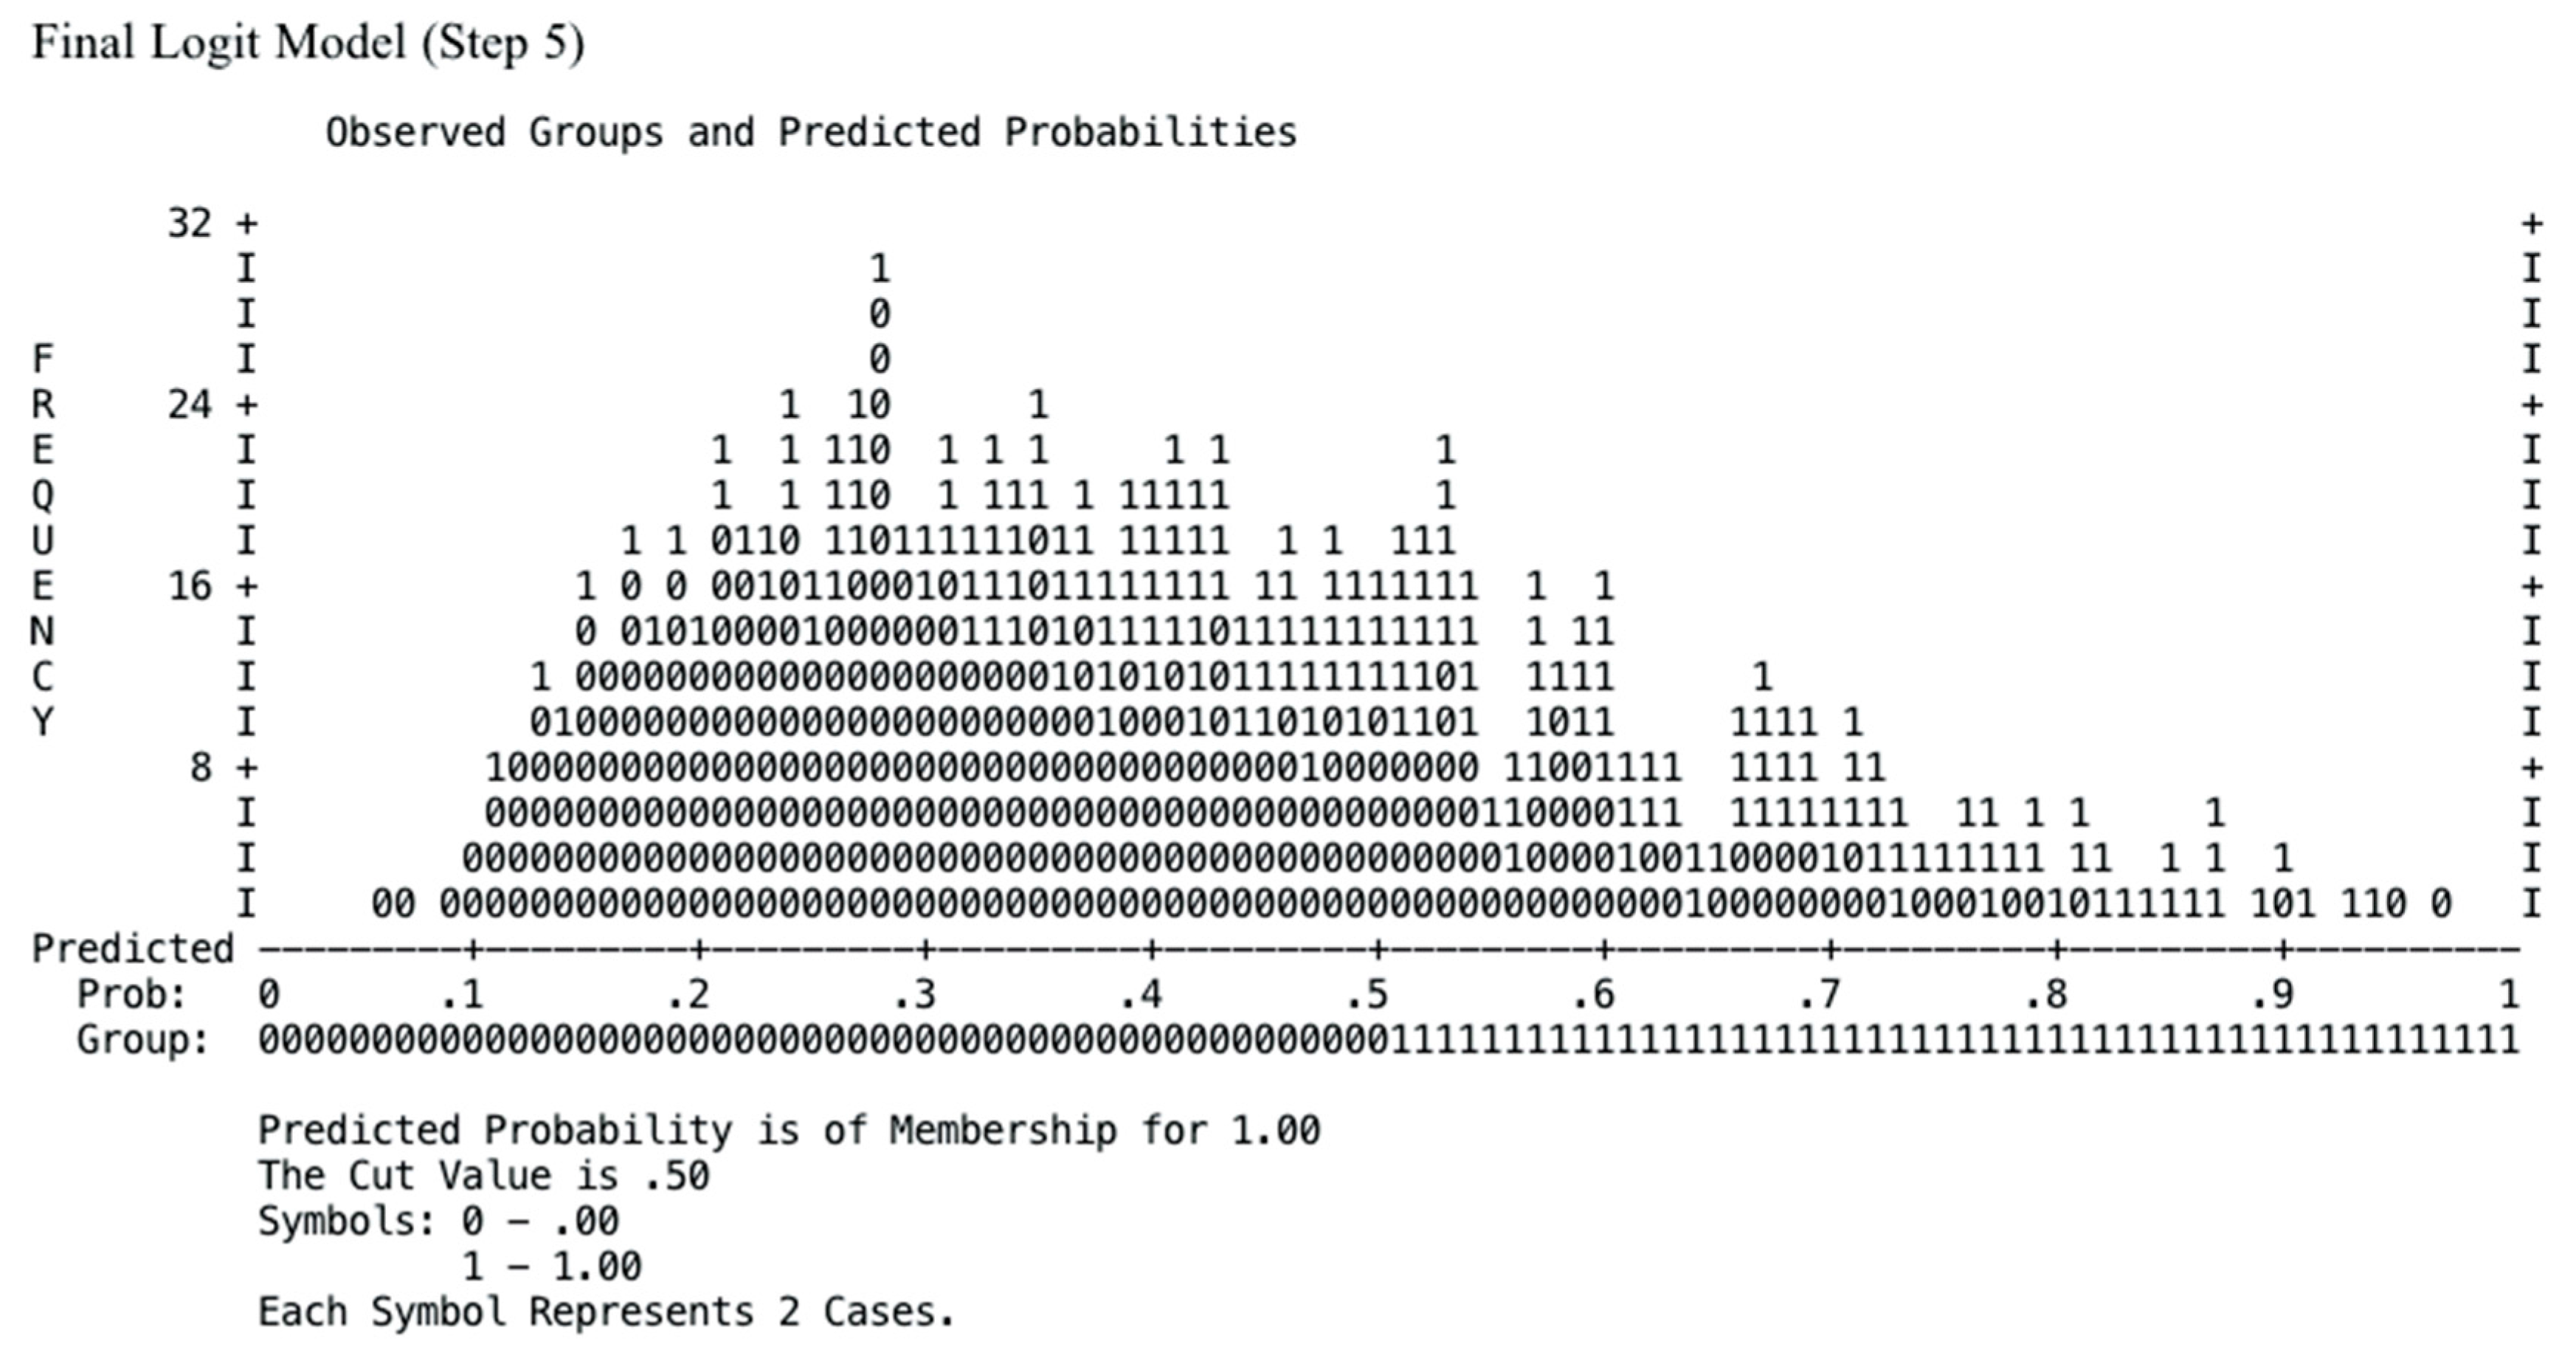
3.3. Logistic Regression (Logit)

The significant model, conducted through a stepwise regression (forward) technique, was fitted using variables contained in Table 2 showing its Beta coefficients, significance level and Confidence Intervals (CI) at 95%. The final model (contained at the fifth step) had an overall accuracy percentage of 66.7%, explained 19.5% of the variance between subjects (with a Nagelkerke’s R-square coefficient of R2 = 0.195) and showed a −2 Log likelihood coefficient of 1282.77 after 3 iterations, with a level of significance of p < 0.001.
Some of the variables contained in the model decreases the Odds Ratio (OR) of belonging to Group 1 (i.e., to have suffered at least one self-reported road crash in the last five years during bicycle riding). These variables are: the age of cyclists, where an increase in one year of age decreases the OR by 1.3% [Exp(B) = 0.978, CIExp(B) = 0.975, 0.999], the respect for the priority of cyclists at intersections, for each additional year of age decreases the OR by 12.9% [Exp(B) = 0.879, CIExp(B) = 0.778, 0.993] and the avoidance of riding under adverse weather conditions, for every additional year of age explains a subsequent decreasing of OR by 19.4% [Exp(B) = 0.823, CIExp(B) = 0.727, 0.933].
On the other hand, there is a set of included variables increasing the OR: the number of weekly riding hours, whereby each additional hour increased the OR by 5.5% [Exp(B) = 1.056, CIExp(B) = 1.031, 1.083], the overcrowding of cycling in city/town of residence, signifying an increase in the OR of 21.1% [Exp(B) = 1.235, CIExp(B) = 1.098, 1.389], the level of traffic density and complexity which increased the OR by 16.2% [Exp(B) = 1.176, CIExp(B) = 1.007, 1.375] and finally, the self-reported risky behaviours when cycling, increasing the OR by 71.3% [Exp(B) = 2.041, CIExp(B) = 1.647, 2.529]. Figure 1 represents the observed groups and probabilistic predictions based on the variables contained in the model.

4. Discussion and Conclusions

The results of this study support the existence of a relationship between infrastructure characteristics, human factors and negative road safety outcomes reported by the international sample of cyclists participating in this research.
Regarding our first objective, it is worth mentioning that the observed directionality of associations between human factors and infrastructure variables, resulted consistently with other studies previously performed with samples of cyclists [4,32] and diverse groups of road users, especially drivers with high exposure to diverse road risks [33,34]. Specifically, it is worth remarking on the associations reported between age of cyclists and road crash rates in the last 5 years which were in accordance with other empirical sources [35,36], i.e., cyclists with less age tend to accumulate higher crash rates (regardless of severity) when riding compared with those with a higher age/riding experience. Furthermore, age was also correlated with risk-related perceptions (linked to infrastructural and interactional factors) and risky behaviours on the road. This finding further supports that not only young drivers are at elevated risk [37,38,39] but also young cyclists tend to present a higher crash risk when riding [40,41]. In addition, intentions, attitudes and perceptions of users have also been correlated to the age, experience and other human factors of cyclists and may play a crucial role for the design of cyclist-related policies [42]. Finally, behavioural factors such as avoidance and problematic interaction with environmental elements of the road correlated with cyclists’ age and hours spent cycling per week.
As for our second objective, this study identified the impact of human and infrastructure-related factors on self-reported road crashes suffered by cyclists, i.e., those reporting road crashes when cycling during the previous five years. In this regard, demographic factors of cyclists were shown to have a substantial influence on safety records, the perceived complexity of urban roads for cycling, traffic density, the respect given for the priority of certain road users and the overcrowding of cycling in their city/town of residence. All significant variables related to infrastructure were shown to have an increasing effect on cyclists’ self-reported involvement in a road crash while riding. Accordingly, the existing literature has shown how transportation infrastructure plays a key role on road safety [43]. For instance, Reynolds et al. [44] stated that improvements in transportation infrastructure may enhance the prevention of crashes and injuries and a successive promotion of a safety culture, inclusive for all road users. More research and system-wide efforts are necessary to address the urban policy failures in safely integrating cyclists in the transport system.
Human factors, personal characteristics and risky riding behaviours, significantly predicted self-reported road crashes. Whilst age and exposure to cycling are sufficiently documented as variables linked to cyclists’ crash risk [6,15,19], much is unknown regarding the nature of cyclists’ risk-taking behaviour. In this sense, investigations targeting the full spectrum of cyclists’ risky behaviours and predictors of cyclists’ risky behaviours are likely to support the development of countermeasures (i.e., public policy and road design) [45].
It is important to remember that cyclists’ safety is a complex issue. Previous studies have reported that integration of cyclists into the transport system has been complicated by poor infrastructure, insufficient legal protections and enforcement, lack of evidence-based road safety education, low empathy from other road users and a lack of perceived risk by cyclists [29,46]. In addition, scholarly literature has described the dominance of motor transport [47], often as an urgent policy issue as the main barrier to create a safe space for cyclists. Unfortunately, the lack of action to safely integrate cyclists into the transport system prevents society from earning the long-term benefits of cycling to the environment, public health and sustainability.
One of the main lessons from this study is that cyclists’ safety must be approached as a complex problem that requires a multi-faceted systems approach. This means that multiple actors at different levels of the transport system should cooperate and coordinate its effort [48]. As mentioned by [49], a systems-based approach to safety should consider equipment and surroundings (such as the bicycle and infrastructure), actor activities (including behaviour of other road users), operational management (such as riding training), local government (including parents of young riders), regulatory bodies (such as police) and government policy (such as infrastructure standards), in the development of countermeasures.

5. Limitations of the Study

Although sample size was considerably large and statistical parameters were overall accurately and positively tested, some potential biasing sources and facts related to the data collection and analysis should be mentioned. First, being an international study, the specific conditions governing traffic dynamics of cyclists belonging to different countries may substantially vary [50,51], considering relevant factors such as the aforementioned status of road safety education [46], absence of legislation and normative regulations for cyclists [52], the use of helmets and reflecting accessories [18], infrastructure-related issues [44]. Furthermore, this research only uses self-reported risky cyclists’ behaviour while, in reality, they could also engage in protective behaviours such as self-regulation.
This research used self-reported road crash data but not police or hospital crash data [53]. Although these self-reports might suffer from inaccuracies, it is important to remember that crash and injury data do not necessarily register all the information necessary to explore the complexity of cyclists’ safety. Self-reported data are a cost-effective road safety tool typically used when archived data is not accessible [54]. In this sense and depending on the attributed complexity of each study, cyclists’ road risk estimation methods may require the implementation of different research methods in future research.
Finally, it is worth addressing the high rate of underreported road crashes, not only in institutional records but also for the case of self-reporting-based studies. Regarding the first, a substantial part of registered traffic crashes involving cyclists, especially those not implying major material losses or injuries, may not be reported [55]. As for the later, a potentially large part of their road crashes suffered may be not reported by cyclists [56], highlighting the lack of a standardized and/or well-known definition of the concept among participants.

6. Practical Applications

This study, based on self-reported cyclist data, provides a useful conceptualization of the impact of human and infrastructural issues that may influence the road safety outcomes of cyclists. In this sense, policy makers and practitioners could consider the reported data as a useful empirical framework for the building of applied interventions aimed at addressing risk factors explaining road crashes. Also, the authors consider that this work represents a useful experience for the statistical approach to the public health problem of traffic injuries among cyclists, suggesting new questions about how to strengthen a sustainable and responsible promotion of alternative transport modes.

Acknowledgments

The authors want to acknowledge the crucial role of participants, members of our research teams and all stakeholders involved in the data collection. Especially, thanks to Boris Cendales for the technical support provided to our study and to James Newton for editing of the final version of the manuscript.

Author Contributions

For this study, Sergio Useche conceived and designed the research and performed the data collection; Sergio Useche and Luis Montoro analysed the data; Francisco Alonso contributed reagents/materials/analysis tools; Sergio Useche and Oscar Oviedo-Trespalacios wrote and revised the paper.

Conflicts of Interest

The authors declare no competing interests.

Funding

This study did not receive any specific grant from funding agencies in the public, commercial, or not-for-profit sectors.

References

  1. Hartog, J.J.; Boogaard, H.; Nijland, H.; Hoek, G. Do the health benefits of cycling outweigh the risks? Environ. Health Perspect. 2010, 118, 1109–1116. [Google Scholar] [CrossRef] [PubMed]
  2. Forjuoh, S.N. Traffic-related injury prevention interventions for low-income countries. Inj. Control Saf. Promot. 2003, 10, 109–118. [Google Scholar] [CrossRef] [PubMed]
  3. Buehler, R.; Pucher, J. Trends in Walking and Cycling Safety: Recent Evidence from High-Income Countries, With a Focus on the United States and Germany. Am. J. Public Health 2017, 107, 281–287. [Google Scholar] [CrossRef] [PubMed]
  4. Olafsson, A.S.; Nielsen, T.S.; Carstensen, T.A. Cycling in multimodal transport behaviours: Exploring modality styles in the Danish population. J. Transp. Geogr. 2016, 52, 123–130. [Google Scholar] [CrossRef]
  5. Ma, X.; Luo, D. Modeling cyclist acceleration process for bicycle traffic simulation using naturalistic data. Transp. Res. Part F 2016, 40, 130–144. [Google Scholar] [CrossRef]
  6. Martínez-Ruiz, V.; Jiménez-Mejías, E.; de Dios Luna-del-Castillo, J.; García-Martín, M.; Jiménez-Moleón, J.J.; Lardelli-Claret, P. Association of cyclists’ age and sex with risk of involvement in a crash before and after adjustment for cycling exposure. Accid. Anal. Prev. 2014, 62, 259–267. [Google Scholar] [CrossRef] [PubMed]
  7. Analysis of Accidents in Cyclists. 2008–2013. Available online: http://go.uv.es/jWkiU0E (accessed on 10 January 2018).
  8. Dirección General de Tráfico (DGT). Anuario Estadístico de Accidentes 2013 (Statistical Yearbook of Accidents 2013); Dirección General de Tráfico: Madrid, Spain, 2014. [Google Scholar]
  9. Dirección General de Tráfico (DGT). Anuario Estadístico de Accidentes 2015 (Statistical Yearbook of Accidents 2015); Dirección General de Tráfico: Madrid, Spain, 2016. [Google Scholar]
  10. Chen, P.; Shen, Q. Built environment effects on cyclist injury severity in automobile-involved bicycle crashes. Accid. Anal. Prev. 2016, 86, 239–246. [Google Scholar] [CrossRef] [PubMed]
  11. Hitchens, P.L.; Palmer, A.J. Characteristics of, and insurance payments for, injuries to cyclists in Tasmania, 1990–2010. Accid. Anal. Prev. 2012, 49, 449–456. [Google Scholar] [CrossRef] [PubMed]
  12. Kaplan, S.; Vavatsoulas, K.; Prato, C.G. Aggravating and mitigating factors associated with cyclist injury severity in Denmark. J. Saf. Res. 2014, 50, 75–82. [Google Scholar] [CrossRef] [PubMed]
  13. Heesch, K.C.; Garrard, J.; Sahlqvist, S. Incidence, severity and correlates of bicycling injuries in a sample of cyclists in Queensland, Australia. Accid. Anal. Prev. 2011, 43, 2085–2092. [Google Scholar] [CrossRef] [PubMed] [Green Version]
  14. Isaksson-Hellman, I. A Study of Bicycle and Passenger Car Collisions Based on Insurance Claims Data. Ann. Adv. Automot. Med. 2012, 56, 3–12. [Google Scholar] [PubMed]
  15. Martínez-Ruiz, V.; Jiménez-Mejías, E.; Amezcua-Prieto, C.; Olmedo-Requena, R.; de Dios Luna-del-Castillo, J.; Lardelli-Claret, P. Contribution of exposure, risk of crash and fatality to explain age- and sex-related differences in traffic-related cyclist mortality rates. Accid. Anal. Prev. 2015, 76, 152–158. [Google Scholar] [CrossRef] [PubMed]
  16. Harris, M.A.; Reynolds, C.C.; Winters, M.; Cripton, P.A.; Shen, H.; Chipman, M.L.; Cusimano, M.D.; Babul, S.; Brubacher, J.R.; Friedman, S.M.; et al. Comparing the effects of infrastructure on bicycling injury at intersections and non-intersections using a case-crossover design. Inj. Prev. 2013, 19, 303–310. [Google Scholar] [CrossRef] [PubMed]
  17. Martí-Belda, A.; Bosó, P.; Lijarcio, I.; López, C. Análisis de la siniestralidad en ciclistas 2008–2013 (Analysis of accidents in cyclists 2008–2013). In Proceedings of the XII Congress in Transport Engineering, Valencia, Spain, 7–9 June 2016. [Google Scholar] [CrossRef]
  18. Constant, A.; Messiah, A.; Felonneau, M.-L.; Lagarde, E. Investigating Helmet Promotion for Cyclists: Results from a Randomised Study with Observation of Behaviour, Using a Semi-Automatic Video System. PLoS ONE 2012, 7, e31651. [Google Scholar] [CrossRef] [PubMed]
  19. Valero, C.F.F.; Puerta, C.P. Identification of the Main Risk Factors for Vulnerable Non-Motorized Users in the City of Manizales and its Relationship with the Quality of Road Infrastructure. Procedia Soc. Behav. Sci. 2014, 162, 359–367. [Google Scholar] [CrossRef]
  20. Johnson, M.; Oxley, J.; Newstead, S.; Charlton, J. Safety in numbers? Investigating Australian driver behaviour, knowledge and attitudes towards cyclists. Accid. Anal. Prev. 2014, 70, 148–154. [Google Scholar] [CrossRef] [PubMed]
  21. Dondi, G.; Simone, A.; Lantieri, C.; Vignali, V. Bike Lane Design: The Context Sensitive Approach. Procedia Eng. 2011, 21, 897–906. [Google Scholar] [CrossRef]
  22. Billot-Grasset, A.; Hours, M. How cyclist behavior affects bicycle accident configurations? Transp. Res. Part F 2016, 41, 261–276. [Google Scholar] [CrossRef]
  23. Twisk, D.A.M.; Commandeur, J.J.F.; Vlakveld, W.P.; Shope, J.T.; Kok, G. Relationships amongst psychological determinants, risk behaviour, and road crashes of young adolescent pedestrians and cyclists: Implications for road safety education programmes. Transp. Res. Part F 2015, 30, 45–56. [Google Scholar] [CrossRef]
  24. Helak, K.; Jehle, D.; McNabb, D.; Battisti, A.; Sanford, S.; Lark, M.C. Factors Influencing Injury Severity of Bicyclists Involved in Crashes with Motor Vehicles: Bike Lanes, Alcohol, Lighting, Speed, and Helmet Use. South. Med. J. 2017, 110, 441–444. [Google Scholar] [CrossRef] [PubMed]
  25. Li, B.; Xiong, S.; Li, X.; Liu, M.; Zhang, X. The Behavior Analysis of Pedestrian-cyclist Interaction at Non-Signalized Intersection on Campus: Conflict and Interference. Procedia Manuf. 2015, 3, 3345–3352. [Google Scholar] [CrossRef]
  26. Useche, S.; Montoro, L.; Alonso, F. Predicting Traffic Accidents on Cyclists: An International Study based on Risky Behaviors, Knowledge of Traffic Rules and Risk Perception. 2018, in press. [Google Scholar]
  27. Fraboni, F.; Marín Puchades, V.; De Angelis, M.; Prati, G.; Pietrantoni, L. Social Influence and Different Types of Red-Light Behaviors among Cyclists. Front. Psychol. 2016, 7, 1834. [Google Scholar] [CrossRef] [PubMed]
  28. Pai, C.-W.; Jou, R.-C. Cyclists’ red-light running behaviours: An examination of risk-taking, opportunistic, and law-obeying behaviours. Accid. Anal. Prev. 2014, 62, 191–198. [Google Scholar] [CrossRef] [PubMed]
  29. Zeuwts, L.H.R.H.; Vansteenkiste, P.; Deconinck, F.J.A.; Cardon, G.; Lenoir, M. Hazard perception in young cyclists and adult cyclists. Accid. Anal. Prev. 2017, 105, 64–71. [Google Scholar] [CrossRef] [PubMed]
  30. Silla, A.; Leden, L.; Rämä, P.; Scholliers, J.; Van Noort, M.; Bell, D. Can cyclist safety be improved with intelligent transport systems? Accid. Anal. Prev. 2017, 105, 134–145. [Google Scholar] [CrossRef] [PubMed]
  31. Schepers, P.; Agerholm, N.; Amoros, E.; Benington, R.; Bjørnskau, T.; Dhondt, S.; de Geus, B.; Hagemeister, C.; Loo, B.P.; Niska, A. An international review of the frequency of single-bicycle crashes (SBCs) and their relation to bicycle modal share. Inj. Prev. 2015, 21, e138–e143. [Google Scholar] [CrossRef] [PubMed]
  32. Feenstra, H.; Ruiter, R.A.; Kok, G. Social-cognitive correlates of risky adolescent cycling behavior. BMC Public Health 2010, 10, 408. [Google Scholar] [CrossRef] [PubMed]
  33. Useche, S.; Gómez, V.; Cendales, B. Stress-related Psychosocial Factors at Work, Fatigue, and Risky Driving Behavior in Bus Rapid Transport (BRT) Drivers. Accid. Anal. Prev. 2017, 104, 106–114. [Google Scholar] [CrossRef] [PubMed]
  34. Sanyang, E.; Peek-Asa, C.; Bass, P.; Young, T.L.; Daffeh, B.; Fuortes, L.J. Risk Factors for Road Traffic Injuries among Different Road Users in the Gambia. J. Environ. Public Health 2017, 2017, 8612953. [Google Scholar] [CrossRef] [PubMed]
  35. Bernhoft, I.M.; Carstensen, G. Preferences and behaviour of pedestrians and cyclists by age and gender. Transp. Res. Part F 2008, 11, 83–95. [Google Scholar] [CrossRef]
  36. Feenstra, H.; Ruiter, R.A.C.; Schepers, J.; Peters, G.-J.; Kok, G. Measuring risky adolescent cycling behaviour. Int. J. Inj. Contr. Saf. Prom. 2011, 18, 181–187. [Google Scholar] [CrossRef] [PubMed]
  37. Montoro, L.; Alonso, F.; Esteban, C.; Toledo, F. Manual de Seguridad Vial: El Factor Humano (Road Safety Manual: The Human Factor); Ariel: Barcelona, Spain, 2000. [Google Scholar]
  38. Scott-Parker, B.; Oviedo-Trespalacios, O. Young driver risky behaviour and predictors of crash risk in Australia, New Zealand and Colombia: Same but different? Accid. Anal. Prev. 2017, 99, 30–38. [Google Scholar] [CrossRef] [PubMed]
  39. Scott-Parker, B.; Watson, B.; King, M.J.; Hyde, M.K. Mileage, car ownership, experience of punishment avoidance, and the risky driving of young drivers. Traffic Inj. Prev. 2011, 12, 559–567. [Google Scholar] [CrossRef] [PubMed] [Green Version]
  40. Teyhan, A.; Cornish, R.; Boyd, A.; Sissons Joshi, M.; Macleod, J. The impact of cycle proficiency training on cycle-related behaviours and accidents in adolescence: Findings from ALSPAC, a UK longitudinal cohort. BMC Public Health 2016, 16, 469. [Google Scholar] [CrossRef] [PubMed]
  41. Møller, M.; Haustein, S. Factors contributing to young moped rider accidents in Denmark. Accid. Anal. Prev. 2016, 87, 1–7. [Google Scholar] [CrossRef] [PubMed] [Green Version]
  42. Fernández-Heredia, Á.; Monzón, A.; Jara-Díaz, S. Understanding cyclists’ perceptions, keys for a successful bicycle promotion. Transp. Res. A 2014, 63, 1–11. [Google Scholar] [CrossRef]
  43. Oviedo-Trespalacios, O.; Haque, M.M.; King, M.; Washington, S. Effects of road infrastructure and traffic complexity in speed adaptation behaviour of distracted drivers. Accid. Anal. Prev. 2017, 101, 67–77. [Google Scholar] [CrossRef] [PubMed]
  44. Reynolds, C.C.O.; Harris, M.A.; Teschke, K.; Cripton, P.A.; Winters, M. The impact of transportation infrastructure on bicycling injuries and crashes: A review of the literature. Environ. Health 2009, 8, 47. [Google Scholar] [CrossRef] [PubMed]
  45. Bicci, A.; Sangiorgi, C.; Vignali, V. Traffic Psychology and Driver Behavior. Procedia Soc. Behav. Sci. 2012, 53, 972–979. [Google Scholar] [CrossRef]
  46. Alonso, F.; Esteban, C.; Useche, S.; Manso, V. Analysis of the State and Development of Road Safety Education in Spanish Higher Education Institutions. High Educ. Res. 2016, 1, 10–18. [Google Scholar] [CrossRef]
  47. Aldred, R. Incompetent or too competent? Negotiating everyday cycling identities in a motor dominated society. Mobilities 2013, 8, 252–271. [Google Scholar] [CrossRef]
  48. Oviedo-Trespalacios, O.; Scott-Parker, B. Young drivers and their cars: Safe and sound or the perfect storm? Accid. Anal. Prev. 2018, 110, 18–28. [Google Scholar] [CrossRef] [PubMed]
  49. Scott-Parker, B.; Goode, N.; Salmon, P. The driver, the road, the rules … and the rest? A systems-based approach to young driver road safety. Accid. Anal. Prev. 2015, 74, 297–305. [Google Scholar] [CrossRef] [PubMed]
  50. Salmon, P.M.; Young, K.L.; Cornelissen, M. Compatible cognition amongst road users: The compatibility of driver, motorcyclist, and cyclist situation awareness. Saf. Sci. 2013, 56, 6–17. [Google Scholar] [CrossRef]
  51. Lahrmann, H.; Kidholm, T.; Madsen, O.; Olesen, A.V. Randomized trials and self-reported accidents as a method to study safety enhancing measures for cyclists—Two case studies. Accid. Anal. Prev. 2017. [Google Scholar] [CrossRef] [PubMed]
  52. Lang, I.A. Demographic, socioeconomic, and attitudinal associations with children’s cycle-helmet use in the absence of legislation. Inj. Prev. 2007, 13, 355–358. [Google Scholar] [CrossRef] [PubMed]
  53. Winters, M.; Babul, S.; Becker, H.J.; Brubacher, J.R.; Chipman, M.; Cripton, P.; Cusimano, M.D.; Friedman, S.M.; Harris, M.A.; Hunte, G.; et al. Safe cycling: How do risk perceptions compare with observed risk? Can. J. Public Health 2012, 103, S42–S47. [Google Scholar] [PubMed]
  54. Oviedo-Trespalacios, O.; Scott-Parker, B. The sex disparity in risky driving: A survey of Colombian young drivers. Traffic Inj. Prev. 2018, 19, 9–17. [Google Scholar] [CrossRef] [PubMed]
  55. Medurya, A.; Grembek, O.; Loukaitou-Siderisc, A.; Shafizadehd, K. Investigating the underreporting of pedestrian and bicycle crashes in and around university campuses—A crowdsourcing approach. Accid. Anal. Prev. 2017. [Google Scholar] [CrossRef] [PubMed]
  56. De Geus, B.; Vandenbulcke, G.; Int Panis, L.; Thomas, I.; Degraeuwe, B.; Cumps, E.; Aertsens, J.; Torfs, R.; Meeusen, R. A prospective cohort study on minor accidents involving commuter cyclists in Belgium. Accid. Anal. Prev. 2012, 45, 683–693. [Google Scholar] [CrossRef] [PubMed]
Figure 1. Observed groups (Logit) and probabilistic predictions, corresponding to 1’s = Positive cases and 0’s = Negative cases.
Sustainability 10 00299 g001
Table 1. Descriptive statistics and bivariate correlations between study variables.
Continuous VariablesMeanSD2345678910111213
1Age of Users32.8312.630−0.177 **−0.274 **−0.0400.176 **0.102 **−0.222 **0.161 **0.0240.0480.171 **−0.197 **−0.190 **
2Hours Riding per Week6.716.34110.206 **0.058−0.097 **−0.0330.107 **−0.199 **−0.024−0.040−0.090 **0.286 **0.228 **
3Own Risky Behaviours1.260.734 10.038−0.170 **−0.115 **0.049−0.247 **0.0330.0180.0440.341 **0.306 **
4Signalizing and Infrastructure Problems3.440.801 10.203 **−0.169 **−0.0280.0530.102 **0.115 **0.0260.0350.040
5Traffic Density and Complexity of Urban Roads3.380.913 10.042−0.0500.155 **0.0260.093 **0.087 **−0.012−0.023
6Respect for Priority at Intersections1.291.172 10.182 **0.047−0.086 **−0.069 *0.053−0.066 *−0.087 **
7Overcrowding of Bicycle Use in City/Town of Residence2.271.249 10.0080.021−0.022−0.0040.133 **0.128 **
8Avoidance (Weather Conditions)2.751.136 10.0000.0470.103 **−0.211 **−0.170 **
Categorical Variables (0/1)FrequencyPercent
9Problematic Interactions with other Road Users89083.6% 10.471 **0.135 **0.0070.054
10Problematic Interactions with Obstacles in the Road89384.0% 10.130 **−0.017−0.018
11Environmental Overstimulation (Billboards)69534.7% 1−0.053−0.046
Self-reported road crashesMean/FrequencySD/Percent
12Self-reported road crashes (5 Years)0.650.983 10.794 **
13Self-reported road crashes (Yes/No)42539.9% 1
** Correlation is significant at the 0.01 level (2-tailed); * Correlation is significant at the 0.05 level (2-tailed).
Table 2. Logistic Regression (Logit) Model. Dependent variable: Self-reported road crash suffered along the last 5 years (Dichotomous, with 1 = probability of success).
StepVariableBS.E.WalddfSig.Exp(B)95% C.I. for Exp(B)
LowerUpper
Step 1 aAge of Users−0.0180.0068.92710.0030.9820.9710.994
Hours Riding per Week0.0610.01323.90510.0001.0631.0371.090
Own Risky Behaviours0.7330.10548.36610.0002.0821.6932.560
Constant−1.1650.27717.76210.0000.312
Step 2 bAge of Users−0.0140.0065.54410.0190.9860.9740.998
Hours Riding per Week0.0590.01321.89810.0001.0611.0351.087
Own Risky Behaviours0.7430.10649.06410.0002.1021.7072.588
Overcrowding of Bicycle Use in City/Town of Residence0.1750.0589.08210.0031.1911.0631.334
Constant−1.6780.32726.29910.0000.187
Step 3 cAge of Users−0.0130.0064.64610.0310.9870.9750.999
Hours Riding per Week0.0540.01318.37510.0001.0561.0301.082
Own Risky Behaviours0.6950.10741.90510.0002.0031.6232.472
Overcrowding of Bicycle Use in City/Town of Residence0.1850.05810.05010.0021.2031.0731.349
Avoidance−0.1800.0638.14810.0040.8350.7380.945
Constant−1.1570.3739.62810.0020.314
Step 4 dAge of Users−0.0120.0063.73410.0530.9880.9761.000
Hours Riding per Week0.0540.01318.10210.0001.0551.0291.081
Own Risky Behaviours0.6830.10840.22210.0001.9811.6032.446
Respect for Priority at Intersections−0.1260.0624.13810.0420.8820.7810.995
Overcrowding of Bicycle Use in City/Town of Residence0.2090.06012.20310.0001.2321.0961.385
Avoidance−0.1830.0638.32310.0040.8330.7360.943
Constant−1.0710.3768.12310.0040.343
Step 5 eAge of Users−0.0130.0064.66610.0310.9870.9750.999
Hours Riding per Week0.0550.01318.79110.0001.0561.0311.083
Own Risky Behaviours0.7130.10942.53610.0002.0411.6472.529
Traffic Density and Complexity of Urban Roads0.1620.0794.18210.0411.1761.0071.375
Respect for Priority at Intersections−0.1290.0624.31410.0380.8790.7780.993
Overcrowding of Bicycle Use in City/Town of Residence0.2110.06012.42710.0001.2351.0981.389
Avoidance−0.1940.0649.28910.0020.8230.7270.933
Constant−1.5890.45612.16210.0000.204
a Variable (s) entered on step 1: Own Risky Behaviours; b Variable (s) entered on step 2: Overcrowding of Bicycle Use in City/Town of Residence; c Variable (s) entered on step 3: Avoidance; d Variable (s) entered on step 4: Respect for Priority at Intersections; e Variable (s) entered on step 5: Traffic Density and Complexity of Urban Roads.

