A Critical Comparison of Alternative Distribution Configurations in Omni-Channel Retailing in Terms of Cost and Greenhouse Gas Emissions


Department of Management, Economics and Industrial Engineering, Politecnico di Milano, 20156 Milano, Italy
*
Author to whom correspondence should be addressed.
Sustainability 2018, 10(2), 307; https://doi.org/10.3390/su10020307
Submission received: 4 December 2017
/
Revised: 20 January 2018
/
Accepted: 23 January 2018
/
Published: 24 January 2018
Abstract
:New opportunities and challenges forced by the ever-increasing importance of the online channel have arisen for retailers. The retailing industry is moving to a new phase, in which the distinctions between traditional and online channels disappear, namely omni-channel (OC) retailing. At the same time, the awareness of environmentally sustainable processes has been enhanced around the world and the environmental impact that results from the online order fulfilment process is becoming a key issue for logistics managers. The new challenge is to understand how multiple channels can be synergistically managed to provide a seamless customer experience, taking an economic and environmental perspective simultaneously. Retailers need to define the distribution configuration for serving the online demand, making decisions on the integration level between online and traditional channels. In this paper, we developed an assessment model of the operational costs and greenhouse gas emissions for three distribution configurations in OC retailing. The model was also applied to a real case operating in the consumer electronics industry. Results highlighted that the search for synergies between online and traditional flows in both warehouse and transport activities is a key factor for the economic and environmental sustainability of OC systems.
1. Introduction
Retail is experiencing a phase of substantial change. New opportunities and challenges forced by the growing importance of the online channel have arisen for retailers including incorporating online sales into their businesses. Initially, companies adopted a multi-channel (MC) strategy by keeping the traditional channel (i.e., stores) and the online channel apart [1], from both a managerial and operational viewpoint. As the line between online and physical channels has blurred, a new approach is emerging—named omni-channel (OC)—which “aims to deliver a seamless customer experience regardless of the channel” [2]. OC retailing allows coordination among channels and lets both customers and companies take full advantage of all the channels opportunities [3,4]. Differently from an MC context, an OC strategy considers the integration of business processes and the synergetic management of multiple channels [5]. At the same time, the awareness of environmentally sustainable processes has been enhanced around the world and the environmental impact that results from the online order fulfilment process is becoming a key issue for logistics managers [6]. The ‘last mile’ of e-fulfilment is well recognized as one of the most costly and polluting parts of the supply chain [7].
In this context, new sustainable logistics models need to be developed by retailers [8], evaluating the trade-off between process integration and the separation of different channels [9]. Integrating and coordinating operations of traditional and online channels represents a big challenge as e-commerce differs from traditional retail in many aspects, such as the picking unit (pieces instead of cases) or the delivery process [10]. Channel integration can occur in a variety of distribution and IT system configurations (e.g., [1]). Companies may use their existing resources (e.g., warehouses, stores, personnel) for serving both traditional and online channels or decide on resources dedicated to the new channel. A total separation strategy complies with the specific requirements of each channel, whereas the integration among different channels could provide synergies and reduce total costs and carbon emissions [1]. For instance, offering an in-store pickup service for online orders means to deliver products to customers by using the same transportation process of the traditional channel. Hence, channel integration is potentially a means to pursue an eco-efficiency strategy as it could simultaneously improve the environmental and economic impact of the logistics process to deliver online orders.
OC retailing promises to be a stimulating research stream for years to come [11]. To date, these topics have only been partially explored by the extant literature. In particular, several contributions have highlighted the need for quantitative models in order to compare multiple distribution configurations for serving the online demand [12]. However, the existing models present some limitations that should be addressed. Most of them analyse the co-existence of multiple channels, without examining in detail the integration among them from an OC perspective. They are often incomplete, as they tend to focus on specific phases of the distribution process instead of taking into account the process as a whole. Furthermore, only a few works have started to consider the environmental dimension (e.g., [13,14]).
In line with this premise, the aim of the present paper is two-fold. First, to propose a model to assess both operational costs and greenhouse gas (GHG) emissions related to three distribution configurations that may be adopted by companies operating in an OC environment. Second, to provide an application of the proposed model to a real case.
The remainder of the paper is organised as follows. The next section summarises the significant literature in this field. The methodology adopted in this study is presented in Section 3. Section 4 describes the distribution configurations under study, whereas Section 5 illustrates the proposed model. An application of the models and discussion of the results are reported in Section 6. In the final section, conclusions are presented.
2. Research Background
This work is related to the stream of studies on online order fulfilment and a multi- and omni-channel environment [12,15]. The aim of comparing alternative distribution configurations in terms of GHG emissions, as well as cost, also links it to the area of sustainability and eco-efficiency.
Little attention has been paid to the environmental impact of distribution networks for e-fulfilment in the existing literature. In this regard, most work has focused on the comparison of carbon footprint implications that result from the traditional channel (i.e., customers pickup goods in store) and the home deliveries related to the online channel. Focusing on the grocery sector, a study provided by Siikavirta et al. [16] investigated the GHG emissions of home delivery, showing that they can be reduced by home delivery by 18–87% compared to the case in which the customer buys products in store. A lower environmental impact of home delivery in terms of Carbon Dioxide (CO2) per purchased product is also shown in other contributions (e.g., [13]). Differently from previous contributions, Mangiaracina et al. [17] provided a quantitative model to compare the carbon emissions of the traditional and online channels in the apparel industry, considering the entire purchasing process, i.e., from the pre-sale to the post-sale activity. Looking beyond the topics related to the distribution networks for e-fulfilment, a quantitative evaluation of the environmental impact of logistics solutions has been proposed in a variety of studies. For instance, Colicchia et al. [18] proposed a supply chain network design framework that is based on multi-objective mathematical programming to identify ‘eco-efficient’ configuration alternatives (defined by the number of transit points to be activated) that are both efficient and ecologically sound. A comparison among different warehousing automated solutions were provided by [19], including the environmental dimensions starting from the energy consumption evaluation. In most cases, these contributions used conversion factors to estimate CO2 emissions starting from the energy consumption or the number of travelled kilometres based on specific books and reports provided by a government agency (e.g., [20,21]). For instance, DEFRA, i.e., the department of the United Kingdom government that is responsible for protecting the environment, manufacturing, agriculture, fisheries, and rural communities, provides an estimate of the kilograms of CO2 per travelled kilometre, distinguishing among different types of vehicles. Another research stream regards the green practices adopted by logistics service providers (e.g., [22,23]), and a new interesting issue related to the role of logistics service providers, for instance in the aggregating network, is becoming more and more important [24,25].
With reference to the modelling and study of distribution systems for e-fulfilment, several quantitative models are available. As an example, the distribution costs of three different configurations, namely ‘store-picking’, ‘dedicated warehouse-picking’, and ‘drop-shipping’, were compared [26] by proposing an order policy model based on a newsboy-based approach [27]. Another example, provided by [28], focused on the choice to dedicate a separate warehouse to the online channel, showing that it is possible to identify a threshold, as a percentage of the total demand related to the online channel, to make such a decision. More recently, Bretthauer et al. [29] developed a model to determine how many and which of the company logistics facilities should handle online sales to minimise logistics costs. Other studies focused on specific parts of the distribution process or managerial policies. Considering the inventory management, a lost sales model to investigate conditions for optimality of inventory replenishment policies in the presence of two different channels were proposed [30]. Li et al. [31] developed a multi-period stochastic dynamic programming model to analyse the inventory management problem for dual sales channels with inventory-level-dependent demand. Another research stream focuses on the delivery service for online orders. For instance, the time slot management problem were addressed in the study provided by Agatz et al. [32], whereas [33] assessed the impact of the delivery window length on distribution performance (i.e., cost and service level). However, these studies adopted a single channel perspective. Considering multiple channels, a conceptual framework comparing the ‘bulk shipment’ to the ‘individual shipment’ policy were proposed by Metters and Walton [10]. The first option implies that shipments are divided by zone, all products are delivered to the store of the corresponding final-delivery zone, and then local distribution routes are organised. Vice versa, the second option concerns the shipment of individual orders, or even individual items, using a courier.
Based on the above discussion, the literature review reveals that there is still a need for further modelling distribution configurations by adopting an OC perspective and taking into account the distribution process as a whole. Moreover, only a few attempts have been found to include the environmental impact of the logistics model for online retailing. However, to the best of the authors knowledge, such contributions focused on the comparison between the online and offline channels, without considering the multiple logistics model (i.e., only home delivery by using carriers starting from a distribution centre).
In this study, we contribute to previous contributions by comparing alternative distribution configurations characterized by a different integration level between online and traditional channels, the key variable in an OC environment, in terms of both costs and GHG emissions.
3. Research Methodology
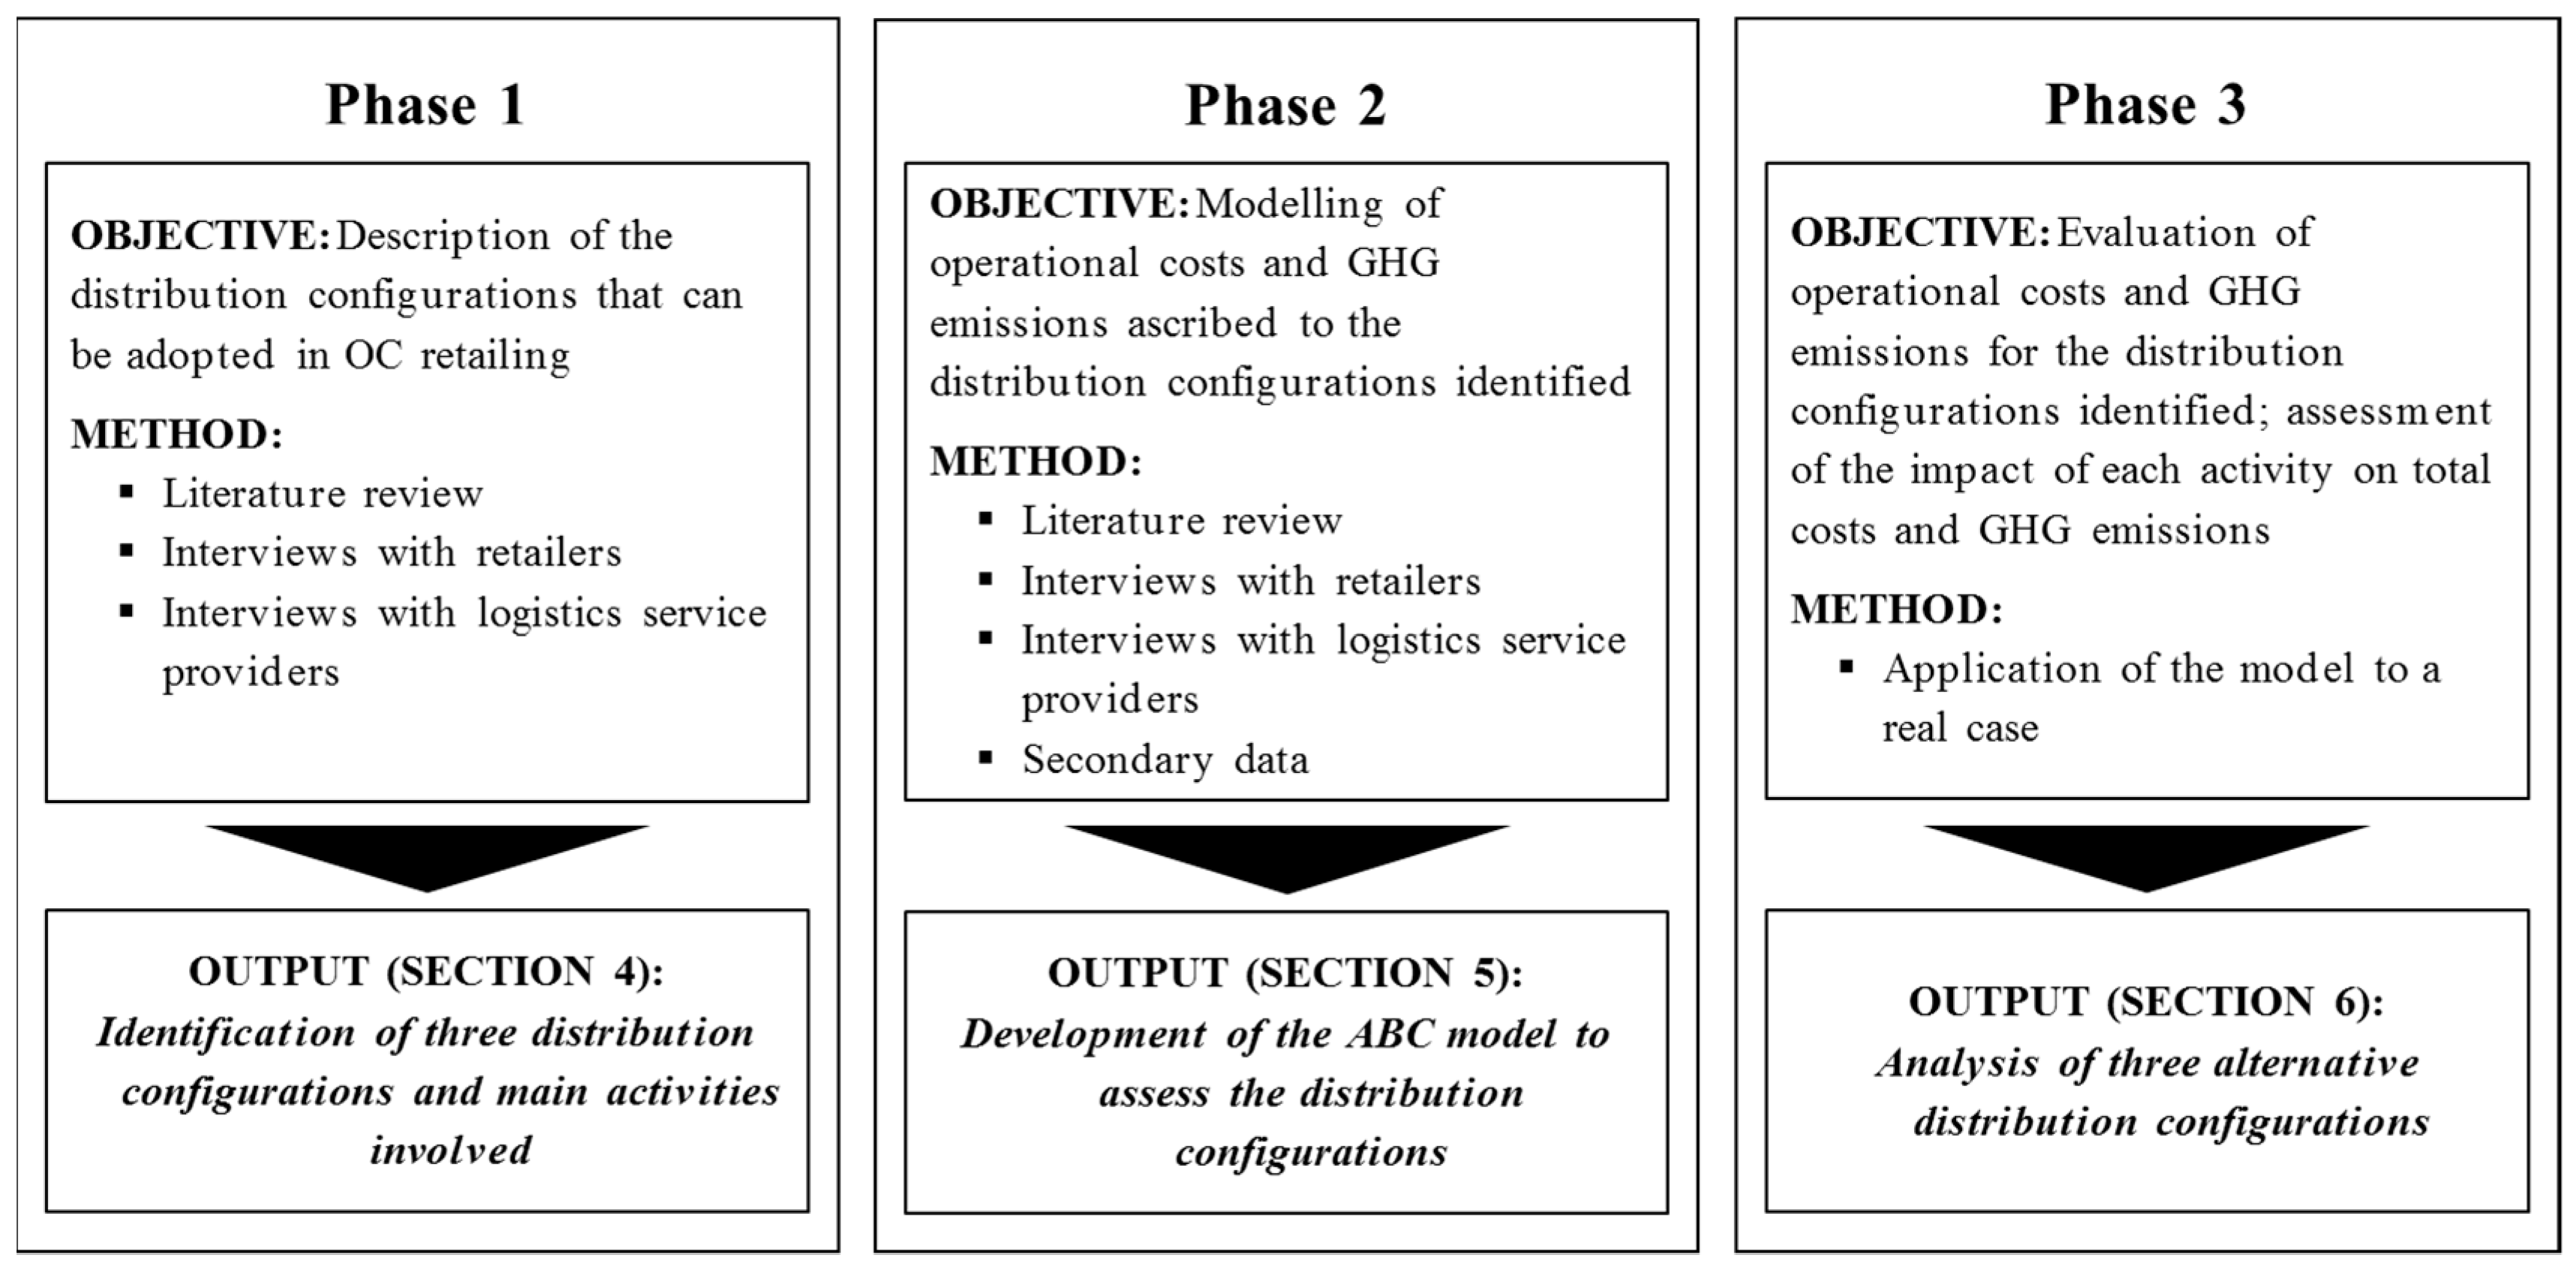
The present study aims at contributing to the previous literature on logistics in OC retailing by developing a model to compare multiple distribution configurations in terms of operational costs and environmental impact. The retailer perspective is taken, with the company logistic process thus being the focus of the analysis. A three-phase methodology was adopted (Figure 1).
The first phase involved the description of multiple distribution configurations that can be adopted by companies operating in an OC environment for serving their online customers. Furthermore, the distribution process was examined in detail in order to identify the main activities. Two main sources were used: an extensive literature review on distribution configurations in e-fulfilment and interviews with both retailers operating in an OC environment (eight companies) and logistics service providers (10 companies).
The second phase implied the modelling of operational costs and GHG emissions ascribed to each distribution configuration selected in phase 1. To develop a generally valid model, aligned with [17], an analytical approach was adopted due to its flexibility (changes and variations can be introduced for each modelled activity with limited effort) and transparency (assumptions are clear and evident from the analytical formulas). Specifically, the activity-based costing (ABC) method was selected as it was considered suitable for measuring the performance of the logistics process [34]. Understanding ABC can lead to a greater knowledge of company business processes underlying the ‘true costs’ of operations [35]. When the individual activities and costs are considered together, a clear picture of the total cost of the process becomes transparent [34]. Thus, the company can pursue the objective of providing the required customer service in a cost-efficient way [35]. The application of this methodology requires the identification of the following elements: inputs (data required to run the model), contextual data (parameters referred to the external context with an impact on the operational costs), mathematical formulas to assess the operational cost and GHG emissions for each individual activity, and outputs (tables and graphs to display the results). Three main sources were used: a literature review on the structure of the distribution process for serving online demand in an OC environment; interviews conducted with the aforementioned eight retailers and 10 logistics service providers, in order to collect detailed information on the activities involved in the distribution process; and analysis of secondary sources (e.g., logistics practitioners’ journals, websites, research reports). The GHG emissions were measured in carbon dioxide equivalent (CO2e) that considers methane (CH4), nitrous oxide (N2O), and fluorinated gases as well as CO2.
The involved retailers are pioneers of the Italian e-commerce market and their current e-commerce market share in Italy is over 40% in their respective sector. The interviewees were Supply Chain or Logistics directors. The interviewed logistics service providers are leading companies in the contract logistics market and are involved in the Observatory of Contract Logistics, a permanent initiative launched in 2011 by the School of Management of Politecnico di Milano for doing research on logistics outsourcing (http://www.contractlogistics.it), in which the authors work. The interviewees of logistics service providers were senior managers with more than ten years’ experience in the field. All the interviews varied in length, but on average, they lasted about one hour and a half.
In the third phase, the model was applied to compare multiple distribution configurations using the real data obtained from an Italian retailer operating in the consumer electronics industry. Due to the sensitive nature of the topic, confidentiality must be assured, therefore neither company names nor individuals can be revealed.
4. Description of Distribution Configurations
This section provides a description of the examined distribution configurations. Coherently with the research objectives, the study focuses on retailers selling products in both online and traditional channels. The traditional network is typically characterised by distribution centres (DCs) supplying a chain of brick-and-mortar retail stores. To serve the online channel, we considered three distribution configurations to fulfil online orders through home delivery that differ in the integration level between online and traditional channels: ‘dedicated network’, ‘integrated warehouse network’, and ‘integrated warehouse and transport network’. For all configurations, we assumed the same service level to customers (e.g., same lead time).
The first configuration (Figure 2a) implies no integration between online and traditional channels. It entails the introduction of a DC dedicated to the fulfilment of online orders. This solution requires high investments in terms of logistics facilities, but it guarantees no interference with traditional processes in the warehouse activities. Looking at the delivery service, goods are transported by either couriers or express couriers according to the delivery speed required by the customer. Thanks to the use of the couriers’ network, the company can offer a fast response time, although the transport could be quite expensive and the environmental impact high as a ‘double handling’ of goods (i.e., good are not directly ship to customers but they are firstly handled by couriers) is needed and the parcel service is used.
In the second configuration (Figure 2b), online orders are fulfilled from an existing DC, also supplying traditional stores. This solution implies low investments and is easy to set up for companies with DCs characterised by an unused capacity and operations already organised per piece. However, the integration of online and traditional flows could compromise the efficiency of traditional processes. The delivery service, similarly to the first configuration, is managed using couriers/express couriers. Here, there is integration at the warehouse level, with a search for synergy between online and traditional channels in both inventory management and picking activities, while transport service is specifically designed for online orders (i.e., shipment of single orders performed by couriers) with the same drawbacks mentioned for the first configuration.
The third configuration is characterised by integration in both warehouse and transport phases (Figure 2c). Online orders are fulfilled from an existing DC also supplying traditional stores, as in the second configuration. In addition, the retailer moves to store the online products during the replenishment of traditional stores. Then, closed-loop tours to deliver online orders starting from the store are performed. In this configuration, the retailer can obtain significant cost and environmental advantages thanks to the aggregation of online and traditional flows for transport between DC and local stores. Additionally, as both the transport between DC and stores and the delivery tours from stores are managed by the company, green transport solutions, such as liquefied natural gas trucks and electric vehicles, can be easily introduced. However, stores are required to manage the online orders by performing handling activities and storing orders received from the DC and ready to deliver to customers.
5. Model for Cost and Greenhouse Gas Emissions Assessment of a Distribution Configuration
From a methodological point of view, the development of the ABC model was based on three major steps: (i) identification of the main phases and activities; (ii) identification of costs drivers and drivers related to the CO2e emissions associated with each activity; and (iii) introduction of analytical formulas to assess activity cost and CO2e emissions according to corresponding drivers. Section 5.1 reports the selected activities within the distribution process (phases and activities are the same for both cost and carbon emission assessment). Section 5.2 and Section 5.3 provide the drivers and analytical formulas for assessing cost and GHG emissions, respectively.
As the output, the model provides a spreadsheet containing links to tables and graphs showing the results, i.e., the operational costs and the environmental impact of the distribution process in e-fulfilment. The overall result can be then analysed according to different aggregation levels:
- Distribution configuration: to compare multiple distribution configurations in terms of operational costs and CO2e emissions;
- Phase: to understand the role of each phase in determining the overall operational costs and in generating CO2e emissions;
- Activity: to investigate the impact of each activity on the overall phase cost and CO2e emissions.
5.1. Distribution Process
Based on the results of both the literature review and the interviews, the distribution process was broken down into the five phases, as illustrated in Figure 3. As the primary aim of the model was to compare multiple distribution configurations, and not to assess the total costs of the entire delivery process for each option, only those activities that are differential among the analysed configurations have been considered. We therefore disregarded activities such as order management and administrative procedures. Similarly, we decided not to consider the returns management problem since in many business sectors (e.g., consumer electronics) returned goods are managed similarly, regardless of the distribution configuration adopted. The resulting phases are as follows:
- Transport from supplier to DC. This phase refers to the replenishment of the DC where online order fulfilment is performed; given a certain replenishment frequency, the truck capacity saturation is lower in Configuration 1 as flows of the online channel are not merged with those of the traditional channel;
- Warehousing. In all configurations, this phase considers the entire process performed within the DC and therefore refers to receiving, storing, inventory, picking, packing, and consolidation. In the case of a DC devoted to the online channel (i.e., Configuration 1), picking productivity is expected to be higher considering the lower size of this area compared to the other two alternatives; the handling activities are more complex as the DC places smaller orders to the supplier and therefore the percentage of received mixed pallets is higher;
- Transport from DC to store. This phase is required only in the case of the integrated warehouse and transport configuration as the courier’s network is used in the other alternatives;
- Store activities. This phase is required only in case of the integrated warehouse and transport configuration as in the other two alternatives the store is not involved in e-fulfilment; as mentioned before, in Configuration 1, the store has to perform handling activities and store orders received from the DC;
- Home delivery. It refers to the delivery performed by the courier in Configurations 1 and 2 and to the delivery tours starting from the store in Configuration 3.
Note that the phases and the activities in the distribution process are essentially identical for the analysed configurations—except for (3) and (4) that are only related to the third analysed distribution configuration. Differences in resulting costs are related to the different use of resources and managerial policies depending on the configuration.
5.2. Cost Assessment
Given the phases and activities mentioned in Section 5.1, the cost drivers associated with each activity were identified. As shown in Table 1, eight cost driver categories have been defined (demand, online order, product and delivery profile, inventory management, handling activities, and store and suppliers profile), with different drivers for each category.
Based on the cost drivers reported in Table 1, Table 2 illustrates the analytical formulas employed to evaluate the cost of each activity for an order. For example, the picking cost may be viewed as a function of the pickers’ productivity, as well as the average number of lines per order. For some activities, costs were assessed differently based on the distribution configuration. As an example, the delivery cost is expressed as a function of the courier fare only in the dedicated and integrated warehouse configurations. Instead, in the integrated warehouse and transport configuration, we assumed that the company organises milk runs, starting from the store, and modelled the delivery cost as a function of the required number of vehicles and the number of deliveries per vehicle. The latter depends, in turn, on the time available for the deliveries, the average drop-off time at the customer’s home and the time to move from one customer to the next. This travel time is related to the average distance between one customer and the next and the average transfer speed. Furthermore, the average distance between one customer and the next one depends on the delivery area and the online demand (i.e., delivery density).
5.3. Greenhouse Gas Emissions Assessment
Table 3 reports the GHG emissions categories and drivers. Some drivers were considered to be the same for both cost and emission assessment (e.g., the online order profile and the average travel distances from suppliers to DC, from DC to store, and in the delivery area in the milk run case). Other drivers, such as the average weight of one unit and the energy consumption related to warehousing and in store activities, were specifically introduced to evaluate the environmental impact. Note that only the GHG emissions-specific drivers are included in Table 3 for the sake of brevity.
The analytical formulas to assess the environmental impact of each activity for an order are described in Table 4. In line with previous contributions, formulas use conversion factors to estimate CO2e. With reference to transport, formulas are based on the travelled kilometres and use conversion factors expressed as kgCO2e/km. Likewise, to assess CO2e related to warehousing and handling activities, conversion factors expressed as kgCO2e/kWh are considered.
6. Comparison of the Alternative Distribution Configuration
6.1. Main Data and Assumptions
The model was applied to a real case to evaluate the operational costs and GHG emissions per order. We considered an Italian retailer operating in the consumer electronics industry. Table 5 and Table 6 show the values associated with the relevant cost drivers and the main parameters to evaluate GHG emissions used in the analysis, respectively.
6.2. Economic Impact Evaluation
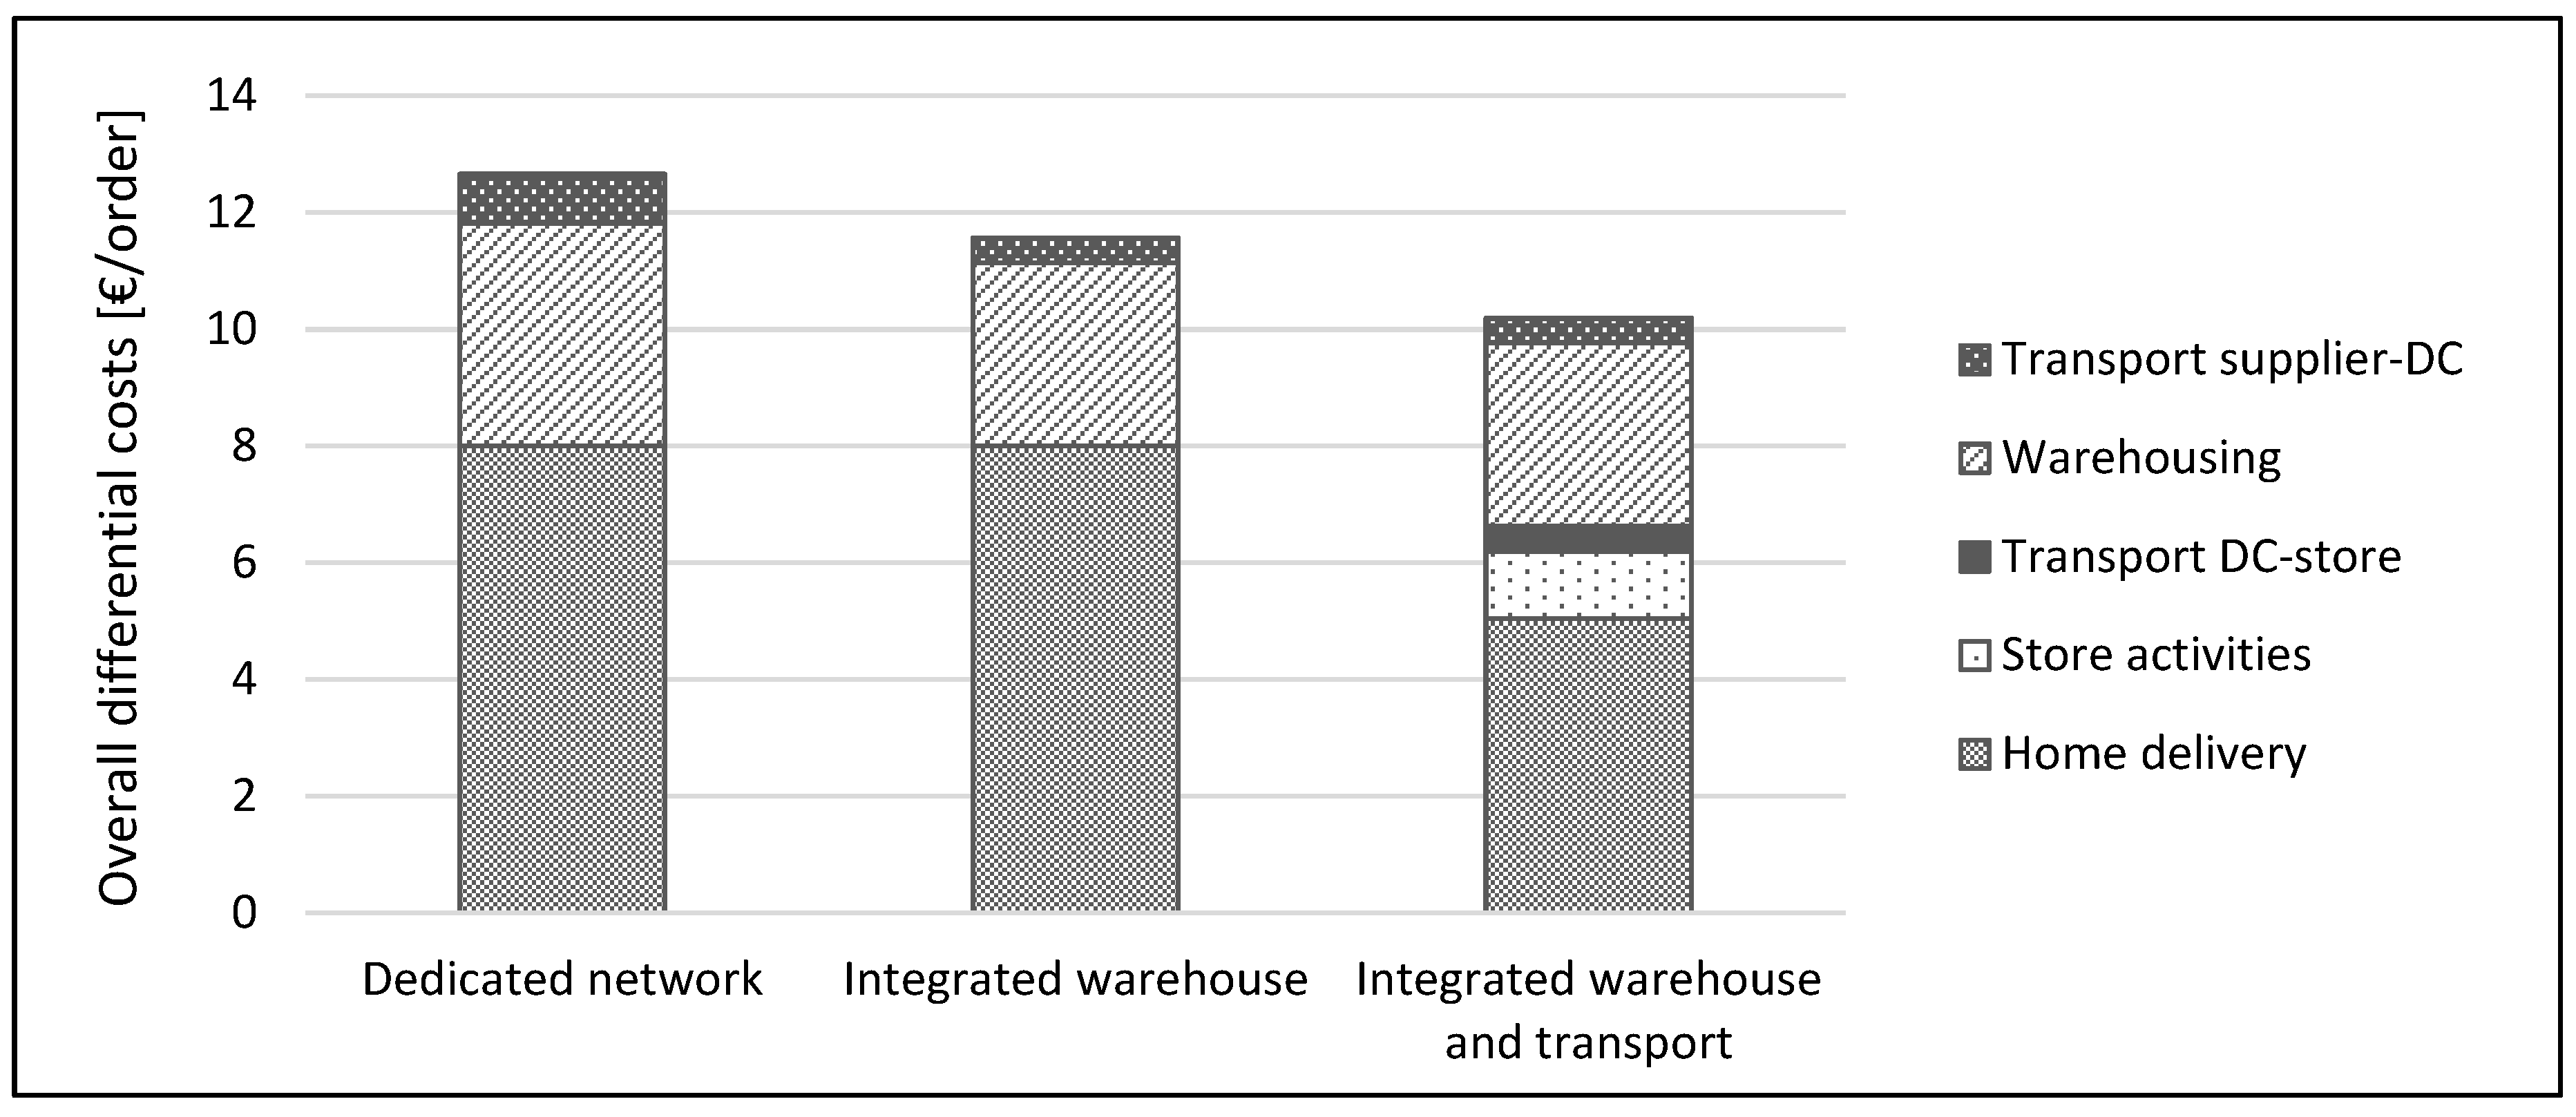
Figure 4 summarises the operational costs per order and the impact of the main phases that characterise the distribution process for the three distribution configurations included in the analysis. The operational costs per order turn out to be between 10.2 €/order and 12.7 €/order, i.e., 3%/4% of the average order value. We observe a strong incidence of both home delivery and warehousing costs on the overall logistics costs. In all the configurations, the delivery costs account for more than 50% of the overall differential costs, whereas the warehousing costs account for approximately 30%.
For the home delivery, the retailer can use the courier network (in Configurations 1 and 2) or exploit synergies with the offline channel tanks by using the replenishment of stores to also move online products close to their final-delivery area and then organise local distribution routes. The results show that the involvement of the store as consolidation and a starting point for the home delivery can result in a significant reduction of the delivery costs, i.e., 5.04 €/order instead of 8 €/order.
Focusing on the warehousing phase, the inventory carrying costs is the most significant item cost (70% of the warehousing costs in the dedicated network, and 63% in the other two configurations). In line with previous literature, the results confirm that the retailer obtains significant benefits from inventory integration in the case that online and offline demands are negatively correlated; a warehouse shared between the two channels allows a reduction of demand variability and, in turn, of the safety stocks at the DC.
In summary, the adoption of a dedicated network to fulfil online orders is the solution with lower complexity from a managerial perspective, without the need for a redesign of the traditional processes. However, this configuration is also the most expensive due to the lack of synergy between online and traditional channels. In OC retailing, the integration between online and traditional channels is important not only in the front-end processes, but also from a logistics perspective in order to offer a seamless customer experience in a cost-efficient way. Compared to the use of a dedicated network, the integration at the warehouse level results in a reduction of 10% in the cost per order. The economic benefit increases in the case of integration between the online and offline channel at both warehouse and transportation levels. Compared to a dedicated network, the cost reduction in the cost per order is 24%. The additional cost related to the online order management at the store is balanced by the improvement in the home delivery cost due to the use of more efficient shipments (milk run starting from the store compared the use of a courier).
6.3. Environmental Impact Evaluation
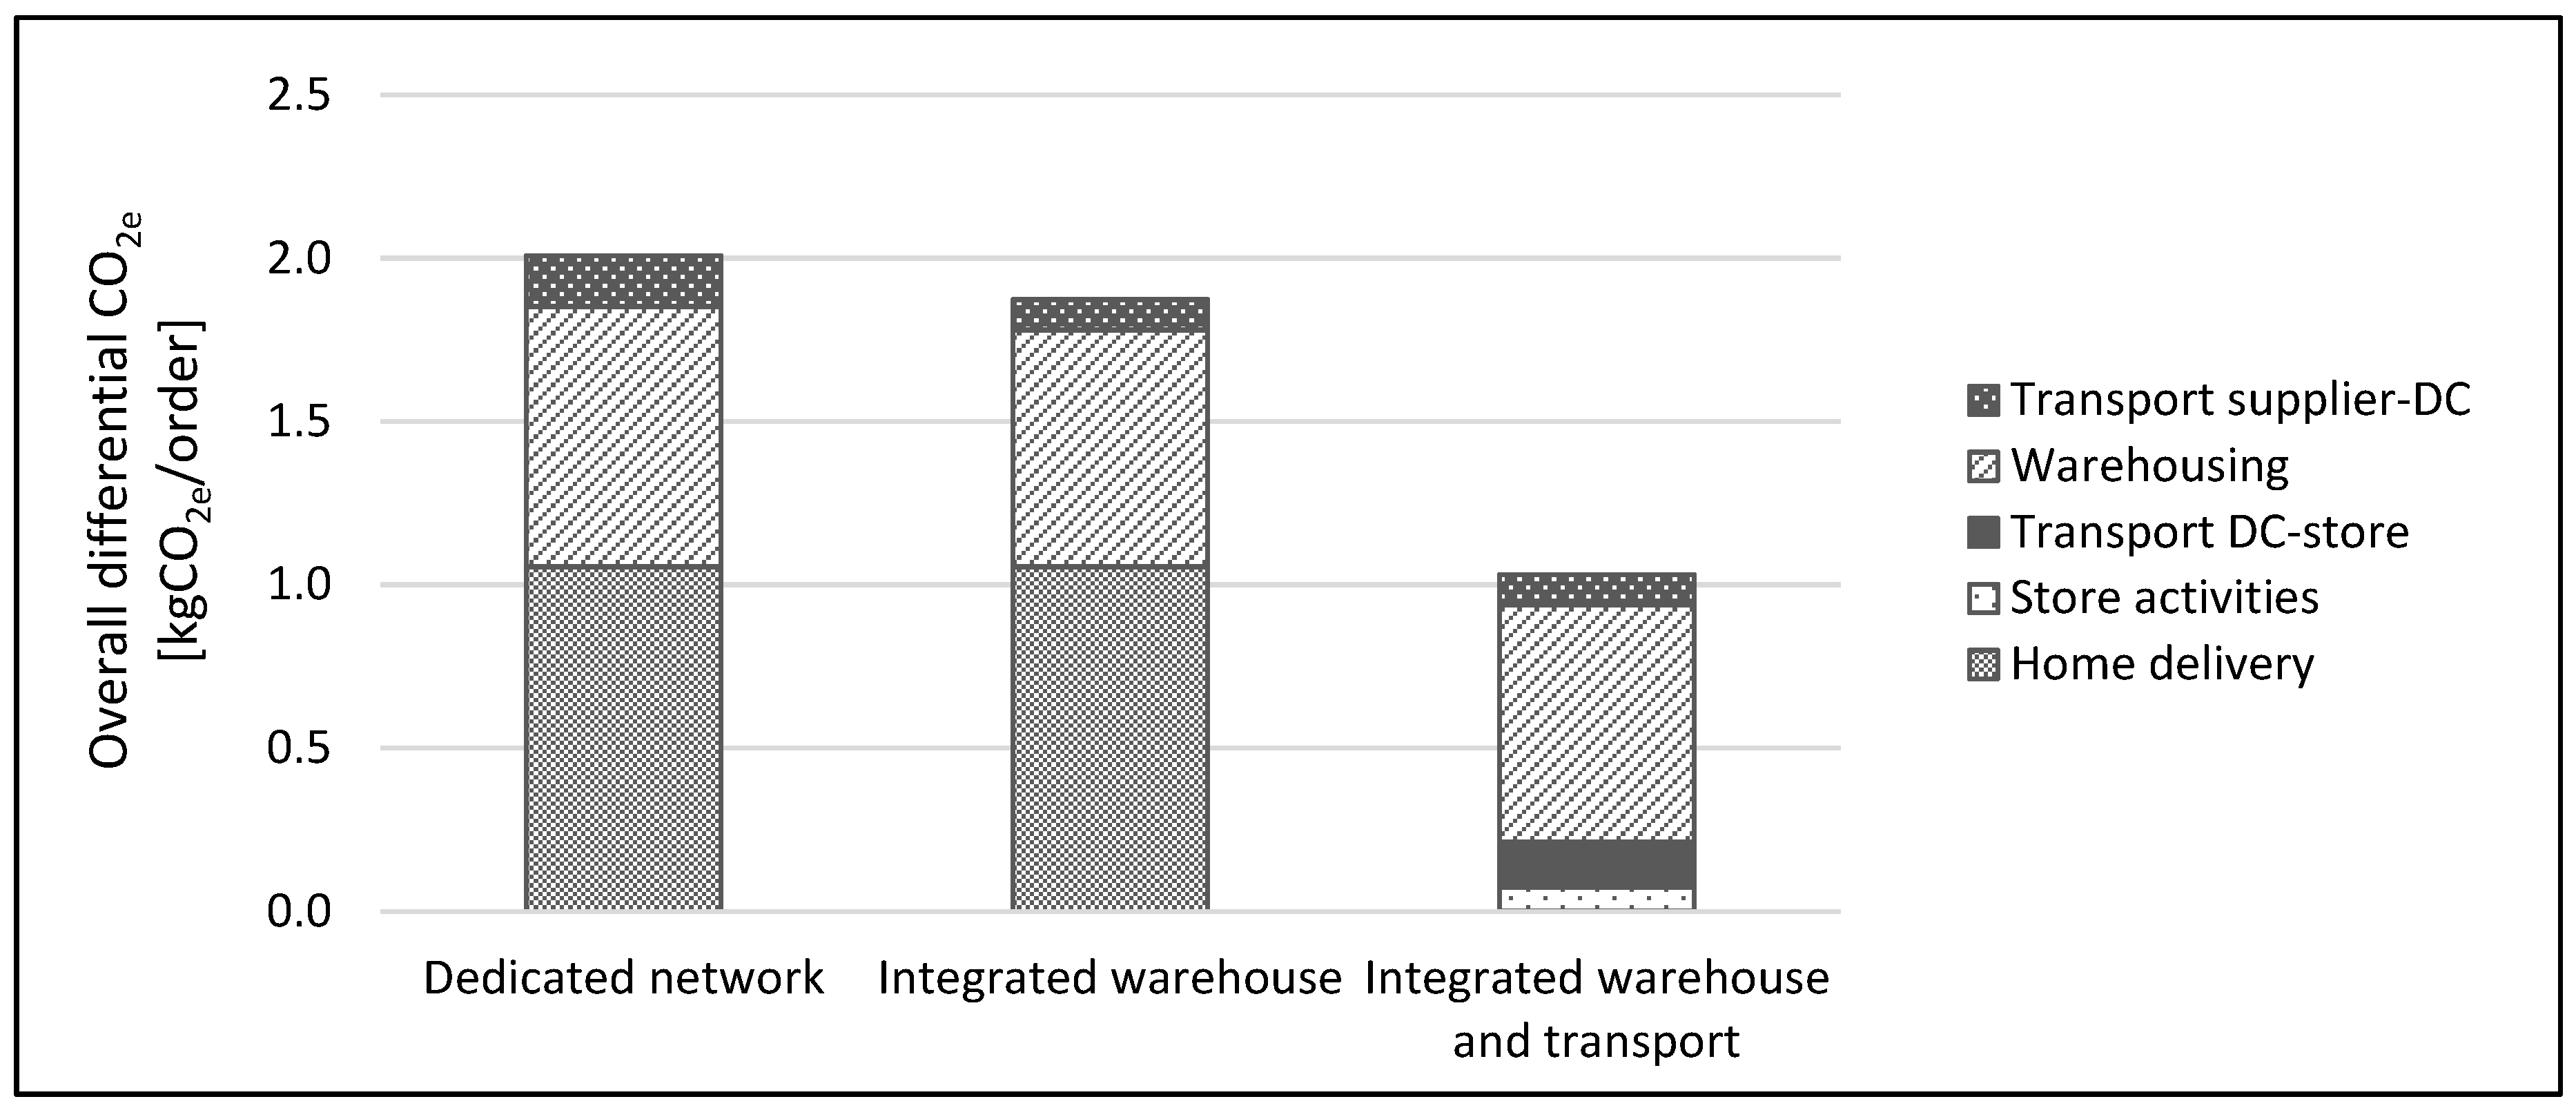
Figure 5 summarises the environmental impact in terms of GHG emissions per order and the impact of the main phases that characterise the distribution process for the three distribution configurations included in the analysis. As in the economic evaluation, the phases showing the highest GHG emissions are home delivery and warehousing. The GHG emissions per order range from 1.0 kgCO2e/order for Configuration 3 to 2.0 kgCO2e/order for Configuration 1. Looking at Configuration 2, the results show that the integration at the warehouse level is more beneficial from an economic perspective rather than from an environmental one, with a reduction in the GHG emissions per order of 7% compared to Configuration 1. The reason is related to the double handling of goods needed when the parcel service is used. The same trend, but more emphasised, can be observed for Configuration 3, i.e., the integrated warehouse and transport configuration, which is the better considering the environmental impact. In this case, the reduction in the GHG emissions per order is 50% compared to Configuration 1 thanks to the aggregation of online and traditional flows for transport between DC and local stores.
In summary, the channel integration can be considered as a mean to pursue an eco-efficiency strategy as it could simultaneously improve the environmental and economic impact. However, the benefits in terms of costs and environmental impact are different depending on the distribution configuration under examination, stressing the importance of using a flexible tool to compare different alternatives.
7. Conclusions
This study is a rare attempt at evaluating the environmental impact of distribution network design. It examined the three distribution configurations mainly adopted by companies operating in an OC environment: ‘dedicated network’, ‘integrated warehouse’, and ‘integrated warehouse and transport’ configurations. These three configurations under study also formalise the integration level between online and traditional channels. After analysing the main characteristics of the distribution process related to the fulfilment of online orders, we developed a model, using the ABC approach, to assess the operational costs and GHG emissions related to the distribution process and compare the three distribution configurations. The process considered in this study starts from the transport from suppliers and closes with the product delivery to customers. The model was applied to a real case. The case study revealed that the logistics phases with a higher impact are inventory carrying costs and home delivery, both considering the economic and the environmental perspective. The search for synergy and integration between online and traditional flows in both phases is important for the economic and above all environmental sustainability of OC systems. Our findings coming from the model application to a real case in the consumer electronics industry can be considered valid for the non-food retailers’ category as the logistics problem is similar, as well as the distribution configurations under study.
This paper contributes to the academic literature by: (i) extending the current study on the environmental impact of online order fulfilment to configurations that have not been analysed in this research stream up to now; (ii) considering both the economic and environmental perspectives simultaneously; and (iii) providing a model that is quite generic and allows further extensions (e.g., to accommodate other activities or distribution configurations).
From a practical perspective, the practical relevance of our contribution has been demonstrated for a real case study. Differently from previous studies that focused on industry such as apparel or grocery, the case study included in this paper shows insights from the consumer electronic sector. The model is intended to be a functional and easy-to-use tool for retailers who aim to understand costs and environmental impact related to the fulfilment of online orders. Specifically, the proposed model helps retailers to select the distribution configuration most suitable to their characteristics and to understand how their configuration should vary with the evolution of the context (e.g., relevance of online demand, introduction of green vehicles by the company or the logistics service providers, or creation of centralised distribution systems).
The present study has some limitations that should be considered. First, the proposed model only considers the activities that are differential among the examined configurations. To assess the total costs of the entire distribution process, other activities should be included, e.g., orders management and returns management. The proposed model can also be easily adjusted to handle other distribution configurations that, for instance, may imply a broader role of stores (e.g., to use of store’s inventory to serve online orders or the opportunity for customers to buy online and pickup in-store). At last, it is interesting to apply the model to other business sectors. A sensitivity analysis could allow us to understand how the operational costs and the GHG emissions related to the different distribution configurations change with respect to the variation of some key parameters (e.g., the relevance of online demand, the order size, and the delivery area) or to the use of greener technology for both transport and warehouse activities (e.g., [37]).
Author Contributions
All authors were involved in choosing the research methodology, in data analysis, as well as in the result analysis and discussion. All authors wrote a part of the manuscript and have approved the submitted manuscript.
Conflicts of Interest
The authors declare no conflict of interest.
References
- Gallino, S.; Moreno, A. Integration of online and offline channels in retail: The impact of sharing reliable inventory availability information. Manag. Sci. 2014, 60, 1434–1451. [Google Scholar] [CrossRef]
- Piotrowicz, W.; Cuthbertson, R. Introduction to the special issue information technology in retail: Toward omnichannel retailing. Int. J. Electron. Commer. 2014, 18, 5–16. [Google Scholar] [CrossRef]
- Rigby, D. The future of shopping. Harv. Bus. Rev. 2011, 89, 65–76. [Google Scholar]
- Beck, N.; Rygl, D. Categorization of multiple channel retailing in Multi-, Cross-, and Omni-Channel Retailing for retailers and retailing. J. Retail. Consum. Serv. 2015, 27, 170–178. [Google Scholar] [CrossRef]
- Fairchild, A.M. Extending the network: Defining product delivery partnering preferences for Omni-channel commerce. Procedia Technol. 2014, 16, 447–451. [Google Scholar] [CrossRef]
- Piecyk, M.I.; McKinnon, A.C. Forecasting the Carbon Footprint of Road Transportation in 2020. Int. J. Prod. Econ. 2010, 128, 31–42. [Google Scholar] [CrossRef]
- Gevaers, R.; Van de Voorde, E.; Vanelslander, T. Characteristics and Typology of Last-Mile Logistics from an Innovative Perspective in an Urban Context. In Proceedings of the Transportation Research Board Annual Meeting, Washington, DC, USA, 25 January 2011. [Google Scholar]
- Bell, D.R.; Gallino, S.; Moreno, A. How to win in an Omni-channel world. MIT Sloan Manag. Rev. 2014, 56, 45–55. [Google Scholar]
- Hübner, A.; Holzapfel, A.; Kuhn, H. Operations management in multi-channel retailing: An exploratory study. Oper. Manag. Res. 2015, 8, 84–100. [Google Scholar] [CrossRef]
- Metters, R.; Walton, S. Strategic supply chain choices for multi-channel Internet retailers. Serv. Bus. 2007, 1, 317–331. [Google Scholar] [CrossRef]
- Verhoef, P.C.; Kannan, P.K.; Inman, J.J. From multi-channel retailing to Omni-channel retailing: Introduction to the special issue on multi-channel retailing. J. Retail. 2015, 91, 174–181. [Google Scholar] [CrossRef]
- Agatz, N.A.; Fleischmann, M.; Van Nunen, J.A. E-fulfillment and multi-channel distribution—A review. Eur. J. Oper. Res. 2008, 187, 339–356. [Google Scholar] [CrossRef]
- Edwards, J.B.; McKinnon, A.C.; Cullinane, S.L. Comparative analysis of the carbon footprints of conventional and online retailing: A “last mile” perspective. Int. J. Phys. Distrib. Logist. Manag. 2010, 40, 103–123. [Google Scholar] [CrossRef]
- Brown, J.R.; Guiffrida, A.L. Carbon emissions comparison of last mile delivery versus customer pickup. Int. J. Logist. Res. Appl. 2014, 17, 503–521. [Google Scholar] [CrossRef]
- Hübner, A.; Kuhn, H.; Wollenburg, J. Last mile fulfilment and distribution in Omni-channel grocery retailing: A strategic planning framework. Int. J. Retail Distrib. Manag. 2016, 44, 228–247. [Google Scholar] [CrossRef]
- Siikavirta, H.; Punakivi, M.; Karkkainen, M.; Linnanen, L. Effects of E-Commerce on Greenhouse Gas Emissions. J. Ind. Ecol. 2003, 6, 83–97. [Google Scholar] [CrossRef]
- Mangiaracina, R.; Perego, A.; Perotti, S.; Tumino, A. Assessing the environmental impact of logistics in online and offline B2C purchasing processes in the apparel industry. Int. J. Logist. Syst. Manag. 2016, 23, 98–124. [Google Scholar] [CrossRef]
- Colicchia, C.; Creazza, A.; Dallari, F.; Melacini, M. Eco-efficient supply chain networks: Development of a design framework and application to a real case study. Prod. Plan. Control 2016, 27, 157–168. [Google Scholar] [CrossRef]
- Tappia, E.; Marchet, G.; Melacini, M.; Perotti, S. Incorporating the environmental dimension in the assessment of automated warehouses. Prod. Plan. Control 2015, 26, 824–838. [Google Scholar] [CrossRef]
- MacKay, D.J.C. Sustainable Energy—Without the Hot Air, 1st ed.; UTI Cambridge: Cambridge, UK, 2009; ISBN 978-0-95-445293-3. [Google Scholar]
- DEFRA. Government Emission Conversion Factors for Greenhouse Gas Company Reporting, 2017. Available online: https://www.gov.uk/ (accessed on 4 December 2017).
- Lieb, K.J.; Lieb, R.C. Environmental sustainability in the third-party logistics (3PL) industry. Int. J. Phys. Distrib. Logist. Manag. 2010, 40, 524–533. [Google Scholar] [CrossRef]
- Colicchia, C.; Marchet, G.; Melacini, M.; Perotti, S. Building environmental sustainability: Empirical evidence from Logistics Service Providers. J. Clean. Prod. 2013, 59, 197–209. [Google Scholar] [CrossRef]
- Aronsson, H.; Huge-Brodin, M. The environmental impact of changing logistics structures. Int. J. Logist. Manag. 2006, 17, 394–415. [Google Scholar] [CrossRef]
- Kohn, C.; Huge-Brodin, M. Centralised distribution systems and the environment: How increased transport work can decrease the environmental impact of logistics. Int. J. Logist. Res. Appl. 2008, 11, 229–245. [Google Scholar] [CrossRef]
- Hovelaque, V.; Soler, L.G.; Hafsa, S. Supply chain organization and e-commerce: A model to analyze store-picking, warehouse-picking and drop-shipping. 4OR 2007, 5, 143–155. [Google Scholar] [CrossRef]
- Nahmias, M. Production and Operations Analysis, 4th ed.; McGraw-Hill: New York, NY, USA, 2011. [Google Scholar]
- Bendoly, E.; Blocher, D.; Bretthauer, K.M.; Venkataramanan, M.A. Service and cost benefits through clicks-and-mortar integration: Implications for the centralization/decentralization debate. Eur. J. Oper. Res. 2007, 180, 426–442. [Google Scholar] [CrossRef]
- Bretthauer, K.M.; Mahar, S.; Venakataramanan, M.A. Inventory and distribution strategies for retail/e-tail organizations. Comput. Ind. Eng. 2010, 58, 119–132. [Google Scholar] [CrossRef]
- Schneider, F.; Klabjan, D. Inventory control in multi-channel retail. Eur. J. Oper. Res. 2013, 227, 101–111. [Google Scholar] [CrossRef]
- Li, T.; Zhao, X.; Xie, J. Inventory management for dual sales channels with inventory-level-dependent demand. J. Oper. Res. Soc. 2015, 66, 488–499. [Google Scholar] [CrossRef]
- Agatz, N.A.; Campbell, A.; Fleischmann, M.; Savelsbergh, M. Time slot management in attended home delivery. Transp. Sci. 2011, 45, 435–449. [Google Scholar] [CrossRef] [Green Version]
- Boyer, K.K.; Prud’homme, A.M.; Chung, W. The last mile challenge: Evaluating the effects of customer density and delivery window patterns. J. Bus. Logist. 2009, 30, 185–201. [Google Scholar] [CrossRef]
- Stapleton, D.; Pati, S.; Beach, E.; Julmanichoti, P. Activity-based costing for logistics and marketing. Bus. Process Manag. J. 2004, 10, 584–597. [Google Scholar] [CrossRef]
- Goldsby, T.J.; Closs, D.J. Using activity-based costing to reengineer the reverse logistics channel. Int. J. Phys. Distrib. Logist. Manag. 2000, 30, 500–514. [Google Scholar] [CrossRef]
- ENEA (Agenzia nazionale per le nuove tecnologie, l’energia e lo sviluppo economico sostenibile). Indici di Benchmark di Consumo per Tipologie di Edificio ad uso Commercial Grande Distribuzione Applicabilità di Tecnologie Innovative nei Diversi Climi Italiani; ENEA: Roma, Italy, 2010; pp. 1–96. [Google Scholar]
- Tappia, E.; Roy, D.; de Koster, R.; Melacini, M. Modeling, Analysis, and Design Insights for Shuttle-Based Compact Storage Systems. Transp. Sci. 2017, 51, 269–295. [Google Scholar] [CrossRef]
Figure 1.
Three-phase methodology adopted in this study.

Figure 2.
Illustration of (a) a dedicated network; (b) an integrated warehouse network; and (c) integrated warehouse and transport network.
Figure 2.
Illustration of (a) a dedicated network; (b) an integrated warehouse network; and (c) integrated warehouse and transport network.
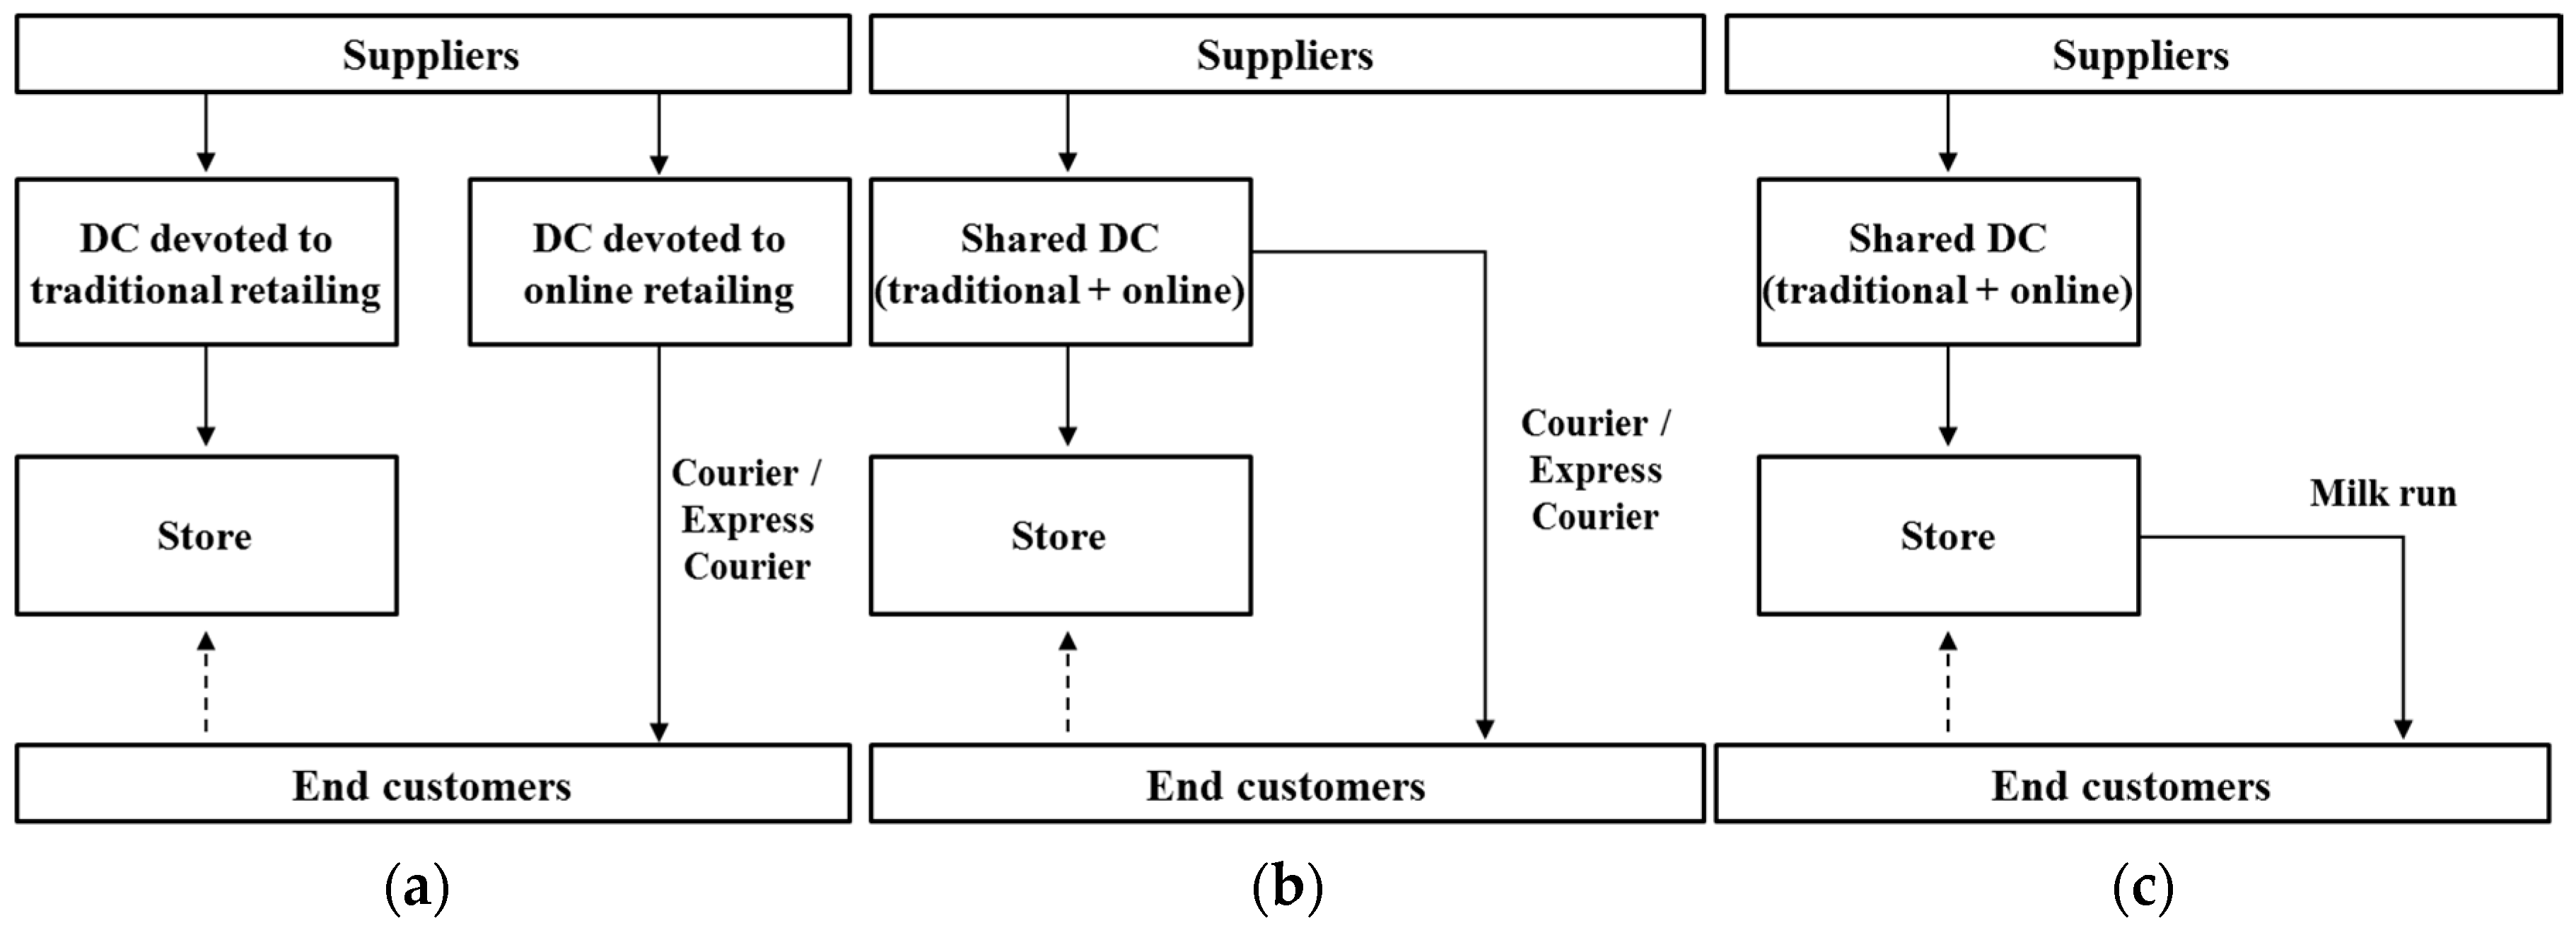
Figure 3.
Phases and activities identified within the model.
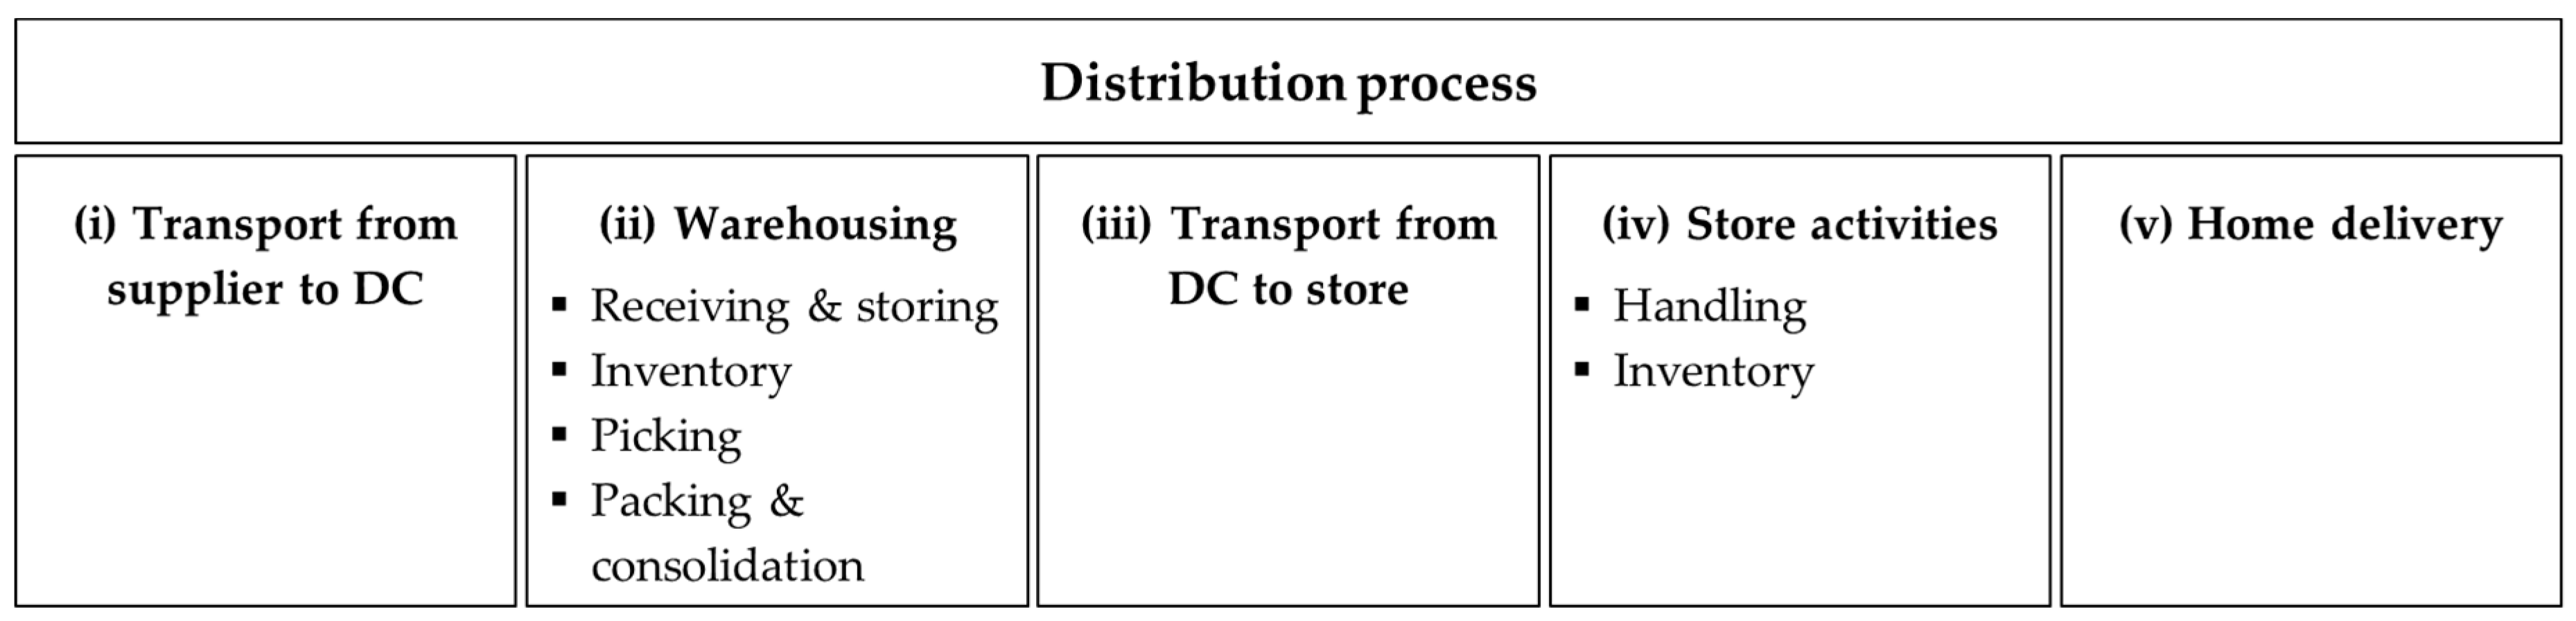
Figure 4.
Cost per order for each analysed distribution configuration.

Figure 5.
GHG emissions per order for each analysed distribution configuration.

Table 1.
Cost categories and drivers.
| Cost Category | Cost Driver | Unit of Measure |
|---|---|---|
| Demand profile | Average daily online demand | (orders/day) |
| Average daily traditional demand | (orders/day) | |
| Coefficient of variation of online demand | - | |
| Coefficient of variation of traditional demand | - | |
| Correlation coefficient between online and traditional demand | - | |
| Online order profile | Average number of lines per order | (lines/order) |
| Average number of units per order line | (units/line) | |
| Product profile | Average unit value | (€/unit) |
| Average unit volume | (m3/unit) | |
| Delivery profile | Courier fare | (€/order) |
| Delivery area | (km2) | |
| Time available in a day | (hours) | |
| Drop-off time (product delivery, payment) | (hours/order) | |
| Average transfer speed | (km/hour) | |
| Daily cost of a vehicle | (€/day) | |
| Inventory management | Review interval of DC | (days) |
| Service level (k) | - | |
| Inventory carrying cost on product value—DC (space, obsolescence, capital costs) | (%/year) | |
| Handling activities | Picking productivity | (lines/hour) |
| Packing productivity | (orders/hour) | |
| Hourly cost of picking activities (labour, equipment) | (€/hour) | |
| Hourly cost of packing activities (labour) | (€/hour) | |
| Handling cost | (€/pallet) | |
| Store profile | Shipment cost from DC to stores | (€/m3 km) |
| Average distance from DC to stores | (km) | |
| Handling productivity in-store | (orders/hour) | |
| Hourly cost of handling activities (labour) | (€/hour) | |
| Review interval of stores | (days) | |
| Inventory carrying cost on product value—store (space) | (%/year) | |
| Suppliers profile | Shipment cost from suppliers to DC | (€/m3 km) |
| Average distance from suppliers to DC | (km) | |
| Average lead time | (days) | |
| Average pallet volume | (m3/pallet) |
Table 2.
Analytical formulas for cost assessment.
| Activity | Expression |
|---|---|
| Transport from suppliers to DC | Shipment cost (€/m3 km) × Average distance Supplier-DC (km) × Average unit volume (m3/unit) × Average order line size (units/line) × Average order size (lines/order) |
| Warehousing—Receiving and storing | (Handling cost (€/pallet)/Average pallet volume (m3/pallet)) × Average unit volume (m3/unit) × Average order line size (units/line) × Average order size (lines/order) |
| Warehousing—Inventory | DC’s order quantity (units): 2 + Coefficient of variation of online demand/(Coefficient of variation of online demand + Coefficient of variation of traditional demand) × safety stock (units)) × Service level k × Average unit value (€/unit) × Inventory carrying cost (%/year) |
| Warehousing—Picking | ((1/Picking productivity (lines/hour)) × Cost of picking activities (€/hour)) × Average order size (lines/order) |
| Warehousing—Packing and consolidation | (1/Packing productivity (orders/hour)) × Cost of packing activities (€/hour) |
| Transport from DC to store | Shipment cost (€/m3 km) × Average distance DC-store (km) × Average unit volume (m3/unit) × Average order line size (units/line) × Average order size (lines/order) |
| Store activities—Handling | (1/Handling productivity (orders/hour)) × Cost of handling activities (€/hour) |
| Store activities—Inventory | Store’s order quantity (units): 2 × Average unit value (€/unit) × Inventory carrying cost (%/year) |
| Home delivery | Courier fare (Conf. 1); Vehicle cost (€/day): (Time available (hours/day)/(Drop-off time (hours/order) + (Average demand (orders/day): Delivery area (km2)): Average transfer speed (km/hour)) (Conf. 2, 3) |
Table 3.
GHG emissions categories and drivers.
| GHG Emission Category | GHG Emission Driver | Unit of Measure |
|---|---|---|
| Product profile | Average unit weight | (kg/unit) |
| Delivery profile | Retailer online demand to total courier hub flow ratio | (%) |
| Courier hub energy consumption | (kWh/m3 year) | |
| Average courier hub size | (m3) | |
| Average distance between DC and courier hub | (km) | |
| GHG emission generated from DC to courier hub | (kg CO2e/tonne km) | |
| GHG emission generated from courier hub/store to customer’s home | (kg CO2e/tonne km) | |
| Carbon emission generated in the courier hub | (kg CO2/kWh) | |
| Inventory management and handling activities | DC energy consumption for good storage | (kWh/year) |
| Carbon emission generated for good storage and handling in the DC | (kg CO2/kWh) | |
| Store profile | Store energy consumption | (kWh/year) |
| Carbon emission generated in store | (kg CO2/kWh) | |
| Suppliers profile | GHG emission generated from suppliers to DC | (kg CO2e/tonne km) |
Table 4.
Analytical formulas for GHG emission assessment.
| Activity | Expression |
|---|---|
| Transport from suppliers to DC | GHG emission (kg CO2e/tonne km) × Average distance suppliers-DC (km) × Order weight (tonnes/order) |
| Warehousing | GHG emission (kg CO2/kWh) × DC energy consumption (kWh/year) × Online to offline demand ratio (%): Annual online demand (orders/year) |
| Transport from DC to store | GHG emission (kg CO2e/tonne km) × Average distance DC-store (km) × Order weight (tonnes/order) |
| Store activities | GHG emission (kg CO2/kWh) × Store energy consumption (kWh/year) × Online to offline demand ratio (%): Annual online demand (orders/year) |
| Home delivery | GHG emission (kg CO2e/tonne km) × Average distance DC-courier hub (km) × Order weight (tonnes/order) + GHG emission (kg CO2/kWh) × Courier hub energy consumption (kWh/m3 year) × Average courier hub size (m3) × Retailer online demand to total courier hub flow ratio: Annual online demand (orders/year) + GHG emission (kg CO2e/tonne km) × Average distance per customer in a tour (km) × Order weight (tonnes/order) (Conf. 1, 2); GHG emission (kg CO2e/tonne km) × Average distance per customer in a tour (km) × Order weight (tonnes/order) (Conf. 3) |
Table 5.
Values of cost drivers used in the analysis.
| Cost Category | Cost Driver | Value | Unit of Measure |
|---|---|---|---|
| Demand profile | Average daily online demand | 330 | (orders/day) |
| Average daily traditional demand | 6300 | (orders/day) | |
| Coefficient of variation of online demand | 2 | - | |
| Coefficient of variation of traditional demand | 1 | - | |
| Correlation coefficient between online and traditional demand | −0.5 | - | |
| Online order profile | Average number of lines per order | 1.2 | (lines/order) |
| Average number of units per order line | 1 | (units/line) | |
| Product profile | Average unit price | 300 | (€/unit) |
| Average unit volume | 0.035 | (m3/unit) | |
| Delivery profile | Courier fare | 8 | (€/order) |
| Delivery area | 20 | (km2) | |
| Time available in a day | 8 | (hours) | |
| Drop-off time (product delivery, payment) | 0.25 | (h) | |
| Average transfer speed | 15 | (km/hour) | |
| Daily cost of a vehicle | 150 | (€/day) | |
| Inventory management | Review interval of DC | 10 | (days) |
| Service level | 98 | (%) | |
| Inventory carrying cost on product value—DC (space, obsolescence, capital costs) | 25 (Conf. 1); 20 (Conf. 2, 3) | (%/year) | |
| Handling activities | Picking productivity | 50 (Conf. 1); 45 (Conf. 2, 3) | (lines/hour) |
| Packing productivity | 30 | (orders/hour) | |
| Hourly cost of picking activities (labour, equipment) | 20 | (€/hour) | |
| Hourly cost of packing activities (labour) | 18 | (€/hour) | |
| Handling cost | 1 (Conf. 1); 0.5 (Conf. 2, 3) | (€/pallet) | |
| Store profile | Shipment cost from DC to stores | 0.07 | (€/m3 km) |
| Average distance from DC to stores | 150 | (km) | |
| Handling productivity in-store | 20 | (orders/hour) | |
| Hourly cost of handling activities (labour) | 21 | (€/hour) | |
| Review interval of stores | 1 | (days) | |
| Inventory carrying cost on product value—store (space) | 20 | (%/year) | |
| Suppliers profile | Shipment cost from suppliers to DC | 0.2 (Conf. 1); 0.1 (Conf. 2, 3) | (€/m3 km) |
| Average distance from suppliers to DC | 100 | (km) | |
| Average pallet volume | 0.8 (Conf. 1); 1.152 (Conf. 2, 3) | (m3/pallet) | |
| Average lead time | 3 | (days) |
Table 6.
Values of GHG emission drivers used in the analysis.
| Cost Category | Cost Driver | Value | Unit of Measure |
|---|---|---|---|
| Product profile | Average unit weight | 10 | (kg/unit) |
| Delivery profile | Retailer online demand to total courier hub flow ratio | 5 | (%) |
| Courier hub energy consumption | 48.5 1 | (kWh/m3 year) | |
| Average courier hub size | 125,000 | (m3) | |
| Average distance between DC and courier hub | 50 | (km) | |
| GHG emission generated from DC to courier hub | 0.077 2 | (kg CO2e/tonne km) | |
| GHG emission generated from courier hub/store to customer’s home | 0.518 2 | (kg CO2e/tonne km) | |
| Inventory management and handling activities | DC energy consumption for good storage | 145,000 (Conf. 1); 130,000 (Conf. 2, 3) | (kWh/year) |
| CO2 emission generated for good storage and handling in the DC | 0.667 3 | (kg CO2/kWh) | |
| Store profile | Store energy consumption | 13,000 | (kWh/year) |
| CO2 emission generated in store | 0.667 3 | (kg CO2/kWh) | |
| Suppliers profile | GHG emission generated from suppliers to DC | 0.129 2 (Conf. 1); 0.077 2 (Conf. 2, 3) | (kg CO2e/tonne km) |
© 2018 by the authors. Licensee MDPI, Basel, Switzerland. This article is an open access article distributed under the terms and conditions of the Creative Commons Attribution (CC BY) license (http://creativecommons.org/licenses/by/4.0/).
Share and Cite
MDPI and ACS Style
Melacini, M.; Tappia, E. A Critical Comparison of Alternative Distribution Configurations in Omni-Channel Retailing in Terms of Cost and Greenhouse Gas Emissions. Sustainability 2018, 10, 307. https://doi.org/10.3390/su10020307
AMA Style
Melacini M, Tappia E. A Critical Comparison of Alternative Distribution Configurations in Omni-Channel Retailing in Terms of Cost and Greenhouse Gas Emissions. Sustainability. 2018; 10(2):307. https://doi.org/10.3390/su10020307
Chicago/Turabian StyleMelacini, Marco, and Elena Tappia. 2018. "A Critical Comparison of Alternative Distribution Configurations in Omni-Channel Retailing in Terms of Cost and Greenhouse Gas Emissions" Sustainability 10, no. 2: 307. https://doi.org/10.3390/su10020307
Note that from the first issue of 2016, this journal uses article numbers instead of page numbers. See further details here.