Air Pollution and Human Development in Europe: A New Index Using Principal Component Analysis


1
Department of Economics and Economic Policies, Bucharest University of Economic Studies, Romană Square 6, Bucharest 010374, Romania
2
Department of Accounting and Audit, Bucharest University of Economic Studies, Romană Square 6, Bucharest 010374, Romania
*
Author to whom correspondence should be addressed.
Sustainability 2018, 10(2), 312; https://doi.org/10.3390/su10020312
Submission received: 30 November 2017
/
Revised: 10 January 2018
/
Accepted: 15 January 2018
/
Published: 26 January 2018
(This article belongs to the Collection Risk Assessment and Management)
Abstract
:EU countries to measure human development incorporating the ambient PM2.5 concentration effect. Using a principal component analysis, we extract the information for 2010 and 2015 using the Real GDP/capita, the life expectancy at birth, tertiary educational attainment, ambient PM2.5 concentration, and the death rate due to exposure to ambient PM2.5 concentration for 29 European countries. This paper has two main results: it gives an overview about the relationship between human development and ambient PM2.5 concentration, and second, it provides a new quantitative measure, PHDI, which reshapes the concept of human development and the exposure to ambient PM2.5 concentration. Using rating classes, we defined thresholds for both HDI and PHDI values to group the countries in four categories. When comparing the migration matrix from 2010 to 2015 for HDI values, some countries improved the development indicator (Romania, Poland, Malta, Estonia, Cyprus), while no downgrades were observed. When comparing the transition matrix using the newly developed indicator, PHDI, the upgrades observed were for Denmark and Estonia, while some countries like Spain and Italy moved to a lower rating class due to ambient PM2.5 concentration.
1. Introduction
The air pollution effect on the various well-being indicators is the subject of many studies in economics and health. The negative impact of pollution on life expectancy, especially for people with low-income levels, is a common conclusion of most academic works in the field. For example, it was applied the regression discontinuity analysis to demonstrate the negative relationship between total suspended particulates and life expectancy in China [1]. According to Mannuci et al. [2], developing countries have a greater problem with exposure to ambient air pollution than developed countries. This is due to both the industrialization and urbanization processes that led to the formation of crowded metropolis centers. They synthesize several articles that converge to validate the following hypotheses: the inverse relationship between a country’s level of development and exposure to air pollution, the positive relationship between ambient PM2.5 concentration and mortality rate, and the positive relationship between the population’s poverty level and exposure to polluted air. The same positive relationship between ambient PM2.5 concentration and all-cause mortality is stronger for people with low socioeconomic status is demonstrated on a sample of nearly 61 million 65-year-olds of the US Medicare beneficiaries, followed for up to 13 consecutive years [3]. Daily concentrations of ambient PM2.5 were predicted by using an artificial neural network, and two-pollutant Cox proportional hazard models were used to analyze survival data. The authors show that there is no threshold for ambient PM2.5 concentration below which it does not affect mortality. This finding is similar to other studies [4,5]. Using a household air pollution exposure index [6], it was found that exposure to Suspended Particulate Matter (atmospheric particulate matter with no limit size) is negatively correlated both with level of income and with level of education. Other similar studies evaluate the relationship between exposure to ambient pollution and a variety of socioeconomic status [7,8,9].
Air pollution indicators are closely linked to sustainable human development. The most used indicator to classify countries according to the level of development is the Human Development Index (HDI). The ability of the HDI to reflect accurately the level of development and the need to integrate the environment into the HDI have been questioned for many years. As presented in [10], the author started from the HDI to elaborate four different composite indicators to reflect development. The four indicators have been built to correct the following the HDI’s deficiencies: the inappropriate treatment of the income differentials, the non-application of principles of diminishing returns, the equal weight of components, and the method of aggregation of these components into the final indicator. The country ranking was inherently affected by the HDI’s deficiencies. To calculate the weight of each component from data, he applied the principal components analysis and obtained two weighted indexes. The robustness of these indexes is tested by comparing them with the ranking of other ones. Using a similar approach, it was found that the HDI fails to capture the quality aspect of the health dimension [11]. The results of the principal component analysis have highlighted the following: measuring human progress through a composite index is quite relevant; the three dimensions of the concept, namely health, education and income, can be integrated into one relevant factor with equal weights. Neither in studies like [10] nor [11] suggest new components for the HDI. The author in [12] presented that the HDI in its structure does not correctly reflect the differences between countries in terms of the level of development. According to this research, new indicators that are completely different from HDI components are needed to correctly reflect development. Another researcher also recognized the complexity and the need to adjust the human development indicators [13]. The same opinion is also found in [14], which states that the measurement of human development should include aspects related to health effects, social and political rights, and education. In another study, the author applied a case-study method to demonstrate that integrating environmental indicators into HDI calculations can reduce its value [15]. In order to study if the HDI reflects air quality, the author in [16] selected three pollutants: carbon dioxide, oxides of nitrogen, and sulphur dioxide. He used data for 15 developed countries and 15 developing countries and concluded that the HDI is relevant for the quality of air for the developing countries, but it is not relevant for the developed ones. Based on both the HDI and the Environmental Performance Index in [17], a new indicator was proposed: the Environmental Human Development Index (EHDI). The author identified a positive relationship between the two indicators. Her paper provides a comparison between country rankings from the HDI and EHDI point of view. Based on Martha Nussbaum’s capabilities approach, Comim [18] presented that HDI could have a proactive perspective, be inter-temporal, and try to capture for example the use of natural resources for future growth. His work briefly presents the alternatives to HDI existing in the literature and suggests improvements for this composite indicator.
The aim of this paper is to calculate a new composite indicator for EU countries to measure human development by including the effects of ambient PM2.5 concentration. In order to capture the evolution of these two coordinates for our sample of countries, we will compare the results of 2010 with 2015 data. Having as a benchmark the HDI, we will focus on comparing the results with this indicator for both years, to reflect the importance of ambient PM2.5 concentration. Similar to HDI methodology, we establish rating classes for each country and observe the transition migration matrices in time for this new indicator, the Pollution Human Development Index (PHDI). The methodology and data used to calculate this indicator is described in Section 2. In Section 3, the main results are presented, while the Section 4 offers our conclusions.
2. Methodology
In this paper, we used an orthogonal linear transformation in order to transform the data into a new coordinate system that extract the variance of all variables used. Considering a random vector with the variance covariance matrix, there is a linear combination .
Using the information from , we can predict they using linear regression. The variance of is while the covariance is given by . The first principal component is the linear combination that has maximum variance among all combinations. We then select the vector in order to maximize the variance, subject to constraint that the sum of squared coefficients is equal to one, . In order to find the coefficients we are going first to calculate the eigenvalues of the variance-covariance matrix . Considering the the eigenvalues of the variance-covariance matrix, they are ordered so that fulfils the condition . The variance for the ith principal component is equal to the ith eigenvalue: . Since we calculate more than one principal component, when we establish the first selected ones, we have to make sure that most of the variation is explained by those, and we do have a possible interpretation for the coefficients of eigenvalues.
Using principal component analysis, we want to extract the information related to ambient PM2.5 concentration and human development. In order to capture the impact of ambient PM2.5 concentration in life expectancy, we took data for 2010 and 2015 for the following variables:
- Life expectancy at birth is defined as the mean number of years still to be lived by a person at birth, if subjected throughout the rest of his or her life to the current mortality conditions [19];
- Tertiary educational attainment is defined as the percentage of the population aged 30–34 who have successfully completed tertiary studies (e.g., university, higher technical institution, etc.). This educational attainment refers to ISCED (International Standard Classification of Education) 2011 level 5–8 for data from 2014 onwards and to ISCED 1997 level 5–6 for data up to 2013. The indicator is based on the EU Labour Force Survey [19];
- Real GDP/capita: chain linked volumes (2010), euro per capita [19];
- Ambient PM2.5 concentration (micrograms/m3): particulate matter less than or equal to 2.5 µm (micrometres) in aerodynamic diameter and is measured in units of micrograms per cubic meter (µg/m3). The measurement of the air quality is based on observations from satellites combined with information from global chemical transport models and available ground measurements. The values are estimated using blocks or grid cells covering 0.1° × 0.1° of longitude and latitude (approximately 11 km × 11 km at the equator). Considering the population in each block within a country, the aggregated values are used to estimate the exposure concentrations to national-level population-weighted averages for a specific year [20].
- Death rate due to exposure to ambient PM2.5 concentration: the death rate is calculated as the ratio of deaths to the population (number of people) of a particular area during a particular period. It is calculated in the number of deaths per 100,000 people per year. The Institute for Health Metrics and Evaluation (IHME) Global Burden of Disease (GBD) project used more than 2000 researchers to track death and disability and the role of environmental risk factors for more than 300 diseases and injuries in 195 different countries and territories from 1990 to the present [20].
The information is gathered for the following 29 EU countries: Austria, Belgium, Bulgaria, Croatia, Cyprus, Czech Republic, Denmark, Estonia, Finland, France, Germany, Greece, Hungary, Ireland, Italy, Latvia, Lithuania, Luxembourg, Malta, Netherlands, Norway, Poland, Portugal, Romania, Slovakia, Slovenia, Spain, Sweden, and the United Kingdom.
3. Results
3.1. Estimation of PHDI
Once we established the input variables, one of the objectives of this paper is to calculate the composite indicator for 2010 and 2015. The first step was to observe a correlation among the variables and for 2010 (bold values in Table 1), the correlation matrix indicates that the concentration of this particular matter is negatively correlated with life expectancy by 65% and death rate 91% while positively correlated with education, 34% and Real GDP/capita 63%. We can observe the same trend also for 2015 (italic values in Table 1) but while the correlation with education slightly decreased to 26.55%, the correlation with death rate increased up to 94%. The life expectancy is negatively correlated with ambient PM2.5 concentration for both samples, but in 2015, it can be notice that the correlation increased.
The health impact from air pollution has been estimated using different methodologies. In the 2017 report from Air Quality in Europe [21], it is shown that in the 41 countries analyzed, 428,000 premature deaths are attributed to PM2.5 exposure, 78,000 premature deaths are attributed to NO2, and 14,400 premature deaths to O3 exposure. In the EU-28, the premature deaths attributed to PM2.5, NO2, and O3 exposure are 399,000, 75,000, and 13,600, respectively. The years of life lost (YLL) are defined as the years of potential life lost owing to premature death. This indicator is an estimate of the average number of years that a person would have lived if he or she had not died prematurely. YLL takes into account the age at which deaths occur and is greater for deaths at a younger age and lower for deaths at an older age. It gives, therefore, more smoothed information than the number of premature deaths alone. When ranking YLL attributable to PM2.5 exposure/105 inhabitants for our sample of countries we can notice that in 2014 the lowest relative impacts are found in the countries at the northern and north-western parts of Europe: Iceland, Norway, Ireland, Sweden, and Finland. The countries with highest impact are the ones in the central Eastern Europe (Figure 1).
The next step was to divide the countries in two subsample: countries with life expectancy higher than the EU average and the ones with life expectancy is lower than the average (Table 2). It can be observed that countries with higher life expectancy do have in average a higher attainment at tertiary educational; the real GDP per capita is higher while the pollution and the death rate are lower. When comparing the differences between 2010 and 2015 there is a significant shift in the death rate for countries with life expectancy lower than the average from 52.6 to 47.6, while for the rest of the countries, the death rate is more or less constant, around 20%.
In order to calculate a composite indicator for development and to include ambient PM2.5 concentration, we conducted a principal component analysis for both years. The first step was to standardize the data and then to extract the first principal component. We did this step, as the variables used for this analysis do not have the same metrics. The reason to choose the first component for both years was that the sign of coefficients for the eigenvectors are positive in terms of development, education and life expectancy while negative for ambient PM2.5 concentration and death rate due from this ambient. The first component explains 70% from the total variance of the variance of the used indicators and the coefficients are presented in Table 3.
Considering the signs of the coefficients, we can conclude that using the first component principal we developed a composite indicator (PHDI) that takes into account development and ambient PM2.5 concentration effects. Higher values of this composite indicator show that the country has a higher life expectancy, higher tertiary educational attainment, higher real GDP per capita, and lower values for ambient PM2.5 concentration and low death rates due to this ambient. When plotting the first principal component and life expectancy in 2010 (Figure 2), one can see two main groups of countries with positive values for the principal component and life expectancy higher than 78. Countries with negative values of the composite indicator are grouped in the left bottom of the figure, and these countries have in average life expectancy lower than 78.
When comparing life expectancy with the composite indicator in 2015 (Figure 3), some countries moved to the right, having higher life expectancy and higher values for the composite indicator. In the case of Italy, for instance, the composite indicator became negative even though Italy has a higher life expectancy in 2015. In addition, it is observable that the gap between countries lowered, and there is a catching up process in place.
3.2. Evolution of HDI Indicator in Europe
In order to test how robust is the indicator we compare it with the HDI indicator for 2010 and 2015 [22]. The first step was to compare the changes that happened in the last five years in the ranking according to HDI. The countries analyzed in this paper have in average a HDI value of 0.86 for 2010, while for 2015, it is 0.87. In order to have more granularity we grouped the countries in four rating categories: very high human development countries with HDI values above 0.900, High human development with values between 0.85 and 0.899, medium human development with values between 0.8–0.849, and low human development below 0.8. In Figure 4 we plot the HDI values from the two years analyzed and marked the rating classes: the green area is very high developed countries, yellow is high developed, orange is medium while the red area is allocated to low human developed countries. At a first glance, it can be noticed that for some countries the HDI values changed significantly in these five years, like Estonia, Bulgaria, Spain, Hungary, Latvia, or Poland. For other countries, the gap is quite small, and this is applicable to Cyprus, Romania, Luxemburg, and Greece.
One observation we can make at this point is that all the countries have higher HDI values in 2015 comparing with 2010. Since HDI and PHDI have in common the education, life expectancy and GDP it is important to observe the migrations among the rating classes in order to eliminate these shifts when adding the pollution effect. Having the rating classes for both years, we could compare the shifts in the transition between rating classes for the HDI. In Table 4, it can be observed that Romania moved from low to medium class, having an increase from 0.798 to 0.802. This is due mainly to an increase in life expectancy, but also because the threshold between medium and low is 0.8. The countries that migrated from medium to high rating class—Poland, Malta, Estonia, and Cyprus—encountered increases in HDI values due to education and life expectancy. If Poland, Malta, and Estonia recorded an annual average of HDI growth in 2010–2015 of 0.66%, Cyprus has the average annual growth of only 0.2%. The reason why Cyprus moved to the high rating class is that the edge of 0.85 for HDI was exceeded in 2015 comparing with the 2010, when it was below. Since we only have positive absolute differences in the HDI values from 2010 to 2015, we did not expect any downgrades in the rating transition matrix.
3.3. Ambient PM2.5 Concentration in Europe
Considering a similar grouping, we used the composite indicator that includes ambient PM2.5 concentration to obtain the rating classes for the countries. The classes are very high human development, with values above 1.5 for the first principal component, high human development, with values between 0.15–1.499, medium human development, with values between −3–0.1499, and low human development below −3. In order to define the rating classes for PHDI, we took into account the YLL as a measure of back testing (Figure 5). The first step was to rank the countries based on PHDI at 2010 and using the average of YLL in 2014, we establish the intervals in order to match the average of the YLL in 2014 also for PHDI in 2015. For example, the YLL in very high human development countries in 2010 is 442 years, while in 2015, it is 458.
If for HDI values we have noticed only upgrades, for this new human development indicator with pollution effect, there are also downgrades (Figure 6) i.e., Italy, Spain, Slovenia, Bulgaria, Belgium, and Germany.
Comparing the composite indicator from 2010 to 2015 (Table 5), the rating transition matrix indicates a couple of positive shifts for Denmark who moved from H to VH and Estonia that moved from Medium to High. When observing the variables for the upgrading ratings, Denmark has an increase of six basis points in education and a decrease in death rate due to pollution with two basis points. The Real GDP/capita and life expectancy also increased in the last past five years. Estonia is another example how the pollution effect improved the composite indicator: the average of ambient PM2.5 concentration for the countries in the medium rating class in 2015 is 20 micrograms/m3, while Estonia has reached a level of 9 micrograms/ m3. The life expectancy increased by two years, and the fact that real GDP/capita increased as well led it to move to the next rating class.
The downgrades are from very high to the rating class high for Spain, while Italy moved from high to medium class. Spain has moved from very high because even though the life expectancy increased, the real GDP/capita slightly decreased, and the education factor decreased by two basis points. The pollution concentration remained constantly, while the death rate due to pollution slightly decreased, and is it can be observed in Figure 6 that the values for this new composite indicator are quite close to the border of 1.5. Italy is an example where the pollution effect was the main reason of downgrading from high to medium rating class. The pollution concentration increased from 15 to 20 micrograms/m3, and the death rate increased by three basis points. Even though the education level increased, the composite indicator is negative in 2015.
3.4. Evolution of Ambient PM2.5 Concentration and Human Development in Europe
Now that we had an overview of the transition due to the human development component and exposure to ambient PM2.5 concentration, we asked ourselves how the transition between these two metrics is and the results are presented in Table 6. The United Kingdom, Netherlands, and Germany are declassified due to the ambient PM2.5 concentration component, as the death rate in these countries due to ambient PM2.5 concentration is around 23% and the concentration has been constant. Even though all the other three components improved, the values are not high enough to counteract the ambient PM2.5 concentration effect. In a study proposed by [11], Germany and the UK are declassified when using an environment index comparing with HDI values at 2014, while France should be upgraded. The following three countries have left the high rating class to be rated as very high according to our composite indicator: France, Luxembourg, and Finland. The latter one has the lowest value of ambient PM2.5 concentration from these 29 countries analyzed, and the death rate is decreasing. Luxemburg managed to decrease the death rate by two basis points, and France realized a constant rate of death and ambient PM2.5 concentration. These countries were identified in [17] as being ranked higher when using an environmental human development index instead of HDI.
The main reason why five countries moved from high to medium class is the high values of ambient PM2.5 concentration, and Italy is the only country where the death rate increased by three basis points. Portugal left the medium rating class for a high classification mainly due to a one basis point reduction in death rate and a constant medium level of ambient PM2.5 concentration. Romania, on the other hand, should be classified as having a low rating considering that ambient PM2.5 concentration is constantly high, and its death rate, even though it decreased, is the second biggest in Europe.
If the PHDI is positive which means the effect of ambient PM2.5 concentration is negative, the HDI value will increase. If the ambient PM2.5 concentration effects are higher, the indicator is negative, decreasing the HDI values. If we adjust the HDI values from 2015 with a 1% impact from the ambient PM2.5 concentration, we can observe (in Table 7) that some of countries do not keep the same ranking. The countries that upgraded the rank are marked in green while the countries that downgrade in ranking is observed are marked in red. One is Germany that has an ambient PM2.5 concentration of 14 micrograms/m3 compared with Denmark, which has 11 micrograms/m3, and the death rate is two basis points lower than that of Germany. Finland has an ambient PM2.5 concentration of 7 micrograms/m3, compared with 16 micrograms/m3 value that Belgium reached in 2015. When it comes to death rate, Belgium has 25 percent, in comparison with 14 percent for Finland. In 2015, in Portugal, the ambient PM2.5 concentration was 10 micrograms/m3, while in Slovakia, it was double, at 21 micrograms/m3. The death ratio is 46 in the latter country, while Portugal has only 17 percent.
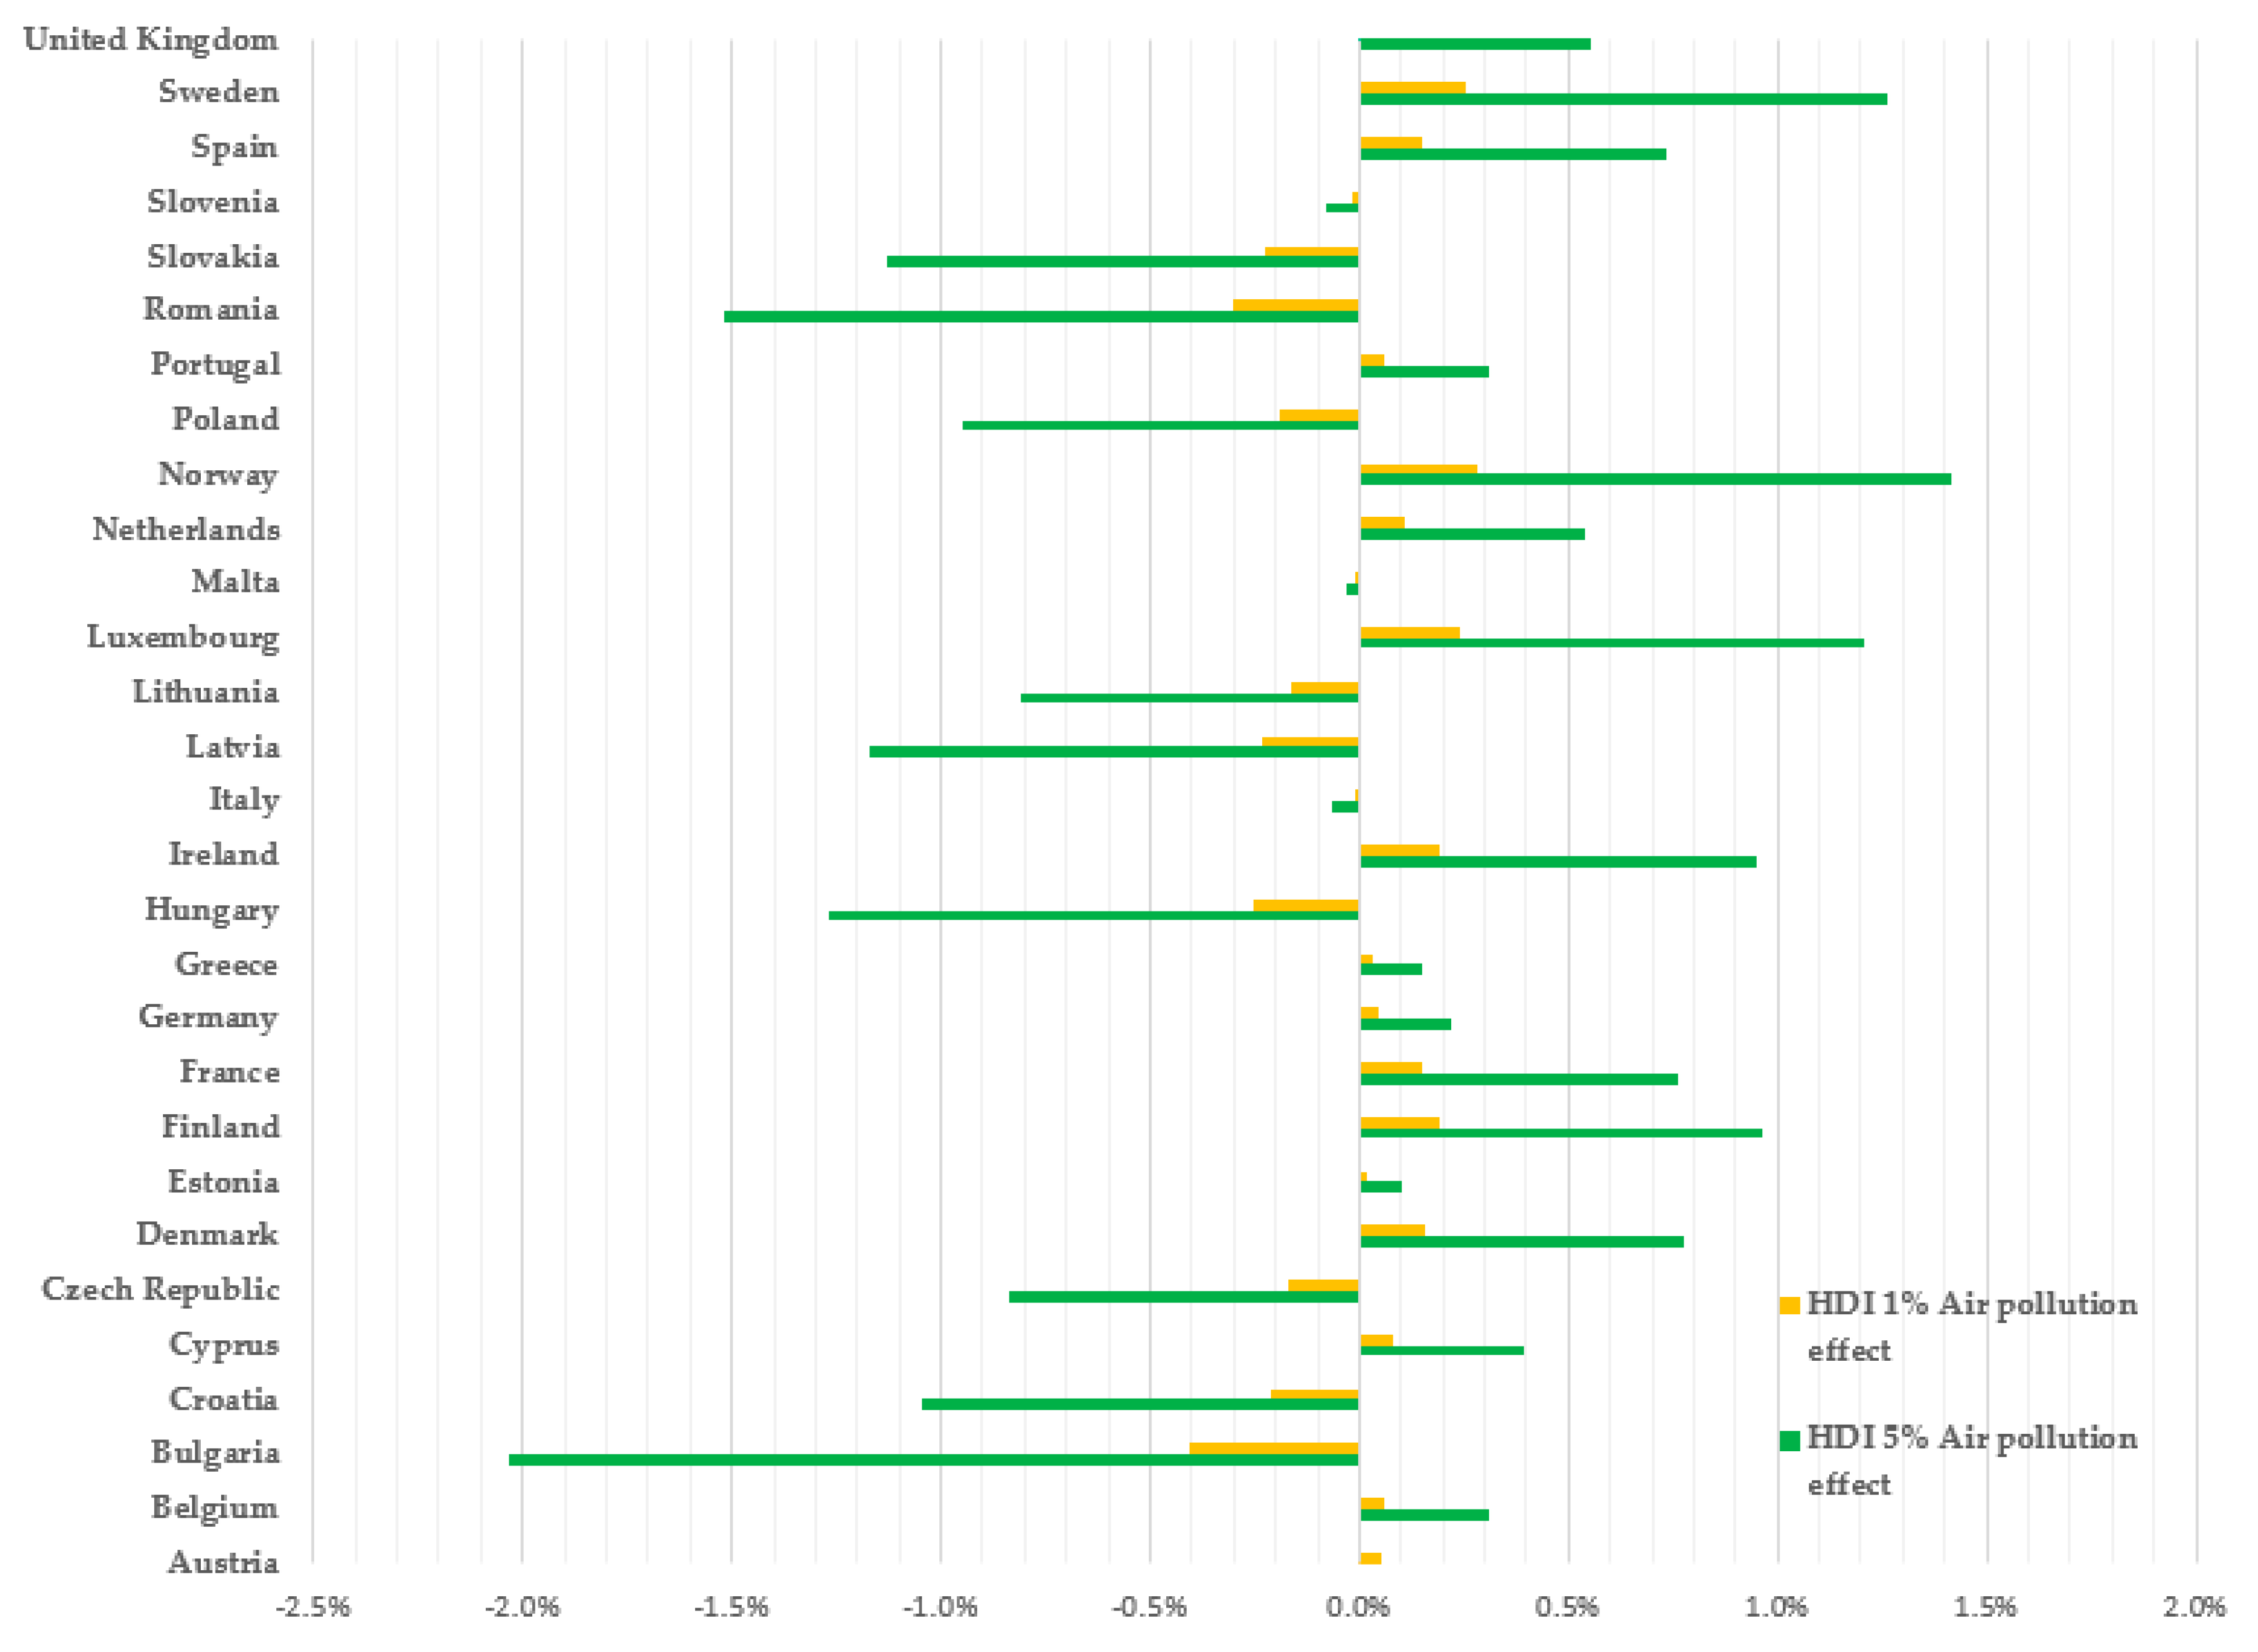
Changing the impact of ambient PM2.5 concentration from 1% to 5%, we have noticed that for some countries, like Norway, the HDI value increased as the life quality improved (Figure 7). For the countries where ambient PM2.5 concentration has a bigger impact, the HDI values decreases, and Bulgaria, Romania, and Hungary are the most affected.
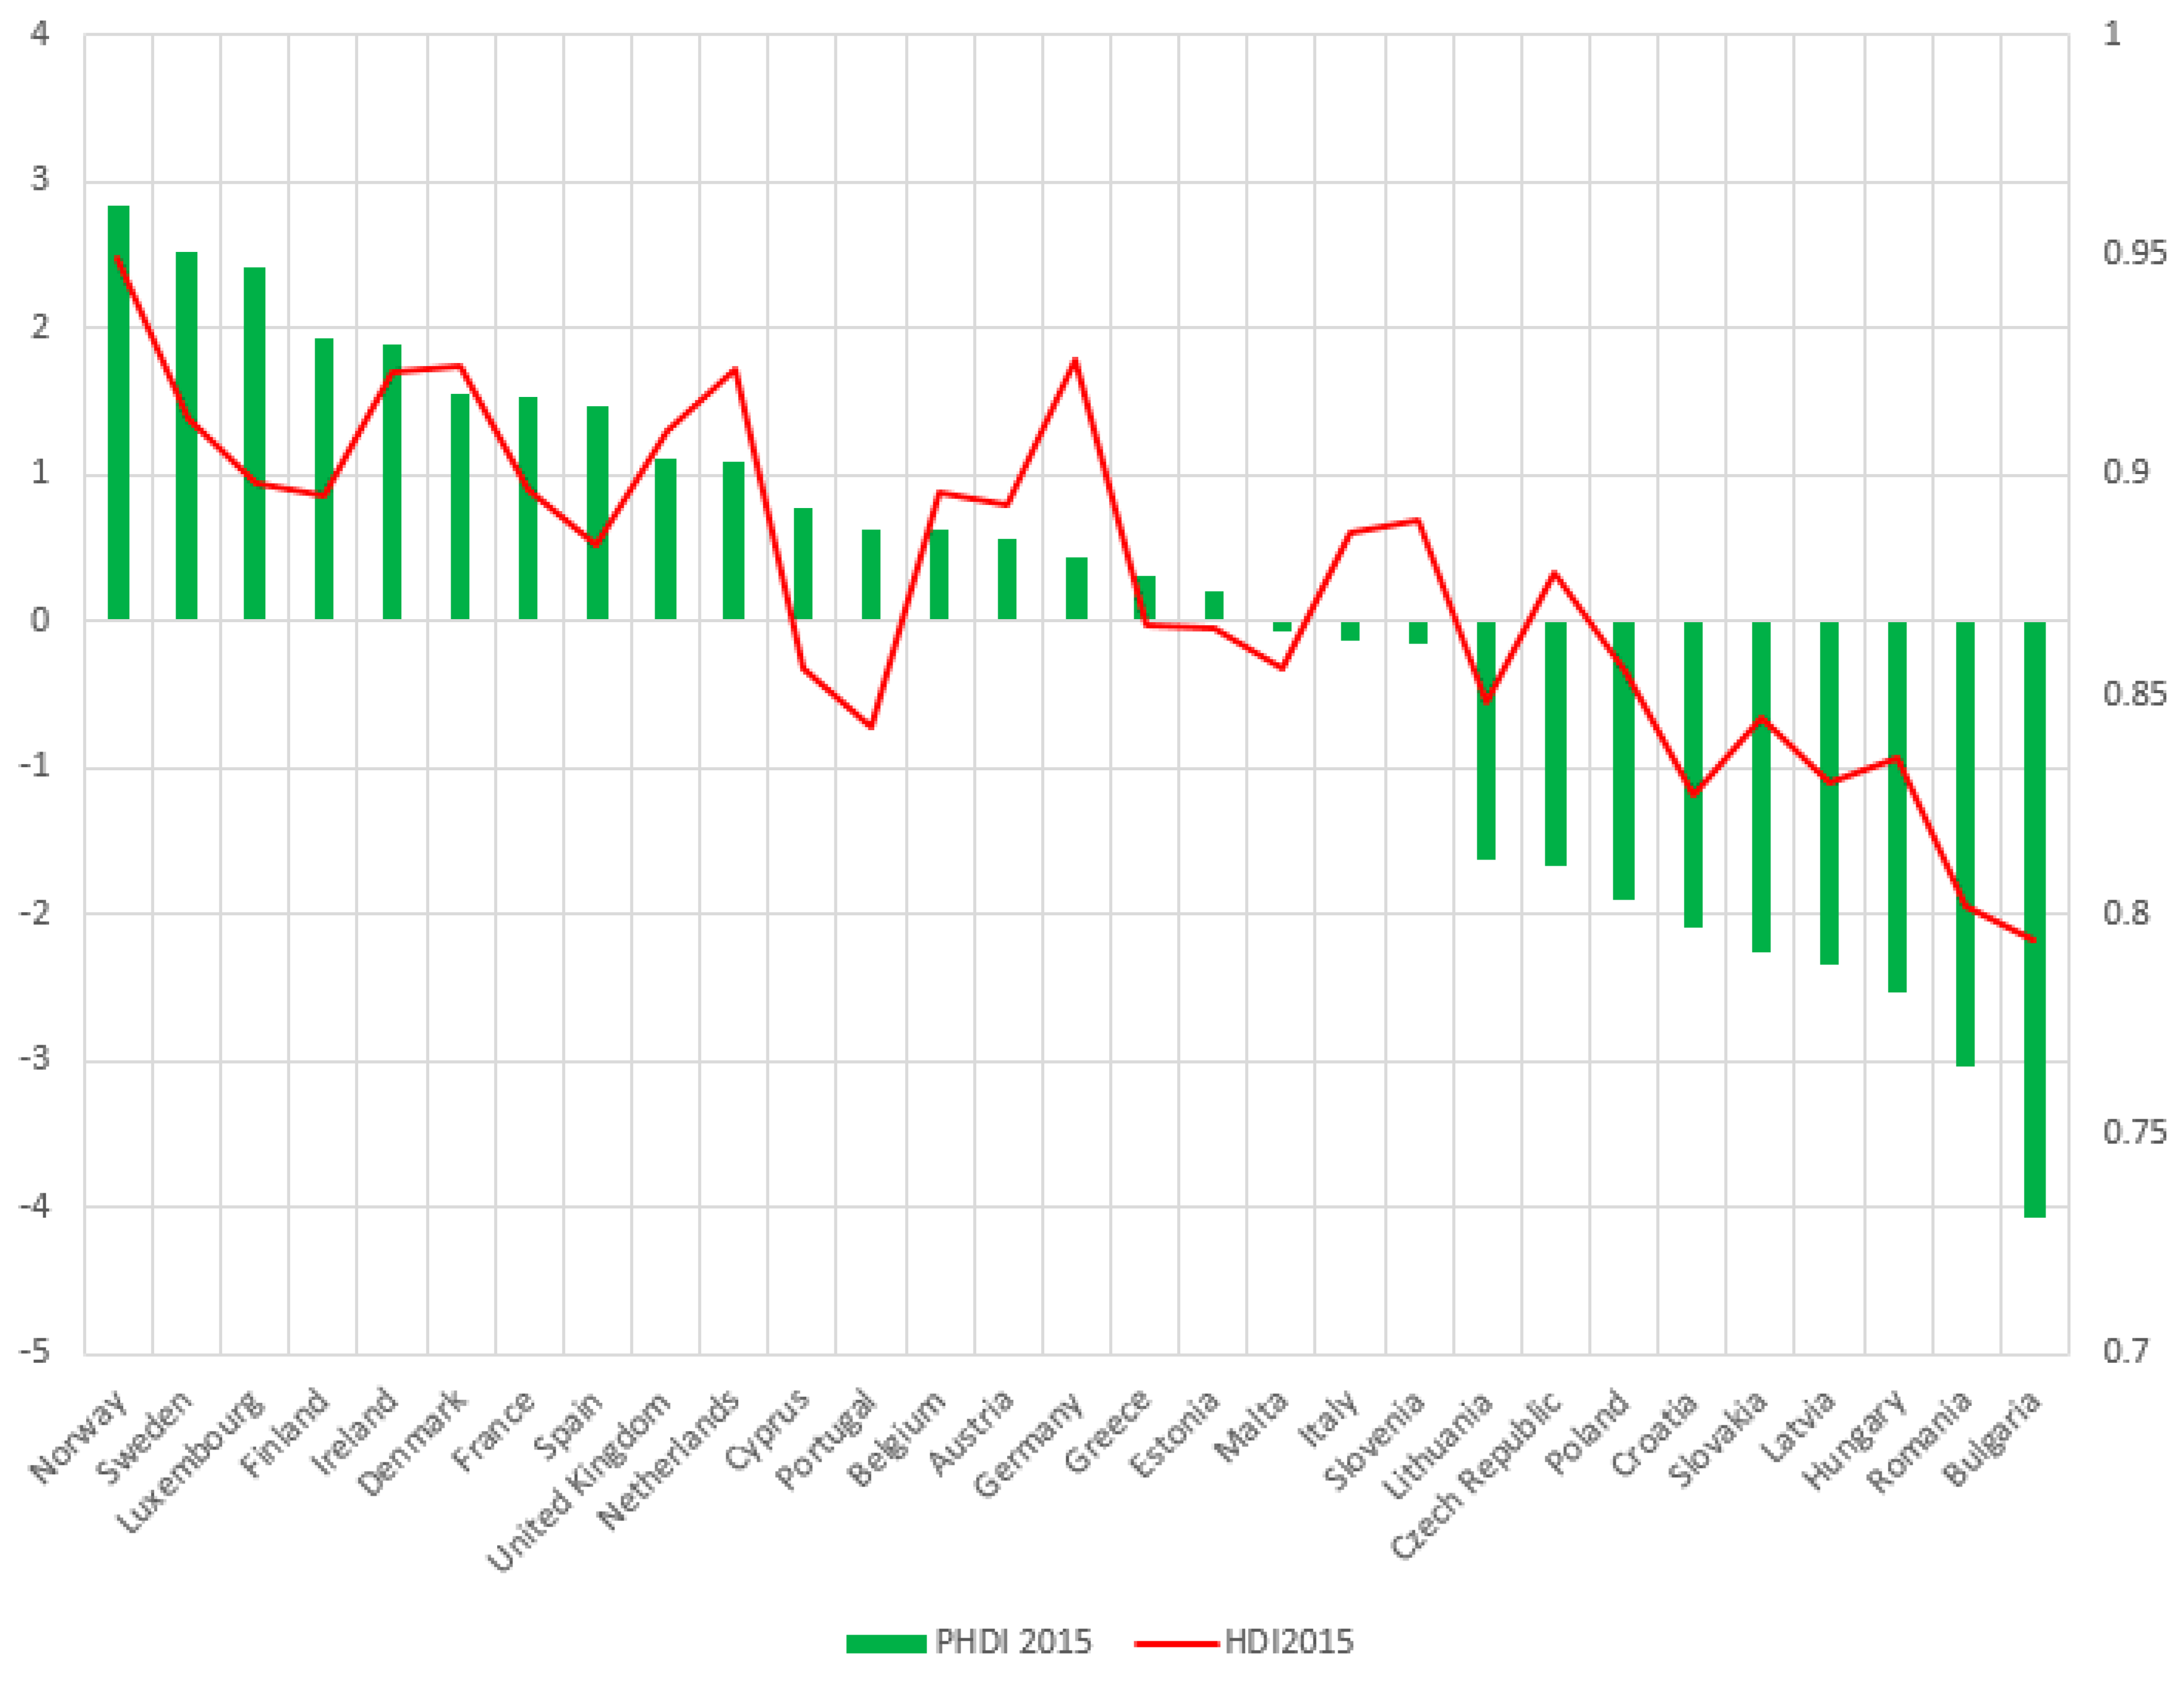
When plotting the descending values of PHDI 2015 (ranking the countries from very high values to the smallest values of the indicator), it can be observed that the HDI 2015 value curve is not fitted to the evolution of our indicator, and all the shifts in the ranking of the countries are due to exposure to ambient PM2.5 concentration (Figure 8).
4. Conclusions
Our work is a part of the debate on the enlargement of the HDI in order to better reflect the multiple faces of development and well-being concepts. In its elaboration, we started from the conclusions of the reference literature on the relationship between life expectancy, GDP per capita, level of education, ambient PM2.5 concentration, and death rate due to exposure to ambient PM2.5 concentration. We validated the signs of causal relationships identified by the previous papers on the example of EU member states for the years 2010 and 2015. As these indicators affect development, we studied the literature on the quality of the human development indicator. We found that many scientific articles criticized HDI for both neglecting important aspects such as the environment and methodological deficiencies, such as the use of equal weights in determining the composite indicator. Therefore, our objective was to compute a composite indicator for development that includes ambient PM2.5 concentration using the principal component analysis. This method corrects the problem of equal weights because the weight of an indicator results empirically from data. Other development researchers, such as [10,11], also used this methodology. The new indicator responds to the need to identify new components for quantifying human development [12,16,17]. A high value of our calculated indicator reflects a higher level of development. We tested the robustness of this benchmark for the years 2010 and 2015 by comparing it with the HDI for the same period. The first step was to establish some rating classes to cluster the countries based on HDI values. Then, we identified the rating migrations among countries using HDI values, and since these values increased during the period 2010–2015, we only noticed upgrades. Using YLL as a forward looking method for estimating the pollution effect, we extracted the thresholds for the rating classes for the newly calculated PHDI. The transition matrix captured the pollution effect by notifying the upgrades and the downgrades of the countries. The upgrades recorded by Denmark and Estonia are confirmed by [21], where it is mentioned that in 2015 Estonia, Finland, Ireland, Norway, and Sweden did not report any exceedance of the limit value set by EU legislation for ambient PM2.5 concentration. Using an environmental HDI in [17], it is presented that for 2012, Denmark should have one rank higher when compared with HDI value, while Estonia, on the other hand, should be ranked two places lower. The higher concentration of ambient PM2.5 is reflected by YLL in 2014, and we expect that transitions in the matrix calculated using PHDI from 2010 to 2015 to be captured as such. In order to test if the upgrades and downgrades make sense, we calculated the YLL averages for each rating class according to PHDI. The VH has an average of 423, while H and M have 724 and 1078 years, respectively. Denmark in 2014 has 672 YLL due to ambient PM2.5 concentration [19]. Therefore, the shift in VH in 2015 is plausible. Spain, on the other hand, with 553 YLL, was not part of the VH countries in 2015 and shifted to the high rating class. Estonia has 605 YLL in 2014 and therefore does not belong to the medium class in 2015 and shifted to high. Italy, on other hand, with a record of 1024 YLL in 2014, moved to the medium rating class. Finally, we developed new HDI indicator ranking using the ambient PM2.5 concentration impact, and we demonstrated that some of countries do not keep the same ranking if we take into consideration the effect of pollution. Our study is consistent with earlier research in this aspect [15,17]. The higher the impact of pollution in HDI values, the higher the impact the pollution has on ranking.
From a methodological point of view, the indicator developed in this paper does not isolate all of the HDI deficiencies. For example, the inequality of income distribution. In addition, two indicators only reflect the quality of the environment, but the results are significant. In the future, we aim to extend the analysis by testing and integrating other relevant indicators while preserving the balance between comprehensiveness and accuracy.
Author Contributions
All authors contributed to the development of the idea. Ana Maria Săndică participated in all phases. Monica Dudian conducted the literature review. Aurelia Ştefănescu performed the data collection and the paper editing. All authors read and approved the final manuscript.
Conflicts of Interest
The authors declare no conflict of interest.
References
- Chen, Y.; Ebenstein, A.; Greenstone, M.; Hongbin, L. Evidence on the Impact of Sustained Exposure to Air Pollution on Life Expectancy from China’s Huai River Policy. Proc. Natl. Acad. Sci. USA 2013, 32, 12936–12941. [Google Scholar] [CrossRef] [PubMed]
- Mannucci, P.M.; Franchini, M. Health Effects of Ambient Air Pollutin in Developing Countries. Int. J. Environ. Res. Public Health 2017, 9, 1048. [Google Scholar] [CrossRef] [PubMed]
- Di, Q.; Wang, Y.; Zanobetti, A.; Wang, Y.; Koutrakis, P.; Choirat, C.; Dominici, F.; Schwartz, J.D. Air Pollution and Mortality in the Medicare Population. N. Engl. J. Med. 2017, 26, 2513–2522. [Google Scholar] [CrossRef] [PubMed]
- Shi, L.; Zanobetti, A.; Kloog, I.; Coull, B.A.; Koutrakis, P.; Melly, S.J.; Schwartz, J.D. Low concentration PM2.5 and mortality: Estimating acute and chronic effects in a population-based study. Environ. Health Perspect. 2016, 124, 46–52. [Google Scholar] [CrossRef] [PubMed]
- Schwartz, J.; Coull, B.; Laden, F.; Ryan, L. The effect of dose and timing of dose on the association between airborne particles and survival. Environ. Health Perspect. 2008, 116, 64–69. [Google Scholar] [CrossRef] [PubMed] [Green Version]
- Kathuria, V.; Khan, N.A. Vulnerability to Air Pollution: Is There Any Inequity in Exposure? Econ. Polit. Wkly. 2007, 30, 3158–3165. [Google Scholar]
- Brajer, V.; Hall, J.V. Recent Evidence on the Distribution of Air Pollution Effects. Contemp. Econ. Policy 1992, 2, 63–71. [Google Scholar] [CrossRef]
- Villeneuve, P.J.; Burnett, R.T.; Shii, Y.; Krewski, D.; Goldberg, M.S.; Hertzman, C.; Chen, Y.; Brook, J. A time-series study of air pollution, socioeconomic status, and mortality in Vancouver, Canada. J. Expo. Anal. Environ. Epidemiol. 2003, 13, 427–435. [Google Scholar] [CrossRef] [PubMed]
- Jerrett, M.; Burnett, R.; Brook, J.; Kanaroglou, P.; Giovis, C.; Finkelstein, N.; Hutchison, B. Do socioeconomic characteristics modify the short-term association between air pollution and mortality? Evidence from a zonal time series in Hamilton, Canada. J. Epidemiol. Community Health 2004, 58, 31–40. [Google Scholar] [CrossRef] [PubMed]
- Noorbakhsh, F. The Human Development Index: Some Technical Issues and Alternative Indices. J. Int. Dev. 1998, 10, 589–605. [Google Scholar] [CrossRef]
- Dialga, I. L’Indice du Développement Humain ou L’indice Monétaire de Développement? Evidences par l’Analyse en Composantes Principales. 2016. Available online: https://hal.archives-ouvertes.fr/hal-01308724/document (accessed on 3 October 2017).
- McGillivray, M. The Human Development Index: Yet Another Redundant Composit Development Indicator? World Dev. 1991, 10, 1461–1468. [Google Scholar] [CrossRef]
- Sen, A. A Decade of Human Development. J. Hum. Dev. 2000, 1, 17–23. [Google Scholar] [CrossRef]
- Gürlük, S. Economic growth, industrial pollution and human development in the Mediterranean Region. Ecol. Econ. 2009, 69, 2327–2335. [Google Scholar] [CrossRef]
- Gamal El-Din, M.M. Human development index adjusted for environmental indicators: Case study in one Egyptian village. East. Mediterr. Health J. 2005, 5–6, 1124–1127. [Google Scholar] [CrossRef]
- Santra, S. Is Human Development Index (HDI) a Reflector of Quality of Air? A Comparative Study on Developed and Developing Countries. Int. J. Sci. Res. Pub. 2014, 2, 1–6. [Google Scholar]
- Maccari, N. Environmental Sustainability and Human Development: A Greening of Human Development Index. 2014. Available online: https://ssrn.com/abstract=2426073 (accessed on 20 November 2017).
- Comim, F. Beyond the HDI? Assessing Alternative Measures of Human Development from a Capability Perspective, 2016 UNDP Human Development Report Background Paper. Available online: http://hdr.undp.org/sites/default/files/comim_template_0.pdf (accessed on 10 September 2017).
- Eurostat Database. Available online: http://ec.europa.eu/eurostat/home (accessed on 1 September 2017).
- State of Global Air. Available online: https://www.stateofglobalair.org/data (accessed on 1 September 2017).
- Air Quality in Europe. Available online: https://www.eea.europa.eu/publications/air-quality-in-europe-2017 (accessed on 1 November 2017).
- Human Development Indicator. Available online: http://hdr.undp.org/ (accessed on 1 September 2017).
Figure 1.
Years of life lost due to ambient PM2.5 concentration in Europe, 2014 [21].
Figure 1.
Years of life lost due to ambient PM2.5 concentration in Europe, 2014 [21].
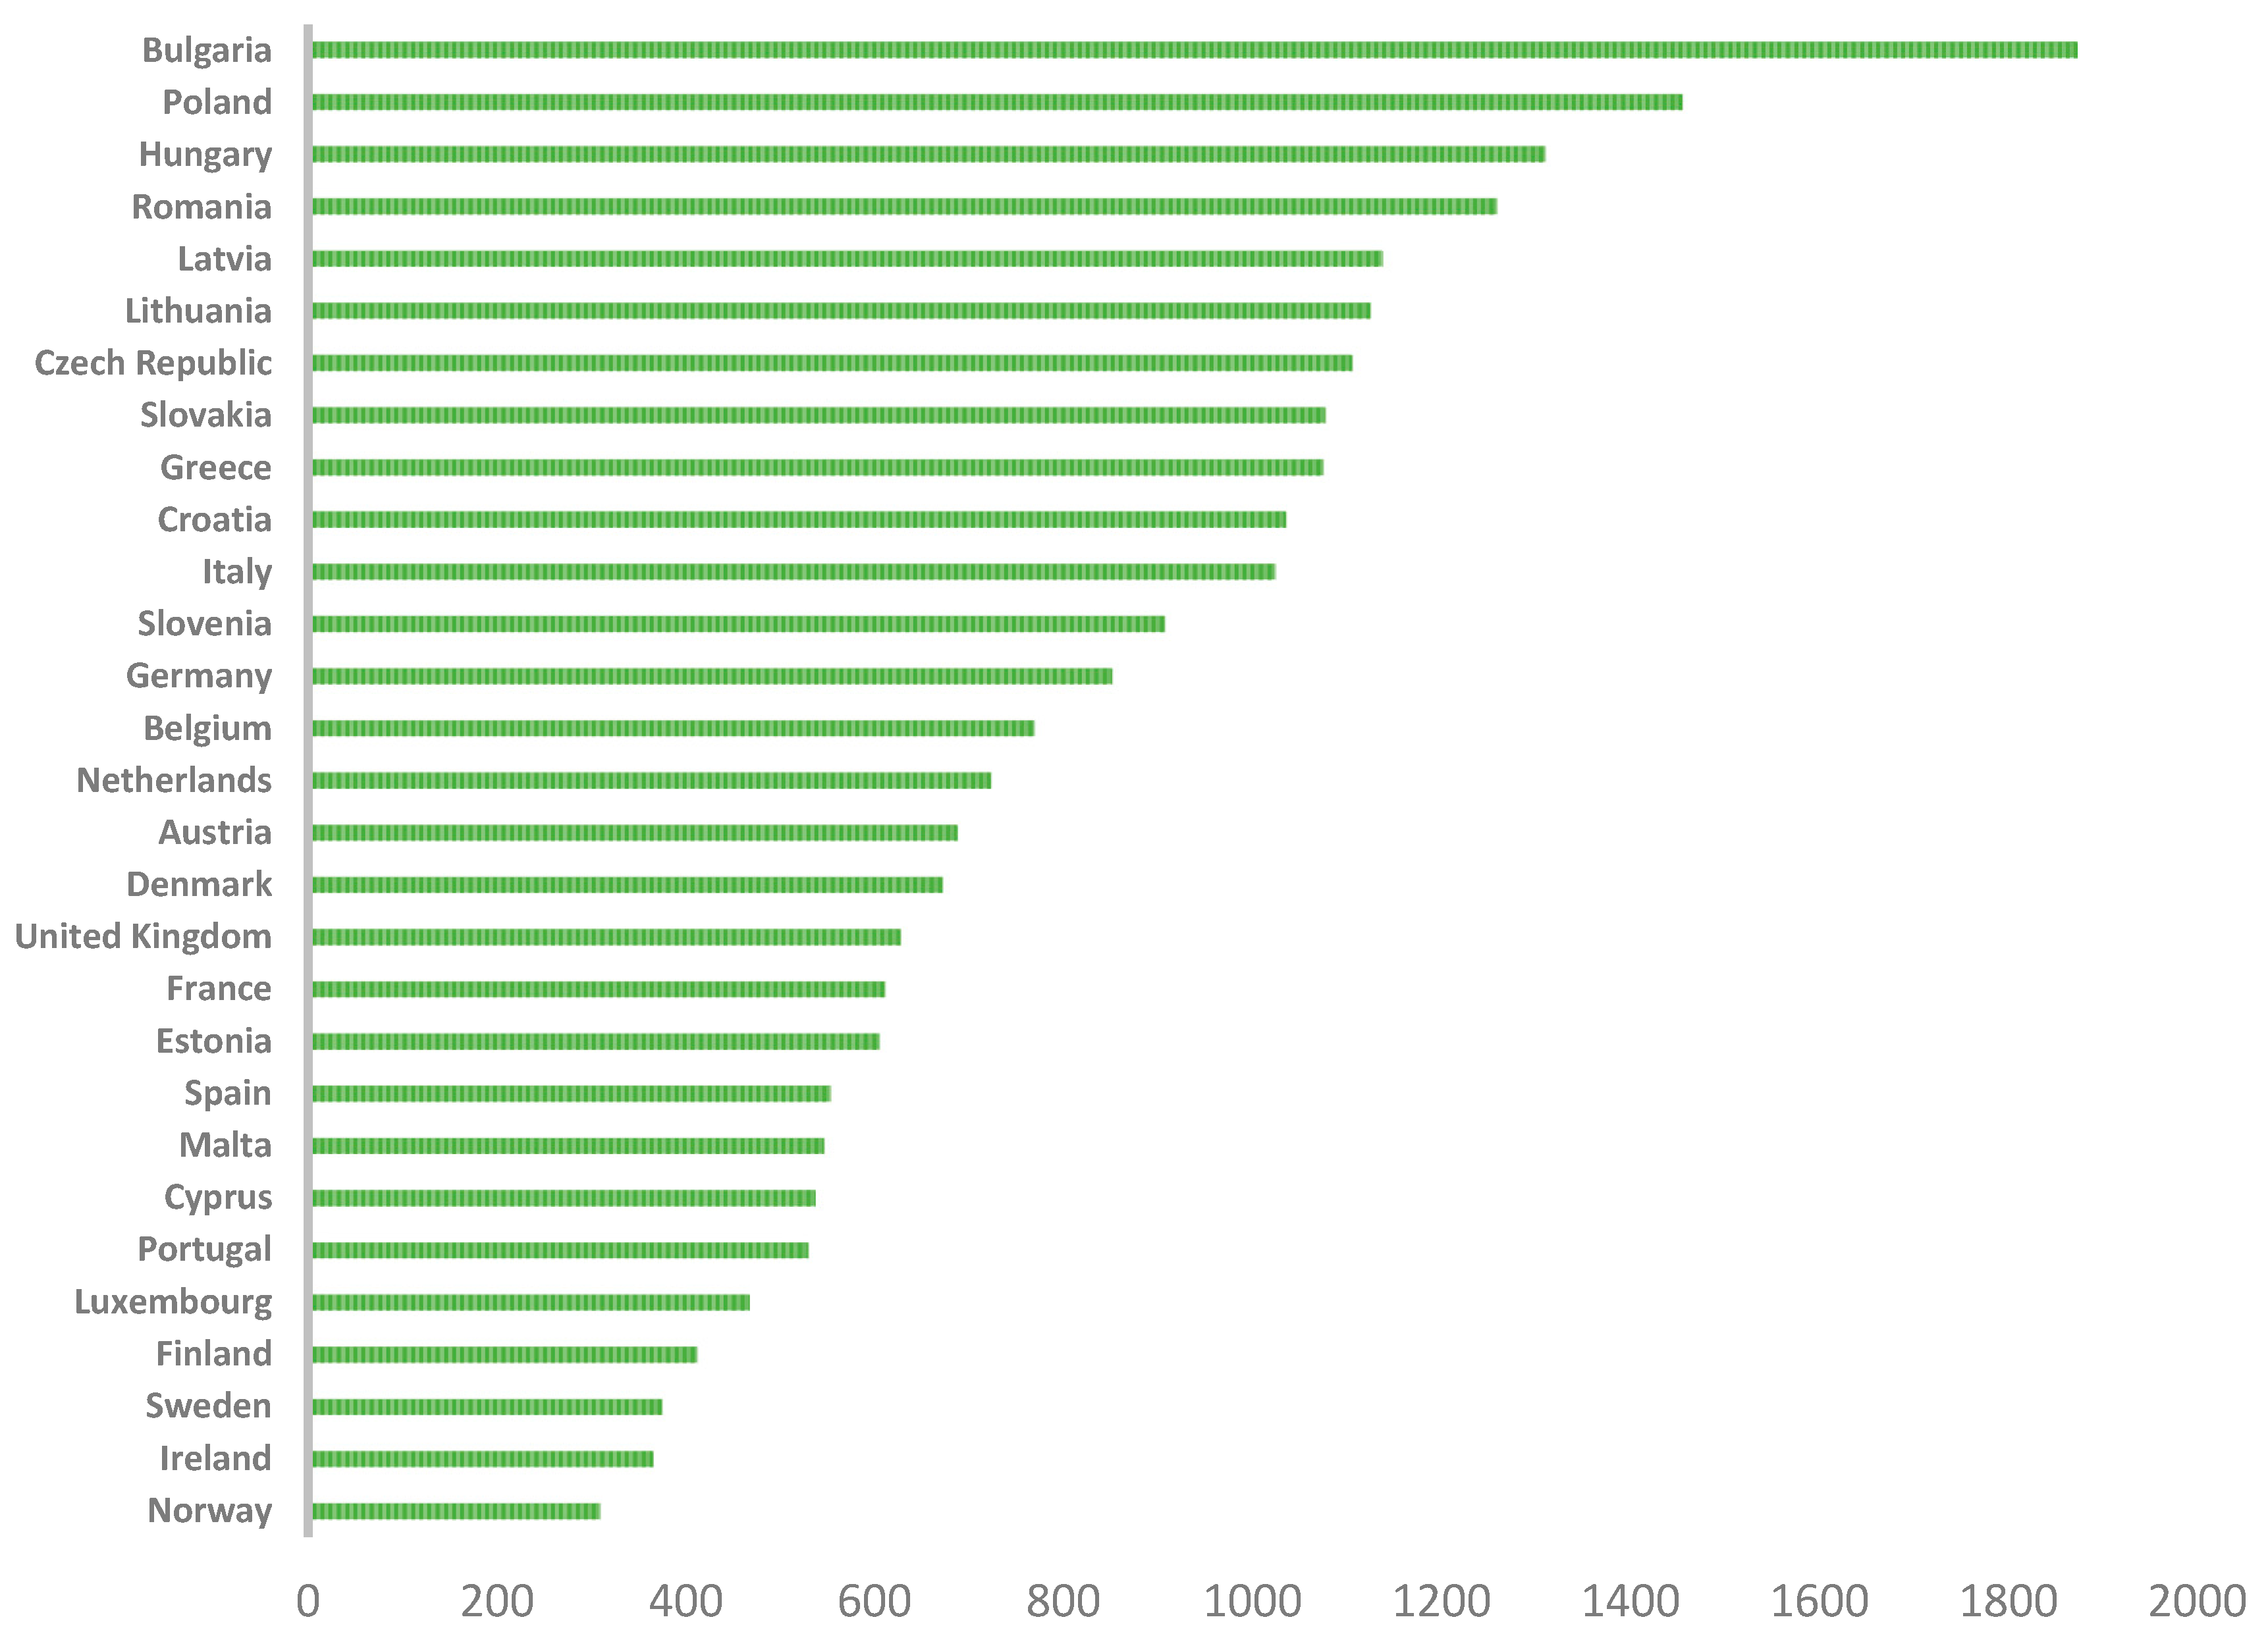
Figure 2.
Life expectancy and Pollution Human Development Index (PHDI) 2010. Source: Own mathematical calculations.
Figure 2.
Life expectancy and Pollution Human Development Index (PHDI) 2010. Source: Own mathematical calculations.
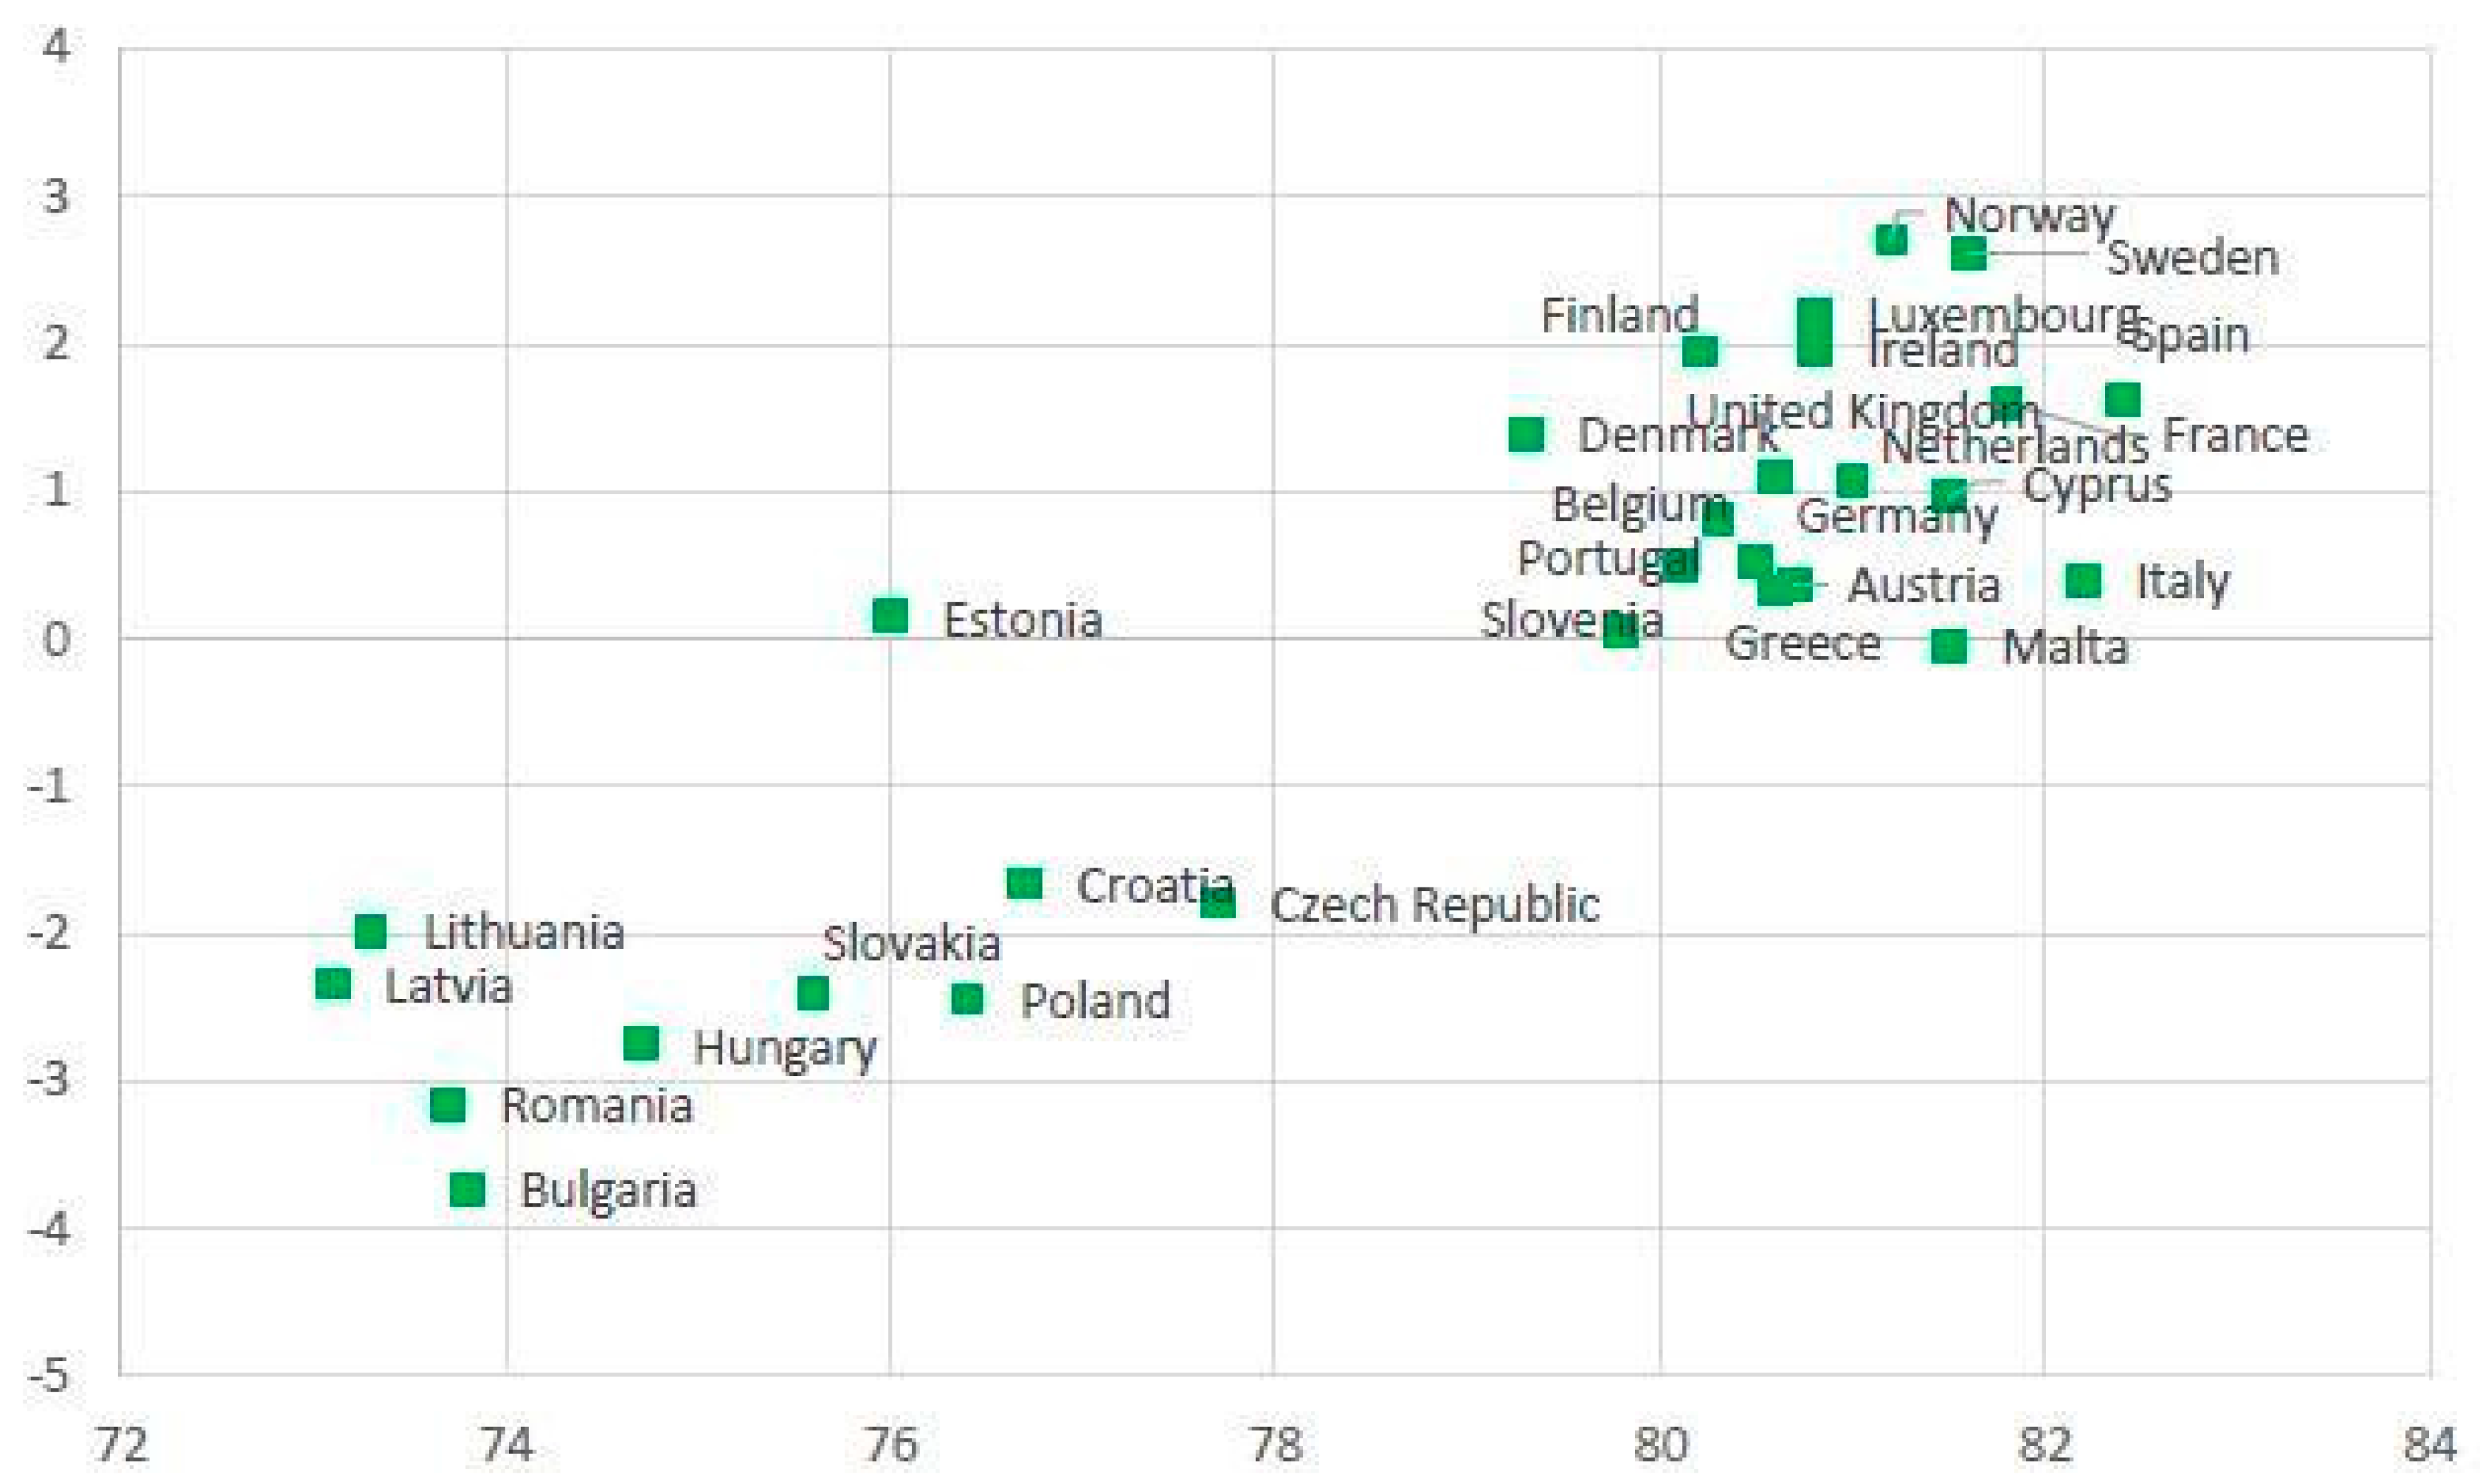
Figure 3.
Life expectancy and PHDI 2015. Source: Own mathematical calculations.
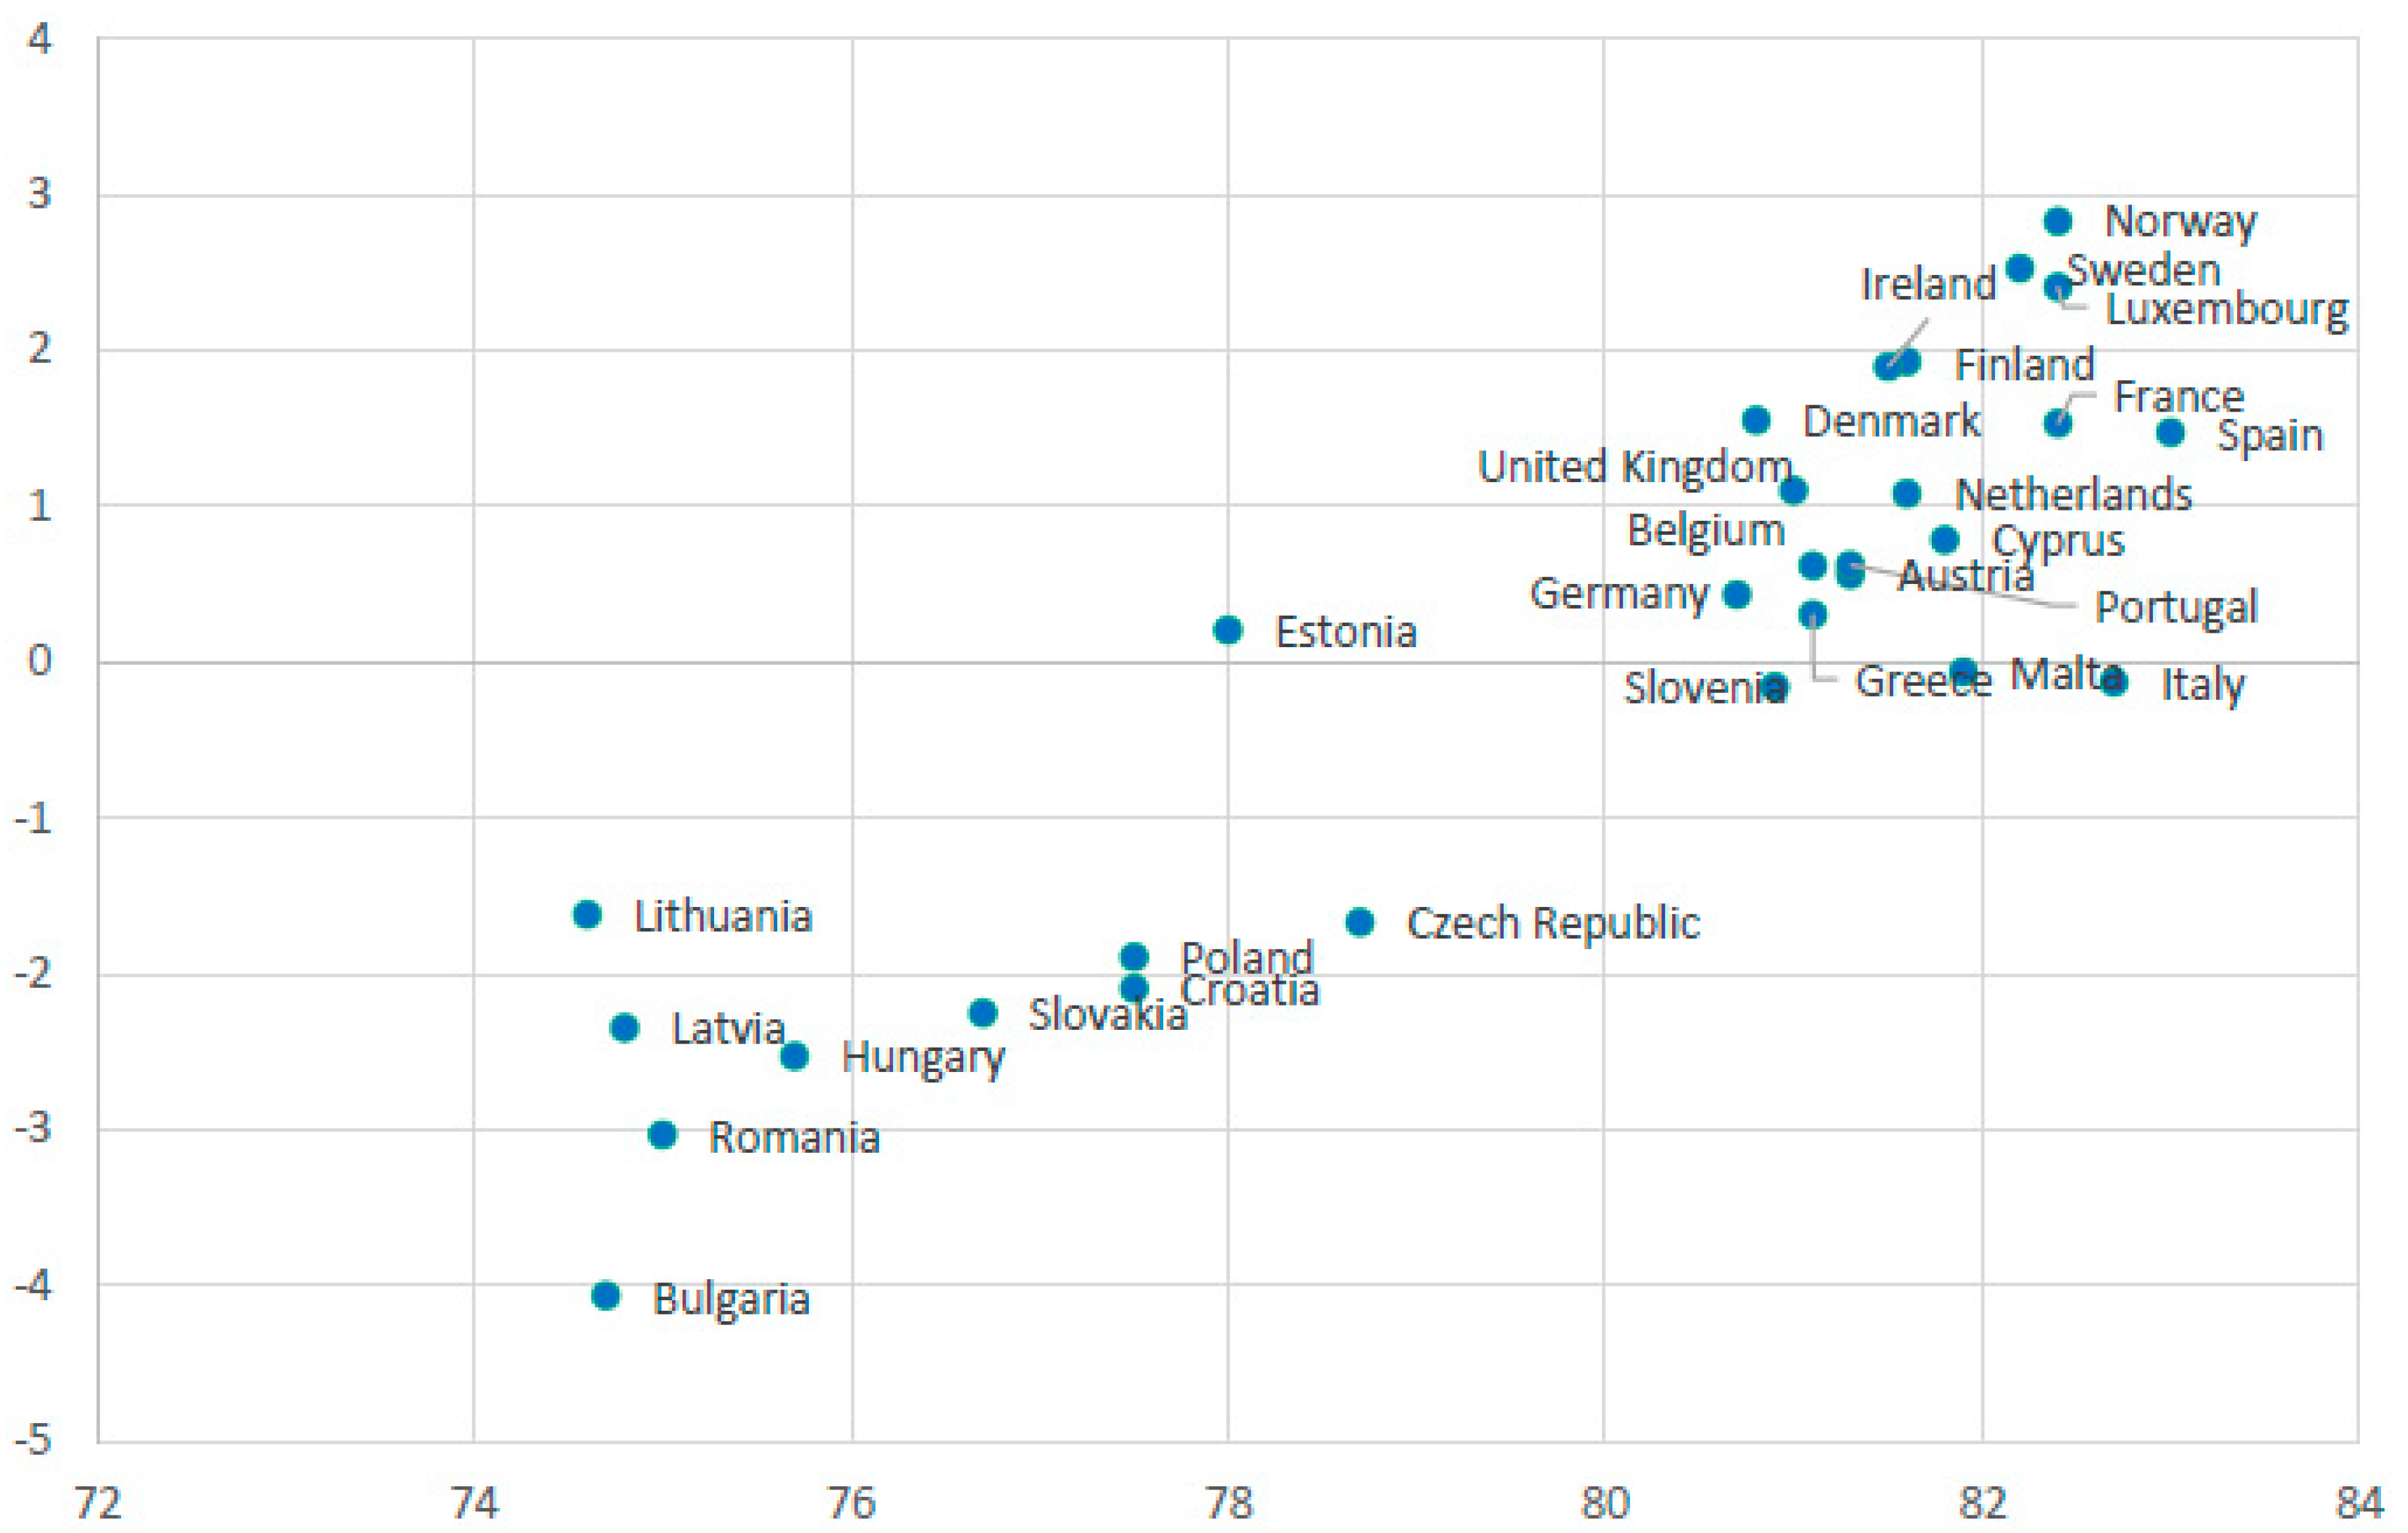
Figure 4.
Comparison of Human Development Index (HDI) values for 2010 and 2015. Source [22].
Figure 4.
Comparison of Human Development Index (HDI) values for 2010 and 2015. Source [22].
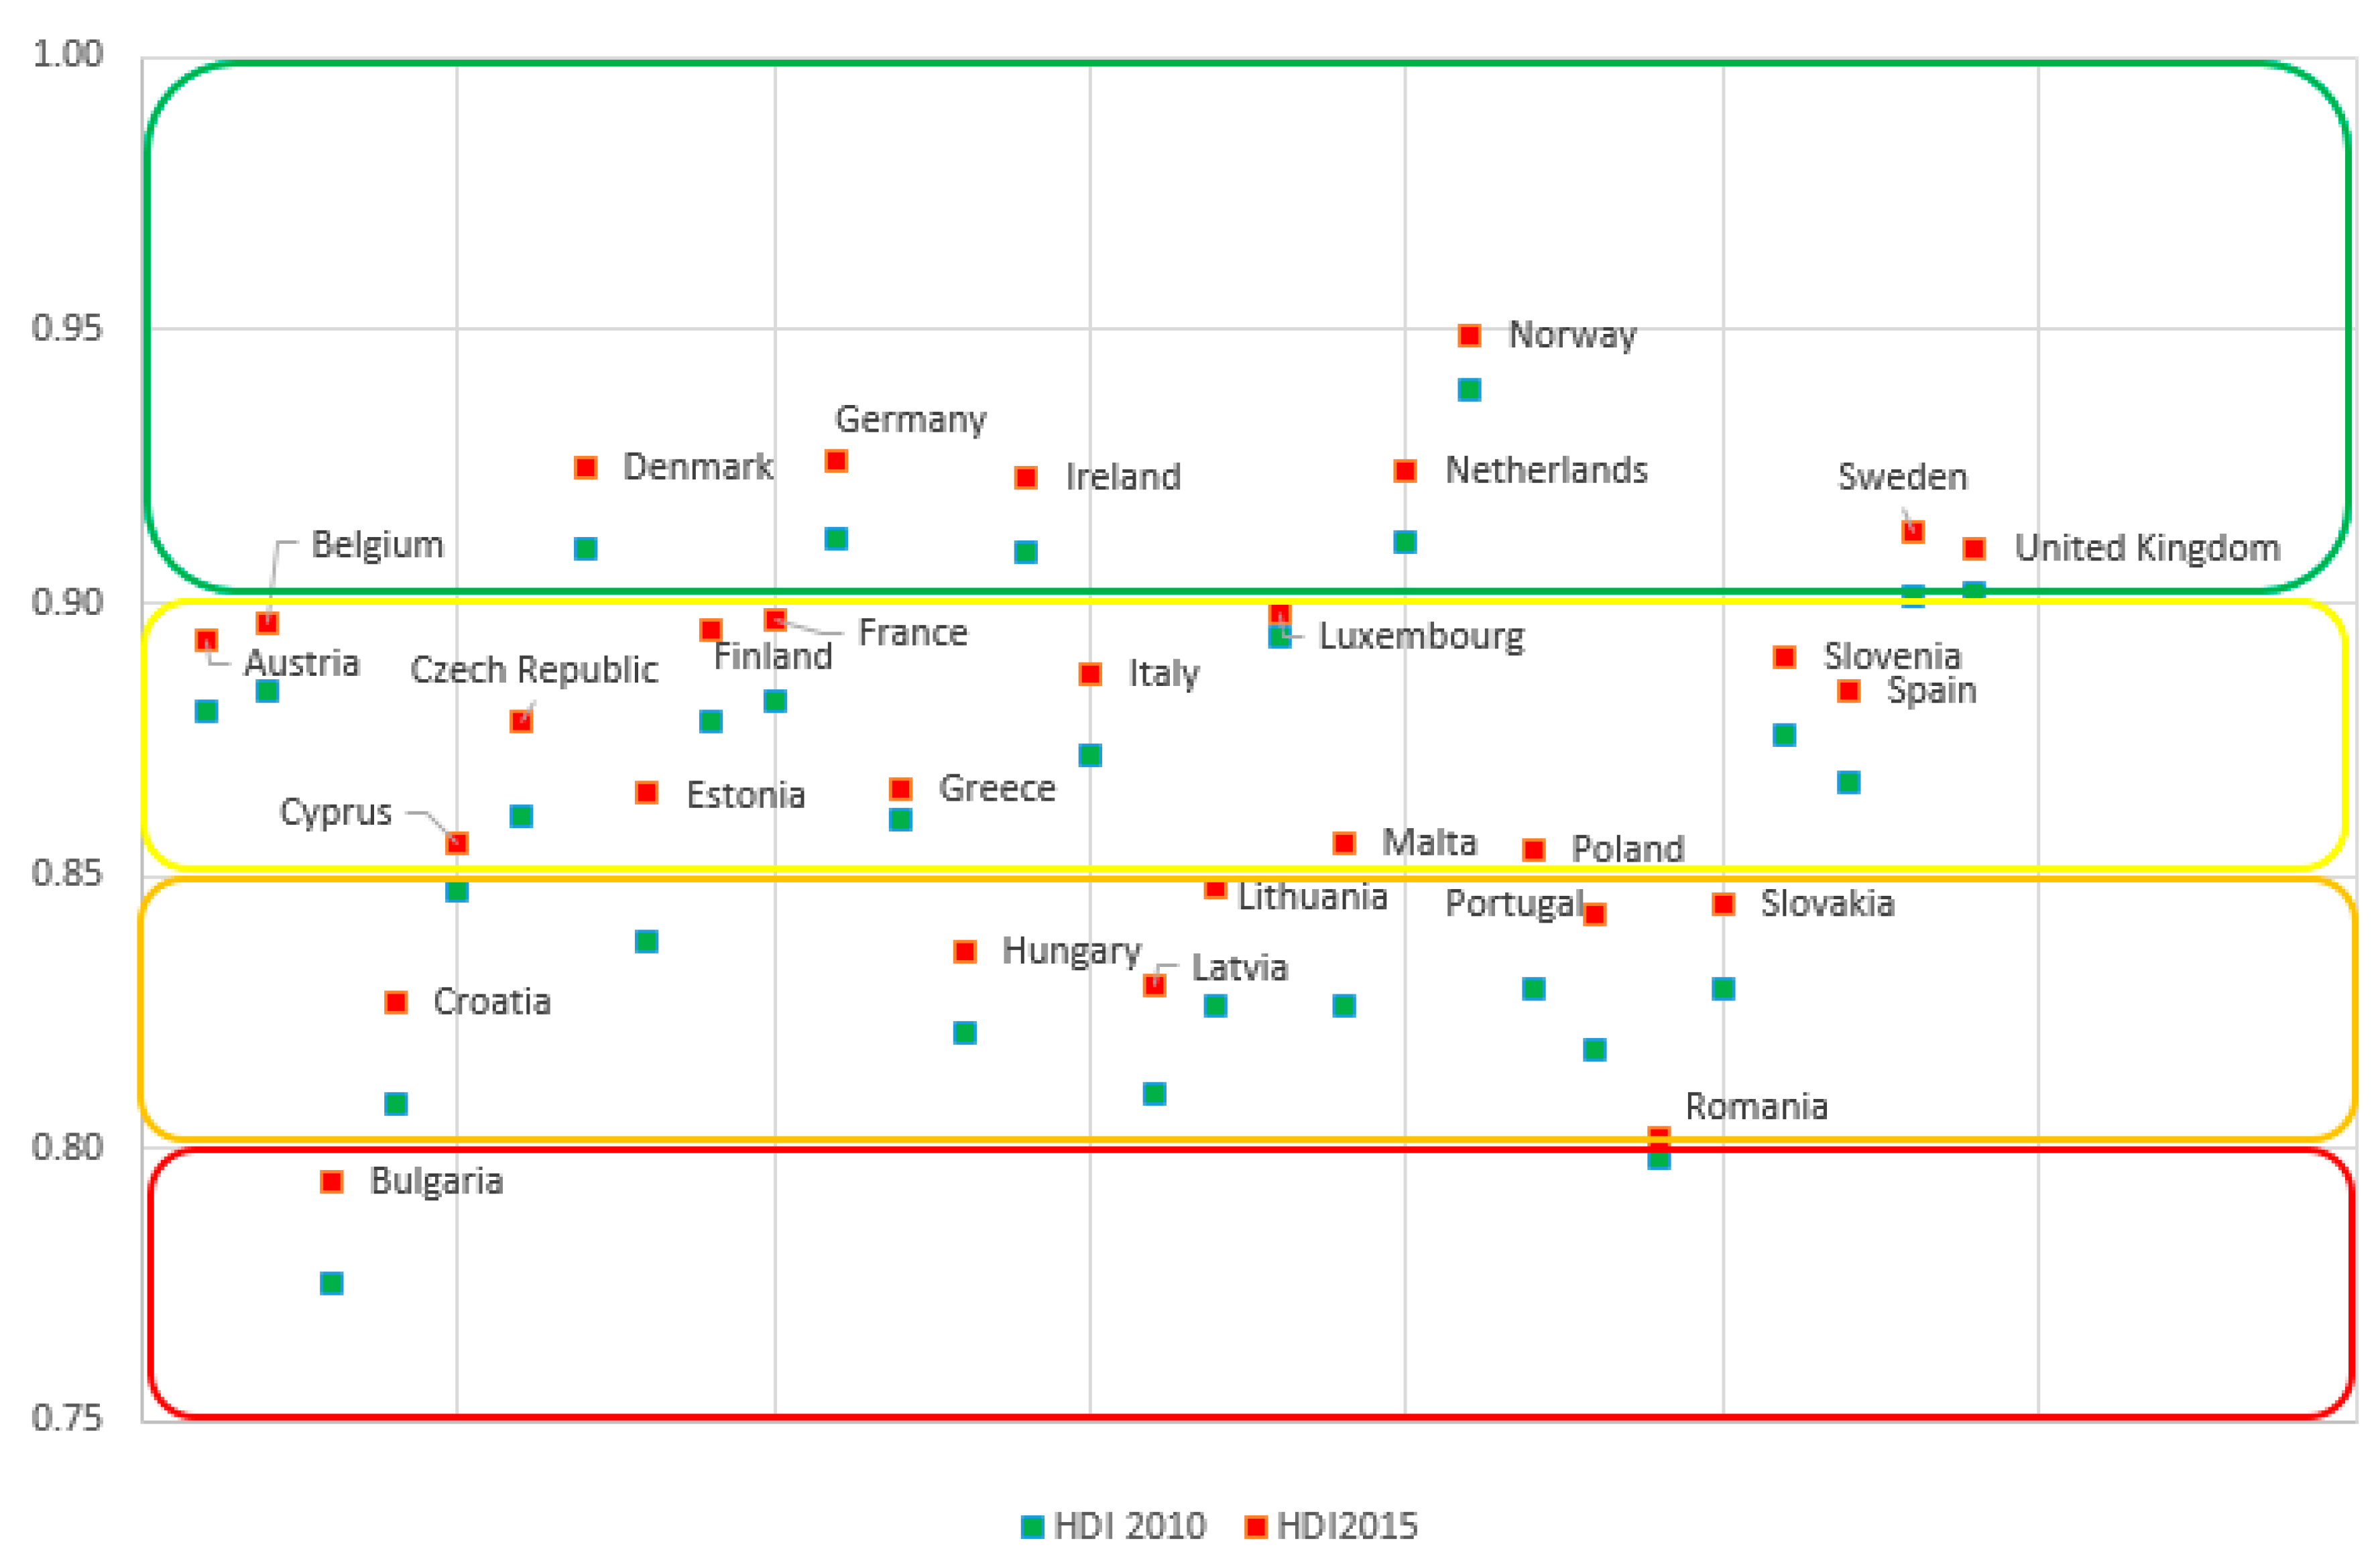
Figure 5.
Calculation of the rating intervals for PHDI. Source: Own mathematical calculations.
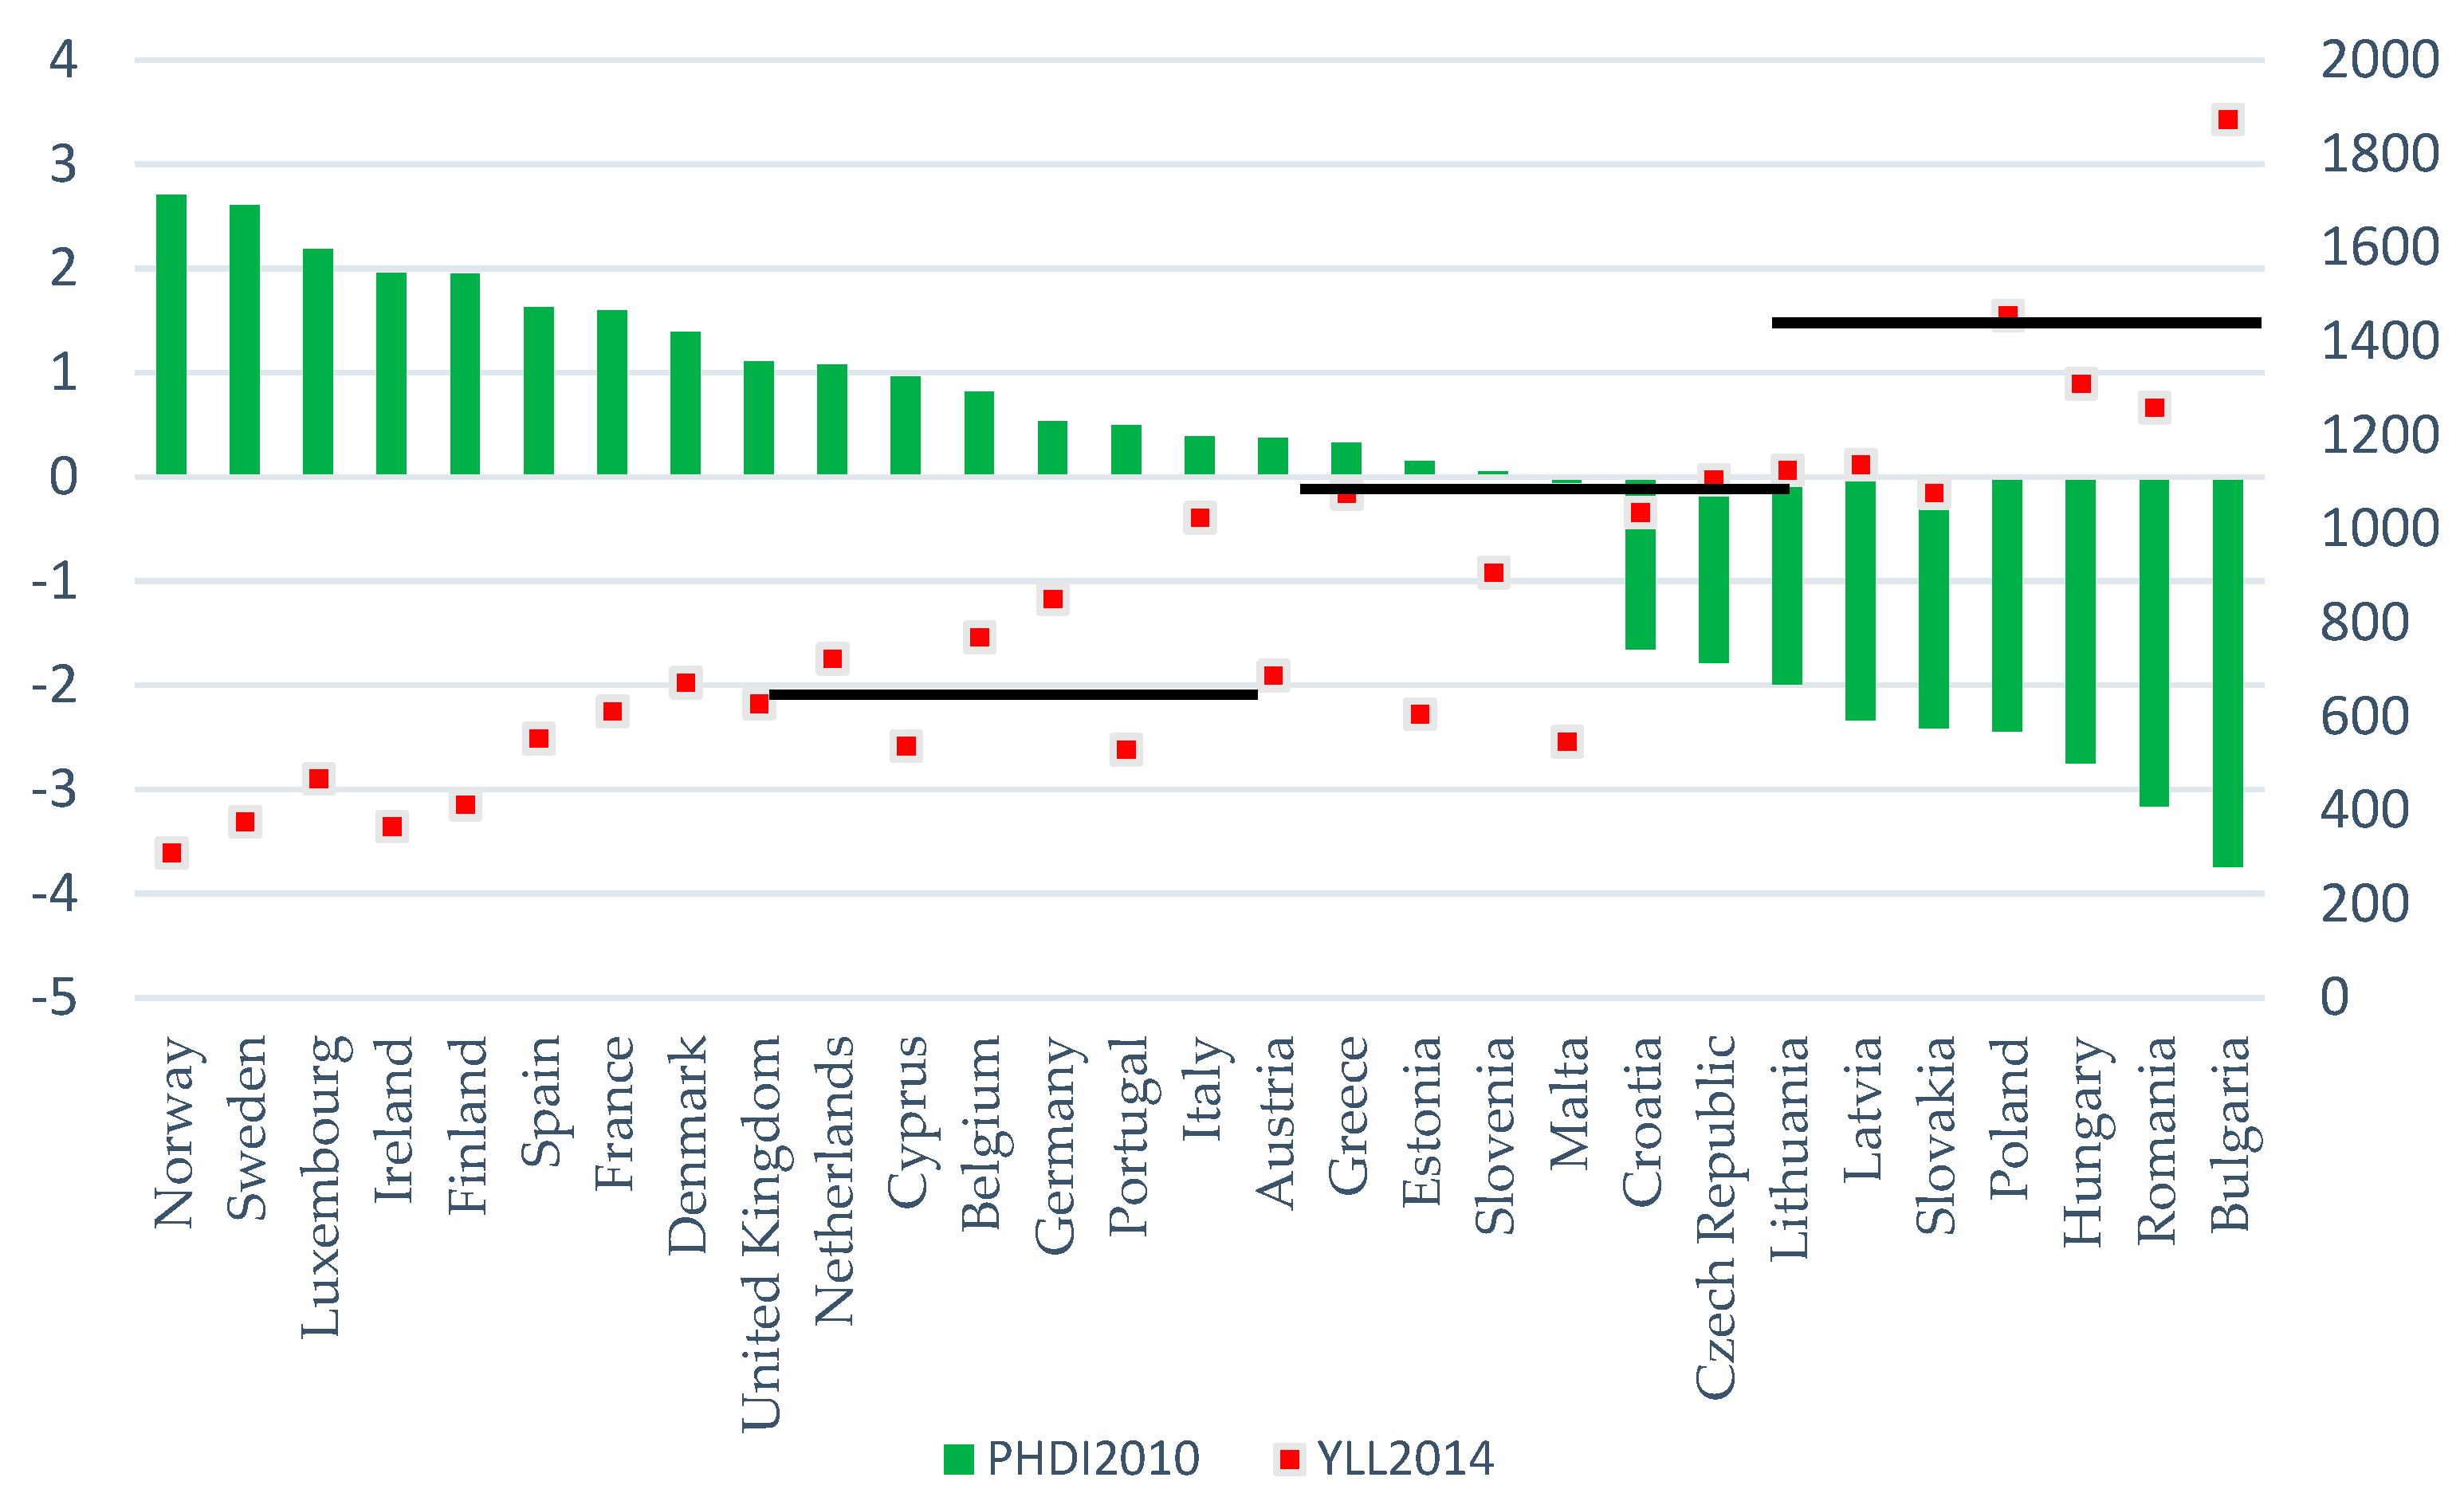
Figure 6.
Comparison of PHDI values for 2010 and 2015. Source: Own mathematical calculations.
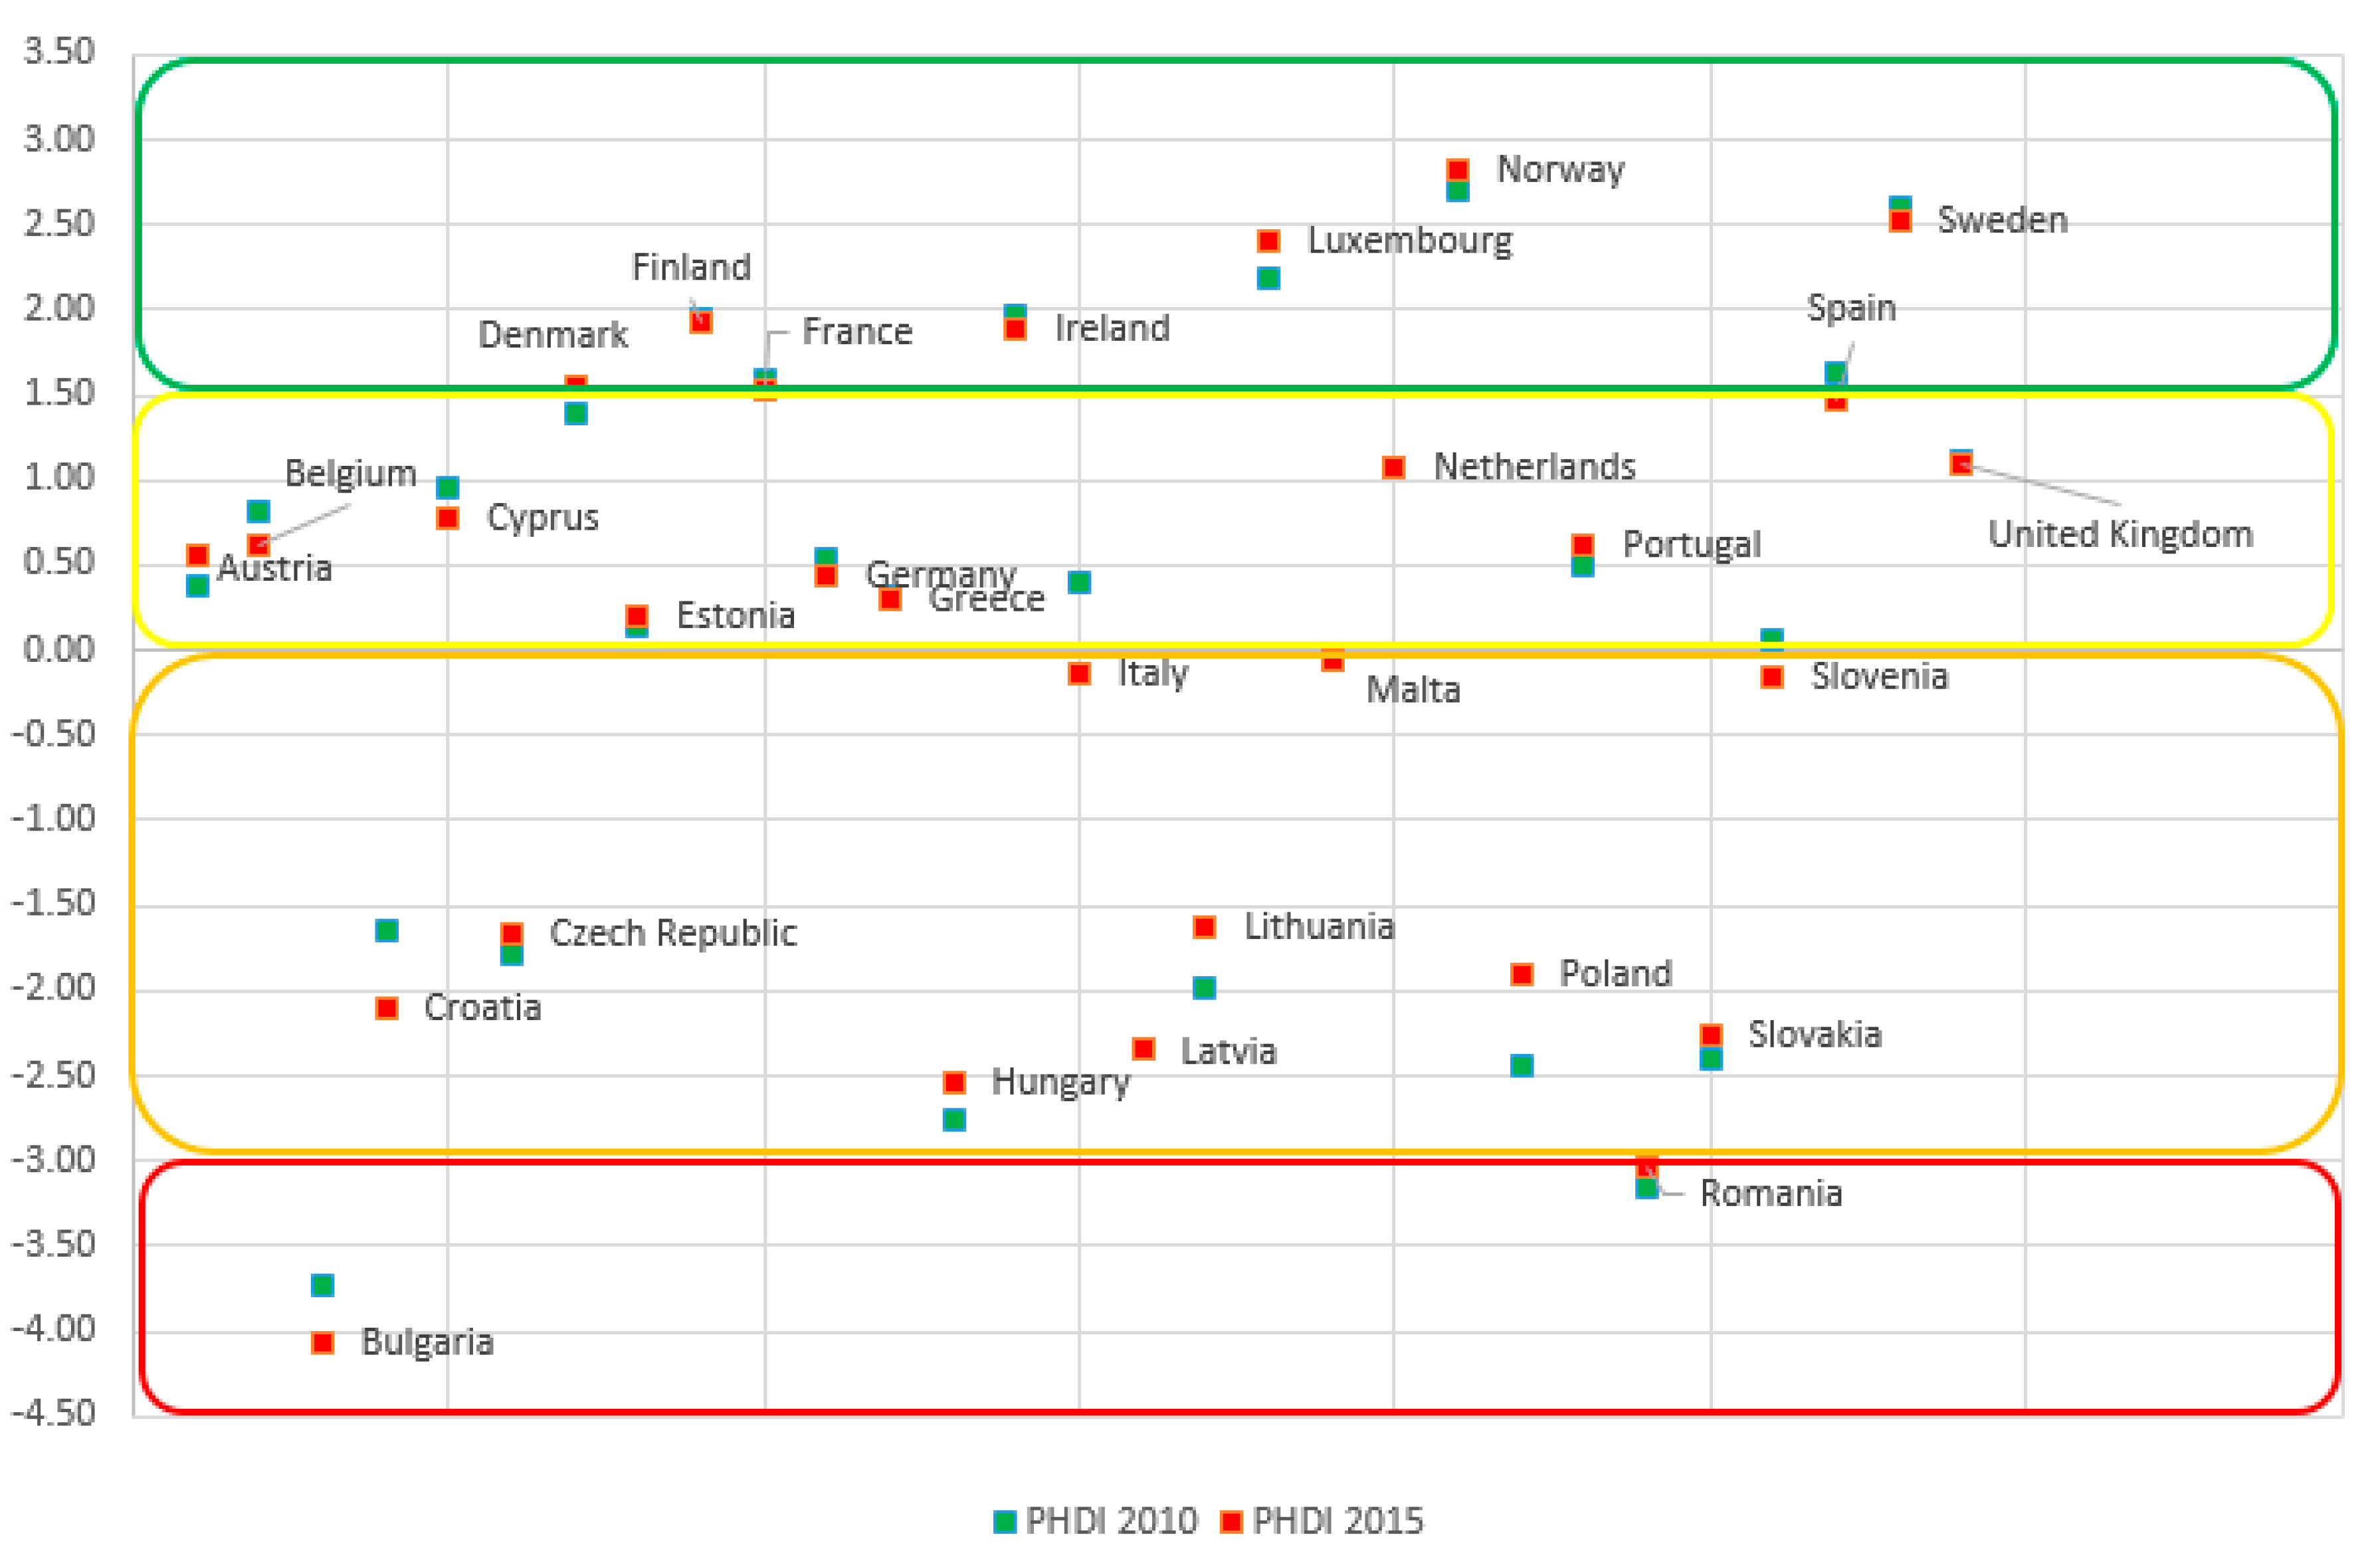
Figure 7.
Sensitivity analysis: absolute difference in HDI values 2015. Source: Own mathematical calculations.
Figure 7.
Sensitivity analysis: absolute difference in HDI values 2015. Source: Own mathematical calculations.

Figure 8.
HDI 2015 and PHDI 2015 ranking. Source: Own mathematical calculations.

Table 1.
Correlation matrix, 2010, 2015.
| Variables | Life Expectancy | Tertiary Educational Attainment | Ambient PM2.5 Concentration | Real GDP/Capita | Death Rate Due to Ambient PM2.5 Concentration |
|---|---|---|---|---|---|
| Life Expectancy | 0.3419 | −0.651 | 0.6333 | −0.91 | |
| 0.2655 | −0.6533 | 0.653 | −0.94 | ||
| Tertiary educational attainment | 0.3419 | −0.4905 | 0.5639 | −0.4786 | |
| 0.2655 | −0.4455 | 0.5042 | −0.3913 | ||
| Ambient PM2.5 concentration | −0.6519 | −0.4905 | −0.5003 | 0.8698 | |
| −0.6533 | −0.4455 | −0.5116 | 0.829 | ||
| Real GDP/capita | 0.6333 | 0.5639 | −0.5003 | −0.641 | |
| 0.653 | 0.5042 | −0.5116 | −0.6397 | ||
| Death rate due to ambient PM2.5 concentration | −0.91 | −0.4786 | 0.8698 | −0.641 | |
| −0.94 | −0.3913 | 0.829 | −0.6397 |
Source: Own mathematical calculations.
Table 2.
Average variables for the subsamples for 2010 and 2015.
| Countries | Tertiary Educational Attainment | Ambient PM2.5 Concentration (Micrograms/m3) | Real GDP/Capita | Death Rate Due to Ambient PM2.5 Concentration |
|---|---|---|---|---|
| Countries with Life Expectancy lower than EU Average | 29.08 | 20 | 9710 | 52.6 |
| 36.89 | 20.7 | 10760 | 47.6 | |
| Countries with Life Expectancy higher than EU Average | 37.76 | 12.21 | 33878 | 20.57 |
| 42.94 | 13.31 | 34221 | 20.15 |
Source: Own mathematical calculations.
Table 3.
Eigenvectors 2010, 2015.
| Variables | Principal Component 2010 | Principal Component 2015 |
|---|---|---|
| Life Expectancy | 0.468496 | 0.481966 |
| Tertiary educational attainment | 0.352254 | 0.315104 |
| Ambient PM2.5 concentration | −0.459707 | −0.461619 |
| Real GDP/capita | 0.426120 | 0.434303 |
| Death rate due to ambient PM2.5 concentration | −0.513342 | −0.516437 |
Source: Own mathematical calculations.
Table 4.
Rating transition matrix using HDI.
| HDI | VH | H | M | L |
|---|---|---|---|---|
| VH | United Kingdom, Sweden, Norway, Netherlands, Ireland, Germany, Denmark | |||
| H | Austria, Belgium, Spain, Slovenia, Luxembourg, Czech Republic, Italy, Greece, Finland, France | |||
| M | Poland, Malta, Estonia, Cyprus | Slovakia, Portugal, Lithuania, Croatia, Latvia, Hungary | ||
| L | Romania | Bulgaria |
Source: Own mathematical calculations.
Table 5.
Rating transition matrix using PHDI.
| PHDI | VH | H | M | L |
|---|---|---|---|---|
| VH | Sweden, Norway, Luxembourg, Ireland, France, Finland | Spain | ||
| H | Denmark | Austria, Belgium, UK, Portugal, Cyprus, Netherlands, Greece, Germany | Italy | |
| M | Estonia | Slovenia, Slovakia, Poland, Croatia, Malta, Czech Republic, Lithuania, Latvia, Hungary | ||
| L | Bulgaria Romania |
Source: Own mathematical calculations.
Table 6.
Rating transition matrix using HDI and PHDI.
| HDI/PHDI | VH | H | M | L |
|---|---|---|---|---|
| VH | Sweden, Norway, Ireland, Denmark | United Kingdom, Netherlands, Germany | ||
| H | France, Luxembourg, Finland | Austria, Belgium, Spain, Cyprus, Greece, Estonia | Slovenia, Italy, Czech Republic, Poland, Malta | |
| M | Portugal | Slovakia, Croatia, Lithuania, Latvia, Hungary | Romania | |
| L | Bulgaria |
Source: Own mathematical calculations.
Table 7.
New HDI Indicator ranking using the ambient PM2.5 concentration impact.
| Country | HDI2015 | Country | NewHDI2015 | |
|---|---|---|---|---|
| 1 | Norway | 0.9490 | Norway | 0.951831 |
| 2 | Germany | 0.9260 | Denmark | 0.926554 |
| 3 | Denmark | 0.9250 | Germany | 0.926434 |
| 4 | Netherlands | 0.9240 | Netherlands | 0.925083 |
| 5 | Ireland | 0.9230 | Ireland | 0.924894 |
| 6 | Sweden | 0.9130 | Sweden | 0.91553 |
| 7 | United Kingdom | 0.9100 | United Kingdom | 0.911104 |
| 8 | Luxembourg | 0.8980 | Luxembourg | 0.900408 |
| 9 | France | 0.8970 | France | 0.898531 |
| 10 | Belgium | 0.8960 | Finland | 0.896927 |
| 11 | Finland | 0.8950 | Belgium | 0.896618 |
| 12 | Austria | 0.8930 | Austria | 0.893562 |
| 13 | Slovenia | 0.8900 | Slovenia | 0.889843 |
| 14 | Italy | 0.8870 | Italy | 0.886871 |
| 15 | Spain | 0.8840 | Spain | 0.885473 |
| 16 | Czech Republic | 0.8780 | Czech Republic | 0.876331 |
| 17 | Greece | 0.8660 | Greece | 0.866306 |
| 18 | Estonia | 0.8650 | Estonia | 0.865206 |
| 19 | Cyprus | 0.8560 | Cyprus | 0.856783 |
| 20 | Malta | 0.8560 | Malta | 0.855936 |
| 21 | Poland | 0.8550 | Poland | 0.853105 |
| 22 | Lithuania | 0.8480 | Lithuania | 0.84638 |
| 23 | Slovakia | 0.8450 | Portugal | 0.843623 |
| 24 | Portugal | 0.8430 | Slovakia | 0.842746 |
| 25 | Hungary | 0.8360 | Hungary | 0.833469 |
| 26 | Latvia | 0.8300 | Latvia | 0.827652 |
| 27 | Croatia | 0.8270 | Croatia | 0.824903 |
| 28 | Romania | 0.8020 | Romania | 0.798967 |
| 29 | Bulgaria | 0.7940 | Bulgaria | 0.789931 |
Source: Own mathematical calculations.
© 2018 by the authors. Licensee MDPI, Basel, Switzerland. This article is an open access article distributed under the terms and conditions of the Creative Commons Attribution (CC BY) license (http://creativecommons.org/licenses/by/4.0/).
Share and Cite
MDPI and ACS Style
Săndică, A.-M.; Dudian, M.; Ştefănescu, A. Air Pollution and Human Development in Europe: A New Index Using Principal Component Analysis. Sustainability 2018, 10, 312. https://doi.org/10.3390/su10020312
AMA Style
Săndică A-M, Dudian M, Ştefănescu A. Air Pollution and Human Development in Europe: A New Index Using Principal Component Analysis. Sustainability. 2018; 10(2):312. https://doi.org/10.3390/su10020312
Chicago/Turabian StyleSăndică, Ana-Maria, Monica Dudian, and Aurelia Ştefănescu. 2018. "Air Pollution and Human Development in Europe: A New Index Using Principal Component Analysis" Sustainability 10, no. 2: 312. https://doi.org/10.3390/su10020312
Note that from the first issue of 2016, this journal uses article numbers instead of page numbers. See further details here.