Article

Farmer Perceptions of Conflict Related to Water in Zambia

1
Anthropology Department and Joan B. Kroc Institute for International Peace Studies, University of Notre Dame, Notre Dame, IN 46556, USA
2
School of Public & Environmental Affairs, Indiana University Bloomington, Bloomington, IN 47405, USA
3
Department of Geography, Indiana University Bloomington, Bloomington, IN 47405, USA
*
Author to whom correspondence should be addressed.
Sustainability 2018, 10(2), 313; https://doi.org/10.3390/su10020313
Submission received: 21 December 2017 / Revised: 22 January 2018 / Accepted: 22 January 2018 / Published: 26 January 2018
(This article belongs to the Section Social Ecology and Sustainability)

Abstract

:
The relationship between climate change, water scarcity, and conflict is still debated. Much of the existing work relating resource scarcity to conflict has involved regional-scale analysis linking instances of violent outbreaks to environmental conditions. But how do individual farmers in Africa define conflict? Do they perceive that conflict will change as a function of water scarcity, and, if so, how? Here, we address these questions by surveying farmers in southern Zambia in 2015, where we asked respondents to define conflict, assessed their perceptions of past and future conflict, as well as perceptions of rainfall and water availability. We find that the majority of our respondents (75%) think of conflict as misunderstandings or disagreements between people and that 91% of our sample has experienced past conflict, 70% expect to experience future conflict, and 58% expect to experience future physical violent conflict. When asked about the sources of conflict, respondents mainly mention land grabbing, crop damage by animals, and politics rather than water related issues. However, we find a significant relationship between perceptions of future rainfall decreasing and future physical violent conflict. These results imply that even though respondents do not think water scarcity is a direct source of conflict, the perception of decreased rain in the future is significantly related to the perception that future conflict and future physical violent conflict will occur.

1. Introduction

The effects of climate change are expected to negatively impact water and human security, an expectation particularly true for Africa [1,2]. However, the relationship between climate change, water insecurity, and human conflict is a much-debated topic [3,4,5,6,7]. The potential impacts of climate change on agriculture, water scarcity, and human security are especially worrisome for rain fed subsistence farmers [8,9,10,11]. The tight coupling between water and food insecurity may lead to negative impacts on physical, psychological, and social well-being ranging from increased anxiety and stress at the individual-level to increases in group-level violence. Water scarcity may also lead to multiple adverse health outcomes, including sanitation problems and increased incidence of waterborne diarrheal diseases that can lead to malnutrition [12]. Here, we investigate the relationship between water needs, perceptions of rainfall, sources of anxiety and stress, and past and future conflict by surveying subsistence farmers in southern Zambia.
The potential for increased levels of anxiety and violence due to climate change is acknowledged in many government reports [1,2,8,13]. These reports state that levels of violence would increase due to climate change, increased resource competition, decreased stability and economic mobility, and impacts that degrade general quality of life. Corroborating these reports, Hsiang et al. [5,14,15,16,17] use meta-analysis at the macro-level to show a robust positive relationship between environmental change (variation in temperature and precipitation) and violent conflict. O’Loughlin et al. [6] challenge some of these findings citing issues of model specification and data selection, and demonstrate a result that does not include a significant relationship between precipitation and violent conflict. The relationship between water and conflict has also been examined in case study analyses using qualitative and historical account approaches, where results find evidence showing a positive relationship between water scarcity and conflict [18,19,20,21].
Conflict and violent conflict both have expansive definitions. Conflict can range from serious disagreements and arguments to armed struggle. The World Health Organization defines violence as “the intentional use of physical force or power, threatened or actual, against oneself, another person, or against a group or community, that either results in or has a high likelihood of resulting in injury, death, psychological harm, maldevelopment or deprivation” [22]. Literature on the topic of water and conflict has focused on violent, armed conflict [23,24,25,26,27,28,29,30,31] and social conflict [7,32,33]. Many of these studies have used one of the following two datasets to determine the occurrence of conflict: (1) the Peace Research Institute of Oslo’s Armed Conflict Dataset [4], which defines violent conflict as “a contested incompatibility that concerns government and/or territory where the use of armed force between two parties, of which at least one is the government of a state, results in at least 25 battle-related deaths”; and (2) the Armed Conflict Location and Event Data Project Social Conflict Analysis Database, which defines social conflict as “a violent political event … [which is] a single altercation where often force is used by one or more groups for a political end” [34].
These two datasets are limited in the forms and scale of conflict that are accounted in their data, and blur local-level aspects of conflict. Our study does not attempt to overturn or discount the value of these studies. Here, we conduct our investigation at a finer scale in an effort to uncover local and household level nuances that might otherwise be overlooked, with particular emphasis given to individual perceptions of water and conflict. The point is to determine if these nuances are consistent with macro-level study findings, or if, instead, there are important differences present at the local and individual level. Linke et al. [35] identify this gap in the literature, specifically noting that, “researchers rarely examine social and political processes that might link climate anomalies and violence experiences at the scale of individuals or households.” Linke et al. [35] address this gap using household level surveys to investigate perceptions of precipitation variation and the “justified use of violence” in Kenya. Their work elucidates the importance of local-level contexts in the relationship between environmental change and conflict. Their work using household level surveys sheds light on local-level perceptions; however, it probes a limited aspect of conflict. The unit of measure utilized for capturing conflict is “support for the use of violence”. This measure does not delineate or define what type of violence is supported or the source of that violence; and, it does not probe whether violence has or is expected to occur. Lastly, responses are partially limited by the survey instrument, which contained only closed-ended questions. Although closed-ended questions aid in comparison across samples, they restrict the extent to which contextually rich data at local-level can be solicited.
Our study investigates the relationship between household-level attributes, environmental conditions and perceptions of conflict in Zambia. We develop an approach to investigate this relationship and to analyze the strength and impact of participants’ perceptions of environmental conditions—namely water—on their perceptions of conflict in the area they live in. The ability to adapt to climate and natural resource variability depends on tactical decision-making, diversification of available assets, and the flexibility to transition between processes [10,36,37]. These factors and others determine vulnerability to the stresses associated with environmental and social change [9]. Investigating perceptions of respondents are also crucial to understanding the underlying mechanisms of conflict [38]. The point of this study is to illuminate how individuals understand the effects of water issues playing out in everyday life, specifically with relation to conflict outcomes.
Figure 1 presents a conceptual approach to investigate the relationship between rainfall, domestic and crop water demand, household attributes, and environmental perceptions, with perceptions of conflict. Understanding how these factors may interact forms our framework for investigating perceptions of future conflict and violence. We separate out water needs into household/domestic needs and field crop needs. Water storage infrastructure can help buffer water shortages for domestic water needs, but households generally lack sufficient storage or water distribution infrastructure to fulfill crop water demand. Other factors, such as not having access to proximal clean water sources, may exacerbate perceptions of water scarcity and thereby perceptions of potential conflict over water resources. For field crop water needs, farmers are reliant on precipitation as smallholder farmers in the region lack the technical infrastructure for gravity-fed or groundwater irrigation. Our study captures these factors at the household level to disentangle relationships that are masked with regional-scale analyses that relate prevalence of conflict to aggregated social characteristics (i.e., mean income across thousands of agents). Given the tight connection smallholder farmers have to environmental dynamics, it can be expected that environmental resource scarcity would play an outsized role in perceptions of conflict. This may particularly be the case in dryland agro-ecosystems where periodic droughts and mid-season dryspells are not uncommon. However, we acknowledge the possibility that two farmers with the same assets (total land holdings, distribution of land holdings in different soil moisture conditions) may have very different perceptions of conflict due to different past experiences, education, and social networks among other factors. Thus, we use analysis of household-level data to understand the diverse factors related to households’ perceptions of conflict.

2. Methods and Materials
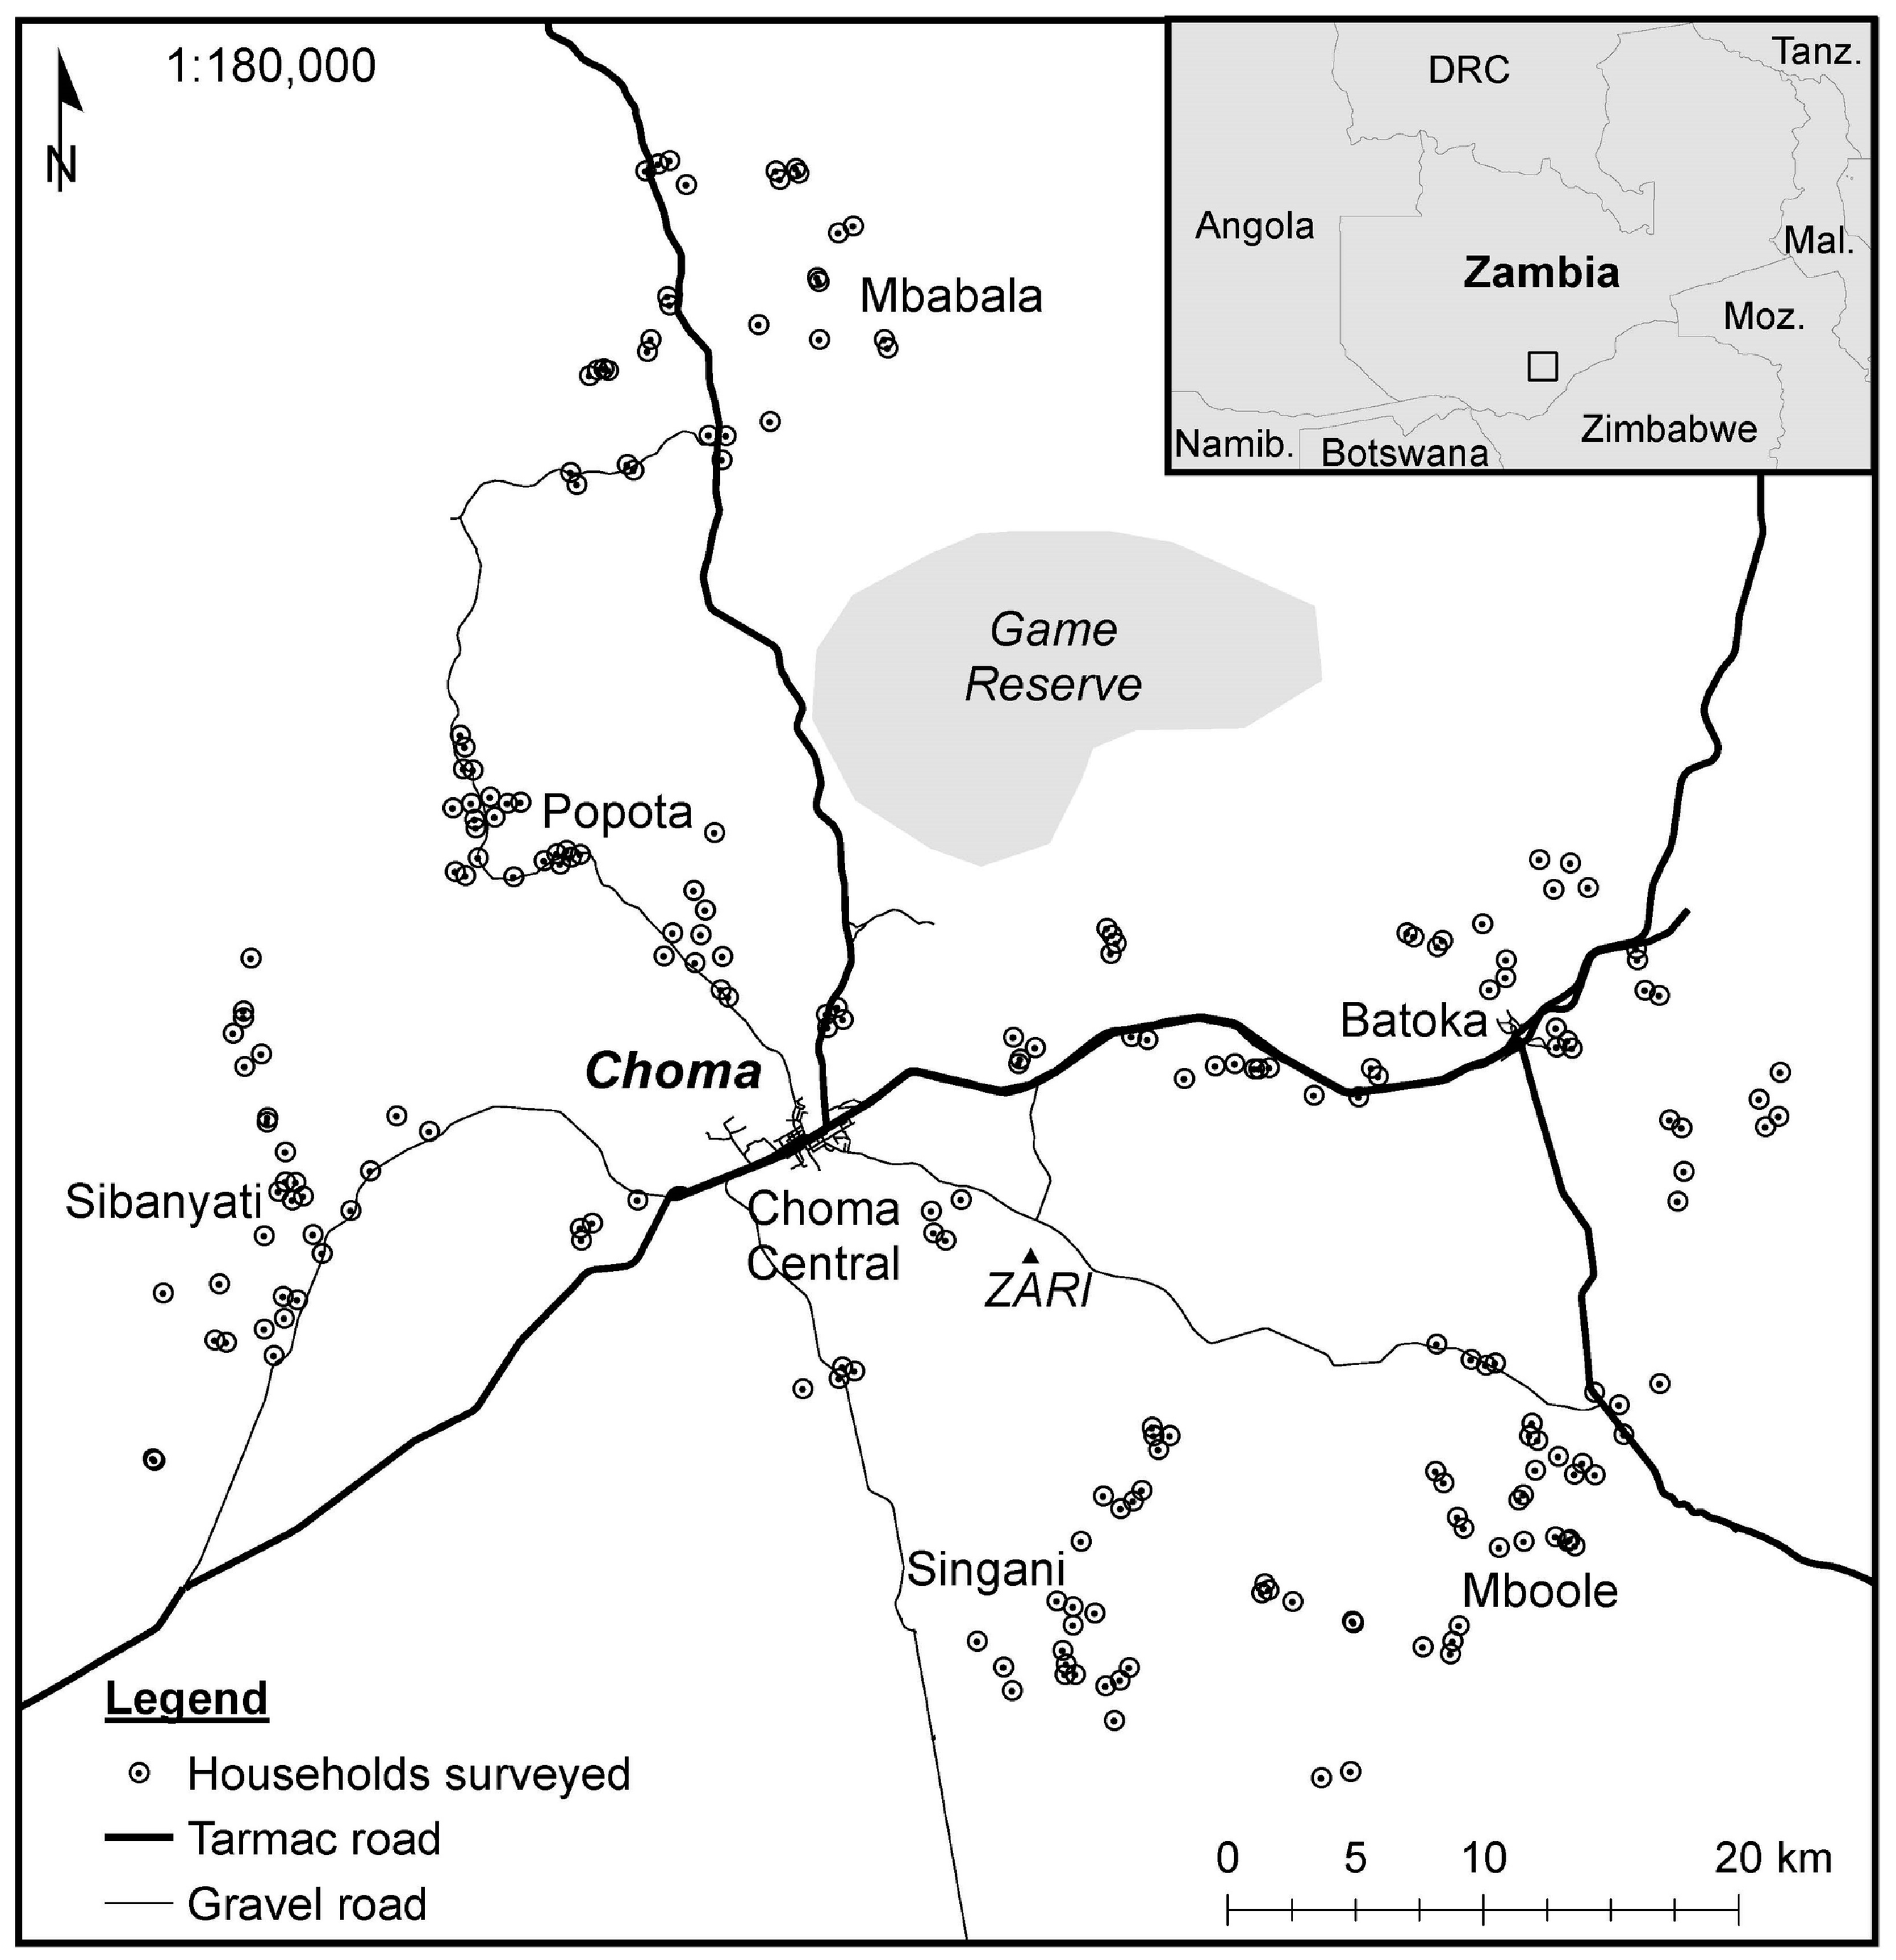
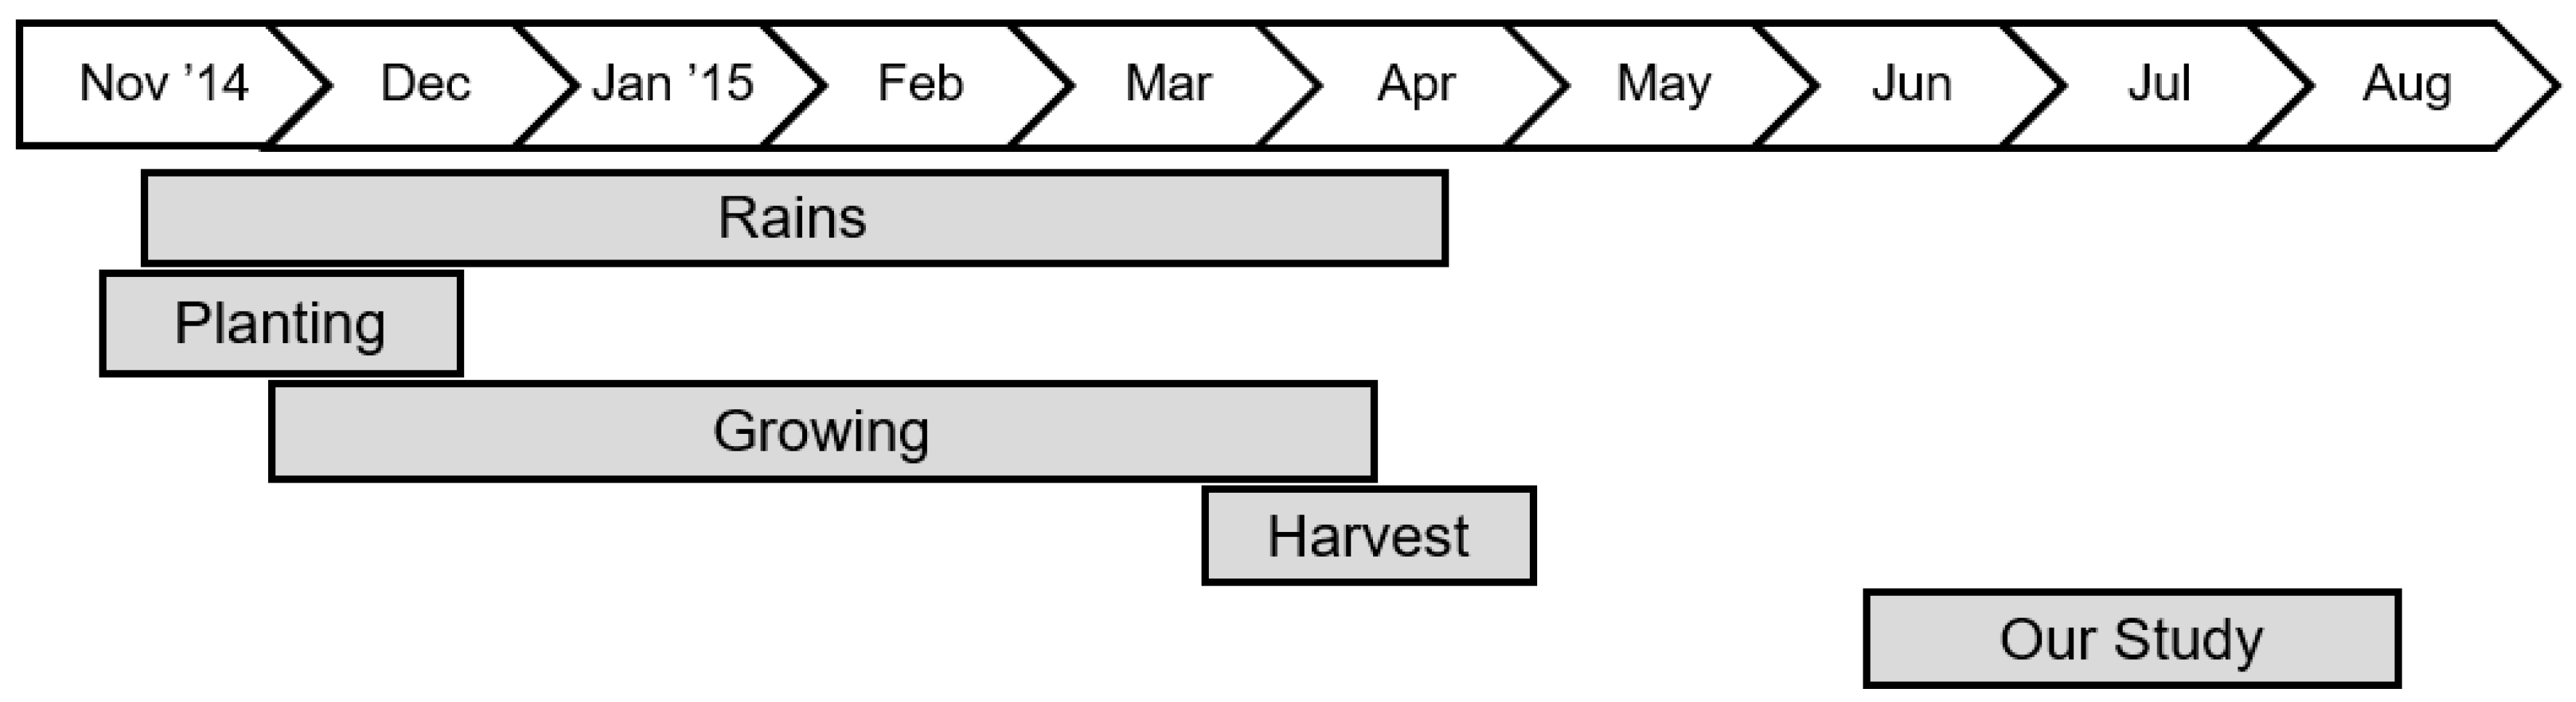
2.1. Study Location

This research was conducted in Zambia, which is a landlocked country in Sub-Saharan Africa that has experienced increased annual variation in rainfall over the last two decades [39,40]. Climate models generally suggest these impacts will continue in the south African region and increase for at least the next few decades [1]. Within Zambia, the most water scarce region is the Southern Province [39,40]. The climate regime in the study area is generally characterized as semi-arid with an average annual rainfall of 800 mm [39]. Fluctuations in inter-annual and intra-annual precipitation have the potential to disrupt development of this primarily agrarian-based state [2,37,41], given that livelihood is directly tied to growing maize. Inter-annual precipitation variations, or changes in precipitation levels between years, can negatively impact farmer decision-making due to increased uncertainty. For example, a farmer may plant a short-maturing seed variety if he or she expects the rain season to be short, but when inter-annual precipitation is erratic choosing the most suitable seed variety is increasingly difficult. Intra-annual precipitation variation may also be increasing in Zambia, consisting of high-rainfall but less frequent storm events; these shifts are more difficult to adapt to given their unpredictable and immediate nature within a growing season [42]. The disruptive impacts of uncertain precipitation are most acutely felt by smallholder farmers who do not have access to irrigation and are reliant on rainfall for their crop water needs. All Zambians are affected by these impacts; however, those closer to urban centers may be less directly impacted by the changing climate. Urban dwellers generally have access to piped water and most may have other jobs besides farming to support their livelihood.
Zambia is also politically stable compared to other countries in the region that are often fraught with social unrest and violence. Zambia achieved its independence from British colonial rule in 1964 and has not had a civil war or major civil uprising to date. The Social Conflict Analysis Database [33] shows only 49 events occurring between 2005–2013, comprised mainly of worker’s strikes, political demonstrations, and protests against food price increases. Armed violence did not occur in any of these events, other than a few minor incursions on the Democratic Republic of Congo border. In contrast to past studies of conflict and their respective geographic areas investigated [20,21,30,35], given Zambia’s stability, the country offers a cleaner slate for investigating the relationship between water and conflict.

2.2. Household-Level Surveys

Our survey was designed to collect qualitative and quantitative information to contextually ground findings related to water scarcity, conflict, and violent conflict. Galtung [43,44,45] describes violence as a triad, where the three components of the triad are (1) structural violence, (2) cultural violence, and (3) direct violence. In this paradigm, direct violence is an event or instance, structural violence is a process, and cultural violence is invariant as it resides within a culture for extensive periods of time. Each component interacts with the other; therefore, to accurately capture what is happening, each component needs to be taken into consideration and probed when investigating conflict. Individual perceptions and experiences with ‘conflict’ can be especially difficult to measure as it has varied manifestations, both violent and nonviolent [43]. This line of thinking has informed our survey approach, as we rely on extensive face-to-face interviews with a combination of open-ended and closed-ended questions capture some of the rich contextual realities that exist on the ground in southern Zambia.
This study focuses on smallholder farmers in Choma District which the provincial capital of the Southern Province of Zambia. Choma District is characterized by heterogeneous soil fertility and topography, which in aggregate provide variations in household conditions and circumstances across the district. There are 47,714 small-scale farmer households in the district [46], where the Ministry of Agriculture Planning Unit defines small-scale and emergent farmers as those managing less than 20 hectares. We categorize farmers as smallholders if they plant less than 400 kg of maize seed in the last growing season, where a rough rule is about 20–25 kg of maize seed planted per hectare in Zambia. Farmers in our sample are rain-fed agriculturalists who rely on field crop production for both subsistence and their primary source of income, though they often participate in additional income generating activities. Smallholders in our sample rely directly on precipitation to water their field crops and do not have the capacity for irrigation. Therefore, their perceptions of rainfall are directly associated with expectations for their livelihood and stability. Southern Province is also one of the poorest provinces in Zambia [47], with limited government services and economic development in the area relative to other provinces.
Our sampling strategy leveraged local formal and informal structures to access respondents. Households were interviewed within a series of Agricultural Camps which are administrative units defined by the Zambia Ministry of Agriculture (Camps hereafter). There are 32 Camps within Choma District [46]. Agricultural activities in camps are coordinated by a Camp Officer and a Community Agricultural Committee [48]. Through these entities smallholder farmers are able to convey their farming needs and receive information on programs including farming subsidies and technical assistance. Seven Camps were sampled in total, as shown in Figure 2. The Zambian Agricultural Research Institute (ZARI) introduced our research team to each Camp Officer for every Camp sampled. The Camp Officer would then introduce the research team to individual farmers within the Camp. Interviews were conducted through two local enumerators fluent in the predominant local language (Tonga).
Camps are divided into eight Zones each [49]. Zones are drawn based on local-level considerations such as villages within the camp, spatial layout, and traditional governance structures. Zone boundaries do not divide the area equally along a single line of separation; however, they do provide coverage of the entire camp and capture important variations within the camp. Each of eight Zones were sampled within each target Camp. Four respondents from each Zone were sampled, resulting in 32 respondents sampled per Camp, and 224 respondents sampled in total for our study. Our sample size relative to the total population of the Choma does limit the generalizability of our findings to the greater Choma area; we do note that we distributed our sample selection across the Choma District, as shown in Figure 2. Respondents within each Zone were chosen using the following rules for selection: that respondents were not contacted prior to our arrival at their household; that they would be surveyed at their residence; and that they would not be neighbors.
Data collection occurred in the post-harvest months of June, July and August of 2015, (See Figure 3). The average completion time for the survey was 35 min.

2.3. Survey

The survey included questions on socio-demographic information such as age and the number of years the respondent has been a farmer; open-ended questions ranging from the respondent’s definitions of conflict to sources of general worries; to closed-ended questions about crop water needs and changes in rainfall patterns. The survey was pre-tested in the field (n = 21) to ensure the validity of each survey question and enumerator training. The predominant language spoken in Choma district is Tonga [47]. Specific Tongan words were tested in an effort to remove bias from the way the questions were asked. For example, kuzwangana (conflict) was selected after multiple trials and discussions to make sure that it did not specify a type or form of conflict.
The survey sections were organized as follows:
  • Socio-demographic questions focusing on age, gender, education, household size, etc.
  • Open-ended questions focusing on sources of worries, definitions of conflict, and sources of conflict. Respondents were asked to provide their perceptions of whether they had experienced conflict in the past ten years and if they perceived they would experience conflict and violent conflict in the next ten years. If respondents said yes, they were asked about the sources of conflict.
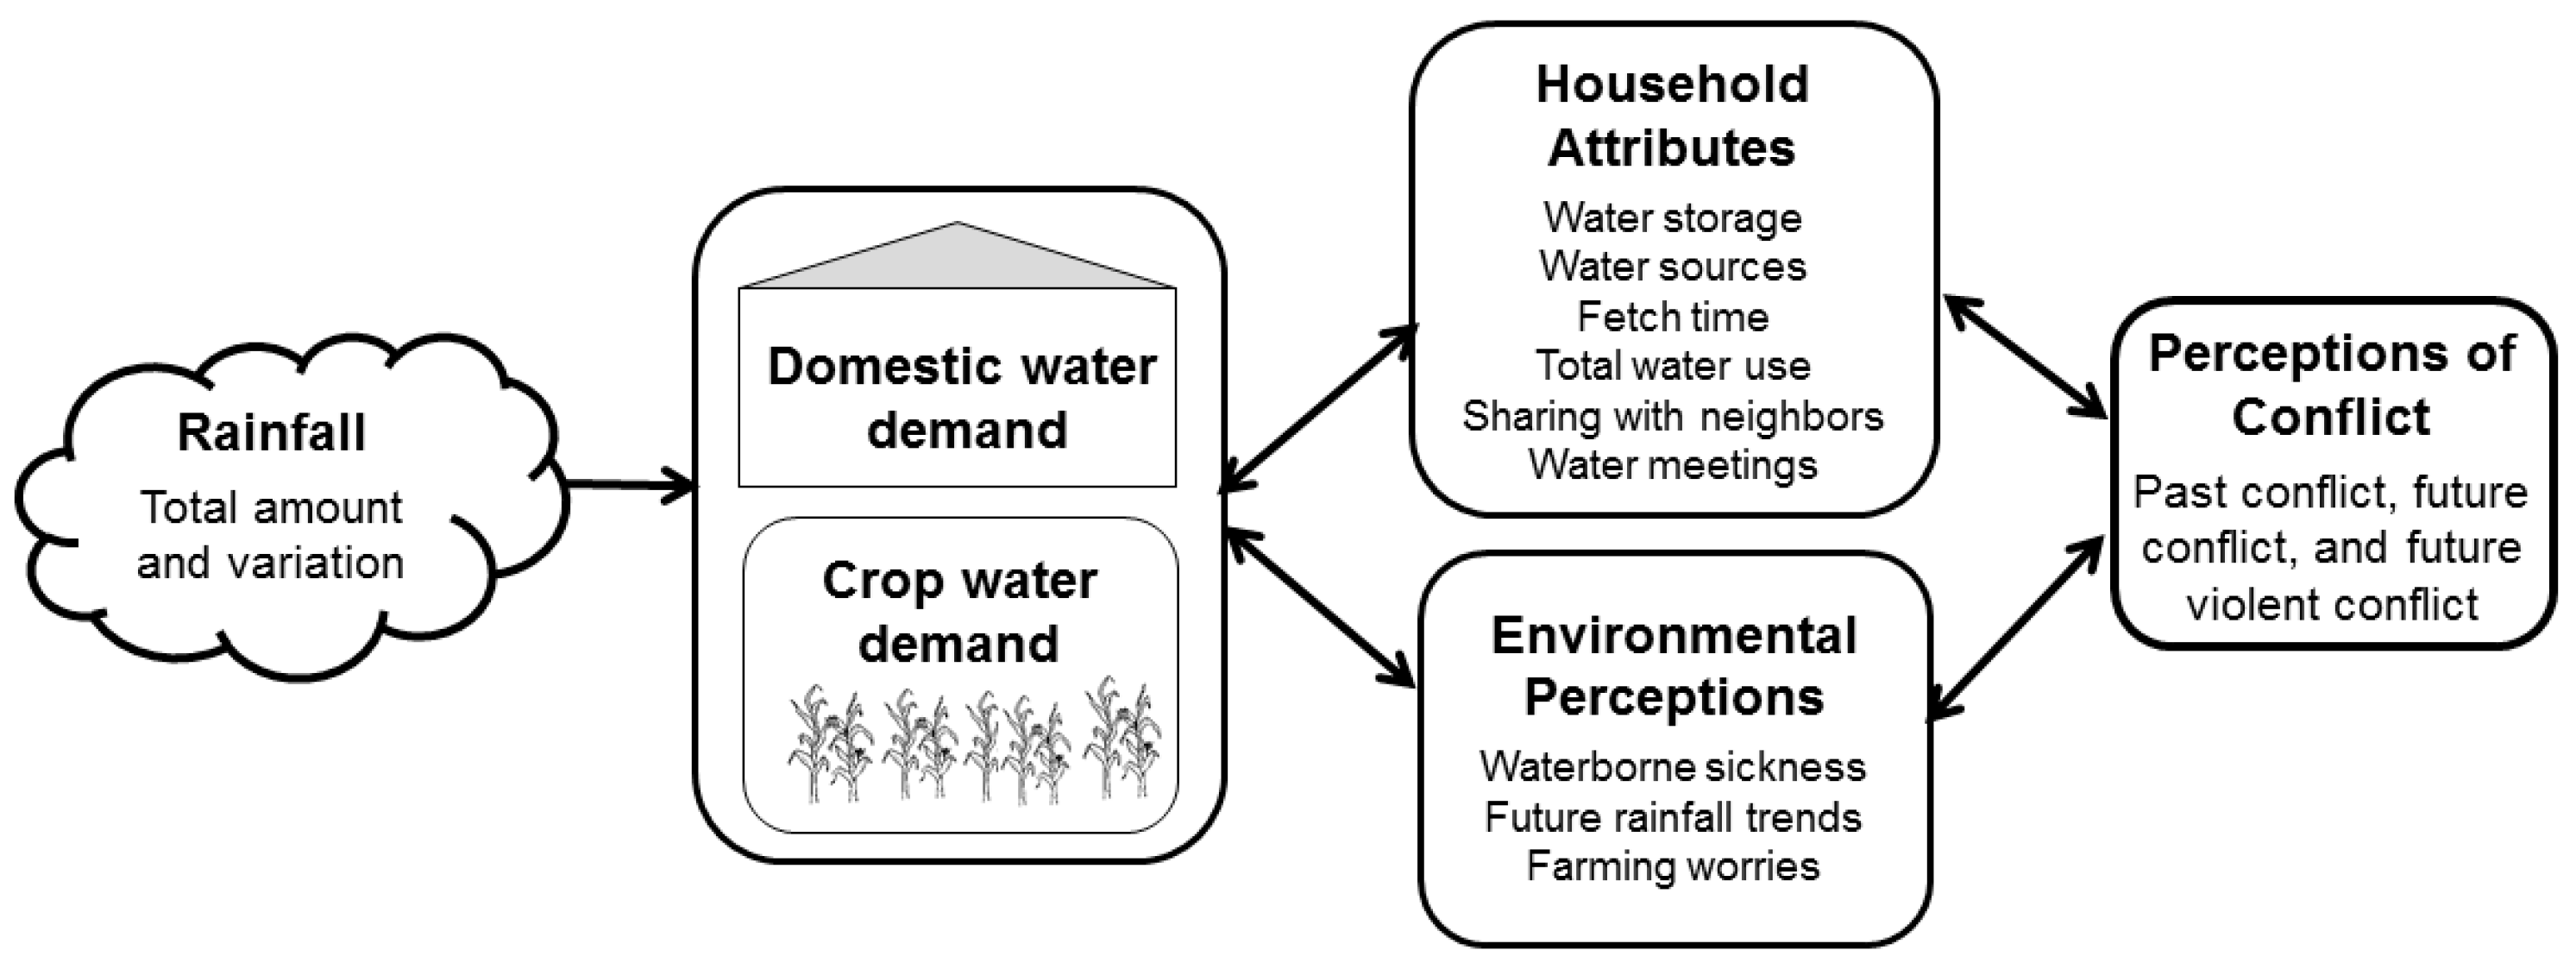
  • Questions asking about water needs, specifically focusing on household, crop, and cattle water needs.
  • Questions on perceptions of rainfall trends, capturing temporal variations, focusing on the past ten years, last year, and next year.
Informed consent was received from all respondents and respondents were not paid for their participation in our study. See online Supplementary Materials for the survey instrument and anonymized data set.

2.4. Respondent Characteristics

In total, 224 households were surveyed, across an area of approximately 4000 square kilometers. Of these, 59.8% of respondents were male, and the average age was 48 years (SD = 15.5 years). Education levels varied from no formal education to college graduate with a standard deviation of 3.4 grade levels and an average level of Grades 7–8 being completed.
The main water sources respondents reported having access to were ponds (70.1%), communal boreholes (67.4%), and rivers or streams (46.0%). Note that respondents were asked to identify all water sources that apply so the sum of all categories is therefore greater than 100%. Only 5.8% said they had access to private boreholes, 4.0% to communal wells, 13.8% to private wells, and 21.4% to dams. Boreholes are narrow vertical shafts drilled using mechanized means with an encased pipe through which water is pumped up by hand. Wells are usually hand dug and lined by bricks or stone from which water is manually drawn up. Wells are more prone to surface contamination depending on surface covering compared to boreholes, but both boreholes and wells are subject to groundwater contamination.
Median water use per household per day was 140 L or 20.9 L per person, and average trip time spent fetching water both ways per household (no respondent households were tap fed) was 111 min (median 60 min), and 14 min per person per day. Total storage capacity per household for our sample was 239.4 L (with a median 160 L), as aggregated by totaling the number of portable storage containers. See File S1 to review the full dataset.

2.5. Ethical Approval and Informed Consent

Indiana University’s Institutional Review Board (IRB) reviewed and approved methods used in this research. IRB-approved informed consent was obtained in verbal and written form. The interviewer read the informed consent statement to participants; participants acknowledged consent verbally and by signing the consent document.

3. Results

3.1. Overview

Perceptions of past conflict, future conflict, and future physical violent conflict were analyzed to understand how perceptions of water access and availability influence perceptions of conflict using the following key survey questions:
(a)
Respondent’s definition of conflict: “How would you define conflict (kuzwangana)?”
(b)
Past conflict: “Based on your definition, have you observed conflict around your area in the past ten years?” (Yes, No)
(c)
Future conflict: “Based on your definition, do you expect any forms of conflict around your area in the next ten years?” (Yes, No)
(d)
Future physical violent conflict: “Do you expect any physical violence in the next ten years?” (Yes, No)
If the response to question b, c, or d was “Yes”, then a succession of follow-up questions was asked to investigate the source, type, and impacts of the conflict observed.
The remainder of this section presents results which can be divided into two focal areas: (1) definitions and sources of conflict and (2) modeling perceptions of conflict.

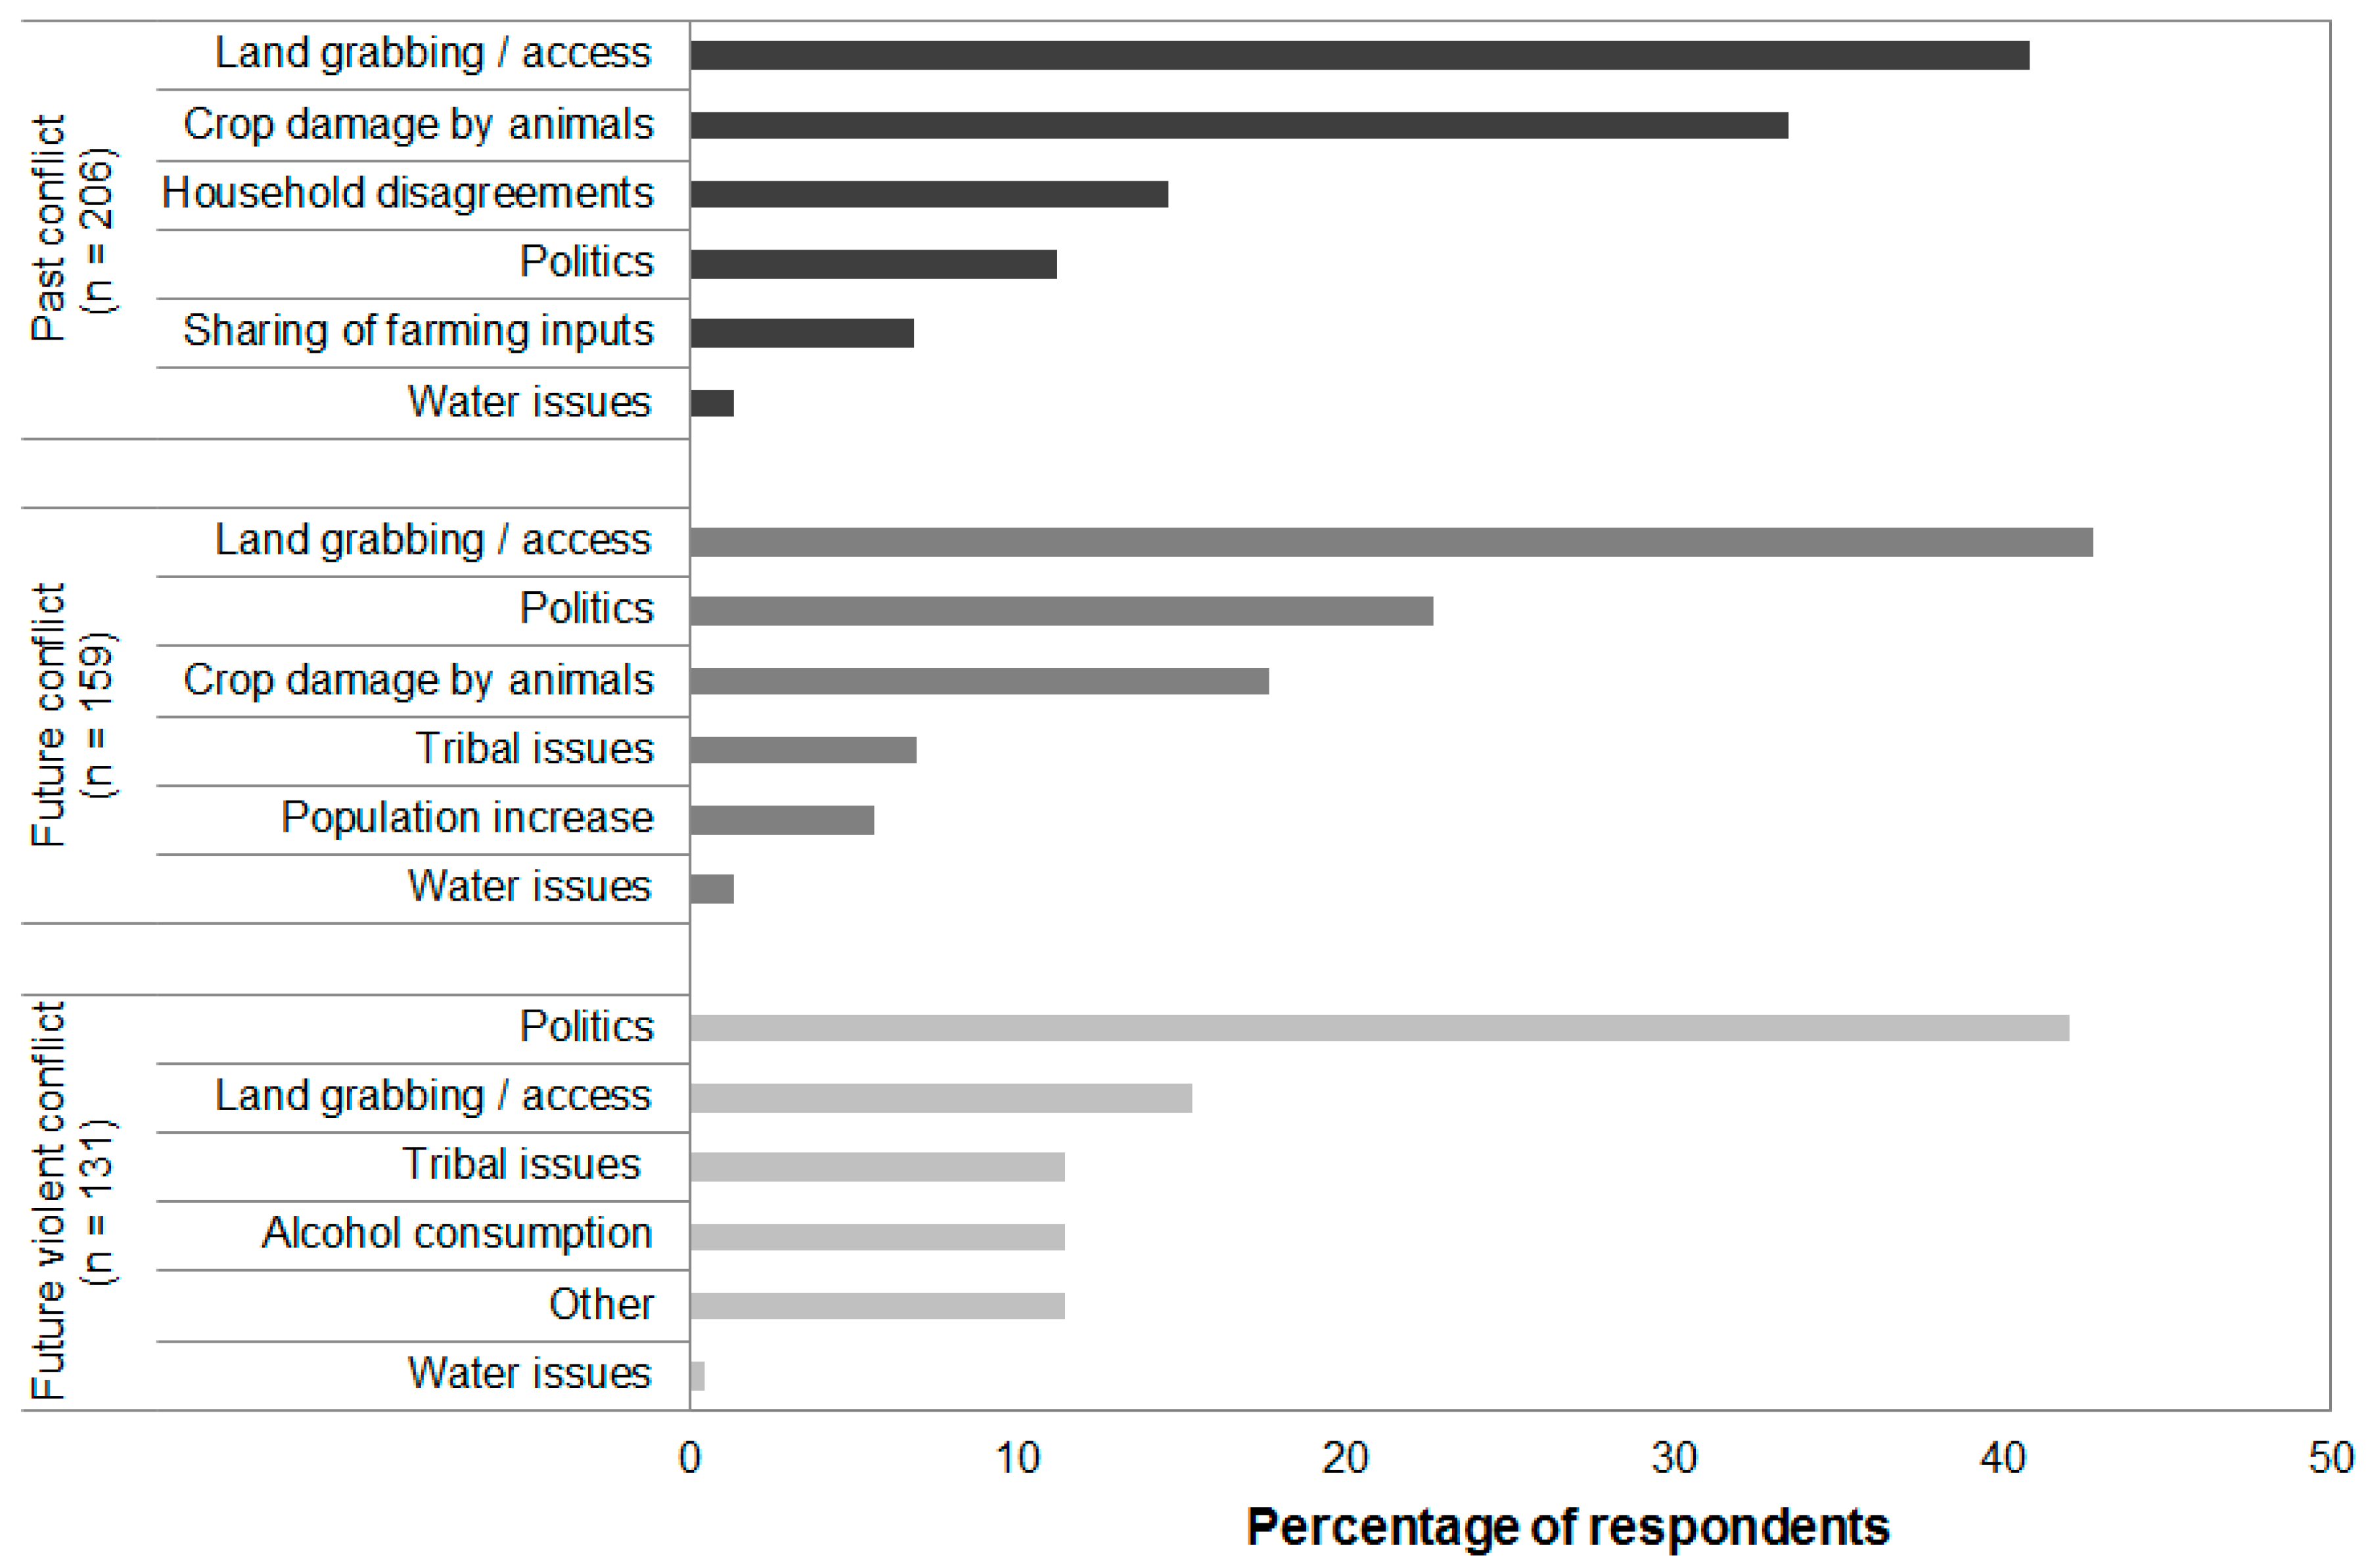
3.2. Definition and Sources of Conflict

Respondents’ perceptions of—and experience with—‘conflict’ can be especially difficult to measure as it has varied manifestations, both violent and nonviolent. To determine what our respondent’s perception of conflict entailed, we used one open-ended question to elicit their personal definition of conflict. This was done to understand the cultural context of conflict and to make sure that the enumerator and respondent were using a shared definition when discussing conflict and violent conflict. The open-ended responses, shown in Table 1, were coded using the first two responses from respondents. Two separate coders coded each response and the interrater reliability was high (κ = 0.91). The responses are direct translations from Tonga to English. Misunderstanding, miscommunicating, or not getting along refers to occurrences of verbal or nonverbal conflicts between individuals or groups; verbal fighting or arguing refers to escalated, verbal incursions between individuals or groups; and absence of peace refers to a feeling and/or observation of disruption or unsettledness in the community.
When prompted to provide a personal definition of conflict, 74.6% of respondents described conflict as misunderstandings or miscommunication, rather than more violent manifestations. In fact, no respondent provided a definition that contained any reference to armed violent conflict. These results show the low incidence rate of experience with violent conflict locally. Given this somewhat unique local definition of conflict, our survey drilled into this characterization by asking about sources of experienced conflict and if the respondents anticipated future physical violent conflict to occur.
The majority of respondents (91.1%) reported observing conflict in the past ten years; 70.1% expected to observe conflict in the next ten years; and 57.6% expected to observe physical violent conflict in the next ten years. Of those who reported observing conflict in the past ten years, 70% reported verbal conflict, 7.2% reported physical conflict, and 22.9% reported verbal and physical conflict. Of those expecting conflict in the next ten years, 54.1% expected verbal conflict, 17.8% expected physical conflict, and 24.8% verbal and physical conflict. Respondent-generated definitions of conflict did not contain physical manifestations of conflict; despite this, a third of respondents reported observing some form of physical conflict in the past ten years and more than half expect to observe physical violence in the next ten years.
Figure 4 shows the top five reported sources of past conflict, future conflict, and future physical violent conflict, as well as the number of respondents reporting water-related issues as a source of conflict. Two coders independently coded the open-ended data after going through an initial set of 30 surveys to come up with the final categories (interrater reliability indicates high agreement (κ = 0.81 to 0.96)).
The sources of conflict reported identify several key differences between past conflict, future conflict, and future physical violent conflict. First, the reported sources of conflict are not uniformly consistent across the three questions. There is a distinct shift in source of conflict as the question moved to future physical violent conflict, where land grabbing is replaced by politics as the top source of conflict. In our study context, land grabbing conflicts can occur as a result of land allocations not meeting a respondent’s needs or expectations (which are often controlled by the village Headman), or due to boundary encroachments by a neighbor since most land is not fenced, making property line delineations difficult. Political conflict can occur as a result of ideological differences that manifest as verbal clashes with the potential for physical altercations or political rallies that result in physical violence. These are respondent-generated characterizations drawn from frequently recurring responses to open-ended questions.
Surprisingly, Figure 4 also shows that water issues were not reported as an important source of past or future conflict. We include it in Figure 4 to facilitate discussion in subsequent sections.

3.3. Modeling Perceptions of Water Needs, Conflict, and Violence

We use logistic regression to model responses to the three (Yes/No) questions about experience with past conflict, and expectations of future conflict, and future physical violence. These models are used to explore possible correlates to conflict and violence. The model is not intended to predict whether conflict or violence will occur; instead, this procedure is intended to evaluate the strength and impact of perceptions of water scarcity and other independent variables on perceived conflict. The value of conducting this procedure in this way is in the comparisons that can be made between independent variables within each model, and then comparisons between each model. Given the nested nature of the data (four respondents per zone, eight zones per camp, eight camps), we also ran a random effects hierarchical logistic regression, but the results are nearly identical and the simpler logistic regression model demonstrates better fit.

3.4. Independent Variables Used in the Model

The independent variables included in our regression model reflect the variables listed in our conceptual model shown in Figure 1. We include perceptions of household and crop water needs being met (rainfall and water demand variables), perceptions of local environmental conditions such as incidence of sickness from drinking water and expectations for future rainfall trends, household attributes such as access to water storage, and demographic variables to account for differences between our respondents such as their age or gender. We describe each of these variables below to make clear how we measured each variable, what we think the variable represents, and how we expect the variable to impact our dependent variable(s).
Past and future crop water needs being met: Respondents were asked whether or not they thought that their crop water needs had been met in the past ten years, if they were met this year, and if they thought they would be met next year. The crop water needs of rain fed agriculturalists are satisfied solely by precipitation. There are many factors that affect whether these needs have been met by precipitation. For example, how much total rain has fallen? Has the rainfall been consistent or variable? Smallholder farmers rely heavily on their field crop production for subsistence and income earned through excess produce being sold at market. Therefore, field crop productivity directly affects household economic mobility and socioeconomic status [10,37]. All of these factors combined have the potential to impact social and violent conflict [3,11,18,20,21].
Past and future household water needs being met: Household water needs range from drinking water needs to water for cooking and cleaning. Water used for household needs can be extracted from either ground or surface water resources. Similar to crop water needs, respondents were asked whether or not they thought their household water needs had been met over the past ten years, whether they were currently being met, and if they thought they would be met next year or not.
These two factors, past and future crop and household water needs, capture perceptions of basic water needs and differentiates water access by its end use, as shown in Table 2. A household’s water needs not being met can negatively impact their desire to undertake conflict activities in pursuit of water resources, opting instead to maintain collaborative relationships [50]. Needs not being met may also positively impact the potential for conflict activities in pursuit of water [5,18,29].
Water as a general worry and water as a farming worry: Respondents were asked in two open-ended questions to list their general worries and then their worries specific to farming. The open-ended responses for these two questions were used to create two dichotomous variables measuring worries related to access to water and worries related to farm water. Access to water is coded 1 if the respondent was generally worried about access to water or coded 0 if not. Similarly, Farm water is coded 1 if the respondent stated that they worried about water for farming or 0 if not. A state of worry or anxiety can affect an individual’s decision-making, can be a form of intra-personal conflict, and can increase the likelihood of participation in other forms of conflict [22]. Of our respondents, 22.8% said they were generally worried about water, 26.3% were worried about water specifically for farming, 58% did not report either one as a worry, and 7.1% said they were worried about both. To note, 48.7% of people reported that water is a source of anxiety for their household, and 72.8% said the same for their community, although we chose not to include these potentially closely related variables in our model.
Rainfall decrease in future: Past research has demonstrated that decreases in rainfall and extended droughts have the potential to trigger increased incidence rates of violent conflict [7,27,30,51]. Respondents were asked how they thought the annual rainfall amount would change next year compared to last year, with response options of increased rainfall, decreased rainfall, or no change in rainfall. In response, 57.6% expected rain to decrease, 1.8% expected no change, and 40.6% expected rain to increase. Figure 5 shows the change in annual rainfall amounts over the past ten years as measured at the ZARI Mochipapa station near Choma, and weekly rainfall amounts for the 2014–2015 farming season from the same location. Annual totals are calculated from 1 July to 30 June, placing the single rain season in the center of the period. Totals are reported using the year they end in; for example, for 2015, we use the 2014–2015 cycle. Note that crop yield is not only affected by the total amount of annual rainfall, but also when and in what quantities the rains come. This intra-annual variation, shown in Figure 5B while very important, is not captured by the variable “rainfall amount in future”.
Figure 5A shows a cross-section of precipitation change and depicts: (1) the ten year period that is asked about in the survey questions (dark vertical bars, black trend line) (2) a fifteen year period that includes the five years immediately prior to the surveyed time period (all vertical bars, light gray trend line). The intent of this figure is not to demonstrate a climatological shift, but rather to convey the occurrence of an acute weather phenomenon and evaluate potentially correlated perceptions of the study respondents. The ten year time period is intended to encompass a long enough period that a single year will not skew the assessed period, but recent enough that respondent recollections are reliable. The 15-year period is depicted to disclose any potential resonance or lag effect from precipitation variation that may be present in the ten year, survey period of interest.
Sickness: Respondents were asked if they, or any of their family members, have ever become sick from drinking water. This dichotomous variable does not provide the actual incidence of waterborne sickness in the study area, but rather respondents’ perceptions of encountering waterborne sickness. In total, 33.0% of respondents reported that their household had experienced sickness, with the majority stating that this had occurred in the past two years (96.0%) and that the source of the water that they consumed that lead to their sickness was a pond or stream (93.2%). When asked what symptoms arose from their experienced illness, 97.3% of respondents said diarrhea. It is estimated that diarrhea is responsible for 7.7% of all deaths annually on the African continent [53]. Nutrition loss due to diarrhea increases the risk of malnutrition and other health issues, particularly for infants and the elderly [12,53]. The impact of sickness could degrade standard of living, leading to an increase in intra-personal stress and potential for conflict.
Attends water meetings: Local water governance and management meetings are commonly held within each rural village. In general, each village has a water committee that reports to the village headman. Respondents were asked whether or not they attended community meetings where water issues are discussed; “Attends water meetings” is coded 1 if the respondent stated they attended meetings or 0 if not. These forums allow for water issues to be discussed and solutions facilitated by community leaders in an immediate and visible manner. Such a forum can act as a dispute resolution mechanism and allow for locally tailored solutions to water issues [50]. Given farmers may only attend water meetings if they face a water related issue; we choose to include this variable in our model. In our sample, 70.1% of respondents reported attending water meetings, with a mean frequency of attending 6.6 meetings per year (Median = 3 meetings, SD = 8.2 meetings).
Past and future water disputes: Respondents were asked if they had observed water disputes in the past ten years. Next, they were asked if in the next ten years they expected disputes over water to decrease, increase, or see no change. A water dispute, particularly those occurring at an increased frequency, can lead to further unrest and an increased rate of conflict occurring. The specification of water as the source of the dispute explores directly whether water is observed as a source of friction. Despite less than two percent of respondents naming water as a source of conflict (see Figure 4), 57.6% reported observing a dispute over water. Perceptions of future water disputes can also indicate respondent’s sense and expectation of water security. Respondent expectations’ for future water disputes were: 21.4% expected a decrease, 30.8% expected no change, and 47.8% expected an increase.
Water use per person per day: Respondents were asked to estimate how many liters of water their household consumes each day. Their estimates were used to calculate a per capita use value by dividing their estimate by the total number of members reported to be living at their household (# of liters total/# of household members). The more water used per person potentially indicates greater access to water resources and indicates an expected lower incidence of water stress or water issues arising for household water needs.
Water fetch time per person per day: Respondents were asked how many trips their household makes each day to fetch water, the time it takes in minutes to travel to their main water source, and how many members live at their household. These three variables were used to calculate the time spent fetching water each day per person (# of trips × time per round-trip/# of household members). The more time a household has to spend fetching water, the more likely they are to feel the impacts of water scarcity on household activities and needs [2,8]. Additionally, time spent fetching water detracts from time that could be spent pursuing economic activities such as farming and gardening, or educational pursuits for young children [54].
Distance to Choma: The Euclidian distance (the straight-line distance) calculated from the household location of each respondent to the center of Choma Town (Figure 2). This variable is a proxy for how far the respondent has to travel to be able to access the town and the services available there (which includes the access to government services, a large market where most sell their goods and purchase manufactured items, etc.). The furthest distance a respondent lived was 38.9 km; the average distance was 23.5 km (SD = 8.9 km).
Distance to Improved Surface Road (ISR): An ISR is defined as any road that is formed by gravel, concrete, asphalt, or other material and is maintained. The variable is a measure of the minimum distance a respondent has to travel in order to access a road. This variable is calculated by computing the Euclidean distance from the location of the household to the distance of the ISR from a shapefile of these roads in Choma [55]. This variable captures variation in access to transportation, and, consequently, other services such as access to health care, government services, etc. The average distance respondents lived from a road was 3.3 km (Median = 2.5, SD = 3.1 km).
Gender and Education: Gender is included because in Zambian rural culture, women interact directly with water more frequently than men [39]. This may result in women having a different understanding of water issues than men; however, there is not a clear theoretical hypothesis for the direction and impact of this relationship. A respondent’s level of education can affect their socio-economic position and their understanding of water use and adaptive strategies.

3.5. Model Results

Table 3 shows the model results for the logistic regressions predicting past conflict, future conflict, and future physical violence. To note, 91.1% of our sample has experienced past conflict, 70.1% expect to experience future conflict, and 57.6% expect to experience future physical violent conflict.
The only variable consistently significant across the three models is attends water meetings, implying if the respondent attended water meetings they were more likely to have experienced past conflict and expect to experience future conflict and future physical violent conflict. This result appears contradictory to the findings of past studies on informal mechanisms for resource management, attending meetings shares a positive relationship with conflict [35,56,57]. These studies showed that when communication or positive informal rules and social norms were present, more socially optimal outcomes were achieved. However, when interpreted through local-level contexts and understandings gained from open-ended questions, our results imply that respondents who are attending meetings may be doing so because they are the ones who are facing water issues and conflict. Therefore, this finding, rather than overturning past works, potentially reinforces their conclusions.
The regression models reveal other distinct differences in the relationship between water and conflict. For future conflict, having water as a general worry is positively correlated implying that, if a household is worried about water, generally they are more likely to expect future conflict. Similarly, if the respondent expects rains to decrease in the future, they are also more likely to expect future conflict. Households that use more water per person per day are also more likely to expect future conflict.
For future physical violent conflict, we find that having past and expected future crop water needs met is associated with increased expectations of future physical violent conflict. This is a surprising result. One post hoc explanation for this finding from interview notes is that only those farmers whose farming water needs have been met may have the time needed to participate in the reported sources of violent conflict such as politics; however, the validity of this conjecture cannot be confirmed by our study. Water as a farming worry, experiencing perceived waterborne sickness, expecting rains to decrease in the future, experiencing past water disputes, and expecting future water disputes are all positively associated with increased expectations of future physical violent conflict.
Water as a source of conflict did not arise from the open-ended question results shown in Figure 4, but does emerge in our modeling results for future conflict and future physical violent conflict. For example, if a respondent believes that the total rainfall amount next year will decrease, they are 2.3 times more likely to expect to observe conflict in the future and are 5.9 times more likely to expect to observe future physical violent conflict (these odds ratio values are found by computing the inverse of the natural log of the regression coefficient for the variable rains decrease in future is 2.3 = e0.83). Thus, even though respondents do not think of water access as a direct source of conflict or violence, the models show that perceptions of water access (such as rains decreasing) are strongly associated with expectations of future conflict and future physical violent conflict.

4. Discussion

In this study, we investigate the relationship between water and conflict in southern Zambia by employing household surveys that used both open- and closed-ended questions. This research provides a more nuanced analysis of conflict through respondent-defined perceptions of different types of conflict. We find many interesting patterns in the data. Our results show the main definition of conflict provided by our respondents is misunderstandings or miscommunication rather than armed struggle or violence, which makes sense given Zambia’s relative stability over the past several decades as discussed in the introduction. That said, 91.1% of our sample has experienced past conflict, 70.1% expect to experience future conflict, and 57.6% expect to experience future physical violent conflict. Respondent-generated definitions of conflict did not contain physical manifestations of conflict; despite this, 30.1% reported observing physical conflict in the past ten years, 42.6% expect to observe physical conflict in the next ten years and, when specified as future physical violence in the next ten years, that number increases to 57.6%. This result reveals a disparity between respondents’ understanding or mental framework of conflict and their perceptions of past and future physical conflicts. Why this disparity exists is beyond the scope of this study, but it is important to note this difference given our interest in individual understandings of conflict and its relationship to perceptions of water issues.
In the regression models evaluating conflict and violence and their correlates, we find significant positive relationships between expectations of rainfall decreasing in the future and expectations of future conflict and future physical violent conflict. These variables—water as a farming worry, experiencing perceived waterborne sickness, expecting rains to decrease in the future, experiencing past water disputes, and expecting future water disputes—are all positively associated with increased expectations of future physical violent conflict. These correlates provide further context to the potential psychological connections between water scarcity and conflict, but require further investigation to move beyond just correlations. However, in the context of southern Zambia, we do find that a robust link between perceptions of water scarcity and expectations of future physical violent conflict exists among respondents.
Despite the presence of these relationships between water variables and conflict, and recent decreases and variations in precipitation (reference Figure 5A,B), respondents predominantly do not cite water related issues as sources of conflict and instead list other sources such as land grabbing, crop damage by animals, and politics (recall Figure 4). Surprisingly, this result is at odds with the findings of the regression models and may be indicative of several potential circumstances, as conceptualized in Figure 1, that include: the presence of intervening factors in the chain between perceiving experienced water scarcity potential conflict (e.g., having water storage capacity) and local cultural or historical norms that impact perceptions of water scarcity. This list is not exhaustive, but supporting evidence can be found in our data. For example, respondents frequently stated what is known to be a common, local adage: “Water is life.” This statement represents an understanding that water is for all to share and should not be denied to a person. While this does not always hold true and respondents discussed violations of this stance (and it does not exactly apply to precipitation for crop needs), it is symbolic of a local disposition. This is especially interesting considering that similar adages do not exist for the sharing of land or political beliefs; the most frequently reported sources of conflict. Additionally, respondents often discussed how, living in a semi-arid environment, potential water scarcity issues are nothing new. This is partially described in Table 2, particularly for the last ten years. This could lead to desensitization to potential water scarcity issues (a psychological response), or the development of other adaptive mechanisms that attenuate the impacts of potential water scarcity issues (a social, cultural, or physical response). The final result is a set of mixed signals: respondents who report water as a general worry are 2.6 times more likely to expect future physical violent conflict; respondents who expect future rains to decrease are 5.9 times more likely to expect future physical violent conflict; however, less than 1.5% of respondents reported water issues as a source of past conflict, future conflict, or future physical violent conflict.
Perceived and actual adaptive capacity and vulnerability are important factors for perceived or expected conflict, as conceptualized in Figure 1. For example, if rainfall decreases and a farmer has access to crop irrigation, then they can more readily adapt their farming practice to water scarcity. Similarly, if rainfall decreases and a household has access to a borehole or piped water, then they face less vulnerability in the face of actual water scarcity. Local level contexts and adaptive capacities can influence an individual’s vulnerability to water scarcity. In the context of Southern Zambia, irrigation and piped water are mostly not available to smallholder farmers. As a result, smallholders are more vulnerable to variations in rainfall and water access. This does not mean that perceptions of decreased rainfall will lead to increased levels of conflict, as shown by water issues not being cited as a source of conflict by respondents (reference Figure 4), but our results do indicate that an individual’s perception of rainfall is a significant correlate in our regression results, as shown in Table 3.

5. Conclusions

The term “conflict” is frequently used in development research and in the media, but it is a term applied with many different meanings. Our research has shown that smallholders have diverse interpretations of what conflict is and the factors contributing to the increased potential for future conflict and violence. Zambia has experienced less violence than other African countries since independence, which may be related to the tendency for smallholders there to think of conflict more as misunderstandings than violence.
Relationships between environmental conditions and prevalence of conflict have been hypothesized and investigated by others through regional-scale studies of conflict. In general, these studies relate regional-scale precipitation patterns to aggregated statistics of conflict from secondary sources. Our research has explored this relationship at the household-level allowing us to directly relate household attributes and individual perceptions of environmental conditions to perceptions of conflict. This household-level approach allows us to get directly at how individual smallholders relate to water and conflict.
We have demonstrated that, while water is not reported as a primary source of conflict, perceptions of water needs not being met and the occurrence of water issues are strongly linked to expectations of future violent conflict occurring. How or why these perceptions are linked remains to be investigated, but, importantly, we demonstrate that they are significantly intertwined. Our approach also highlights a significant challenge of individual perceptions, in what factors come about by directly asking about sources of conflict as well as what emerges from the analysis. Future research is needed to parse out why perceptions of conflict are tied to perceptions of water in Choma District, despite water not being reported as a source of conflict. Our research affirms the fact that the water–conflict nexus is complex and opaque; our work has helped to bring this nexus into greater focus.

Supplementary Materials

The following are available online at https://www.mdpi.com/2071-1050/10/2/313/s1, File S1: Complete Dataset; File S2: Survey Instrument.

Acknowledgments

We thank our partners in the Zambian Agricultural Research Institute (ZARI) in Lusaka and Mochipapa. In particular, we thank Allan Chilenga and Kafula Chisanga for their valuable insights and assistance. We thank our enumerators, Godwin Siagande and Rose Kisananga, and each respondent who generously gave their time to completing the survey. We also thank Kurt Waldman, Paul McCord, and Yu Song for research assistance. This research was supported by funding from Indiana University Office of Sustainability who provided a Research Development Grant to Richard Marcantonio, and the National Science Foundation Water, Sustainability, Climate grant (SES 1360463).

Author Contributions

All three authors contributed to the article conceptualization, funding acquisition, methodology, resources, supervision, data visualization, and writing. Additionally Richard and Shahzeen provided data curation, formal analysis, and validation. Richard led data collection in Zambia.

Conflicts of Interest

The authors declare no conflicts of interest.

References and Notes

  1. Intergovernmental Panel on Climate Change (IPCC). Summary for policymakers. In Climate Change 2014: Impacts, Adaptation, and Vulnerability. Part A: Global and Sectoral Aspects; Field, C.B., Barros, V.R., Dokken, D.J., Mach, K.J., Mastrandrea, M.D., Bilir, T.E., Chatterjee, M., Ebi, K.L., Estrada, Y.O., Genova, R.C., et al., Eds.; Cambridge University Press: New York, NY, USA, 2014. [Google Scholar]
  2. UN-Water. Climate Change Adaptation: The Pivotal Role of Water; UN Water Program; United Nations: New York, NY, USA, 2010. [Google Scholar]
  3. Gemenne, F.; Barnett, J.; Adger, W.N.; Dabelko, G.D. Climate and security: Evidence, emerging risks, and a new agenda. Clim. Chang. 2014, 123, 1–9. [Google Scholar] [CrossRef]
  4. Gleditsch, N.P.; Wallensteen, P.; Eriksson, M.; Sollenberg, M.; Strand, H. Armed Conflict 1946–2001: A New Dataset. J. Peace Res. 2002, 39, 615–637. [Google Scholar] [CrossRef]
  5. Hsiang, S.M.; Meng, K.C. Reconciling Disagreement Over Climate-Conflict Results in Africa. Proc. Natl. Acad. Sci. USA 2014, 111, 2100–2103. [Google Scholar] [CrossRef] [PubMed]
  6. O’Loughlin, J.; Linke, A.M.; Witmer, F.D. Modeling and data choices sway conclusions about climate-conflict links. Proc. Natl. Acad. Sci. USA 2014, 111, 2054–2055. [Google Scholar] [CrossRef] [PubMed]
  7. Salehyan, I.; Hendrix, C.S. Climate shocks and political violence. Glob. Environ. Chang. 2014, 28, 239–250. [Google Scholar] [CrossRef]
  8. Carius, A.; Dabelko, G.D.; Wolf, A.T. The United Nations and Environmental Security: Water, Conlict, and Cooperation; Environmental Change and Security Program Report; United Nations: New York, NY, USA, 2004; Volume 10, pp. 60–66. [Google Scholar]
  9. Adger, W.N. Vulnerability. Glob. Environ. Chang. 2006, 16, 268–281. [Google Scholar] [CrossRef]
  10. Tschakert, P. Environmental services and poverty reduction: Options for smallholders in the Sahel. Agric. Syst. 2007, 94, 75–86. [Google Scholar] [CrossRef]
  11. Adger, W.N. Climate Change, Human Well-Being and Insecurity. New Political Econ. 2010, 15, 275–292. [Google Scholar] [CrossRef]
  12. Tirado, M.C.; Cohen, M.J.; Aberman, N.; Meerman, J.; Thompson, B. Addressing the challenges of climate change and biofuel production for food and nutrition security. Food Res. Int. 2010, 43, 1729–1744. [Google Scholar] [CrossRef]
  13. Intelligence Community Assessment (ICA). Intelligence Community Assessment: Global Food Security; Office of the Director of National Intelligence NIC, Ed.; Office of the Director of National Intelligence NIC: Washington, DC, USA, 2015; pp. 1–58.
  14. Hsiang, S.M.; Burke, M. Climate, conflict, and social stability: What does the evidence say? Clim. Chang. 2013, 123, 39–55. [Google Scholar] [CrossRef]
  15. Hsiang, S.M.; Burke, M.; Miguel, E. Quantifying the influence of climate on human conflict. Science 2013, 341, 1235367. [Google Scholar] [CrossRef] [PubMed]
  16. Hsiang, S.M.; Burke, M.; Miguel, E. Climate and conflict. Natl. Bur. Econ. Res. 2014, 7, 577–617. [Google Scholar]
  17. Hsiang, S.M.; Meng, K.C.; Cane, M.A. Civil conflicts are associated with the global climate. Nature 2011, 476, 438–441. [Google Scholar] [CrossRef] [PubMed]
  18. Homer-Dixon, T.F. On the Threshold: Environmental changes as causes of acute conflict. Int. Secur. 1991, 16, 76–116. [Google Scholar] [CrossRef]
  19. Ohlsson, L. Water Scarcity and Conflict. Int. Secur. Chall. Chang. World 1992, 3, 211–234. [Google Scholar]
  20. Ohlsson, L. Environmental Scarcity and Violent Conflict: The case of Rwanda. J. Environ. Dev. 1996, 5, 270–291. [Google Scholar]
  21. Percival, V.; Homer-Dixon, T.F. Environmental Scarcity and Violent Conflict: The Case of South Africa. J. Peace Res. 1998, 35, 279–298. [Google Scholar] [CrossRef]
  22. Krug, E.G.; Dahlberg, L.L.; Mercy, J.A.; Zwi, A.B.; Lozano, R. World Report on Violence and Health; World Health Organization: Geneva, Switzerland, 2002. [Google Scholar]
  23. Barnett, J.; Adger, W.N. Climate change, human security and violent conflict. Political Geogr. 2007, 26, 639–655. [Google Scholar] [CrossRef]
  24. Nordås, R.; Gleditsch, N.P. Climate change and conflict. Political Geogr. 2007, 26, 627–638. [Google Scholar] [CrossRef]
  25. Raleigh, C.; Urdal, H. Climate change, environmental degradation and armed conflict. Political Geogr. 2007, 26, 674–694. [Google Scholar] [CrossRef]
  26. Gizelis, T.-I.; Wooden, A.E. Water resources, institutions, & intrastate conflict. Political Geogr. 2010, 29, 444–453. [Google Scholar] [CrossRef]
  27. Devlin, C.; Hendrix, C.S. Trends and triggers redux: Climate change, rainfall, and interstate conflict. Political Geogr. 2014, 43, 27–39. [Google Scholar] [CrossRef]
  28. Von Uexkull, N. Sustained drought, vulnerability and civil conflict in Sub-Saharan Africa. Political Geogr. 2014, 43, 16–26. [Google Scholar] [CrossRef]
  29. Böhmelt, T.; Bernauer, T.; Buhaug, H.; Gleditsch, N.P.; Tribaldos, T.; Wischnath, G. Demand, supply, and restraint: Determinants of domestic water conflict and cooperation. Glob. Environ. Chang. 2014, 29, 337–348. [Google Scholar] [CrossRef]
  30. Kelley, C.P.; Mohtadi, S.; Cane, M.A.; Seager, R.; Kushnir, Y. Climate change in the Fertile Crescent and implications of the recent Syrian drought. Proc. Natl. Acad. Sci. USA 2015, 112, 3241–3246. [Google Scholar] [CrossRef] [PubMed]
  31. Buhaug, H.; Benaminsen, T.A.; Sjaastad, E.; Theisen, O.M. Climate variability, food production shocks, and violent conflict in Sub-Saharan Africa. Environ. Res. Lett. 2015, 10, 125015. [Google Scholar] [CrossRef]
  32. Salehyan, I. From Climate Change to Conflict? No Consensus Yet. J. Peace Res. 2008, 45, 315–326. [Google Scholar] [CrossRef]
  33. Salehyan, I.; Hendrix, C.S.; Hamner, J.; Case, C.; Linebarger, C.; Stull, E.; Williams, J. Social Conflict in Africa: A new database. Int. Interact. 2012, 38, 503–511. [Google Scholar] [CrossRef]
  34. Raleigh, C.; Linke, A.; Hegre, H.; Karlsen, J. Introducing ACLED-Armed Conflict Location and Event Data. J. Peace Res. 2010, 47, 651–660. [Google Scholar] [CrossRef]
  35. Linke, A.M.; O’Loughlin, J.; McCabe, J.T.; Tir, J.; Witmer, F.D.W. Rainfall variability and violence in rural Kenya: Investigating the effects of drought and the role of local institutions with survey data. Glob. Environ. Chang. Hum. Policy Dimens. 2015, 34, 35–47. [Google Scholar] [CrossRef]
  36. Tschakert, P. The costs of soil carbon sequestration: An economic analysis for small-scale farming systems in Senegal. Agric. Syst. 2004, 81, 227–253. [Google Scholar] [CrossRef]
  37. Tschakert, P. Views from the vulnerable: Understanding climatic and other stressors in the Sahel. Glob. Environ. Chang. 2007, 17, 381–396. [Google Scholar] [CrossRef]
  38. Adams, W.M.; Brockington, D.; Dyson, J.; Vira, B. Managing tragedies: Understanding conflict over common pool resources. Science 2003, 302, 1915–1916. [Google Scholar] [CrossRef] [PubMed]
  39. Chisanga, K. Lack of Resilience in African Smallholder Farming: Exploring Measures to Enhance the Adaptive Capacity of Local Communities to Pressures of Climate Change; Zambian Agricultural Research Institute: Choma, Zambia, 2008. [Google Scholar]
  40. Stern, R.D.; Cooper, P.J.M. Assessing Climate Risk and Climate Change Using Rainfall Data—A Case Study from Zambia. Exp. Agric. 2011, 47, 241–266. [Google Scholar] [CrossRef]
  41. Milgroom, J.; Giller, K.E. Courting the rain: Rethinking seasonality and adaptation to recurrent drought in semi-arid southern Africa. Agric. Syst. 2013, 118, 91–104. [Google Scholar] [CrossRef]
  42. Mekonnen, M.M.; Hoekstra, A.Y. Four billion people facing severe water scarcity. Sci. Adv. 2016, 2, 1–6. [Google Scholar]
  43. Galtung, J. Violence, Peace, and Peace Research. J. Peace Res. 1969, 6, 167–191. [Google Scholar] [CrossRef]
  44. Galtung, J. Structural and Direct Violence: A note on operationalization. J. Peace Res. 1971, 8, 73–76. [Google Scholar] [CrossRef]
  45. Galtung, J. Cultural Violence. J. Peace Res. 1990, 27, 291–305. [Google Scholar] [CrossRef]
  46. District Agricultural Coordination Office (DACO). Choma District Farmer Register; District Agricultural Coordination Office: Choma, Zambia, 2015.
  47. Central Statistical Office (CSO). 2010 Republic of Zambia Census of Population and Housing; Zambia Central Statistical Office, Ed.; Zambia Central Statistical Office: Lusaka, Zambia, 2010.
  48. MoA, Zambian Ministry of Agriculture and Livestock: Structure and Organizaiton of the Department.
  49. Food and Agricultural Organization (FAO). Farmer Input Support Response Initiative (FISRI) to Rising Prices of Commodities in Zambia; Food and Agricultural Organization: Rome, Italy, 2009. [Google Scholar]
  50. Funder, M.; Bustamante, R.; Cossio, V.; Huong, P.T.M.; van Koppen, B.; Mweemba, C.; Nyambe, I.; Phuong, L.T.T.; Skielboe, T. Strategies of the Poorest in Local Water Conflict and Cooperation: Evidence from Vietnam, Bolivia, and Zambia. Water Altern. 2012, 5, 20–36. [Google Scholar]
  51. Hendrix, C.S.; Glaser, S.M. Trends and triggers: Climate, climate change and civil conflict in Sub-Saharan Africa. Political Geogr. 2007, 26, 695–715. [Google Scholar] [CrossRef]
  52. ZARI. Daily Precipitation Data for 2001–2015: Mochipapa Research Station; Zambian Agricultural Research Institute: Choma, Zambia, 2015.
  53. World Health Organization (WHO). Water-Related Diseases. Available online: http://www.who.int/water_sanitation_health/diseases-risk/diseases/diarrhoea/en/ (accessed on 14 December 2016).
  54. Falkenmark, M.; Berntell, A.; Jagerskog, A.; Lundqvist, J.; Matz, M.; Tropp, H. On the Verge of a New Water Scarcity: A Call for Good Governance and Human Ingenuity; Stockholm International Water Institute: Stockholm, Sweden, 2007. [Google Scholar]
  55. Provincial Agricultural Coordination Office (PACO). Southern Province Roads; Provincial Agricultural Coordination Office: Southern Province, Zambia, 2015.
  56. Gardner, R.; Ostrom, E.; Walker, J.M. The Nature of Common-Pool Resource Problems. Ration. Soc. 1990, 2, 335–358. [Google Scholar] [CrossRef]
  57. Cardenas, J.C. Social Norms and Behavior in the Local Commons as Seen Through the Lens of Field Experiments. Environ. Resour. Econ. 2011, 48, 451–485. [Google Scholar] [CrossRef]
Figure 1. Conceptual Model. Our conceptual approach showing how reliance on rainfall could lead to potential for conflict. Our model includes several social and physical mechanisms that can increase or decrease an individual’s actual or perceived adaptive potential and vulnerability.
Sustainability 10 00313 g001
Figure 2. Map of Study Area. Represented are household locations of each respondent in our sample, including the name and location of each of the seven Camps in our sampling area. Also included are other features such as presence of improved surface roads and the location of the Zambian Agricultural Research Institute (ZARI) Mochipapa research station.
Sustainability 10 00313 g002
Figure 3. Study Timeline. Timeline for rains, general farming stages, and our actual data collection in the field. To note, our study began in the post-harvest season.
Sustainability 10 00313 g003
Figure 4. Sources of conflict and violence. This figure displays the top sources of past conflict, future conflict, and future physical violent conflict where the top five categories are reported in addition to the number of respondents reporting water-related sources.
Sustainability 10 00313 g004
Figure 5. Rainfall data for Choma. Rainfall data showing annual and weekly variation from the Mochipapa Zambian Agricultural Research Station, which is centrally located in the study area (see Figure 2). (A) Shows the annual rainfall amounts over the past fifteen years (light gray trend line), as well as for the past ten years (black trend line). (B) Shows that the rainfall has significant variation in the growing season (dry-spells) that can lead to crop failure [52].
Sustainability 10 00313 g005
Table 1. Respondent definitions of conflict.
Definition of ConflictPercentage of Respondents
Misunderstanding, miscommunicating, or not getting along74.6
Verbal fighting or arguing between individuals13.4
Absence of peace8.5
Other3.5
Results of the sum of the first two definitions of conflict provided by respondents.
Table 2. Water needs met or not.
Time PeriodCrop Water NeedsHousehold Water Needs
Past ten years63.8%50.5%
Last year3.6%57.6%
Next year47.8%58.0%
Percentage of households reporting whether their crop and household water needs and crop water needs were met over the past ten years, last year, and if they thought they would be met next year.
Table 3. Parameter estimates for the three conflict models.
ParametersPast ConflictFuture ConflictFuture Physical Violence
EstimateSEEstimateSEEstimateSE
Intercept0.2121.466−1.1280.986−4.540 ****1.110
Past crop water needs met−0.3410.703−0.3190.3870.811 **0.377
Future crop water needs met0.3280.6580.3140.4111.151 **0.466
Past household water needs met−0.0750.665−0.4120.3890.0590.371
Future household water needs met−0.4470.7540.0360.4110.1310.394
Water as a general worry1.6571.1420.824 *0.476−0.5720.414
Water as a farming worry1.0430.730−0.2630.3940.950 **0.404
Rains decrease in future0.9310.6470.839 **0.4261.884 ****0.477
Sickness1.1931.1320.5700.4341.148 ***0.417
Attends water meetings1.312 **0.5771.248 ****0.3690.794 **0.376
Past water disputes0.5210.624−0.2360.3780.780 **0.370
Future water disputes increase0.3020.7100.5270.3860.656 *0.386
Water use per person per day−0.0030.0260.052 ***0.0190.0240.016
Water fetch time per person per day0.0660.043−0.0020.0100.0060.009
Distance to Choma (km)−0.0210.036−0.0070.022−0.0060.021
Distance to Improved Surface Road (km)0.1200.111−0.0120.057−0.0380.060
Male1.064 *0.5880.1060.3610.1730.350
Education−0.0730.080−0.0110.0540.0600.053
(* p < 0.10, ** p < 0.05, *** p < 0.01, **** p < 0.001).

