A Taxonomy of Climate Accounting Principles for Financial Portfolios


1
Conservatoire National des Arts et Métiers/2° Investing Initiative, Am Kupfergraben 6a, 10117 Berlin, Germany
2
2° Investing Initiative, 205 East 42nd Street, NewYork, NY 10017, USA
3
2° Investing Initiative, Am Kupfergraben 6a, 10117 Berlin, Germany
*
Author to whom correspondence should be addressed.
Sustainability 2018, 10(2), 328; https://doi.org/10.3390/su10020328
Submission received: 31 December 2017
/
Revised: 23 January 2018
/
Accepted: 24 January 2018
/
Published: 27 January 2018
(This article belongs to the Special Issue Sustainable Finance)
Abstract
:Climate accounting for financial portfolios has seen growing prominence in the past years, thanks to both private and public sector initiatives. Over 200 financial institutions have conducted some form of portfolio analysis. In the context of this growing prominence, the academic and practitioner’s discussion of climate accounting has largely focused on questions of climate data quality and choices for estimation models. Missing in this debate is an analysis of the underlying accounting principles related to climate data. There is no overview of the climate accounting principles and the implications of choosing different principles and rules. This article provides a taxonomy of key accounting choices currently applied for climate accounting of financial portfolios, notably regarding units of accounting, boundaries of accounting, normalization rules, and allocation rules. Based on a review of data providers accounting approaches in practice, as well as sample applications of different accounting principles, it distills key accounting categories and highlights the potential sensitivity of the ultimate results to these choices. The article concludes that climate assessments of portfolios may be equally sensitive to accounting choices as to the quality of underlying data, suggesting more attention and standards are needed.
1. Introduction
Over the past five years, climate accounting in financial markets—defined here as the accounting of climate-related impacts underlying economic activity associated with financial instruments—has become a critical concern to financial institutions, policymakers, and civil society stakeholders. The origin of these frameworks sits with the development of the first carbon footprinting of listed equity portfolios in 2005/2006, pioneered by Henderson Global investors in partnership with Trucost, and Pictet AM with Inrate [1]. Over time, several new market entrants (e.g., South Pole Group, Ecofys, MSCI) started developing carbon footprinting frameworks [1].
Climate accounting among institutional investors began gaining momentum in 2014 with the Montreal Pledge launched by the UN Principles for Responsible Investment (UN PRI) [2]. Since its launch, over 120 investors representing over $10 trillion in assets under management have signed up to the Montreal Pledge, committing themselves to publishing the carbon footprint of their investment portfolios on an annual basis [3]. In addition to this international initiative, there are also several initiatives at country level, notably Sweden [4] and Netherlands [5].
In addition to private sector initiatives, policymakers have also increasingly focused on the question of climate accounting. In 2015, France passed the French Energy Transition Law, which under Art. 173 created a regulatory mandate for French investment managers and asset owners above a certain size to report on their ESG (environmental, social, governance) and climate management frameworks, their alignment with national and international climate goals, as well as climate-related financial risk [6,7]. Beyond legislative interventions, financial supervisors in the Netherlands, United Kingdom, and policymakers in Switzerland and Sweden have initiated supervisory climate analysis and related pilot projects [6,8,9]. At international level, the Financial Stability Board initiated a Task Force on Climate-Related Financial Disclosures set to define a climate reporting framework [10]. This has been coupled by research initiatives at universities around framing stress-tests and developing policy initiatives [11,12].
Despite this growing body of practitioner-driven literature on climate accounting [1,13,14,15], there is very limited academic literature on the underlying accounting frameworks, options, challenges, and shortcomings that govern these applications. Moreover, the literature that does exist tends to focus on data shortcomings [16]—in other words, the quality of underlying data—and questions of impact [17], rather than the accounting principles used in order to connect data related to climate impacts of economic activity to financial instruments. This paper seeks to identify some of the key accounting principles currently used in the context of climate accounting in financial markets and discuss their relative merits and applications. Crucially, the paper will place an emphasis on the underlying accounting principles deployed as they relate to climate accounting frameworks, specifically accounting rules related to the unit of accounting, normalization rules, allocation and consolidation rules, and accounting boundaries.
The discussion of the application of the related accounting rules and frameworks will focus on what is alternatively described in the academic and practitioner’s literature as ‘climate friendliness’, ‘climate performance’, or ‘climate alignment’ accounting [16]. The discussion will not extend to questions of climate risk accounting, although relevant issues related to risk will be flagged where appropriate. While climate risk measurement has its own set of challenges [18], the underlying accounting frameworks deployed in climate risk assessments tend to be consistent with the accounting rules applied more generally in financial risk assessment [11,19]. In addition, the paper will not discuss the question of corporate reporting and data availability related to financial instruments, except as it relates to questions of accounting boundaries.
The paper is thus specifically designed to focus on accounting challenges as they relate to climate assessments of financial portfolios. Crucially, most of the reporting guidance focuses on questions of choices of datasets and perhaps to questions of units of accounting and data estimation techniques, as opposed to underlying accounting techniques. It is this gap that this article seeks to fill. Indeed, as this article will demonstrate, even though most of the attention in sustainability accounting relates to the availability and quality of underlying sustainability data, the accounting of this data can be an equally significant challenge.
The paper is structured as follows. Section 2 will discuss the materials and methods employed for the analysis. Section 3 will summarize the results of the analysis for each individual accounting aspect briefly set out above. Section 4 will discuss the findings in the broader context of climate strategies and the potential way forward on climate accounting.
2. Materials and Methods
The analysis of accounting principles is based on a combination of empirical as well as theoretical sources. In providing an analysis of climate accounting principles, this article builds on a range of sources highlighted below.
One of the core sources involves a literature review of market studies related to climate accounting services provided by data providers and consultants, two of which the lead author was involved in writing [1,18]. These market studies provide a holistic overview of climate accounting principles as applied by investors, since all investors engaged in climate accounting rely in one form or another on the services from data providers and consultants covered in these market studies. As a result, an analysis of these services provides a relatively comprehensive overview of the state of accounting and data principles applied by investors. Given evolutions in markets, where necessary the article complements the market review with additional information with more recent developments.
In addition to analyzing the ‘supply’ of climate accounting, the article also builds on the engagement done by the authors with institutional investors. As part of this research, the author interviewed over 100 institutional investors as to their climate accounting approaches and conducted direct portfolio analysis with over 200 institutional investors as part of a EU-funded research project on 2 °C scenario analysis. For data confidentiality reasons, not all investors chose to disclose their participation in the scenario analysis pilot and/or the interviews. The interviews were not conducted as part of a specific research project and thus did not involve a specific questionnaire. As a result, the results of the analysis do not include quantitative findings from these interviews as to specific accounting preferences or choices. Indeed, the technical analysis of accounting choices is not influenced by popularity, but technical applicability. As a result, the integration of the learnings from these interviews involves where relevant a discussion of approaches (anonymized where required) regarding accounting principles, as well as caveats or challenges identified in these interviews. This material ensures a comprehensive coverage of approaches as the relate to accounting principles and can identify challenges not necessarily arrived at through a theoretical review of accounting principles. At the same time, as highlighted above, these interviews do not satisfy standards of rigor to inform any conclusions independently or derive quantitative findings.
The third source involves the technical application using sample climate and financial data for the purpose of illustration and ‘testing’ of approaches, in order to either illustrate the implications of using different accounting rules and/or the feasibility of one or the other approach. The data here relies on Bloomberg financial data and carbon footprint data, sourced from annual reports, as well as third party data sources where relevant. The relevant data sources are discussed in further detail in the results section.
The point of departure for the choice of accounting principles reviewed in this article is governed by the key principles found in traditional accounting frameworks (GAAP, IFRS) and broadened to reflect the key accounting debates as they relate to climate impact issues, notably allocating responsibilities [20] and the impact boundaries. At the same time, questions like the temporal and operational boundaries, etc. can be found in traditional accounting frameworks.
3. Results
As outlined above, the key areas of analysis in terms of accounting principles relate to the unit of accounting, the normalization principles applied in order to arrive at performance benchmarks, the allocation and consolidation rules, and accounting boundaries.
3.1. Unit of Accounting
The unit of accounting is arguably the most basic element when it comes to accounting principles, and indeed the one that has received the most attention in the academic and practitioner’s literature. The accounting units are generally classified in three categories [13,15]: carbon footprinting, green/brown metrics, and climate scores. Each of these will be illustrated using the automobile manufacturer BMW as an illustrative example of their application.
Carbon footprinting is the most commonly used metric for climate friendliness and an integral part of the Montreal Pledge—a voluntary commitment framework launched by the PRI for the disclosure of the carbon footprint [3]. For 15 years, companies have used the Greenhouse Gas (GHG) Protocol (GHG Protocol) standard to calculate their carbon footprint [21]. Over 5000 companies in 2014 used the GHG Protocol approach to report to CDP (formerly Carbon Disclosure Project), with most reporting GHG emissions information [15]. Given the growth of such data over time, a large number of organizations use it to estimate and compare the carbon footprint for companies and their value chains and for portfolios of companies.
The key question for financial institutions is the carbon footprint of the portfolio, or the financed emissions. The 2° Investing Initiative reviewed the state of the art of such financed emissions methods in 2013, and the number of data providers has continued to grow since then, with a focus on listed equity (due to both the size of typical equity portfolios and data availability for listed companies) [1]. One key question for GHG emissions accounting relates to data quality [16] and the inability to capture low-carbon alternatives, which do not emit GHG.
According to Dupré et al. [15], “green/brown metrics are sector-specific indicators distinguishing between climate solutions and climate problems. This category includes two main types of metrics: (1) ratios of exposure to different technologies or business lines and (2) sector-specific energy or emissions intensity/efficiency metrics.”
Finally, climate scores are qualitative indicators that combine quantitative and qualitative assessments to develop a scoring system.
The indicators will briefly be elaborated on a stylized example for all the three indicators using BMW as the case study. For the case study, each of the three groups of indicators will be reviewed, namely carbon footprint, green/brown shares, and qualitative climate scores.
The most common indicator is carbon footprinting. BMW’s GHG emissions reporting is among the most detailed in the world, breaking down Scope 1 (related to direct GHG emissions), Scope 2 (related to indirect GHG emissions associated with electricity and heat consumption) and Scope 3 (related to other indirect GHG emissions).
The challenge is that all these values are reported at group level and not connected to actual economic activities by BMW. Thus, the user of this information does not know how much GHG emissions are associated with any individual car sold, nor how each unit of GHG is broken down by business segment. BMW is the rare example where Scope 3 gets reported, which in the case of BMW make up around 95% of their GHG emissions (see 3.2 for a discussion of accounting boundaries). Currently, a significant share of GHG emissions data related to listed companies is estimated, even when considering just Scope 1 and Scope 2. The number gets even higher for Scope 3.
When shifting to green/brown shares, the problems are different, but the challenges remain similar. Aggregated ‘green’ shares for example as intermediated by data providers like FTSE Russell cannot discriminate between hybrid and electric vehicles, products with relatively significant different profiles.
Finally, there is qualitative reporting, which for all its upside in seeking to provide a ‘holistic’ picture, relies on qualitative assessments and weightings of several factors. Thus, a grading of BMW’s climate strategy independent of its operations may yield different results by different ESG data providers.
Generally, the most appropriate choice of indicator is a function of the purpose of the analysis, which can obviously differ widely. A few stylized conclusions may be relevant in this regard.
First, intuitively, quantitative indicators are needed for quantitative analyses. In other words, qualitative indicators are not appropriate where climate accounting is an intermediate step or input into financial risk or valuation models for example.
Second, if climate accounting is specifically designed to be an intermediate step for financial analysis, quantitative indicators—whether carbon footprint or green/brown metrics—need to be linked to economic activity. Without this linkage, the unit cannot be related to one of the key three inputs into financial analysis—price of the good, cost of the good, or the volume sold.
Third, more holistic use cases seeking to explore both the ‘negative’ and ‘positive’ climate impact likely need to resort to an alternative to carbon footprint, since this indicator by design only captures the ‘negative’.
Fourth, more subtle distinctions between different actors on the high-carbon side similarly may need to resort to indicators beyond the carbon footprint. For example, investors may take a different view—from a risk or climate alignment perspective—on the high-carbon activities of a company in the cement sector, for which the options regarding zero-carbon alternatives are more limited than for example the high-carbon activities of an electric utility, where the low-carbon alternatives are more accessible currently. Indeed, this distinction is reflected in ‘divest’ strategies from investors that generally do not extend to high-emitters in the industrial sectors, but rather focus on upstream fossil fuel sectors.
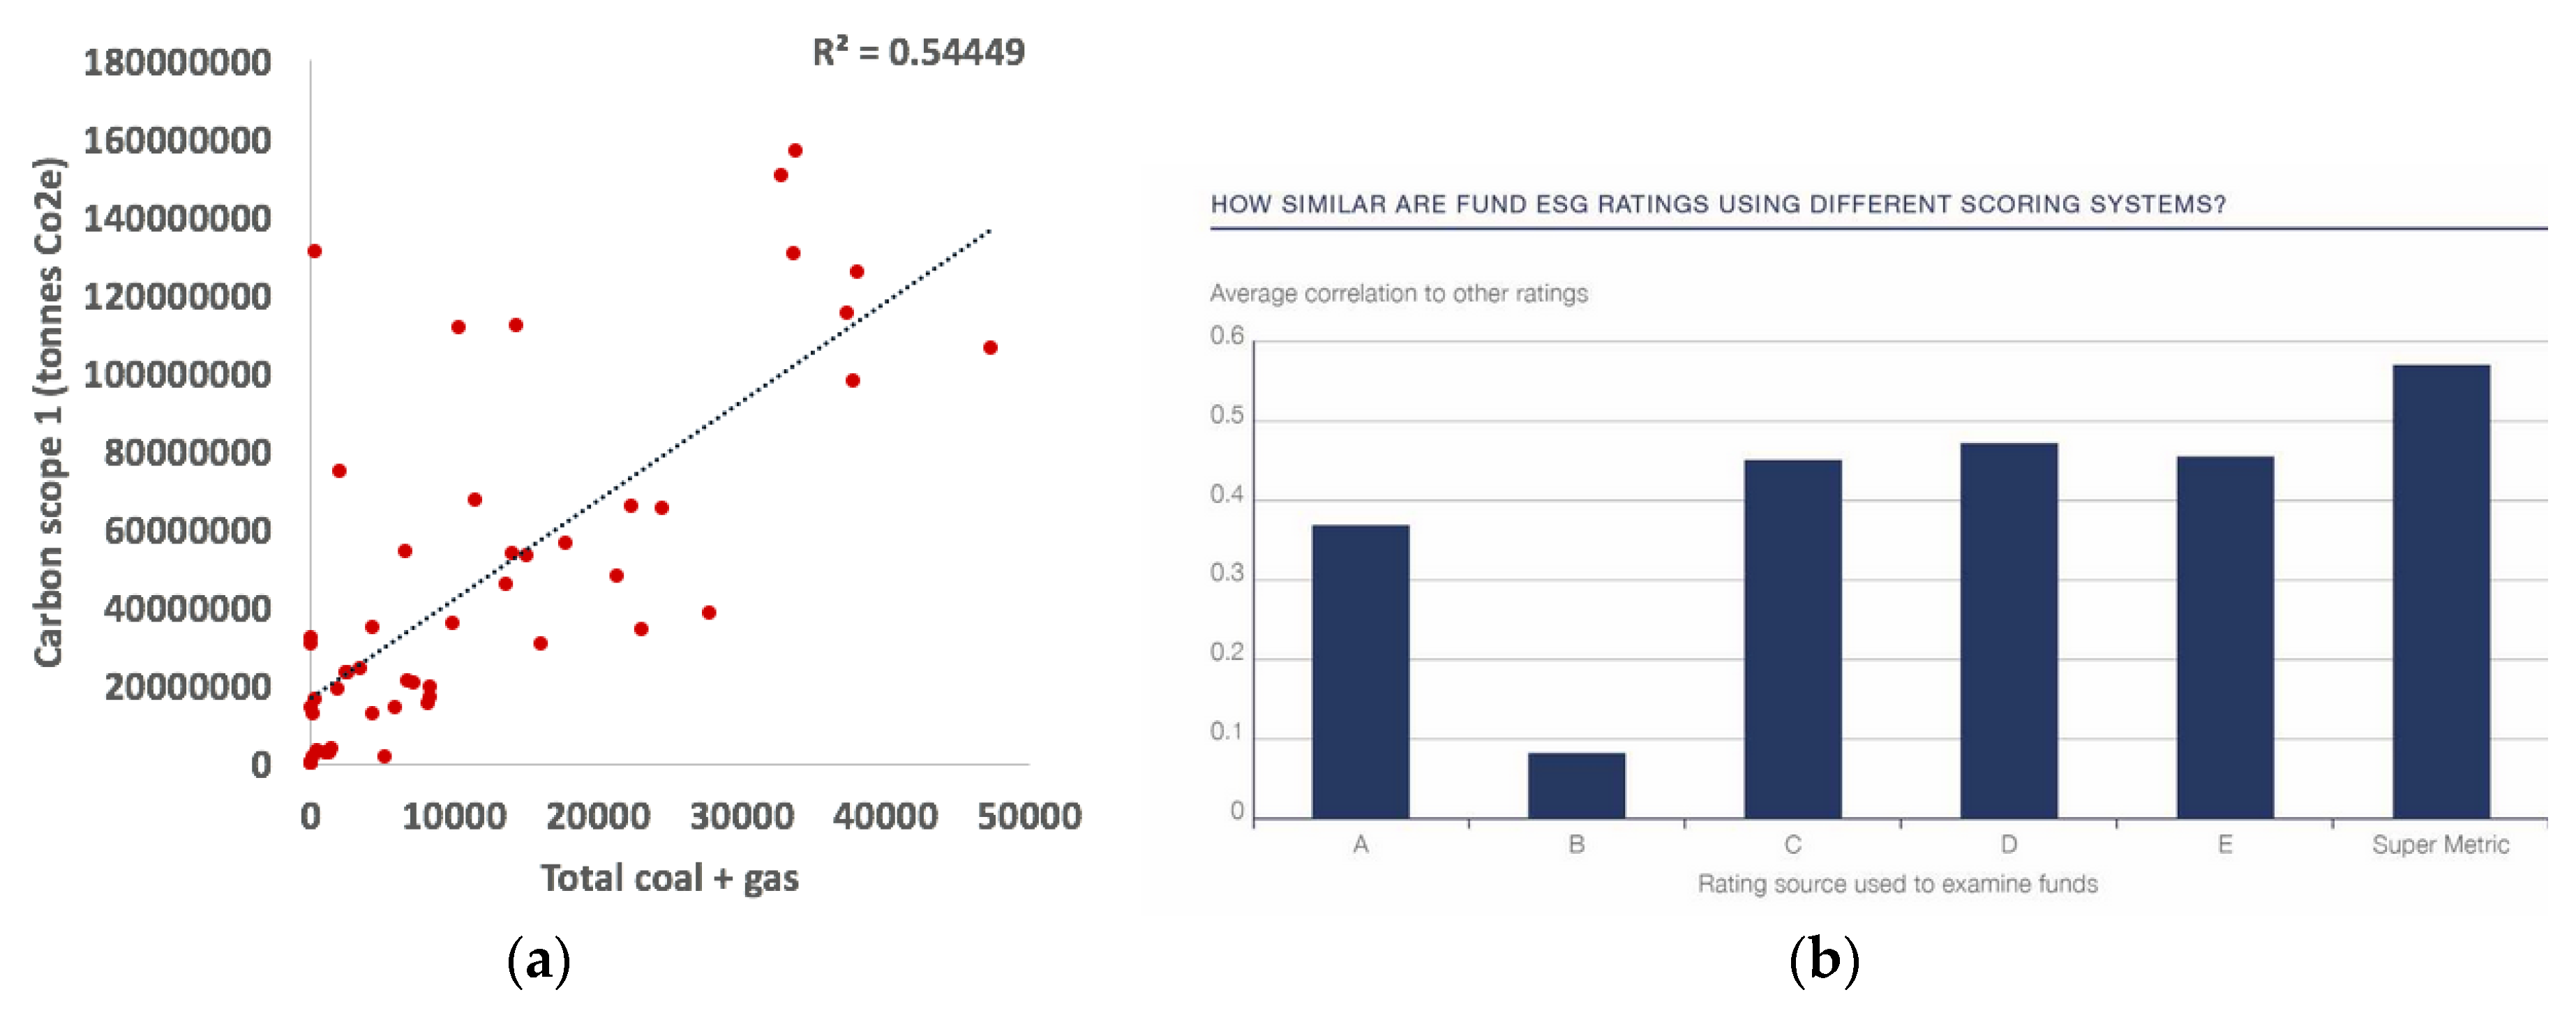
As shown by the discussion above, the relative merits of different accounting units are a function of the use case and the underlying data quality that informs each of these indicators, which is outside the scope of this article. However, it is relevant to highlight that the choice of indicators may not be cleanly correlated. By extension, the choice of one or the other accounting unit may materially impact the results of the analysis and potentially even the sign of the results. Research by Schroeders shows a low correlation between different ESG scores (Figure 1b) [22]. Similar research by Chatterji et al. from 2013 suggest that the overlap in ratings ranges between 19% and 60% [23]. They conclude that “low convergent validity between SRI raters is not only driven by different theorizations, but also by low commensurability among most pairs of raters.” [23]
Similarly, commonly used metrics used as proxies for company level climate impact may not have significant correlation. As a simple analysis demonstrating this point, the author mapped the correlation between the absolute Scope 1 GHG emissions, as measured by Trucost (based on 2015 data), for a sample of 50 electric utilities and their absolute installed capacity for coal power and gas power of the associated electric utilities (also using 2015 data) (Figure 1a).
While correlated, as would be expected, there are a number of utilities with significant outliers, related both to the underlying uncertainty of the data (notably related to estimations of production associated with installed capacity), but also to the fact that indicators like installed capacity do not capture the complete business of a utility, nor necessarily issues like utilization rates.
3.2. Boundary Principles
A key challenge for corporate and financial accounting, as well as for the issue under discussion here, is the question of the accounting boundary. When it comes to the unit of accounting, it is not just a question of defining the unit, but also the boundary with which to determine the unit. A range of boundaries can be considered here, notably temporal boundaries (i.e., which time horizon is covered by the accounts), ownership boundaries (i.e., what is the scope of corporate structures covered by the accounts), and business activity boundaries (i.e., what is the scope of business activities covered by the accounts).
There are of course other boundary issues that may arise, but it is these three that are considered the most salient for the question of climate accounting principles. While each of these may warrant their own deep-dive articles, this article will seek to constrain itself by simply mapping the key questions and issues associated with the accounting boundary principles. Each of the three boundary issues flagged above will be discussed in turn.
3.2.1. Temporal Boundaries
One key boundary question related to climate accounting is whether backward or forward-looking indicators are considered. The three options in this regard are ‘point-in time’ indicators, usually covering the last year, ‘historical cumulative’ indicators, based on cumulative actions or historical trends, and ‘forward-looking’ indicators based on some level of forward-looking analysis.
All financed emissions frameworks are currently based on point-in time indicators [13,15]. At the same time, there are some attempts to start considering trends [24], as well as consider historical cumulative GHG emissions [25]. The historical approach has been deployed in the context of allocating legal responsibility to major GHG emitters, as done recently in the case of a Peruvian farmer against RWE (decision pending) [26].
In the past two years, increased emphasis has been placed on also considering forward-looking indicators. The 2 °C portfolio assessment framework developed by the Sustainable Energy Investing Metrics consortium for example takes a five-year forward-looking time horizon [27]. The choice of this time horizons is based on the typical capital expenditure planning time horizons of companies. The analysis of the Carbon Tracker Initiative on oil and gas companies generally takes an 8–10-year time horizon on capital expenditure (2017–2025) and an 18–20-year time horizon on production (2017–2035) [28].
The somewhat longer time horizon can be explained by the fact that the capital expenditure planning horizon for oil and gas companies may be a little longer than 5 years [29] and since the approach does not provide cross-sectoral analysis, a more long-term time horizon that may be ‘too long-term’ for electric utilities for example may be more appropriate. Given the relative limited application of forward-looking indicators to date, consensus ore more general trends in terms of the boundary of forward-looking time horizons has not been established.
One critical aspect in this respect is that the temporal boundary is critical in terms of driving results and may lead to non-correlated results. For example, point-in time indicators of the share of high-carbon power production for electric utilities (expressed in Scope 1 CO2e) show basically no correlation—positive or negative—with planned renewable power capacity additions (Figure 2). In other words, electric utilities that are more high-carbon currently do not necessarily invest more or less in low-carbon alternatives in the future. This lack of correlation, at least to the extent that it is identified for one indicator, suggests that temporal boundary choices are critical for determining the climate unit of accounting and may lead to inconsistent results.
3.2.2. Ownership Boundaries
Another key boundary issue relates to ownership boundaries. For corporate accounting, this is a critical element, as it relates to questions of how to account subsidiaries in annual accounts and partially owned assets. There is a rich literature as to the rules and principles for accounting these types of assets. Notable approaches in this regard relate to the ‘equity share’ accounting, which allocates economic or financial activity based on the equity stake in the underlying asset or subsidiary. Another approach is the management control approach, where 100% of the activity gets allocated to the entity that has management control of the asset or subsidiary. Thus, if the entity owns 51% of a power plant, it would get allocated 100% of the installed capacity and associated production.
The choice of these or other approaches may be specific to the accounting objective, and indeed will not necessarily be consistently applied in one annual report of a company. While critical from a climate accounting perspective, the issues here are the same as you would see in traditional corporate accounting and thus not necessarily of additional significant interest for the purpose of this paper. Suffice it to say that ownership boundaries are critical at the entity level in order to correctly and comprehensively capture a company’s activity. At the same time, it is an issue that is of primary concern at entity and not portfolio level, insofar as the portfolio will import the accounting choices made at entity level.
At portfolio level, the ownership boundary that is of interest from the perspective of climate accounting is the question of the maturity of credit instruments. The issue here can be summarized as follows: When a company projects future activities or revenues, it does this based on the current fixed asset base and commitments as to the evolution of that asset base based on investments and mergers and acquisitions. In the case of a credit portfolio with maturities, this future commitment does not exist by default, since the instruments mature, and it is not given that the instruments will be refinanced (even if likely), nor that the portfolio manager will reinvest in the same company or instrument. By extension, a 5 or 10-year forward-looking analysis of the portfolio will be influenced by the accounting assumptions taken around maturing instruments.
Figure 3 demonstrates the impact of this choice. Here, the annual gas production of a corporate bonds portfolio, allocated based on the portfolio weight approach (see Section 3.3 for a discussion of allocation rules), is shown over a 10-year time horizon. The line shows the trajectory assuming no maturity of bond instruments, whereas the dotted line represents the annual gas production assuming the maturity of bond instruments. In the second case, the gas production in the portfolio is reduced by 50% over a ten-year time horizon as a result of the maturing instruments.
The choice for one or the other cannot be described in absolute terms but is rather a function of underlying strategies. Investors that assume a refinancing approach may be more inclined to assume no maturity, whereas investors that specifically target no refinancing may be inclined to go for the dotted line. Allianz for example as part of its coal divestment strategy has not committed to selling bonds in their portfolio, but rather excluding coal from future investments, based on the categories they have defined. In their case, the dotted line, at least when considering coal production, may be more appropriate. Given the general view of refinancing, however, the straight line may be a more appropriate general application.
3.2.3. Business Activity
The final key boundary issue of interest here is the boundary of business activity. From a climate perspective, there is a key hierarchy of business activities that have a more or less significant impact on climate change. These can be mapped differently to the business segments of a company and its associated financial instruments. Around 20% of a typical financial portfolio account for around 80% of the GHG emissions of associated companies [30]. When mapping the sectors in the 2 °C scenario of the International Energy Agency to companies in stock markets, the percentage similarly fluctuates at around 15–25% [31].
By extension, climate accounting for financial portfolios may limit itself to only specific business segments of investee companies and/or specific parts of the portfolio. For example, the 2 °C scenario analysis of TPT Retirement Scheme [32] and AXA [33] only considers around 15% of the portfolio. Similarly, the analysis of Trucost for ERAFP [34] on the power sector only looks at the power generation activities of utilities and does not look at their other business segments (e.g., distribution, mining). The boundary issue on climate is thus not just one of the scope of corporate ownership, but also activity.
Part of the boundary issue is function of the units of accounting. If the unit of accounting is power capacity for example, other activities are obviously not considered. The question here then becomes the scope. For example, is the power capacity owned by Apple, which represents a rounding error in the overall revenues of the company, considered together with those of electric utilities or not. These types of choices are less accounting choices than data choices.
For GHG emissions, however, the boundary issue becomes quite significant. Current carbon footprinting frameworks rely almost exclusively on Scope 1 and Scope 2 GHG emissions [13]. In some cases, supply-chain emissions are estimated, as is the case for Trucost [15]. Thus, while they seek to cover the complete universe of business activities of a company, they do not cover the complete universe of climate impacts of the products and services associated with these business activities. Crucially missing from these business activities are the GHG emissions from the use case of the product. This implies that for 8 of 10 sectors, less than 20% of the climate impact is covered in the analysis (Figure 4). While there is some inherent uncertainty in the data estimates, even a somewhat more benign estimation still would suggest the majority of GHG emissions are not covered in the analysis.
3.3. Allocation Principles
Once the unit of accounting is defined, the next key accounting challenge is how to allocate the economic activity of a company to financial instruments. Indeed, this accounting principle is arguably the most complex, since it has no real role model in traditional accounting frameworks. Traditional corporate finance research looks at ways to minimize the impact of financial institutions’ strategies on share prices. Indeed, organizations like State Street have dedicated departments to help financial institutions transition their portfolios without impacting share prices [35]. Classical corporate finance literature in the spirit of Modigliani–Miller seek to demonstrate the fungibility of different asset classes in influencing corporate finance conditions [36]. From the perspective of climate, the interest tends to be in actual seeking to impact investment in the real economy, in favor of investments consistent with the transition to a low-carbon economy and global climate objectives.
In this context, allocating responsibility or accountability of economic activity to financial instruments cannot rely on a rich body of literature for guidance, when it comes to allocating economic activity to different asset classes without double counting (i.e., allocating the same unit of economic activity to two different financial instruments).
The complexity for example in tracing economic impact in equity investments in terms of investments in the real economy is elucidated by Dupré et al. (2015) [1], see Figure 5 below. In response to this challenge, two types of allocation principles have been developed, which are defined here as the ‘portfolio-weight’ approach and the ‘balance sheet’ approach. Each of these will be discussed in turn.
The equation summarizing this accounting challenge can be summarized as
where is the climate unit allocated to the portfolio, ui the absolute climate unit of company , the value of the financial instrument of company in the financial portfolio, and the allocation factor. The key question here then is the definition of a, with basically representing the climate unit ‘to be allocated’ and representing the amount ownership of the financial instrument that will determine the allocation rule. Thus, jointly determine how much of the climate unit of a specific company is allocated to the portfolio, based on the amount of capital invested in the company and the way this capital is set in relation to an external factor (the allocation factor), discussed in further detail below and relating either to the portfolio-weight or balance sheet approach.
The balance sheet approach, arguably the more common of the two, involves allocating economic activity to the balance sheet based on the definition of a fixed allocation key. Within this approach, different applications can be considered.
The first option for is allocating all economic activity to the equity instruments of a company, in the logic of allocating ‘ownership’ of economic activity to only those instruments that directly account for ownership. This approach is currently being applied by the Swedish pension funds [4]. While internally consistent and an attractive solution for those financial institutions exclusively invested in or concerned with accounting equity instruments, it gives rise to the double counting issue that if all economic activity is allocated to equity and then allocated again—in some to be determined formula—to credit instruments, it gets counted twice. Crucially, the equity principle cannot by design be applied to other financial instruments.
The upside of this approach however is that because equity ownerships can be expressed in percent of total, the allocation rule is not biased by fluctuations in market prices (e.g., share prices). Moreover, there exists some logical consistency in allocating all economic activity to its owners. Indeed, this approach is the only area where an extension of traditional corporate consolidation rules can be extended to financial instruments, in the spirit of the way companies prepare their corporate accounts when considering their own subsidiaries.
Of course, allocation rules can also be defined based on either line items in a balance sheet, notably enterprise value, an approach chosen by Mirova for the climate accounting of their portfolios [37]. The upside here is that this approach avoids double counting and allows for applicability across different asset classes. The downside is that the approach is highly sensitive to market prices. In other words, intensities will fluctuate as enterprise value fluctuates (an issue revisited in Section 3.4). While not of primary concern here, there can also be challenges for non-listed companies in deriving their enterprise value. Finally, the approach creates an arbitrary equivalence between different asset classes, which may not be intuitive and correct, since they serve fundamentally different functions in many cases, especially when it comes to climate change [38].
The alternative accounting principle is allocating economic activity based on the portfolio weight of the company in the portfolio. In this case, represents the size of the portfolio itself. It is the approach chosen in the ESG ratings of both MSCI and Morningstar/Sustainalytics [39,40], as well as the climate ratings of ISS-Ethix/CDP [41]. This approach is generally used to weight normalized or scored indicators rather than allocating absolute climate units, as it represents the relative weight of different scores or intensities in the portfolio.
While the balance sheet approach described above can be said to be more intuitive for equity portfolios, the portfolio weight approach is more intuitive for credit portfolios, since it can be said to represent the capital allocation decision of the portfolio manager behind the portfolio, given the link between book value and capital allocation decisions. In other words, the portfolio value of a credit instrument, as measured in book value, can be said to represent the money allocation of the portfolio manager, whereas the same is not necessarily the case for equity portfolios, given the potential fluctuation of the book and equity value of a company. An investor, who invested in Tesla in 2013 and still holds the stock, will have a different portfolio value in their portfolio today than four years ago.
Another factor that speaks for the portfolio weight approach is the more intuitive link to financial risk. While out of scope, accounting based on portfolio weight allows for a representation of the size of the exposure of the portfolio to the company. This more intuitively links to risk since the overall ‘size of the exposure’ is captured through such an approach (measured in financial terms or share in the portfolio), which may be at risk of loss. Of course, these aspects situate themselves in a broader conversation around the impact of different macroeconomic risks and microeconomic ‘technology’ or ‘legal risks’ that will impact each of these factors differently, as well as the response by the portfolio managers.
Figure 6a shows the implication of choosing different allocation rules for a sample corporate bonds portfolio. The actual portfolio composition is based on a corporate bonds portfolio provided by a European insurance company for the purpose of this study. The portfolio is based on a composition of instruments from 2016 invested in developed markets. The results are illustrative and thus the exact composition of the portfolio is not of primary concern here, it is rather to demonstrate that the results will differ based on using different approaches. While in aggregate the results do not fluctuate wildly, the different measured technology weights are arguably significant. Thus, the weight of coal power capacity in the portfolio weight approach is 13.8%, versus 19.4% in the company weight approach using enterprise value.
As highlighted above, another conclusion of the analysis is that portfolio weight is more intuitive for financial risk assessments and considerations, given the relevance of the portfolio weight for exposure. On the flipside, the share of a portfolio in a company’s outstanding debt is secondary for risk considerations. This potential disconnect is demonstrated in Figure 6b. Figure 6b shows the weight of five different oil and gas companies in a portfolio, where the residual portfolio weight has a carbon intensity of zero, that is consistent with a potential future CO2 intensity of 0.1 (Potential CO2 emissions/million $ invested) or consistent with a potential CO2 intensity outside of the carbon budget of 0.02 (Potential CO2 emissions/million $ invested). Emissions estimates are based on analysis from Carbon Tracker Initiative on future emissions [28]. The results show that identical emissions, allocated based on a balance sheet approach (in this case allocated based on market capitalization of the company) can be associated with significant different portfolio exposure to underlying carbon-intensive companies. Given that the analysis assumes the rest of the portfolio contains no carbon whatsoever, the results show that identical footprints can lead to differences in the percent of the portfolio exposed to climate-related transition risk of less than 0.5% to up to 3%.
3.4. Normalization Principles
Normalization is a critical part of climate accounting in financial markets as it is required to derive performance benchmarks related to climate. The absolute carbon emissions of a company for example or absolute installed coal power capacity may not be meaningful without understanding the size of the company itself. A large electric utility would be expected to have more installed coal power capacity than a smaller utility, et ceteris paribus, and of course more coal power capacity than a non-utility. Some climate strategies related to climate accounting do not require normalization e.g., an investor that does not want to invest in companies that own any coal-fired power plants does not need to know any more information other than whether the company owns coal-fired power. Mergers and acquisitions, as well as changes to business segments, also make it difficult to work with absolute GHG emissions data for example, since this number may increase or decrease as a function of changes in the company’s size and not related to actual business changes. The cement company HeidelbergCement, an example explored further below, demonstrates this.
However, most investor strategies will demand some contextualization. For example, if an electric utility, hypothetically, owns one gigawatt of coal-fired power and 20 GW of renewable power, this context would be relevant, even if in absolute terms one gigawatt is a significant amount of coal power. Thus, investors that have chosen to divest from coal (e.g., AXA, Allianz) have in almost all cases defined thresholds in terms of the share of coal in a company’s business activities [42,43].
The equation underlying this accounting principle is shown below:
where is the normalized climate intensity of company , is the original climate unit of company , is the normalization factor for company , and c is a constant that may be applied to express the outcome in a desired unit (e.g., one million $, ton of cement). The same equation can be expressed at portfolio level albeit slightly adjusted
where is the normalized climate intensity of the portfolio.
In terms of normalization, there are two types of accounting approaches that can be applied. Climate data can either be normalized by economic activity, expressed in economic units (e.g., capacity, production), or company size, expressed in monetary units. The approach of normalizing by economic units implies that the nominator, which represents the identified climate unit (e.g., installed renewable power capacity in MW, GHG emissions) is normalized either by a unit of output or production capacity. In the case where the unit in the nominator and denominator is identical, the related indicator can then be expressed in percent, or otherwise as a specific unit.
For GHG emissions, by design these can only be expressed to signify the percent of types of GHG emissions (e.g., Scope 1, Scope 2, Scope 3) in total emissions. The choice to normalize by economic activity can be seen in the climate accounting and reporting frameworks developed by Trucost for ERAFP [34], and in the Sustainable Energy Investing Metrics model, funded by the European Union H2020 programme [27]. It is also the approach taken by the Swiss government in the context of the 2 °C scenario analysis pilot launched in 2017 [44].
The key challenge in terms of normalizing by economic activity is that this only allows for business-segment specific analysis and thus by extension does not lend itself to cross-business segment and portfolio-level aggregation. It is not possible to aggregate indicators with different denominators (e.g., GHG emissions/MW and GHG emissions/ton of cement) without developing some type of conversion factor, which likely in turn requires some variant of scoring (see previous sections) in order to be expressed as a unit of accounting. By extension, normalizing by economic activity can be an effective approach at stock-picking and portfolio analysis, but not in the context of seeking to report aggregated indicators [20].
An alternative to normalizing by economic activity is to normalize by company size, expressed in monetary units. Normalizing by company size can also be interpreted to normalize by financial activity if elements like market capitalization or a company’s balance sheet are set to reflect future financial returns. This normalization approach is used across all financed emissions methodologies currently used by financial institutions in the market. It solves the question of aggregation by providing a denominator that exists for and can be consistently applied by all companies. The most prominent types of indicators in this regard are revenues, market capitalization, or enterprise value [13].
The use of the enterprise value for an allocation key here is different to the use of enterprise value for normalization purposes described above as in the one case the enterprise value is used to normalize the climate unit in order to derive an intensity for a company (or portfolio), and in the other case an absolute volume of GHG emissions for example is allocated to individual financial instruments based on the weight of the financial instrument (in monetary terms) in total enterprise value.
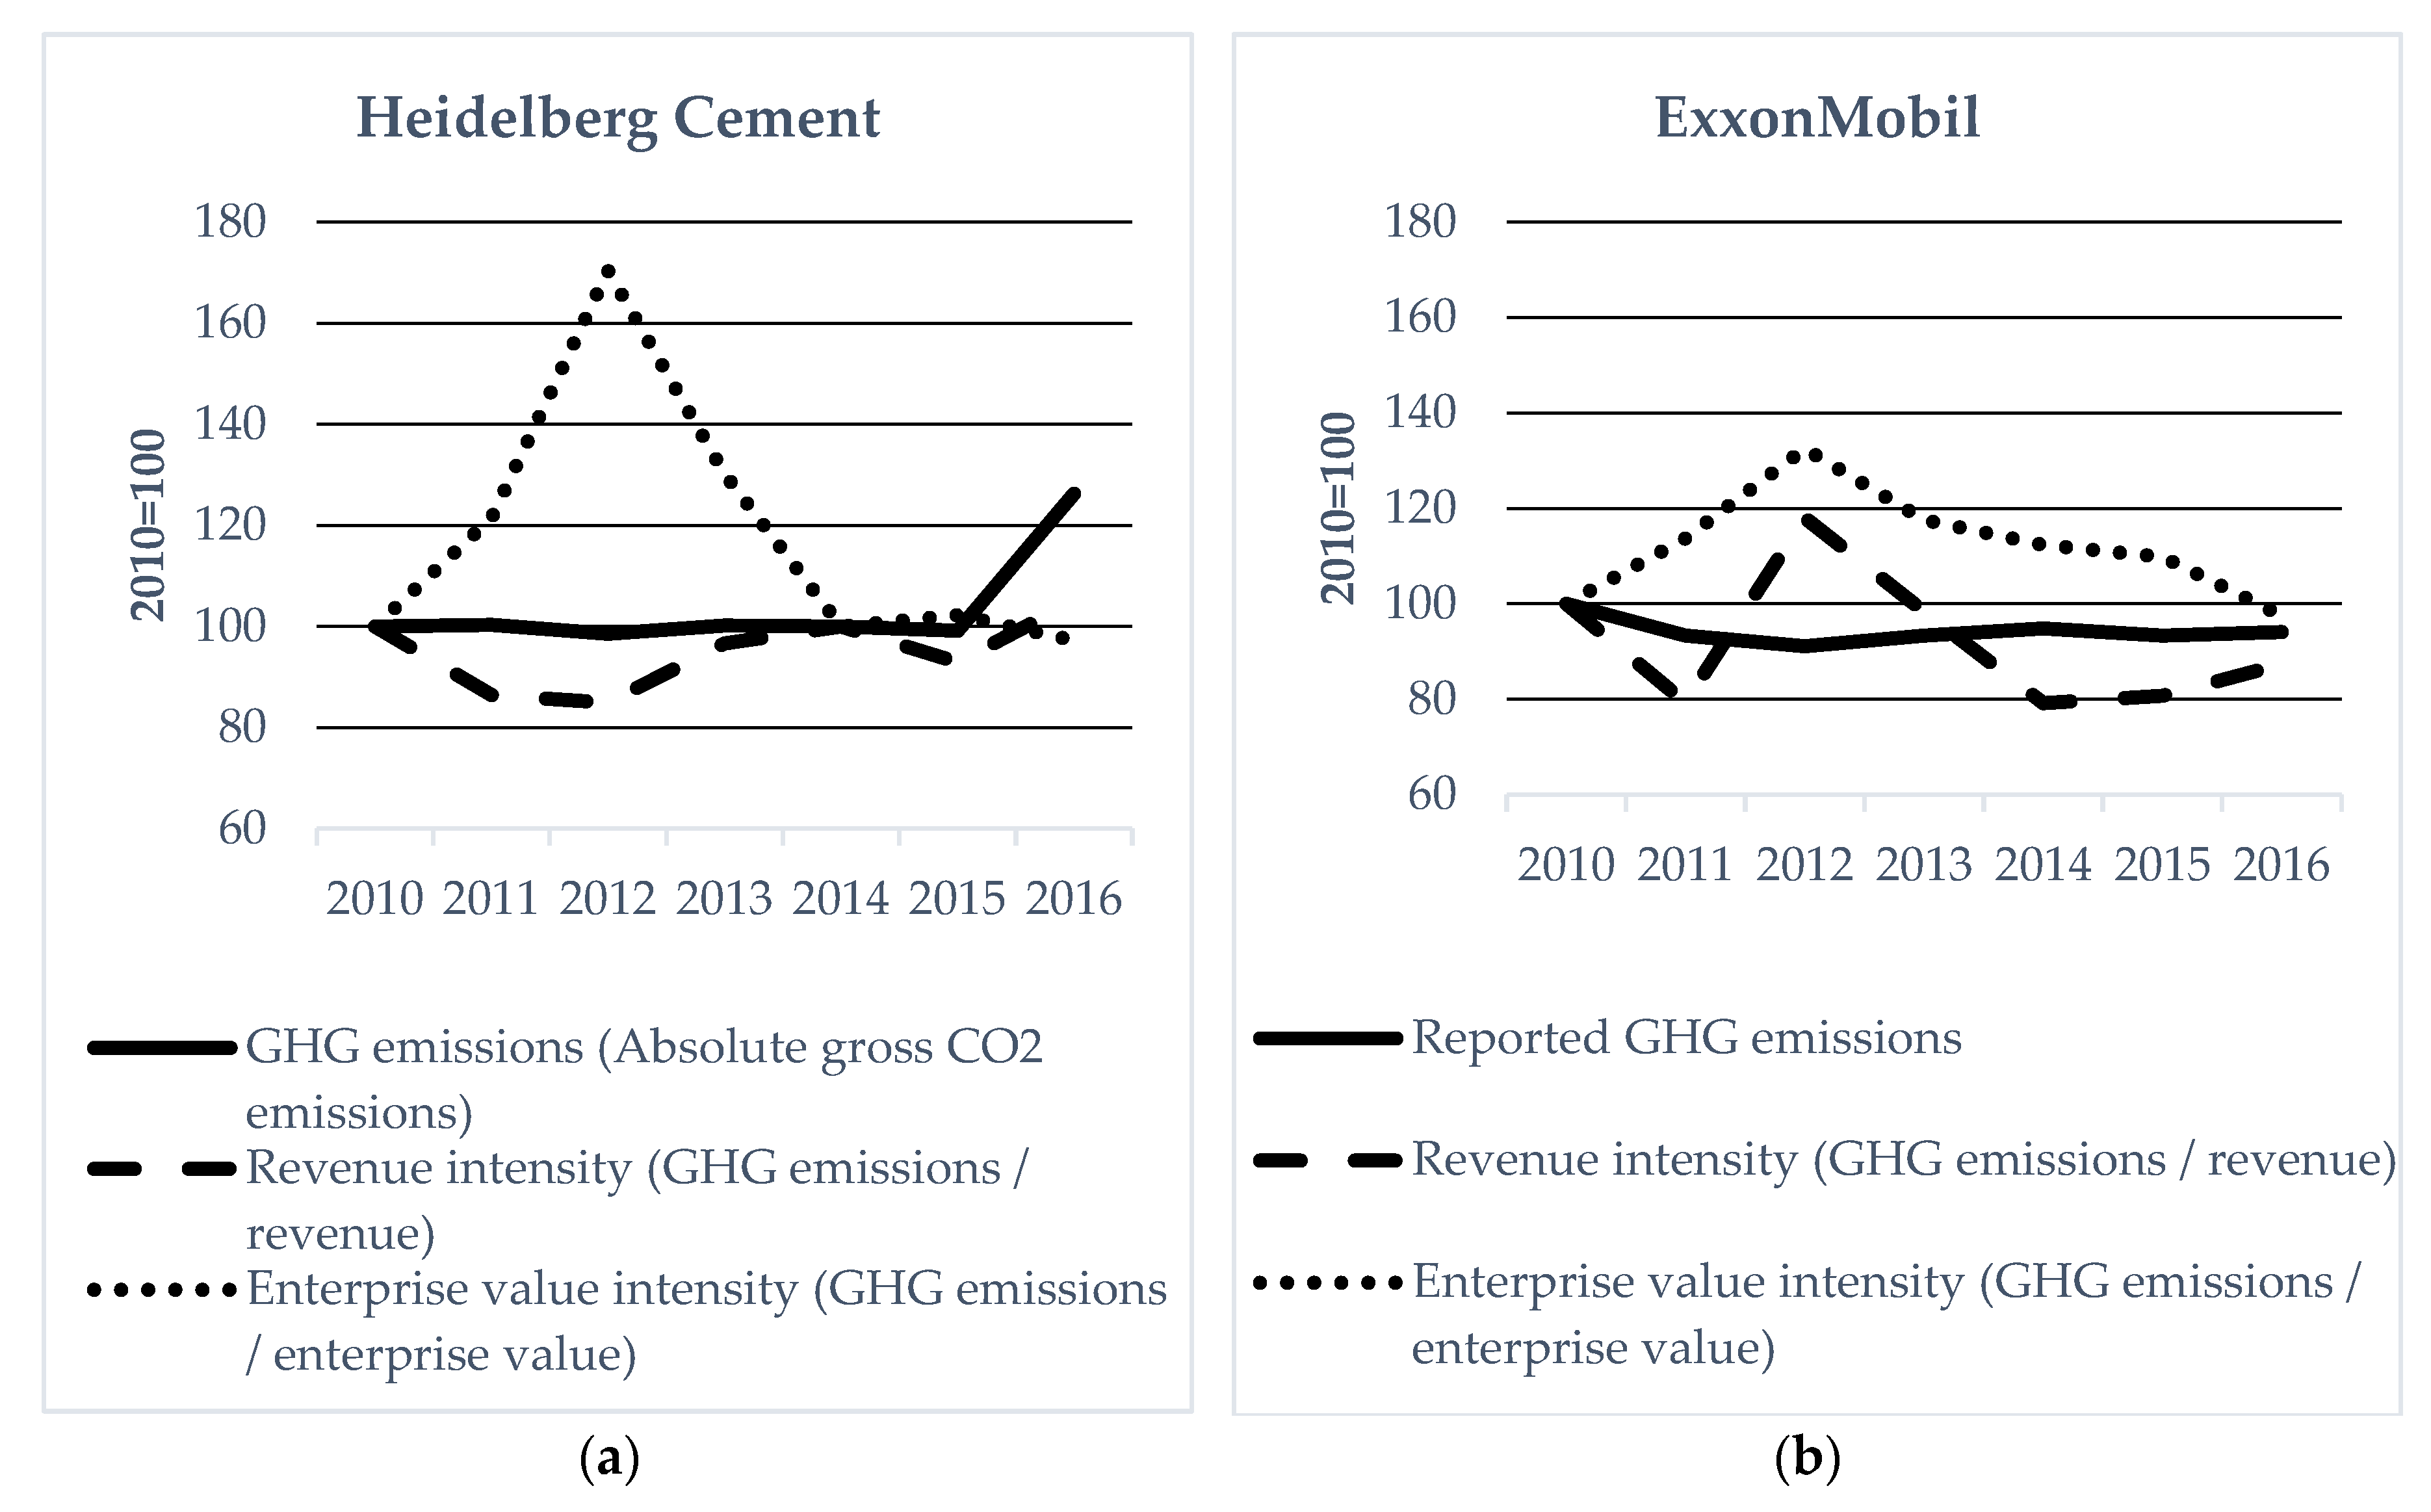
Given that this indicator however must rely on monetary units, it can create biases in the results. The following example for an oil and gas company (ExxonMobil) and a cement company (HeidelbergCement) illustrate this point. Figure 7 shows the absolute GHG emissions (Scope 1 and Scope 2) for each company and the normalized GHG emissions for the time period of 2010 to 2016. The results demonstrate the significant volatility embedded in the denominator when normalizing by revenues and enterprise value. While not consistent across both companies, normalized results fluctuate wildly even if absolute GHG emissions do not move materially.
The relative stability in absolute GHG emissions suggest relatively stable scope of company economic activity, but changes in prices (revenues) and/or the balance sheet (enterprise value) lead to these fluctuations. Interestingly, in the case of ExxonMobil, as ExxonMobil expands its balance sheet through increased debt issuance, and by extension increases its enterprise value as its stock price does not adjust, the normalized GHG emissions intensity goes down. While not in scope of this paper, this suggests that this type of normalization may be inversely correlated with risk trends as a more leverage company will lower its GHG emissions but potentially increase its credit risk. Here again different types of risk pass-through mechanisms in different asset classes will impact conclusions and require further analysis. To highlight the challenge with revenues using an example for a different sector, Ferrari might sell one car for two or three cars sold by BMW, even while the revenues or sales might be identical. The climate impact of each however is obviously different.
While in both cases normalization by revenue is associated with lower volatility, volatility is still significant around ±20%. For enterprise value, this number jumps above 60% in the case of HeidelbergCement. Crucially, this volatility is not driven by the actual ‘climate performance’ or impact of the company, but exogenous indicators. Thus, while this accounting approach allows for aggregation, it can create significant biases in the interpretation of climate accounting at individual security level and by extension may not be applicable for the implementation of passive or active investing strategies, as well as company engagement.
4. Discussion
The previous section highlighted the range of accounting choices made in the context of climate accounting for financial portfolios. The range of choices and evidence of their application demonstrate that the market currently is far from defining a standard. To use one example, the pilot project by the Swiss government on 2 °C scenario analysis used two different allocation rules for credit and equity portfolios and a normalization factor based on economic activity [44]. All these accounting choices are inconsistent with the approach used by Mirova, for example [37]. That is not to say that the choice of one or the other is more appropriate, rather that these accounting choices are made in a vacuum, lacking a discourse and academic grounding in an accounting framework fit for purpose for the issue of climate change.
While these different pilots involve different accounting choices, many of the accounting questions can be answered by resorting to financial accounting approaches, for example when it comes to questions of boundaries of reporting and data consolidation rules. At the same time, some accounting issues require new approaches.
Reporting frameworks, such as those pioneered by the FSB TCFD or by the private sector in Netherlands and Sweden [4,5,10] at best provide partial answers to this challenge. Arguably, the challenges associated with the quality of the underlying climate data may have led to a neglect of perhaps equally important accounting issues.
A review of key accounting principles suggests that there is in many cases not generally one principle that rules them all, but the most appropriate accounting principle depends on the use case. Crucially, the choice of that principle will have significant impacts on the final results. Each individual accounting issue defined here by itself drives material differences in the results identified, with in some cases no correlation between the two different indicators/rules and perhaps even negative correlations.
As a result, more attention needs to be paid to the accounting choices underlying climate accounting. The following key high-level conclusions can be summarized in this context.
Between the three types of units of accounting, the choice remains largely subjective, with each type of unit delivering a different level of information, the quality of which is obviously largely dependent on the quality of the underlying data. Whereas GHG emissions are the most intuitive to aggregate, they may hide issues related to low-carbon alternatives and suffer from data quality issues. On the flipside, qualitative scores may be highly comprehensive, but lack quantitative rigor. By extension, the choice is largely a function of preference.
In terms of accounting boundaries, cumulative GHG emissions are likely to the most meaningful from a litigation perspective, with forward-looking indicators becoming increasingly used by financial institutions in the context of scenario analysis [44] and in research [28]. All three types of temporal boundaries provide relevant information. From the perspective of ownership boundaries, choices of integrating instrument maturity are largely contingent on the extent to which future portfolio strategies are already defined or not. Finally, when it comes to business segment boundaries, the key element is choosing the scope based on the analysis. If the analysis involves a 2 °C scenario projection, then focusing on business segments for which 2 °C scenarios exists appears as the most appropriate, with associated compromises and breadth of analysis [32,33,34]. On the other hand, sector analysis should cover the complete scope of climate impacts, suggesting the need to move beyond Scope 1 and Scope 2 in terms of the boundary of assessment.
In the discussion of allocation principles, the choice of accounting can be linked to the unit of assessment, with a balance sheet approach based on ownership most popular and arguably easily applicable for equity portfolios, and portfolio weight approaches more widely applied for credit portfolios. Investors seeking to weight intensities and/or looking to indicators more closely aligned with questions of risk are likely better served exploring a portfolio weight approach, whereas the balance sheet approach is more intuitive from the perspective of defining ‘impact’ or responsibility (i.e., the ownership of a company’s activities speak to the contribution or share in governing these activities).
Finally, a review of normalization principles reveals that normalizing by economic activity prevents the biases associated with financial indicators (e.g., changes in prices). At the same time, these approaches do not lend themselves to aggregation and may not be applicable across a wide universe of sectors, since associated information on economic activity may not be easily accessible.
In conclusion, this paper provides a tour of the key accounting challenges currently faced in the context of climate accounting for financial portfolios and a discussion of the types of choices currently applied and their applicability, as well as potential challenges and caveats. The discussion focused on the logic of application, identifying the application by a range of investors and the associated strategies, while localizing the accounting choices in the underlying use case.
Given the relative youth of the research field, the analysis, while seeking to cover a broad issue of accounting issues, did not cover every single aspect and choice ingrained in climate accounting methodologies. Key questions of data sources and quality were not addressed. Key further areas of future research thus involve a comprehensive survey of market practice and views on the most appropriate accounting choices. While not resolving the accounting challenges, this paper hopes to contribute to this literature and spark a broader emphasis in the conversation in financial markets on questions of accounting, beyond questions of the quality of sustainability data. Unlike for some areas of sustainability data, key conclusions and options in terms of accounting exist and are already being piloted.
Acknowledgments
This article benefitted from the financial support of the EU LIFE NGO operating grant programme and the ClimateWorks Foundation. The authors would like to thank Klaus Hagedorn and Clare Murray for reviewing the article.
Author Contributions
Jakob Thomä is the lead author of the paper and led in the technical development of the taxonomy and co-designed the sample applications. Stan Dupré contributed in the definition of the units of accounting and the analysis of the implications of using different allocation rules. Michael Hayne led in the sample applications of different accounting principles and executed the associated underlying data analysis.
Conflicts of Interest
The authors declare no conflict of interest. The founding sponsors had no role in the design of the study; in the collection, analyses, or interpretation of data; in the writing of the manuscript, and in the decision to publish the results.
References
- Dupré, S.; Chenet, H.; Thomä, J.; Déniel, G. From Financed Emissions to Long-Term Investing Metrics: State-of-the-Art Review of GHG Emissions Accounting for the Financial Sector; 2° Investing Initiative: Paris, France, 2013. [Google Scholar]
- UN PRI Montreal Pledge. Available online: http://www.montrealpledge.org (accessed on 30 November 2017).
- Novethic. Montreal Carbon Pledge, Accelerating Climate Disclosure; Novethic: Paris, France, 2016. [Google Scholar]
- AP Funds. The Swedish National Pension (AP) Funds’ Co-Ordination of Carbon Footprint Reporting for Investment Portfolios. 2015. Available online: http://www.ap4.se/globalassets/dokument/rapportarkiv/ovriga-rapporterdok/fact-sheet_the-swedish-ap-funds-co-ordination-of-carbon-footprint-reporting-for-investment-portfolios-_nov-2015.pdf (accessed on 30 November 2017).
- Platform Carbon Accounting Financials (PCAF). Paving the Way towards a Harmonised Carbon Accounting Approach for the Financial Sector; A report by the Platform Carbon Accounting Financials; Platform Carbon Accounting Financials (PCAF): Amsterdam, The Netherlands, 2017. [Google Scholar]
- Schoenmaker, D.; van Tilburg, R. What Role for Financial Supervisors in Addressing Environmental Risks. Comp. Econ. Stud. 2016, 58, 317–334. [Google Scholar] [CrossRef]
- Legifrance. Décret n° 2015-1850 du 29 Décembre 2015 Pris en Application de L’article L. 533-22-1 du Code Monétaire et Financier. Available online: https://www.legifrance.gouv.fr/eli/decret/2015/12/29/2015-1850/jo/texte (accessed on 30 November 2017).
- Campiglio, E.; Godin, A.; Kemp-Benedict, E.; Matikainen, S. The Tightening Links between Financial Systems and the Low-Carbon Transition. In Economic Policies since the Global Financial Crisis; Arestis, P., Sawyer, M., Eds.; Springer: London, UK, 2017; pp. 313–356. ISBN 978-3-319-60459-6. [Google Scholar]
- Weber, C.; Thomä, J. Trails for Climate Disclosure: A Regulatory Review; 2° Investing Initiative: Paris, France, 2016. [Google Scholar]
- Financial Stability Board (FSB). Task Force on Climate-Related Financial Disclosures; Final Report: Recommendations of the Task Force on Climate-Related Financial Disclosures; Financial Stability Board: Basel, Switzerland, 2017. [Google Scholar]
- Battiston, S.; Mandel, A.; Monasterolo, I.; Schütze, F.; Visentin, G. A climate stress-test of the financial system. Nat. Clim. Chang. 2017, 7, 283–288. [Google Scholar] [CrossRef]
- Matikainen, S.; Campiglio, E.; Zenghelis, D. The Climate Impact of Quantitative Easing; Policy Paper; Grantham Research Institute on Climate Change and the Environment: London, UK, 2017. [Google Scholar]
- Raynaud, J.; Sudip, H.; Samuel, M. Carbon Compass: Investor Guide to Carbon Footprinting; Kepler-Cheuvreux Transion Research: London, UK, 2015. [Google Scholar]
- Krosinsky, C. Developing an Asset Owner Climate Change Strategy; United Nations Principles for Responsible Investment (UN PRI): London, UK, 2015. [Google Scholar]
- Dupre, S.; Thomä, J.; Dejonckheere, S.; Fisher, R.; Weber, C.; Cummis, C.; Srivastava, A. Climate Strategies and Metrics: Exploring Options for Institutional Investors; A Joint Report from UNEP-Fi, GHG Protocol, and the 2° Investing Initiative: Paris, France, 2015. [Google Scholar]
- Hoepner, A.G.F.; Yu, P.-S. Science Based Targets without Science Based Disclosure? Towards a Complete Carbon Data Science; CSEAR Paper; University of St. Andrews: St. Andrews, UK, 2017. [Google Scholar]
- Doda, B.; Gennaioli, C.; Gouldson, A.; Grover, D.; Sullivan, R. Are Corporate Carbon Management Practices Reducing Corporate Carbon Emissions? Corp. Soc. Responsib. Environ. Manag. 2016, 23, 257–270. [Google Scholar] [CrossRef] [Green Version]
- Thomä, J.; Chenet, H. Transition risks and market failure: A theoretical discourse on why financial models and economic agents may misprice risk related to the transition to a low-carbon economy. J. Sustain. Finance Invest. 2017, 7, 82–98. [Google Scholar] [CrossRef]
- Andersson, M.; Bolton, P.; Samama, F. Hedging Climate Risk. Financ. Anal. J. 2016, 72, 13–32. [Google Scholar] [CrossRef]
- Thomä, J.; Coeslier, M.; Chastroux, P.; Weber, C. Allouer les impacts climatiques aux institutions financières. In Empreinte Carbone: Èvaluer Et Agir; Bourges, B., Gourdon, T., Broc, J.-S., Eds.; Presse des Mines: Paris, France, 2017; pp. 249–264. ISBN 978-2-35671-233-2. [Google Scholar]
- Pattberg, P. The emergence of carbon disclosure: Exploring the role of governance entrepeneurs. Environ. Plan. C Politics Space 2017, 35, 1437–1455. [Google Scholar] [CrossRef]
- Howard, A. Painting by the numbers—The difficulties of measuring sustainability. Schroders Expert 2016, 1, 34–37. [Google Scholar]
- Cahtterji, A.K.; Durand, R.; Levine, D.I.; Touboul, S. Do Ratings of Firm Converge? Implications for Managers, Investors and Strategy Researchers. Strateg. Manag. J. 2013, 37, 1597–1614. [Google Scholar]
- Carbone 4. Carbone 4 Impact Analytics: How to Measure the Contribution of a Portfolio to the Energy and Climate Transition; Carbone4: Paris, France, 2016. [Google Scholar]
- Heede, R. Tracing anthropogenic carbon dioxide and methane emissions to fossil fuel and cement producers, 1854–2010. Clim. Chang. 2014, 122, 229–241. [Google Scholar] [CrossRef]
- Barker, S. The Carbon Boomerang: Litigation Risk as a Driver and Consequence of the Energy Transition; MinterEllison: Sydney, Australia, 2017. [Google Scholar]
- Thomä, J.; Hayne, M.; Hagedorn, K.; Weber, C. 2 °C Portfolio Assessment Documentation; 2° Investing Initiative, Sustainable Energy Investing Metrics Consortium: Paris, France, 2016. [Google Scholar]
- Leaton, J.; Grant, A. 2 Degress of Seperation: Transition Risk for Oil and Gas in a Low-Carbon World; Carbon Tracker Initiative/UN PRI: London, UK, 2017. [Google Scholar]
- Dupré, S.; Jamison, T.; Burke, B. Limited Visibility: The Current State of Corporate Disclosure on Long-Term Risks; 2° Investing Initiative/European Investment Bank: Paris, France, 2017. [Google Scholar]
- Crehalet, E. Carbon—’15. Exane BNP Paribas SRI Climate Change; BNP Paribas: Paris, France, 2015. [Google Scholar]
- Thomä, J.; Dupré, S.; Gorius, A.; Coeslier, M. Optimal Diversification and the Energy Transition. J. Environ. Invest. 2015, 6, 23–41. [Google Scholar]
- TPT Retirement Scheme. Climate Change Disclosure Report: Risk and Opportunities in the Growth Portfolio. TPT Retirement Scheme. 2017. Available online: http://www.tpt.org.uk/docs/default-source/investments/responsible-investment/TPT-Climate-Change-Report (accessed on 30 November 2017).
- AXA Group. Award on Investor Climate-related Disclosures. 2016. Available online: https://cdn.axa.com/www-axa-com%2Fcb46e9f7-8b1d-4418-a8a7-a68fba088db8_axa_investor_climate_report.pdf (accessed on 30 November 2017).
- ERAFP. SRI Policy: Towards the Alignment with International Global Warming Containment Objectives. Cahier 3 ERAFP. 2016. Available online: https://www.rafp.fr/en/sites/rafp_en/files/publication/file/rafp-ra_uk-cahier_3-bat.pdf (accessed on 30 November 2017).
- State Street Portfolio Transition Management. Available online: http://www.statestreet.com/solutions/by-capability/ssgm/portfolio-solutions/transition-management.html (accessed on 30 November 2017).
- Modigliani, F.; Miller, M.H. The Cost of Capital, Corporate Finance and the Theory of Investment. Am. Econ. Rev. 1958, 48, 261–297. [Google Scholar]
- Stephens, S.; Guez, H.; Smia, L. Estimating Portfolio Coherence with Climate Scenarios; Mirova Research: Paris, France, 2017. [Google Scholar]
- Grüning, C.; Michaels, A.; Moslener, U.; Zhuang, M. Climate Metrics for Debt and Equity Portfolios: A Framework for Analysis; Frankfurt School of Finance UNEP Center Working Paper; Frankfurt School of Finance: Frankfurt, Germany, 2017. [Google Scholar]
- MSCI ESG Ratings Methodology. Available online: https://www.msci.com/eqb/methodology/meth_docs/Executive_Summary_MSCI_ESG_Ratings_Methodology.pdf (accessed on 30 November 2017).
- Morningstar/Sustainalytics ESG Ratings Methodology. Available online: https://corporate1.morningstar.com/Morningstar-Sustainability-Rating-Methodology-2/ (accessed on 30 November 2017).
- Climetrics Impact Rating. Available online: https://climetrics-rating.org/assets/pdf/Climetrics-Rating-Methodology.pdf (accessed on 30 November 2017).
- AXA Group. AXA Group Policy on Investments in Coal Mining and Coal-Based Energy. Available online: https://www-axa-com.cdn.axa-contento-118412.eu/www-axa-com%2Fab00881a-160f-434f-b76d-ef46d1b85843_axa_coal_policy_b.pdf (accessed on 30 November 2017).
- Allianz. Allianz Statement on Coal-based Investments. Available online: https://www.allianz.com/v_1448622620000/media/responsibility/Energy_Guideline_PublicVersion_final.pdf (accessed on 30 November 2017).
- Thomä, J.; Murray, C.; Hayne, M. Out of the Fog: Quantifying the Alignment of Swiss Pension Funds and Insurances with the Paris Agreement; 2° Investing Initiative: Paris, France, 2017. [Google Scholar]
Figure 1.
(a) The correlation between Carbon Scope 1 emissions and installed coal and gas power capacity for a sample of 50 electric utilities, based on Trucost greenhouse gas (GHG) emissions data and GlobalData electric power data; (b) The correlation between ESG Fund ratings using different scoring systems [22].

Figure 2.
The correlation between Scope 1 GHG emissions of a sample of 50 global listed electric power utilities and the share of renewable power in planned capacity additions, based on Trucost Scope 1 data and GlobalData power investment data.
Figure 2.
The correlation between Scope 1 GHG emissions of a sample of 50 global listed electric power utilities and the share of renewable power in planned capacity additions, based on Trucost Scope 1 data and GlobalData power investment data.
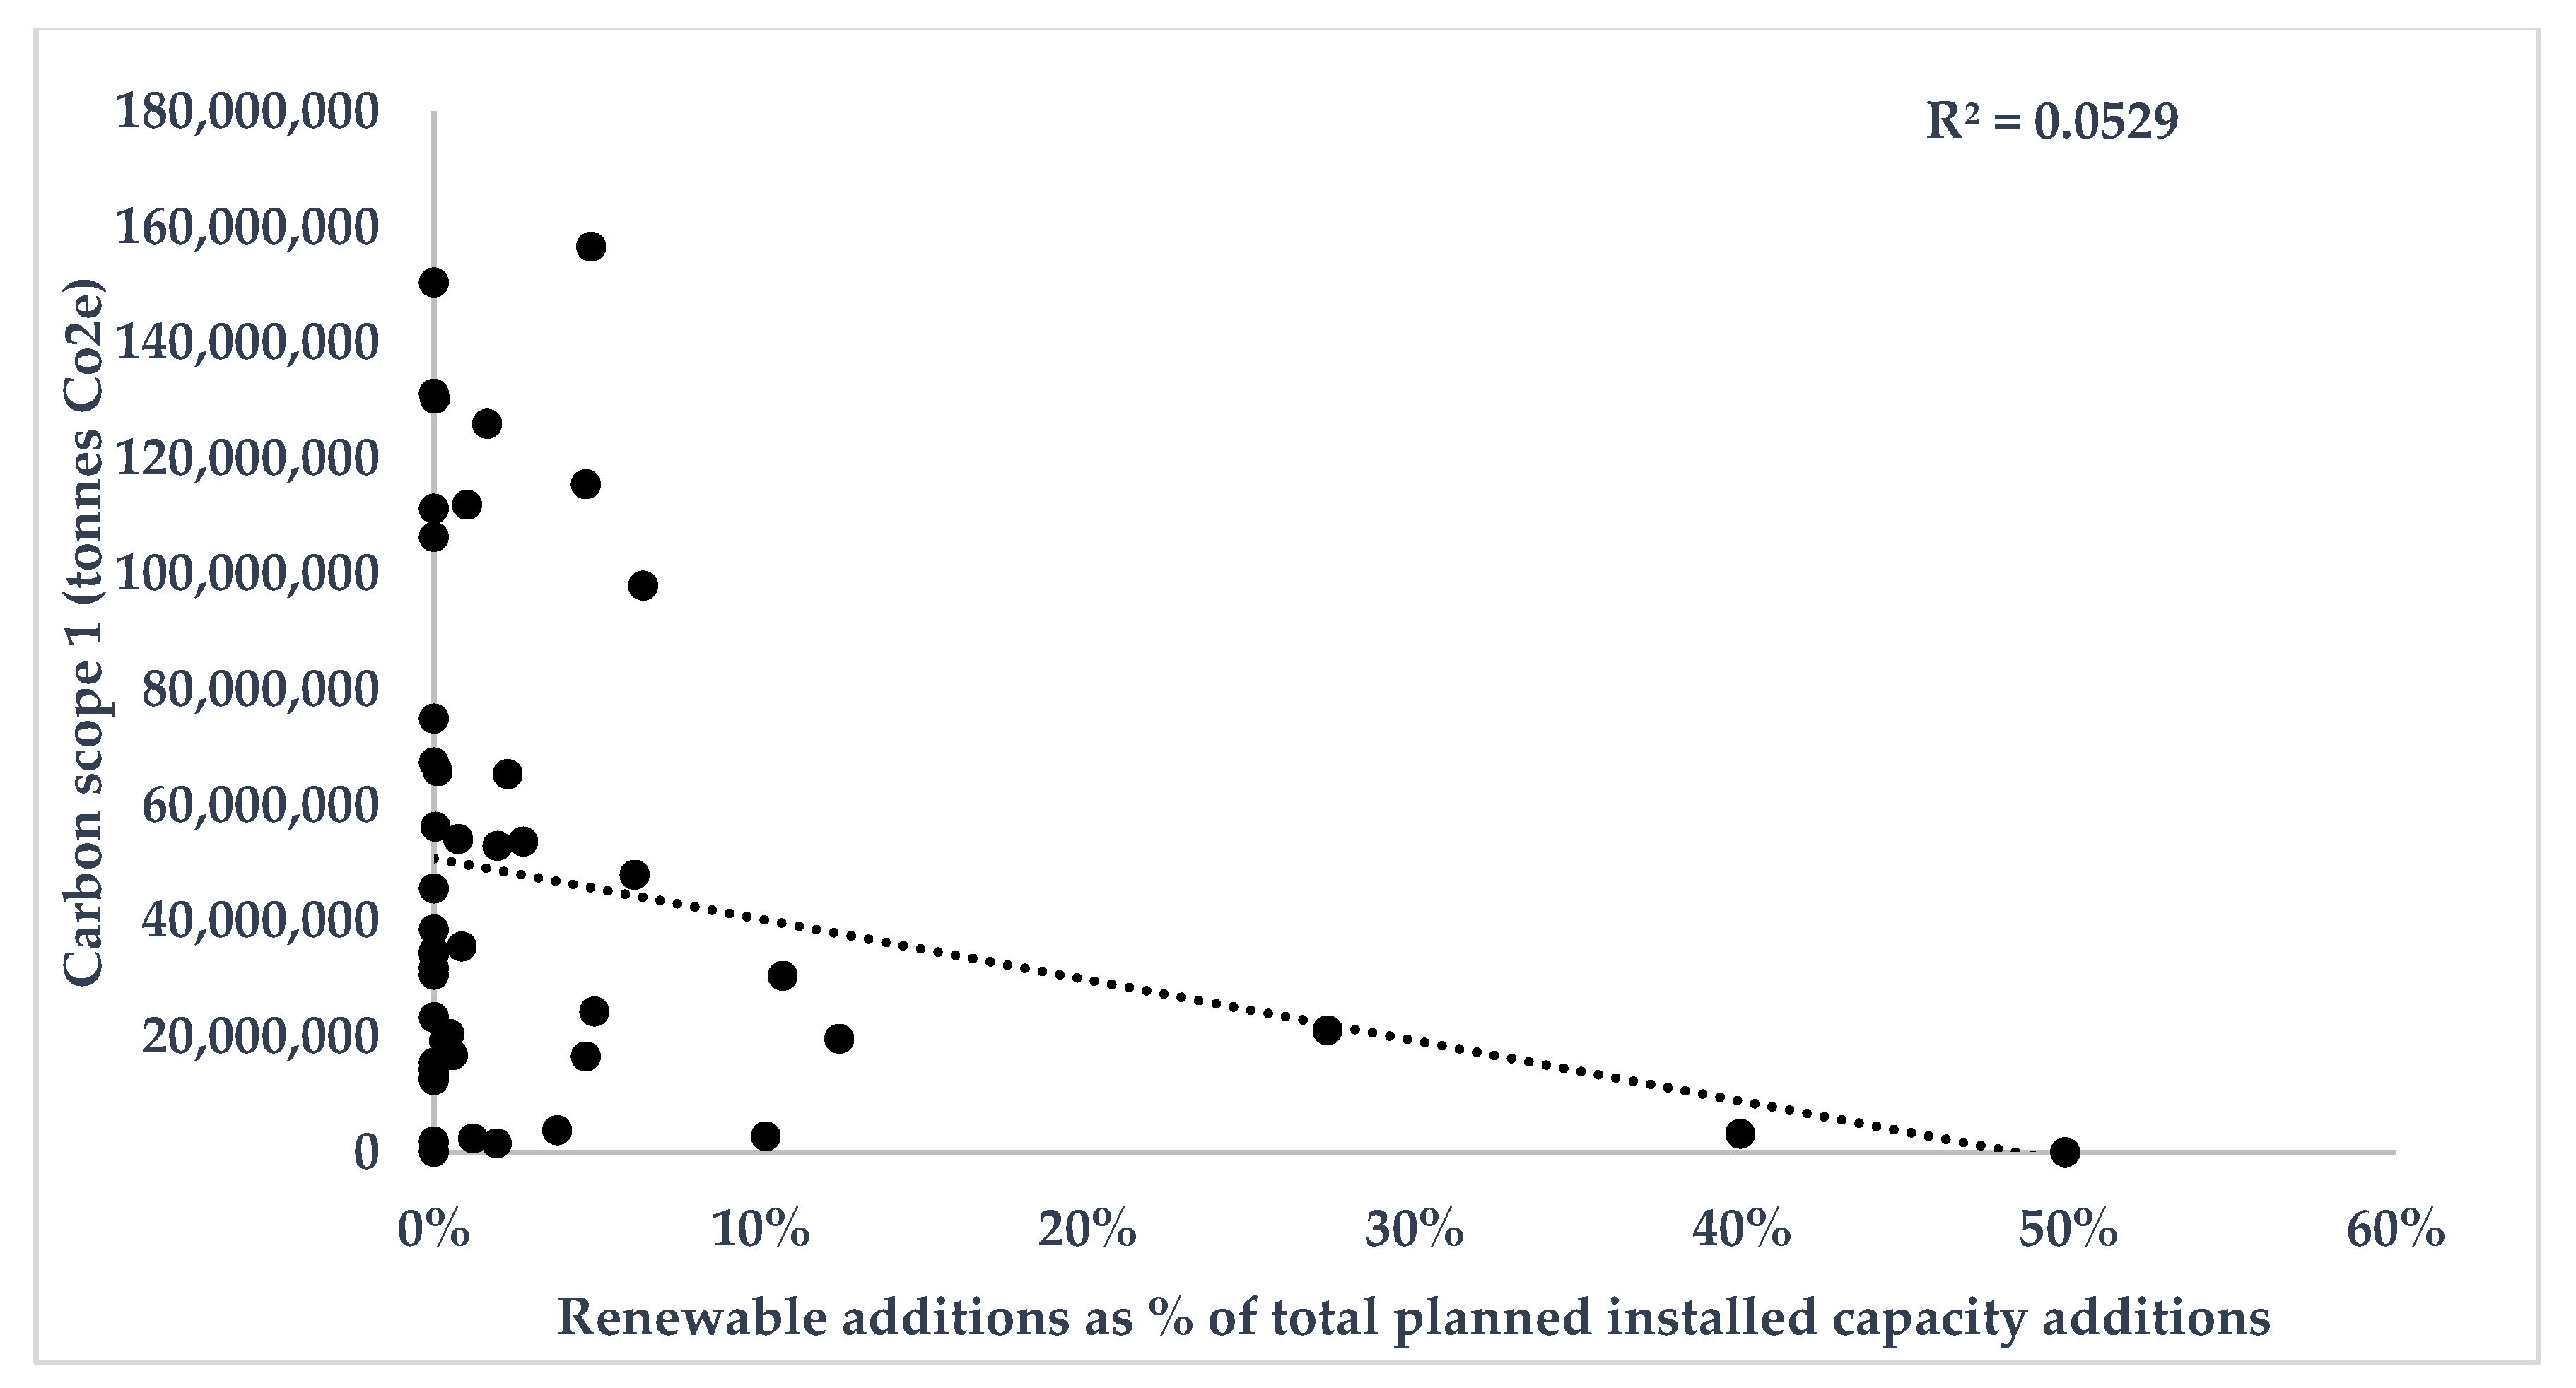
Figure 3.
The annual gas production of a corporate bonds portfolio, allocated based on the portfolio weight approach, accounting for maturing corporate bonds and keeping corporate bonds constant, based on portfolio data and GlobalData forward-looking gas production estimates.
Figure 3.
The annual gas production of a corporate bonds portfolio, allocated based on the portfolio weight approach, accounting for maturing corporate bonds and keeping corporate bonds constant, based on portfolio data and GlobalData forward-looking gas production estimates.
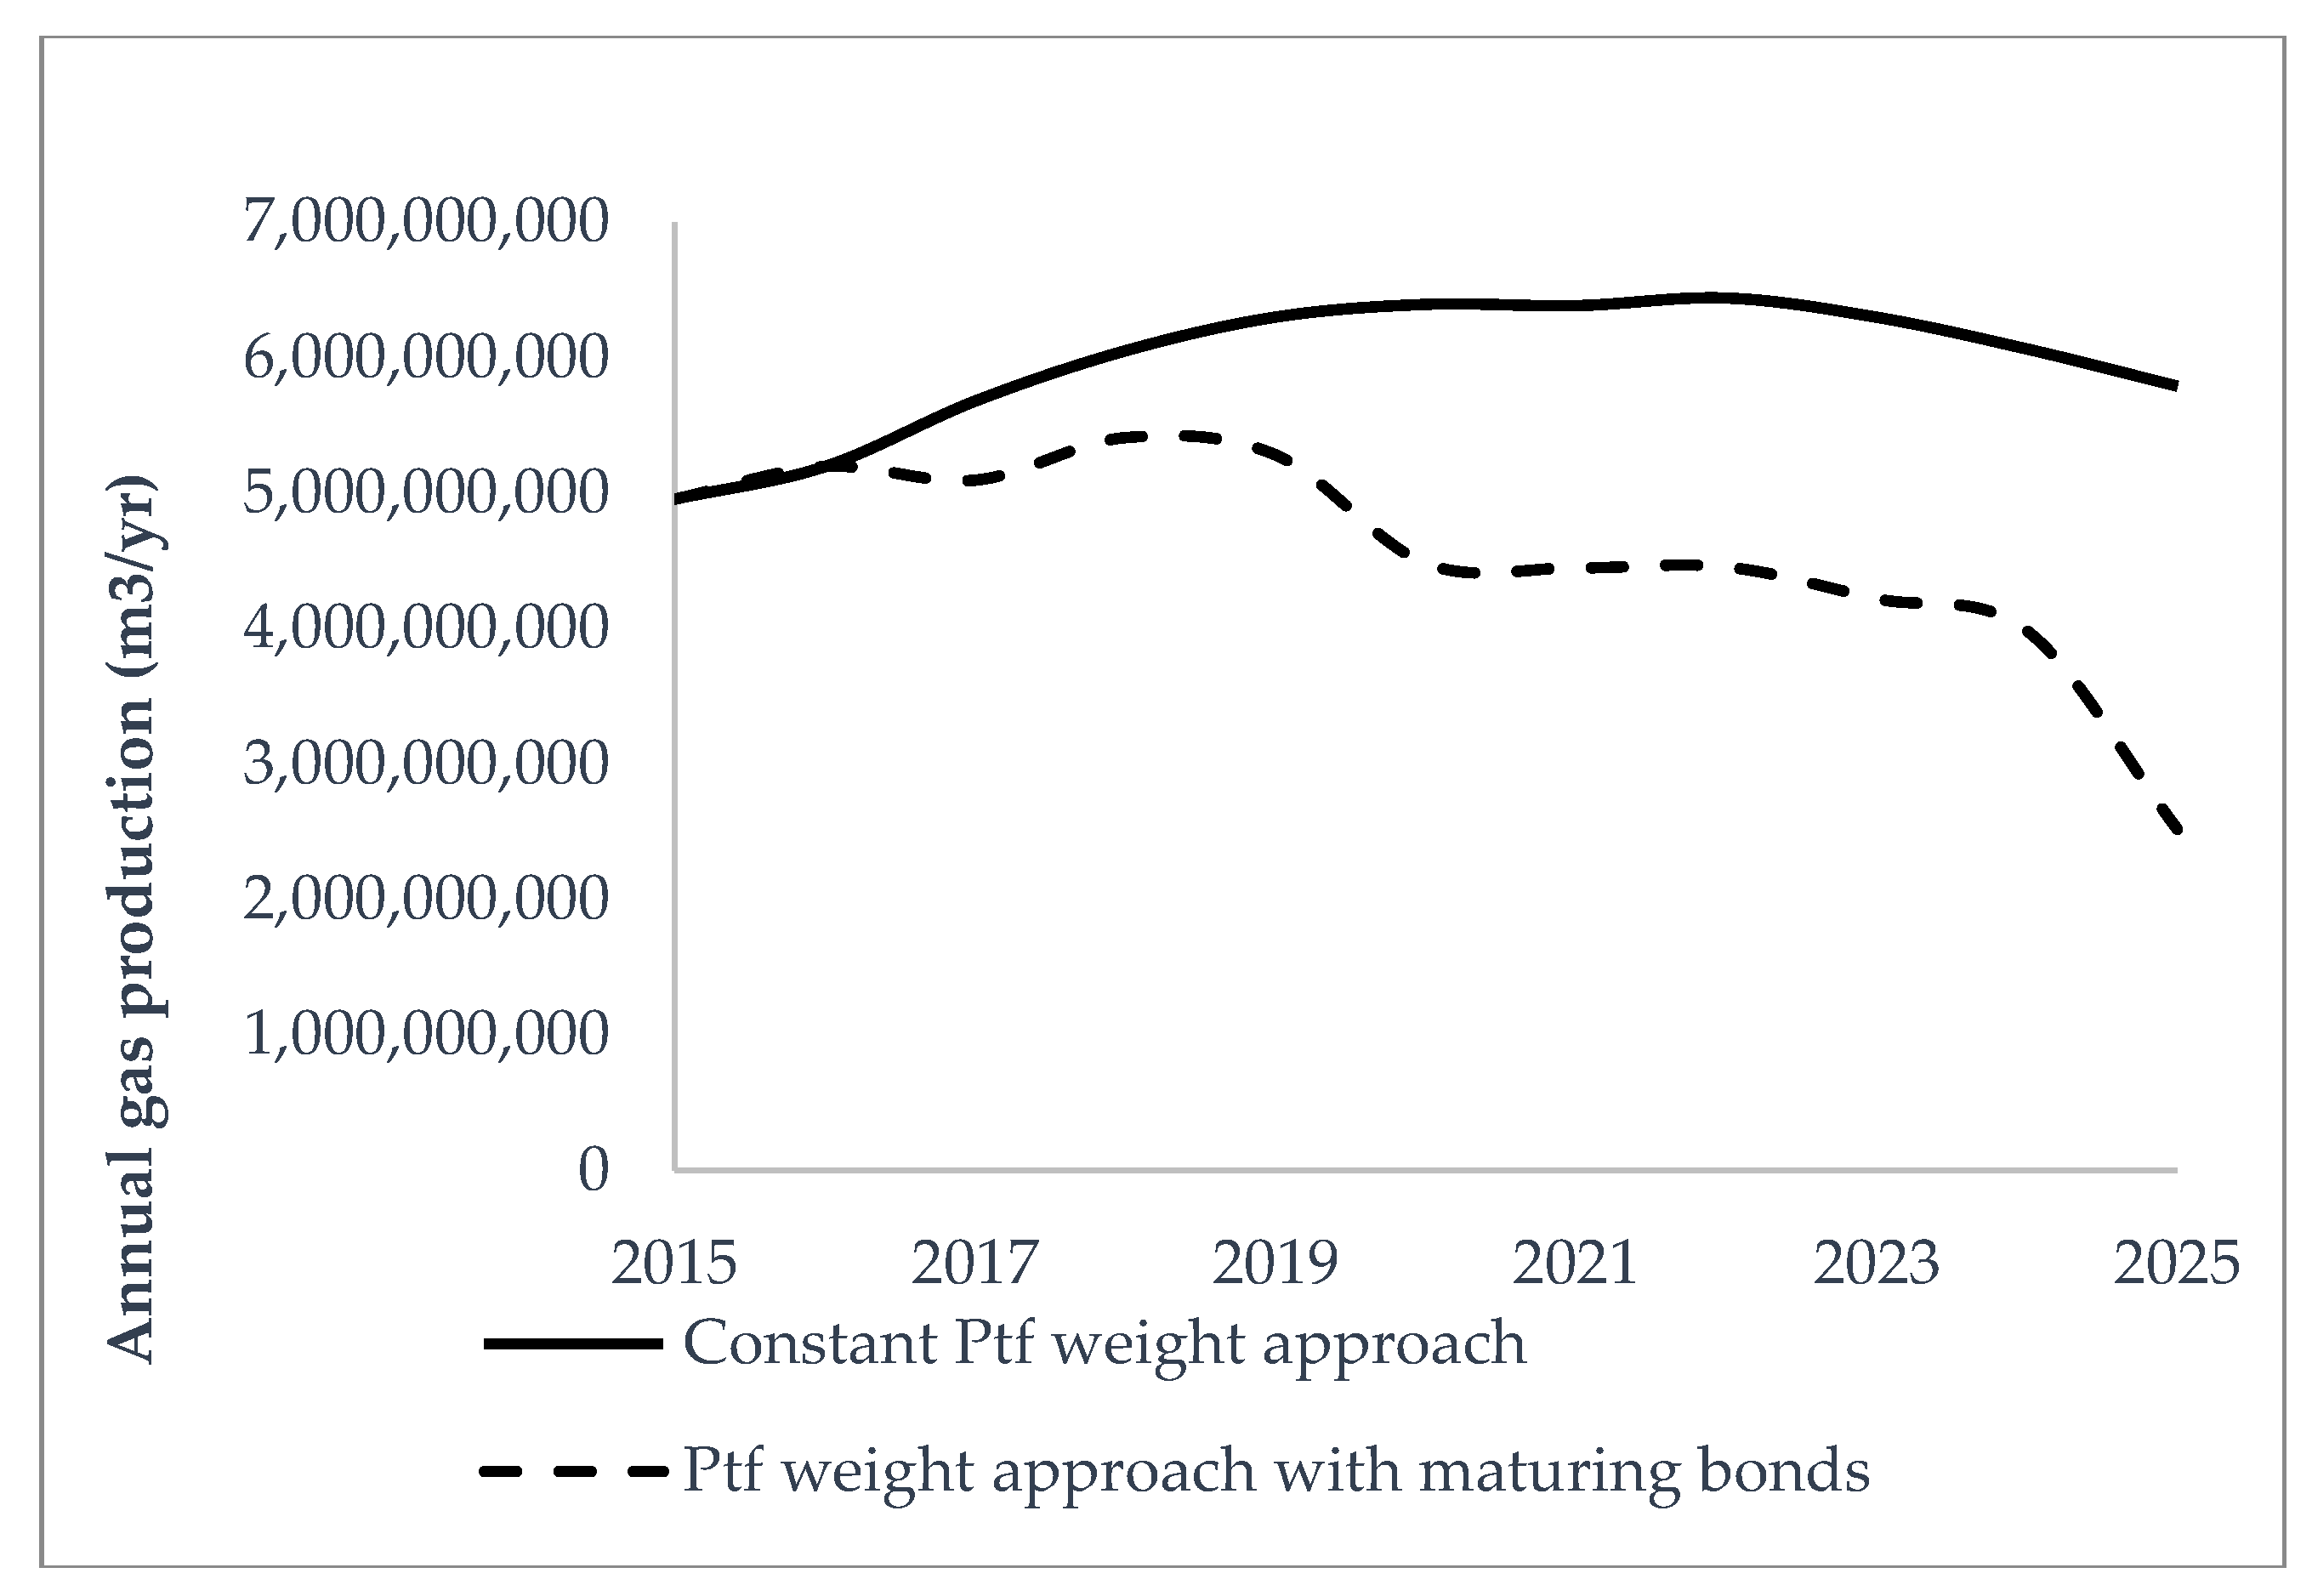
Figure 4.
The share of Scope 1 and Scope 2 in total GHG emissions of the sector, based on Beyond Financials data.
Figure 4.
The share of Scope 1 and Scope 2 in total GHG emissions of the sector, based on Beyond Financials data.
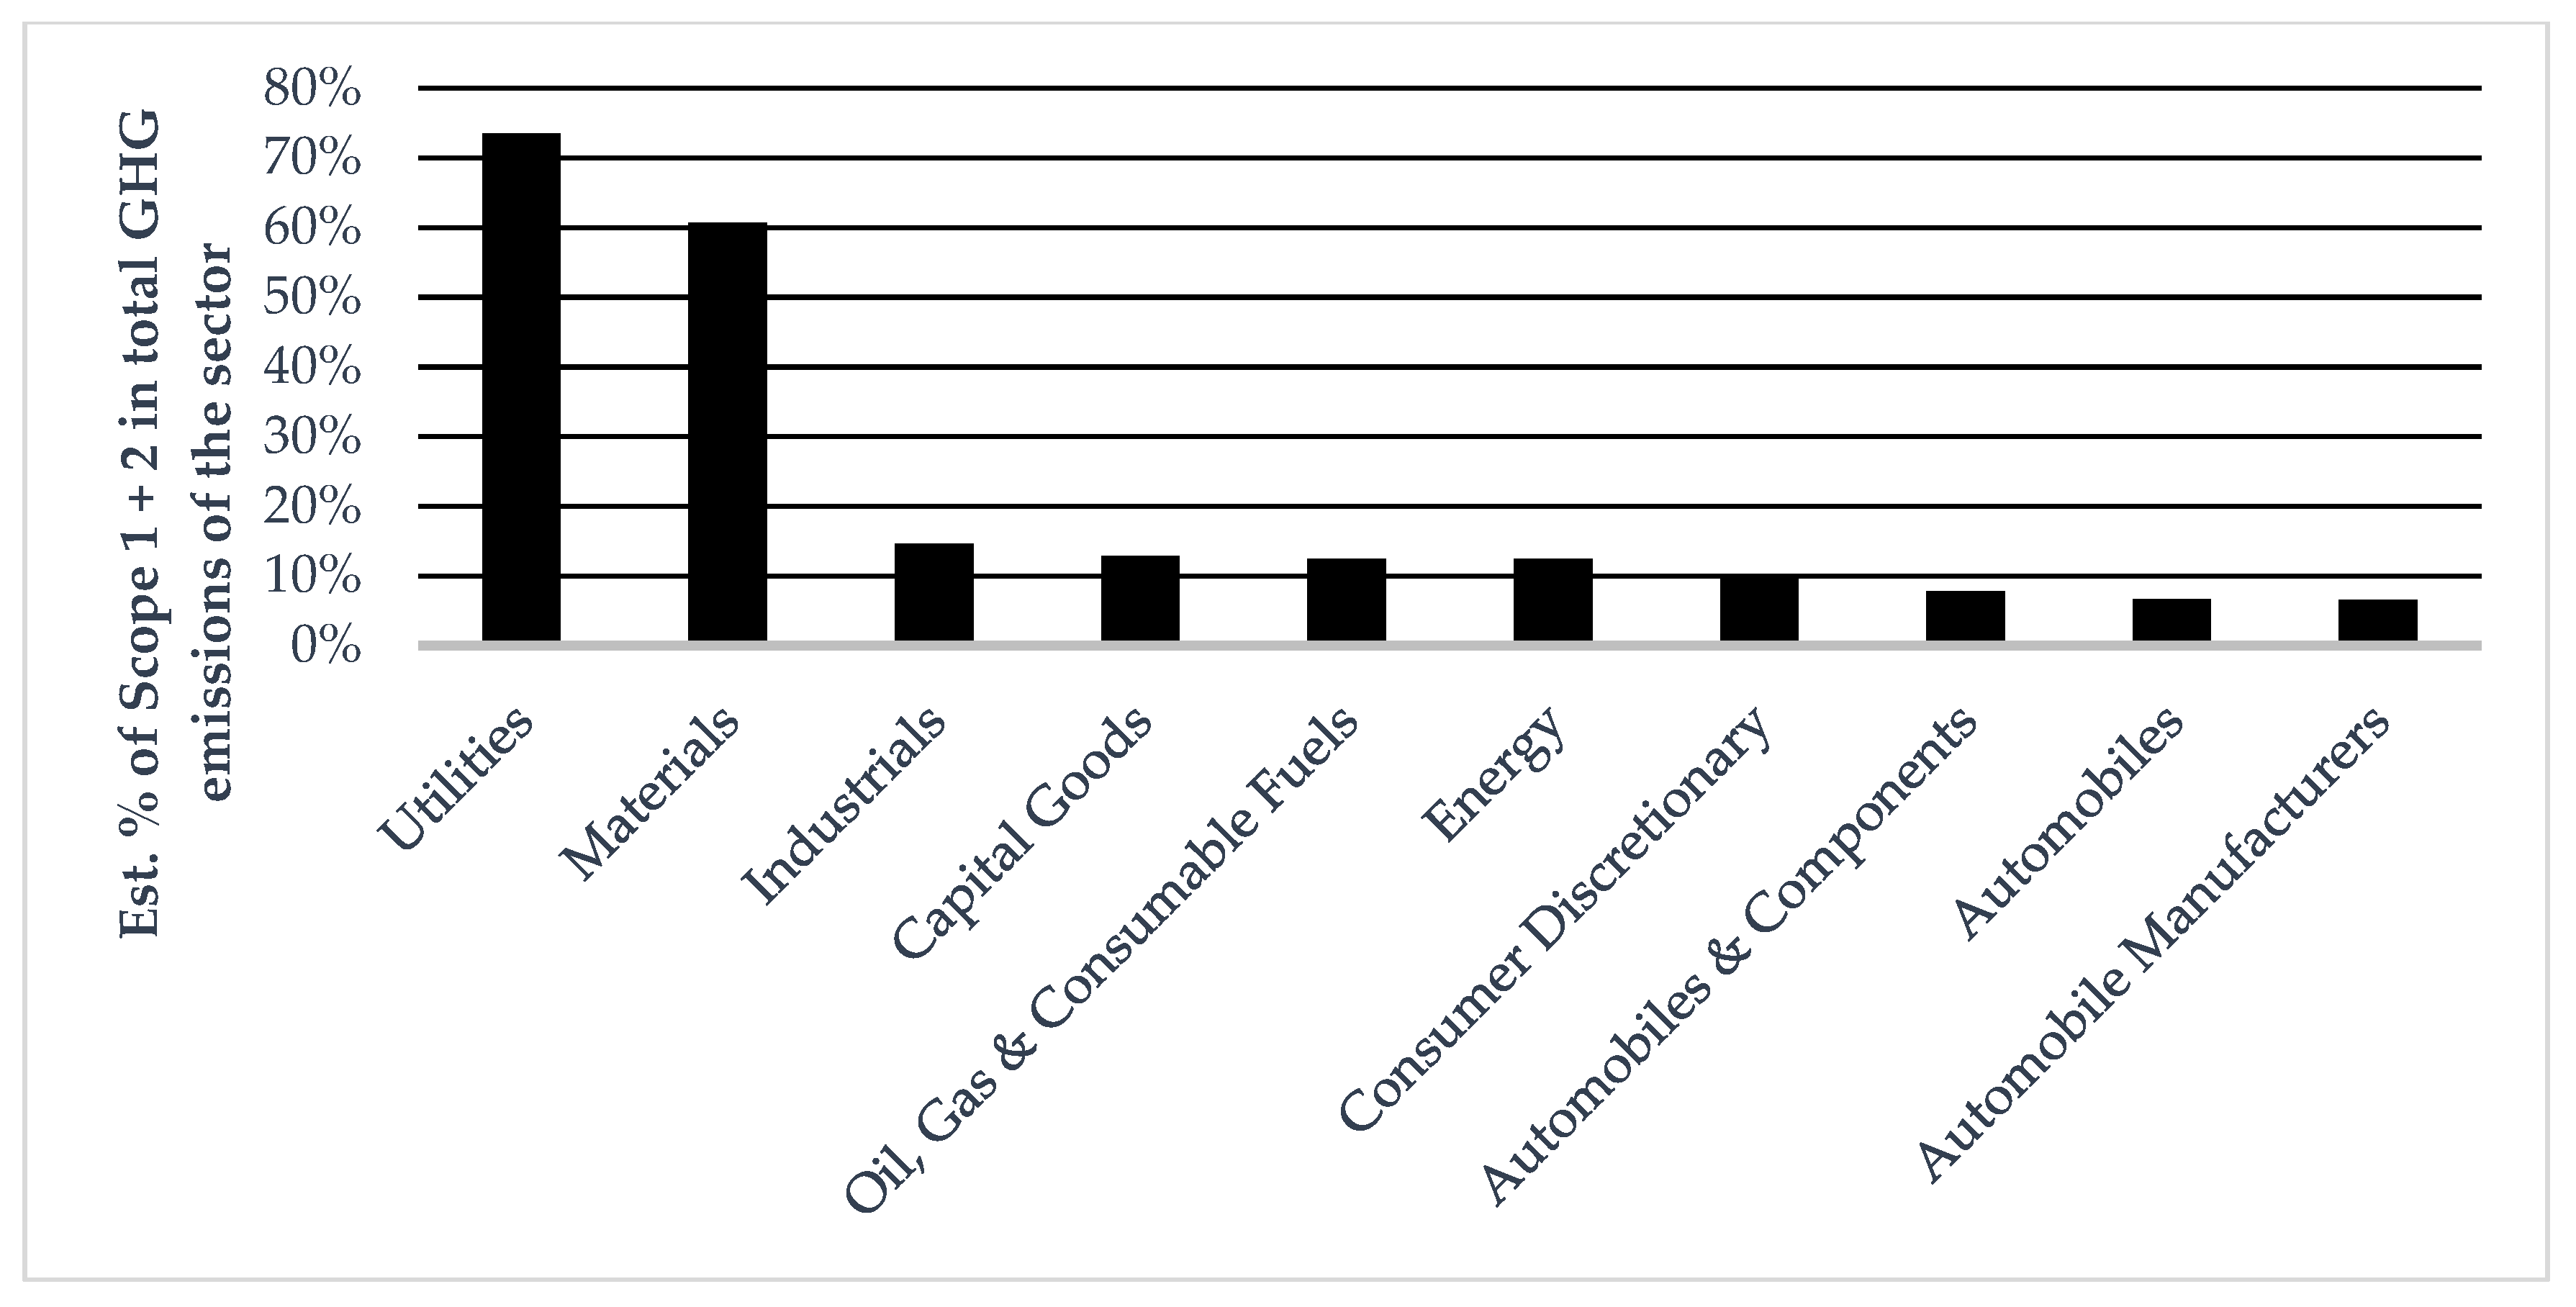
Figure 5.
The link between equity investments and investments in the real economy [1].
Figure 5.
The link between equity investments and investments in the real economy [1].
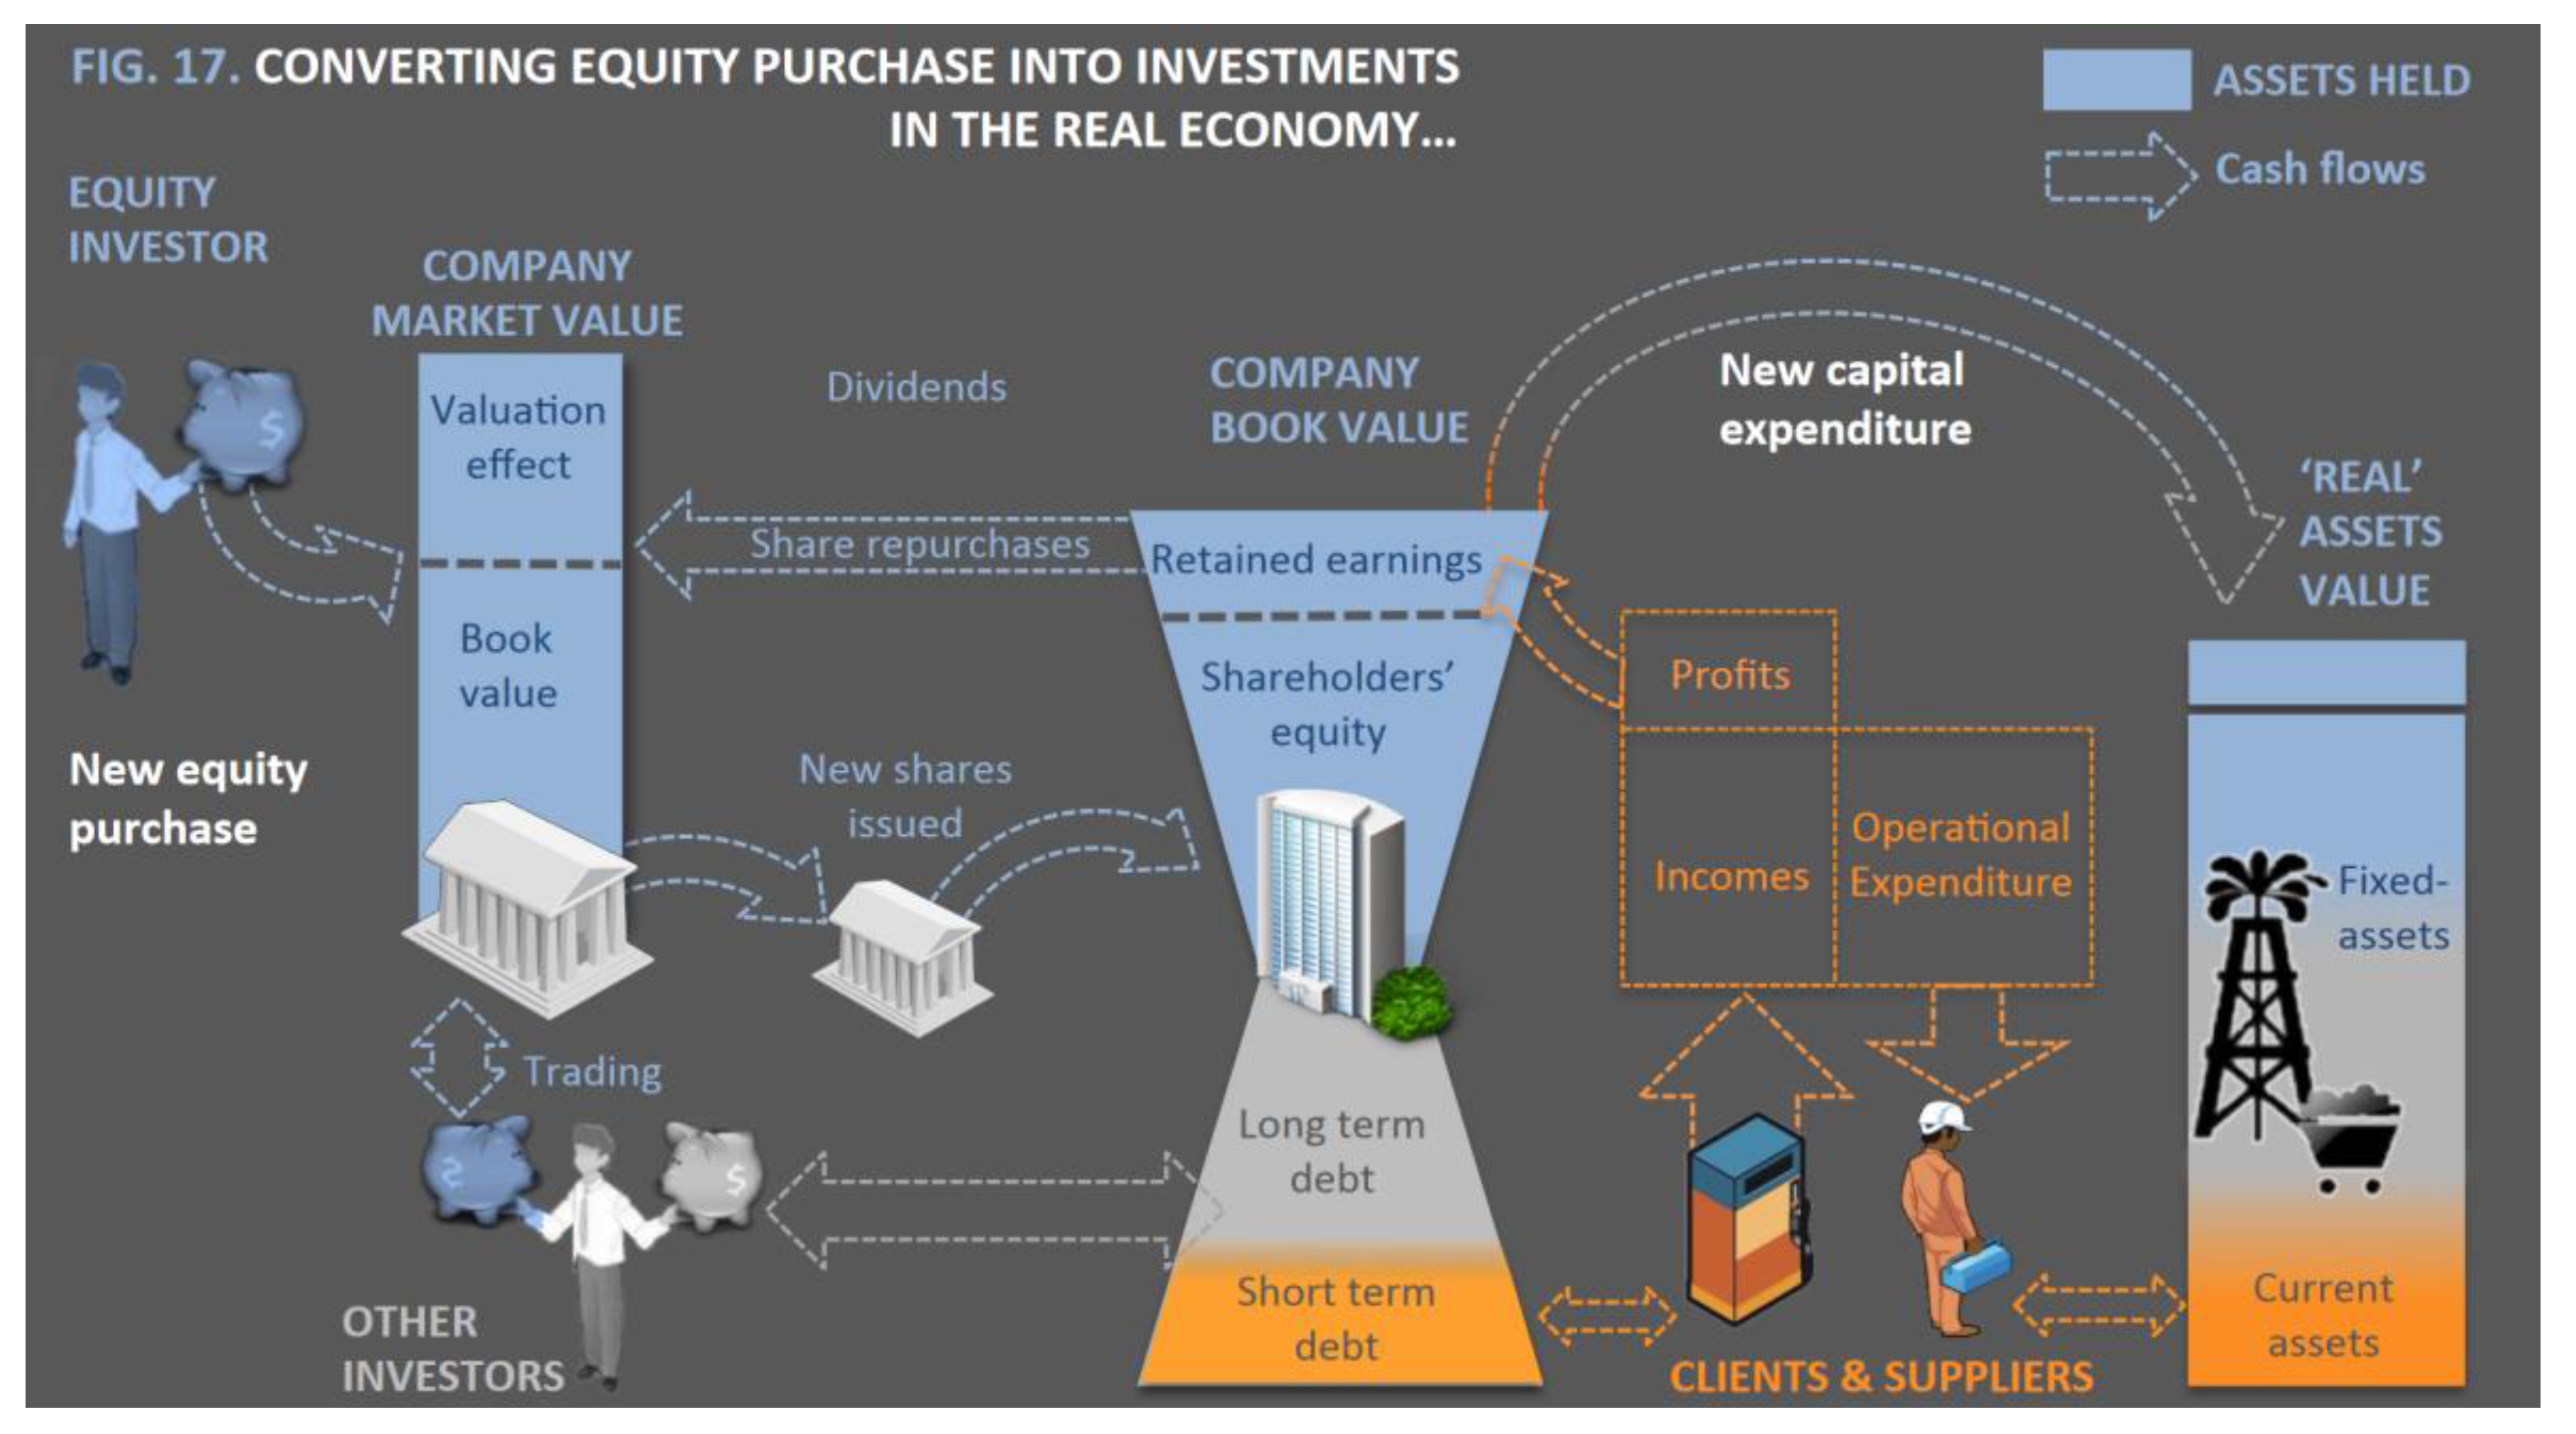
Figure 6.
(a) The power mix of a sample corporate bonds portfolios based on two different allocation rules, based on Bloomberg and GlobalData; (b) The differences in portfolio weight associated with a consistent carbon footprint of the portfolio for five different oil and gas companies, based on Carbon Tracker Initiative (2017) and Bloomberg data.
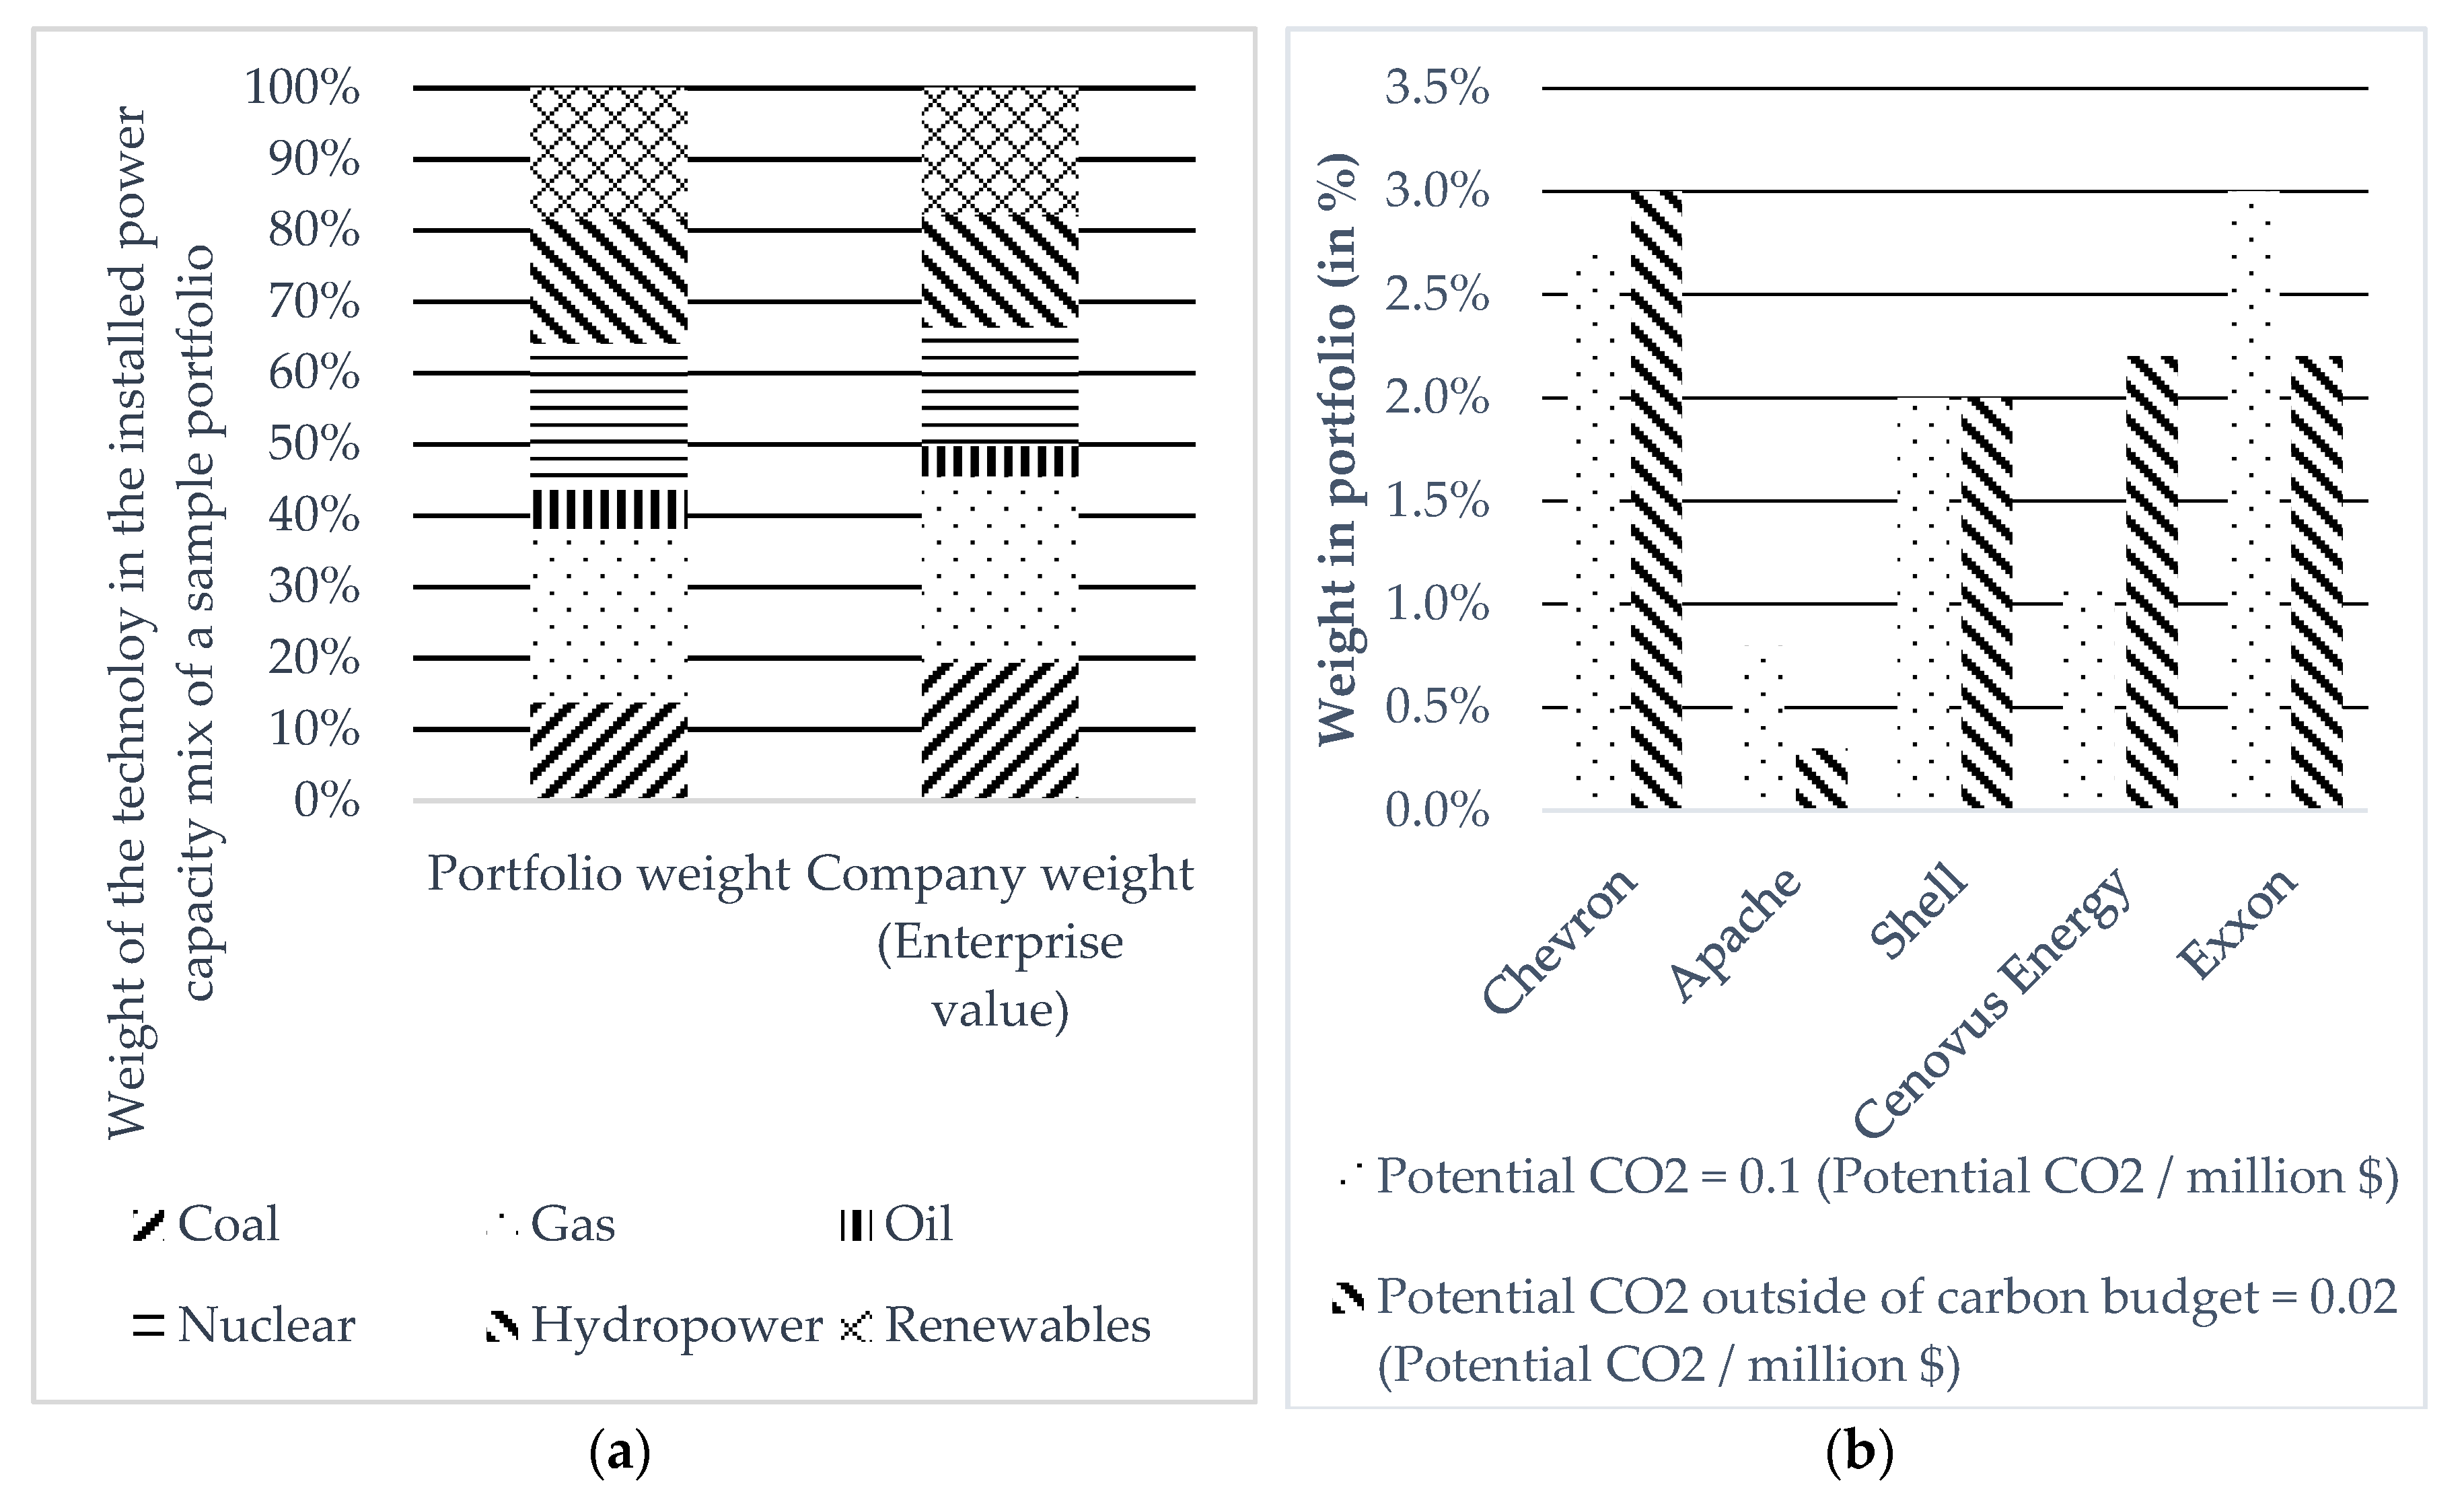
Figure 7.
(a) The absolute gross Scope 1 and Scope 2 GHG emissions of HeidelbergCement and the intensity normalized by revenues and enterprise value respectively; (b) The absolute gross Scope 1 and Scope 2 GHG emissions of HeidelbergCement and the intensity normalized by revenues and enterprise value respectively. Source: Authors, based on Bloomberg data and company reporting.
© 2018 by the authors. Licensee MDPI, Basel, Switzerland. This article is an open access article distributed under the terms and conditions of the Creative Commons Attribution (CC BY) license (http://creativecommons.org/licenses/by/4.0/).
Share and Cite
MDPI and ACS Style
Thomä, J.; Dupré, S.; Hayne, M. A Taxonomy of Climate Accounting Principles for Financial Portfolios. Sustainability 2018, 10, 328. https://doi.org/10.3390/su10020328
AMA Style
Thomä J, Dupré S, Hayne M. A Taxonomy of Climate Accounting Principles for Financial Portfolios. Sustainability. 2018; 10(2):328. https://doi.org/10.3390/su10020328
Chicago/Turabian StyleThomä, Jakob, Stan Dupré, and Michael Hayne. 2018. "A Taxonomy of Climate Accounting Principles for Financial Portfolios" Sustainability 10, no. 2: 328. https://doi.org/10.3390/su10020328
Note that from the first issue of 2016, this journal uses article numbers instead of page numbers. See further details here.