Energy Recovery from the Organic Fraction of Municipal Solid Waste: A Real Options-Based Facility Assessment


1
Department of Innovation and Engineering, Università del Salento, 73100 Lecce, Italy
2
Department of Mechanics, Mathematics and Management, Politecnico di Bari, 70126 Bari, Italy
*
Author to whom correspondence should be addressed.
Sustainability 2018, 10(2), 368; https://doi.org/10.3390/su10020368
Submission received: 13 December 2017
/
Revised: 24 January 2018
/
Accepted: 30 January 2018
/
Published: 31 January 2018
Abstract
:During the last years, due to the strict regulations on waste landfilling, anaerobic digestion (AD) of the organic fraction of municipal solid waste (OFMSW) is increasingly considered a sustainable alternative for waste stabilization and energy recovery. AD can reduce the volume of OFMSW going to landfill and produce, at the same time, biogas and compost, all at a profit. The uncertainty about the collected quantity of organic fraction, however, may undermine the economic-financial sustainability of such plants. While the flexibility characterizing some AD technologies may prove very valuable in uncertain contexts since it allows adapting plant capacity to changing environments, the investment required for building flexible systems is generally higher than the investment for dedicated equipment. Hence, an adequate justification of investments in these flexible systems is needed. This paper presents the results of a study aimed at investigating how different technologies may perform from technical, economic and financial standpoints, in presence of an uncertain organic fraction quantity to be treated. Focusing on two AD treatment plant configurations characterized by a technological process with different degree of flexibility, a real options-based model is developed and then applied to the case of the urban waste management system of the Metropolitan Area of Bari (Italy). Results show the importance of pricing the flexibility of treatment plants, which becomes a critical factor in presence of an uncertain organic fraction. Hence, it has to be taken into consideration in the design phase of these plants.
1. Introduction
In recent years, policy makers, researchers, and practitioners have devoted attention to environmental sustainability issues both in urban and industrial environments to identify and adopt sustainable systems configurations compliant with targets and regulations set by the European Union. In urban area, sustainable mobility [1], energy efficiency [2], and integrated waste management [3] are the key elements of the “smart city” concept [4]. Between them, waste management is one of the most critical issue to face with. In 2012, the municipal solid waste production in the world amounted to about 1300 million metric tons, and it is estimated that, in 2025, the production will reach about 2200 million metric tons per year with approximately 46% organic contents [5]. In many industrialized countries, organics are the predominant fraction of municipal solid waste [6,7]; therefore, achieving high rates of separation requires a strengthening of the recovery and enhancement of the organic fraction of municipal solid waste (OFMSW). Although for many years municipal waste was disposed in landfills, during the last decade, due to its environmental impact, strict regulations allow landfilling only under special considerations [8,9]. In landfills, the natural anaerobic OFMSW degradation produces a biogas that is generally released to the atmosphere or used for energy production thanks to its high methane content [10]. A system of wells and pipes collects the biogas and conveys it to a boiler or turbine where it is combusted to generate heat or electricity, or simply flared [10]. In [11], the environmental and economic benefits from using landfill methane for energy production are largely describe. However, due to the large environmental impact of landfills, many of them will soon be turned off in Europe because of the evolution in legislation [12]. The tendency is, however, to decrease the amount of waste disposed in landfills which use should be limited to dispose the remaining waste [13]. This tendency is confirmed by the significant increase of the domestic separation and collection of waste fractions. Biological treatments represent the sustainable alternative for the putrescent fraction collected separately. Treatment of biodegradable waste in composting plants is an environmentally sustainable practice, already in force for twenty years, since it allows the disposal of the OFMSW without negative impacts on the environment. However, the compost, even in the case of high quality, has no market in practice, mainly because of large quantities of fertilizers are available at no cost [14].
Among biological treatments, anaerobic digestion is often one of the most cost-effective, due to the high energy recovery linked to the process and the limited environmental impact [15,16]. Anaerobic digestion is an additional treatment to compost OFMSW, producing both a good fertilizer and biogas. Biogas is a versatile renewable energy source, consisting of up to 65% methane and could be used for replacing fossil fuels in power and heat production [17]. From this perspective, the anaerobic digestion makes truly sustainable the organic waste cycle management. In comparison with incineration or landfilling, anaerobic digestion does not represent a potentially polluting process when the produced biogas is adequately used [16,18] and in many cases the costs are relatively lower than aerobic treatment [12]. Actually, anaerobic digestion is a promising and sustainable process for the treatment of organic waste [19,20,21]. When processing the biogas properly, there is a net reduction in the methane discharges into the atmosphere, thus decreasing greenhouse emissions, and smells and the sanitary disadvantages of landfills are avoided [22,23].
Anaerobic digestion, however, has some critical aspects such as the complexity of the start-up phase of the reactors [24,25], the longer time required to achieve biostabilization in comparison to the aerobic process [26], and the presence of toxic and inhibiting compounds when the OFMSW treated is not properly separated from the non-organic waste [13]. Process control needs complex analysis because it is sensible to different waste composition affecting kinetics [19,20,21]. Another main issue related to the anaerobic digestion is the uncertainty on OFMSW conferred to the plant. Since the outputs of the process (energy, compost, etc.), namely the economic benefits, strongly depend on the amount of OFMSW to be treated, the uncertainty about OFMSW may undermine the economic-financial feasibility of such plants.
In light of this, the objective of this study is to investigate how different technologies may perform from technical, economic and financial standpoints, in presence of an uncertain organic fraction. This will support the decision-maker in the selection of the proper plant configuration based on the conditions of uncertainty characterizing the context in which they will operate. In particular, two AD (Anaerobic Digestion) treatment plant configurations characterized by a different technological process are considered; they differ each other in the degree of “flexibility” (modularity), i.e., the possibility of adapting their production capacity in response to the evolution of OFMSW interception. While this flexibility may be very worth in uncertain and risky contexts since it gives the plant the capacity to adapt to changing and uncertain environment, the investment required for building flexible systems is generally higher than the investment for dedicated equipment. Hence, an adequate justification of investments in these flexible systems is needed. Techniques traditionally used for economic and financial evaluations, such as those based on Discounted Cash Flows (DCF) analysis, fail in capturing the value of flexibility embedded in some kind of investments [27]. To address this issue, this paper uses the Real Options Theory, which, building on the concept of financial option, enables for modelling and pricing the flexibility to change the production capacity in response to the evolution of uncertainty about the OFMSW interception [28,29]
The paper is organized as follows. In the next section, a brief overview of the main OFMSW treatment technologies is presented. Then, focusing on two AD (Anaerobic Digestion) treatment plant configurations characterized by a different technological process, Section 3 illustrates the real options-based model for the economic and financial evaluation of the considered configurations in presence of an uncertain organic fraction. Section 4 shows the results obtained by applying the proposed model to the case of the urban waste management system of the Metropolitan Area of Bari (Italy). Finally, conclusions end the paper.
2. Anaerobic Digestion Technologies of OFMSW
The growing awareness of the negative environmental effects caused by the landfills and incinerators has led public interest to increasingly focus on more sustainable technologies for the treatment of the residual wastes. Eligible technologies are those which allow for recovering the matters and/or the energy from waste, while reducing the volume of residual materials and the potential of fermentation, and thus pollutant. Mechanical Biological Treatment (MBT), including Anaerobic Digestion (AD), composting, heat treatment, landfill and a combination of MBT and heat treatment named Mechanical Heat Treatment (MHT) [30,31] are the technologies most frequently adopted to treat residual wastes. In particular, during the last years, anaerobic digestion of OFMSW and other organic waste has been widely used as a form to recover energy in the form of biogas (methane). The large diffusion of such technology justifies the growing attention that this process has being receiving from researchers, companies and governmental agencies that are actively working to improve the processes [12,32].
AD of organic matter has gained much attention thanks to its low cost, low environmental impact, low production of residual sludge, and recovery of biogas for use as an energy source. Main components of biogas obtained from the AD of solid waste are methane (48–65%), carbon dioxide (36–41%), nitrogen (up to 17%), oxygen (<1%) and traces of other gases [33]. AD with biogas production is the result of an anaerobic reaction chain with several steps: hydrolysis, acidogenesis, acetogenesis, and methanogenesis [34]. Digestion is not complete until the substrate has undergone all of these stages, each of them having a physiologically unique bacteria population that requires very different environmental conditions. The digestion process takes place at mesophilic (35–42 °C) or thermophilic (45–60 °C) temperature conditions. Two process types are mainly adopted, namely wet and dry fermentation. In the first case, the biomass in input to the digester has a solid concentration below 12%, whereas, in dry digestion plants, solid concentration is higher than 20%. With reference to the process continuity, AD technologies can be classified into batch and continuous systems. In a batch system, the reactor is filled with the feedstock and left for a pre-defined period, during which digestion and biogas production take place. At the end of the period, the reactor is empty, and the process restarts. In a continuous system, the biomass is regularly fed into the reactor, and at the same time effluent is discharged [34]. All wet digestion processes are operated continuously, whereas, for dry fermentation, both batch and continuous processes are adopted [17]. Moreover, a one-stage or a two-stage process can be adopted. In a one-stage system, all biochemical reactions take place in one reactor, while a two-stage system consists of a high-loaded main fermenter and a low-loaded secondary fermenter in series treating the digestate in output from the first. More details on different AD processes and plant configurations are in [17,34,35].
The AD of solid organic waste has been largely discussed and investigated in scientific literature. A comprehensive review on specific topics and results obtained in this field are in [12,32]. In 2006, about 87% of the EU full-scale plants for anaerobic digestion of OFMSW and biowastes were one-stage systems, and were approximately evenly split between “wet” and “dry” operating conditions [36]. Dry technologies offer many advantages, such as the simple configuration of the reactor and the low water consumption (if compared with the wet technology). This implies a simplification of OFMSW pre-treatment and digestate post-treatment, thus producing significant environmental benefits. Main characteristics of the dry technology are listed in Table 1. The next two subsections discuss dry continuous and batch processes.
2.1. Continuous Processes
Research during the 1980s demonstrated that in case the wastes were kept in their original solid state, i.e., not diluted with water, biogas yield and production rate values were comparable with those of wet systems [37,38,39]. The main challenge of this technique was handling, pumping and mixing solid streams rather than keeping biochemical reactions going at high total solid (TS) concentration values [35].
Many dry continuous technologies are available, but one of the most spread in the market is the Dranco digestion technology that was developed by studying and optimizing the spontaneous “dry” digestion that takes place in a landfill. The Dranco process is well suited for the treatment of various waste streams such as bio-waste, mixed waste, industrial organics, paper waste, market waste, rural waste, manure, sewage sludge, and others. The process operates at 50–58 °C with retention time (residence period of the organic matter in the reactor) of 20 days [40].
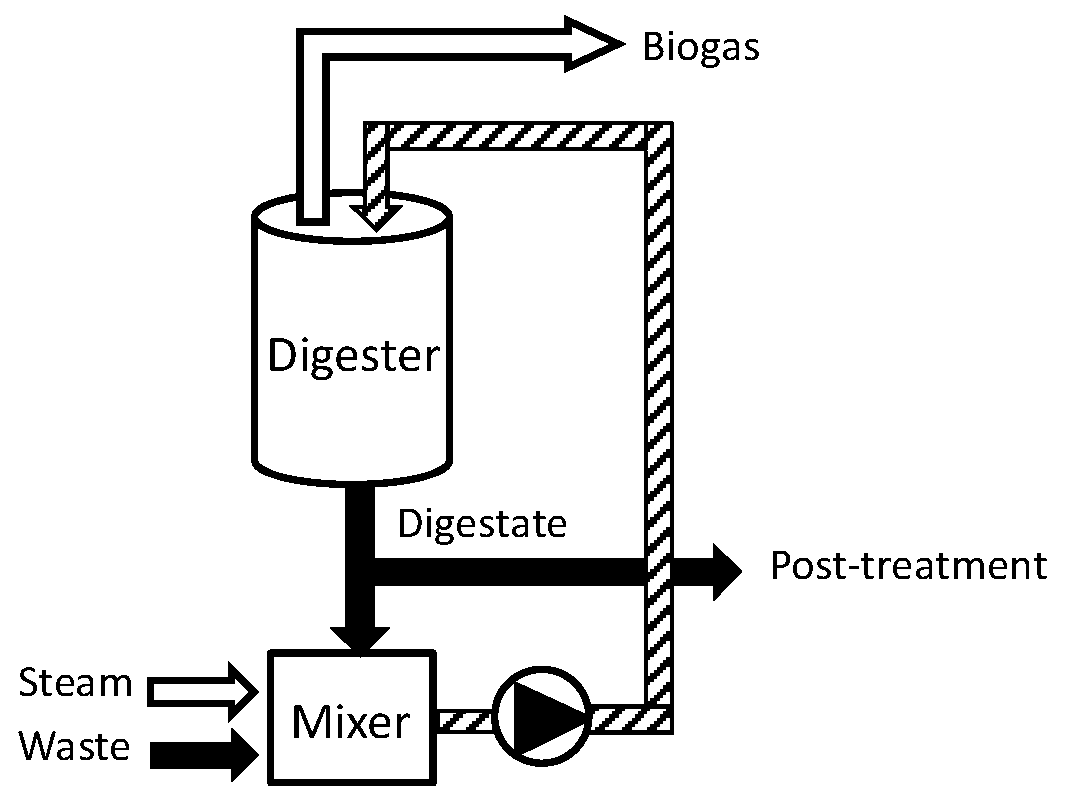
Main stages of the Dranco process (see Figure 1) are:
- Organic fraction is pre-treated to reduce its size (d < 40 (mm)).
- Pre-treated organic fraction is mixed with a small amount of steam and a large amount of digested residue coming from the digester.
- The mixture is pre-heated and pumped to the top of the digester.
- Depending on the feeding rate, the mixture takes from two to four days to reach the bottom of the digester; meanwhile, biogas obtained rises and exits from the digester through the roof and floes to the gas storage.
- The digested residue is extracted from the bottom of the digester by means of screws hanging underneath the conical outlet and is sent to further composting or is used as organic compost.
2.2. Batch Processes
In batch processes, the digestion reactor is filled with organic material with a high content of solids (30–40% TS) with or without inoculum (material obtained in previous fermentation). Thus, the organic material ferments and the percolation liquid that is produced during the degradation process is constantly re-circulated. The process temperature is high (about 40 °C). In the past, batch systems were limited in the market but, because of their affordability and simplicity, they are now finding greater application. More details on this technology can be found in [17,34,35]. For the aim of this paper, dry batch processes are mainly considered for their modularity.
Between dry batch processes, a simple single-step batch process, such as Bekon, is considered. The different stages of degradation (i.e., hydrolysis, acid and methane formation) take place in the same digester. Bio-waste needs no liquidation phase, as is in wet fermentation. Instead, it is constantly moistened with its own percolation liquid, thus guaranteeing ideal living conditions for bacteria. Fermentation occurs at mesophilic temperatures of 34–37 °C, obtained heating floors and walls of the digesters. They are gas-tight, concrete, oblong, garage-like chambers and can be filled and emptied with wheel or front-end loaders. Several digesters may be built next to one another and run simultaneously in progressive biogas production stages, to guarantee continuous biogas production. To achieve a constant gas production, at least three fermenters must be operated in parallel run with different start-up times [17,34]. Given the modularity of construction, the plant’s capacity may easily be increased. The increase in the capacity of this plant does not require huge additional investments or additional costs during the overall project lifecycle.
Main stages of the Bekon process (see Figure 2) are:
- Organic matter, or bio-waste, is loaded in the reactor with a substratum already fermented.
- Percolation liquid is collected and then re-sprayed over the biomass in the digester.
- The produced biogas is pumped into a combined heat and power unit (endothermic engine).
- Once the fermentation process is completed, the digesters are emptied and the digested residue either undergoes further composting or is used as organic compost.
3. The Evaluation Model
The two technologies presented in previous sections are characterized by a different level of “flexibility”. Bekon is the technology characterized by the higher flexibility, thanks to its modularity. It allows the expansion of the production capacity during the operating stage to meet the possible increase of OFMSW quantity intercepted. At the same time, the investment of Bekon as well as the operating costs are higher than those of Dranco. The choice between these two technologies should also take into account the benefits produced by the flexibility as well as the higher costs to identify the most appropriate technology for the context in which they will operate.
In this paper, the Real Options Theory (ROT) is adopted to address this issue. ROT was developed in the financial world to evaluate the financial options; since then, it has been used in the real world where it is proposed as a theory that overcomes the limits of the traditional techniques for investment evaluation. ROT allows analyzers to take into account the managerial flexibility that characterizes many real world investments, i.e., the ability to react actively to uncertainty [27]. A real option, in fact, is defined as the right, but not the obligation, to take some actions in the future at a fixed predefined cost [43]. Thus, from the ROT perspective, the possibility of expanding the production capacity, if convenient, by developing “additional modules”, can be modelled as a real option, and particularly an expansion option [27]. Several techniques have been proposed to price real options. Most of them originate from the financial world, such as Black-Scholes formula [44], binomial model [45], simulation model [46], and others. These models, however, can be difficult to apply to real cases which present several uncertainties (not only financial, but also technical) and where their assumptions are often violated [47,48]. Monte Carlo simulation is proposed as the alternative method to overcome the discussed limits of financial techniques [46].
Dealing with the issue of technology selection in presence of several sources of uncertainty, this paper adopts Monte Carlo simulation as option pricing technique.
In the case of a plant equipped with Bekon technology, its capacity at initial time could be determined based on the expected organic fraction to be intercepted for the next year (Year 1), with an initial investment I0. Then, every year managers will consider the possibility of expanding the capacity based on the organic fraction expected to be treated in the following years as well as the convenience of such expansion. Particularly, the expansion option for this generic year will be exercised whether the expected benefits (i.e., revenues produced by the expansion itself for all the years until the end of the plant useful life, N) are higher than costs. Figure 3 shows the decision-making process for exercising the expansion option.
Let OF(i) be the organic fraction intercepted at the generic Year i, with I = 1, …, N, and Pg the biogas that can be produced for each unit mass of volatile solid in OFMSW. Both variables are affected by uncertainty. In particular, OF(i) is a random variable depending on the citizens behavior and public initiatives and incentive policies. Pg varies depending on several factors, such as the quality of OFMSW (i.e., purity) as well as the technology adopted. Pg is modelled as a uniform distribution, with different parameters values for the two technologies (see Equation (1)).
Pg = UNIFORM(Pgmin,Pgmax).
Then, it is possible to estimate the net biogas Bg(i) that can be produced every year (without considering the possible dispersion in the plant), and consequently the total energy produced Ep(i) and the total energy that can be sold Es(i) (that is, the energy produced without the fraction consumed by the plant). Biogas production rate was evaluated as:
where VS% is the percentage of volatile solid in OFMSW.
Bg(i) = [OF(i)·VS%]·Pg,
The energy produced Ep(i) and the energy sold Es(i) are computed according to Equations (3) and (4):
where BBT is the fraction of biogas burned in the security torch, LHV the biogas lower heating value, and ηe the combined heat and power electrical unit efficiency. Ec(i) is the electrical energy consumed by the plant.
Ep(i) = Bg(i)(1 − BBT) LHV ηe,
Es(i) = Ep(i) − Ec(i),
At the generic Year i, the model considers the available capacity CP(i) and whether it can process the amount of organic fraction expected next year OF(I + 1). Otherwise, the model will consider the need for expanding the production capacity. The expansion capacity can be determined as:
where is the minimum expansion capacity for Bekon technology.
To assess the convenience of exercising this option, it is necessary to look at costs and revenue produced by it until the end of useful life of the plant (N):
where pe is the price of electricity; EsB,AE and EpB,AE are, respectively, the energy sold and produced after the expansion; Es,maxB,BE and Ep,maxB,BE are, respectively, the quantity of energy sold and produced before the expansion when the plant works at the maximum production capacity; pOF the price that the firm receives for each unit mass of waste processed; CPmaxB,BE the maximum production capacity available before the expansion (that is, the maximum organic fraction that can be processed by the plant without expansion); pINC is the incentive that the firm gets for each unit of electricity produced; cOPB is the operating cost of Bekon technology for each unit mass of OFMSW processed; and r is the discount rate. If the option exercise is not convenient, the evaluation process is applied referring to the next year, until the end of the useful life.
This way, the model determines whether and when the option exercise is convenient, and consequently assesses annual revenue and costs.
The Net Present Value (NPV) of the plant with Bekon technology can be determined as:
where EsB(i) and EpB(i) are the energy sold and the total energy produced, respectively, at the i-th year from the plant with the Bekon technology, and the investment at the i-th year in this plant.
Dranco technology is not flexible, that is, the manager has to decide, a priori, at initial time the production capacity of the plant on the basis of the expected OFMSW that could be intercepted in the future. This capacity, of course, could be greater or smaller than the real intercepted amount of OFMSW. If the organic fraction is greater than the production capacity, the excess quantity could not be processed. In the case of Dranco technology is adopted, the NPV of the plant can be evaluated as:
where EsD(i) and EpD(i) are the energy sold and the total energy produced, respectively, at the i-th year from the plant with the Dranco technology; is the operating cost of Dranco technology for each unit mass of OFMSW processed; and is the investment at the i-th year in this plant (in this case, the only non-zero value is the one at i = 0).
4. The Case Study
In this section, a numerical example to test the model is illustrated. A plant for the treatment of OFMSW produced from citizens of a specified territorial area in the south of Italy (Metropolitan area of Bari) has been considered. The data were collected by interviewing two technical managers actively involved in the waste management of the Metropolitan area of Bari. In addition, other unavailable data were assumed on the base of realistic market values, technical conditions and literature sources. Table 2 shows the data about the waste production in the Metropolitan area of Bari and the amount (percentage of total municipal solid wastes (MSW)) of fractions (metal, glass, paper, organic, and plastic) separately collected (the unit mass adopted in the case study is metric ton (Mg or t). Two plant configurations (the former adopting the Dranco technology and the latter the Bekon technology) are evaluated and compared using the model described in the previous section.
The quantity of electrical energy annually produced is uncertain and depends on some stochastic variables, such as the quantity of OFMSW collected and the efficiency of biogas conversion processes. Differences could be addressed to the technology adopted, too.
As far as the trend of the organic fraction is concerned, it has been assumed that, on a yearly basis, the rate of OFMSW collected increases of a quantity modeled by means of a random variable ΔOF(i):
with OF(0) the initial value of OFMSW collection rate. ΔOF(i) values were estimated based on historical data on OFMSW collection rate in 20 Italian regions during seven years. By observing collected data, different magnitude in the increase of the OFMSW collection rate has been observed for different initial OFMSW collection rate values. According to initial OFMSW collection rate values, four categories have beed identified, each of them characterized by a different range of the initial rate (see Table 3) and data sets (Occurrences (#) in Table 3). For each category, the mean and the standard deviation values of ΔOF were computed. To obtain the forecast curve of the percentage of OFMSW collection rate over the plant useful life, we assume ΔOF values as a proxy of the gradient of the curve in each range of OFMSW collection rate as defined in Table 3.
OF(i) = OF(I − 1) + ΔOF(i)
In the geographic area under consideration, the initial rate of OFMSW collection is 5%.
The mean value of the OFMSW separate collection rate during the expected life of the plant (20 years) is depicted in Figure 4. A mean upper bound value of 70% for OFMSW collection rate has been considered, since it is the value observed on average in the period 2001–2010 of the separate collection of biodegradable waste as a whole (organic waste, paper, wood, and textiles) in Italy.
Table 4 shows the technical data of the plant for the two technologies. Data on biogas production are from [40]. It is assumed that, on a yearly base, the 10% of the produced biogas is burned in a security torch to consider unavailability (maintenance and failures) of the engine supplied with the biogas. Electricity consumption data assumed refer to the overall process for both technologies.
The economic data adopted for the economical and financial evaluation are listed in Table 5. The estimation of the economic data has been based on data collected on other similar projects and/or provided by public agencies and stakeholders, and experts’ opinions.
As far as the incentives are concerned, the Italian law allows producers to get incentives for the first fifteen years of production. The production capacity in the case of Dranco technology was determined by calculating the 75% of the expected organic fraction intercepted at the 20th year.
The Monte Carlo simulation with 10,000 trials was run by using the software Crystal Ball. The outputs of the model are shown in Figure 5 and Table 6.
Data obtained from the simulation show that, in this case, Bekon is more convenient than Dranco. The probability of NPV Bekon being positive is about 55%, while in the case of Dranco technology it is about 7%. This can be explained by observing that the Bekon plant capacity can “fit” the organic fraction curve better than Dranco that presents a too high overcapacity for the first years. In other words, contrarily to Dranco, the Bekon process has the flexibility to adapt its capacity to the evolution of the organic fraction (if it is convenient). To analyze the possible dependency of the technology convenience on the “temporal evolution” of the organic fraction interception, two other scenarios (A and B) were considered, as Figure 6 shows. As shown in Table 7, in the case of trend A, Bekon technology equipped plant is more convenient than Dranco one. In fact, as discussed in the reference trend, the plant equipped with Dranco technology has an overcapacity for too many years and only at the end of its useful life the plant starts operating at its full capacity. This makes it inconvenient from an economical point of view. On the other side, the plant that uses Bekon technology can have a low production capacity for the first years, and then, if convenient, expand its capacity to meet the new organic fraction collected.
On the contrary, trend B shows the opposite situation: Dranco becomes more convenient than Bekon. In fact, the plant with Dranco technology almost works at full capacity since the beginning. The plant with Bekon process has a low initial capacity, but, in the next years, it can be expanded to treat the increased quantity of collected organic fraction. However, it can happen that, at the generic Year t (e.g., t = 10, 11, …), the expected value of organic fraction intercepted increases, but the expansion option is not convenient. In other words, the revenues generated by the option exercise are lower than costs: the expected increase or the number of years when the plant can work until the end of its useful life are not enough to economically justify the capacity expansion. This means that the plant is probably unable to process a great part of the organic fraction collected.
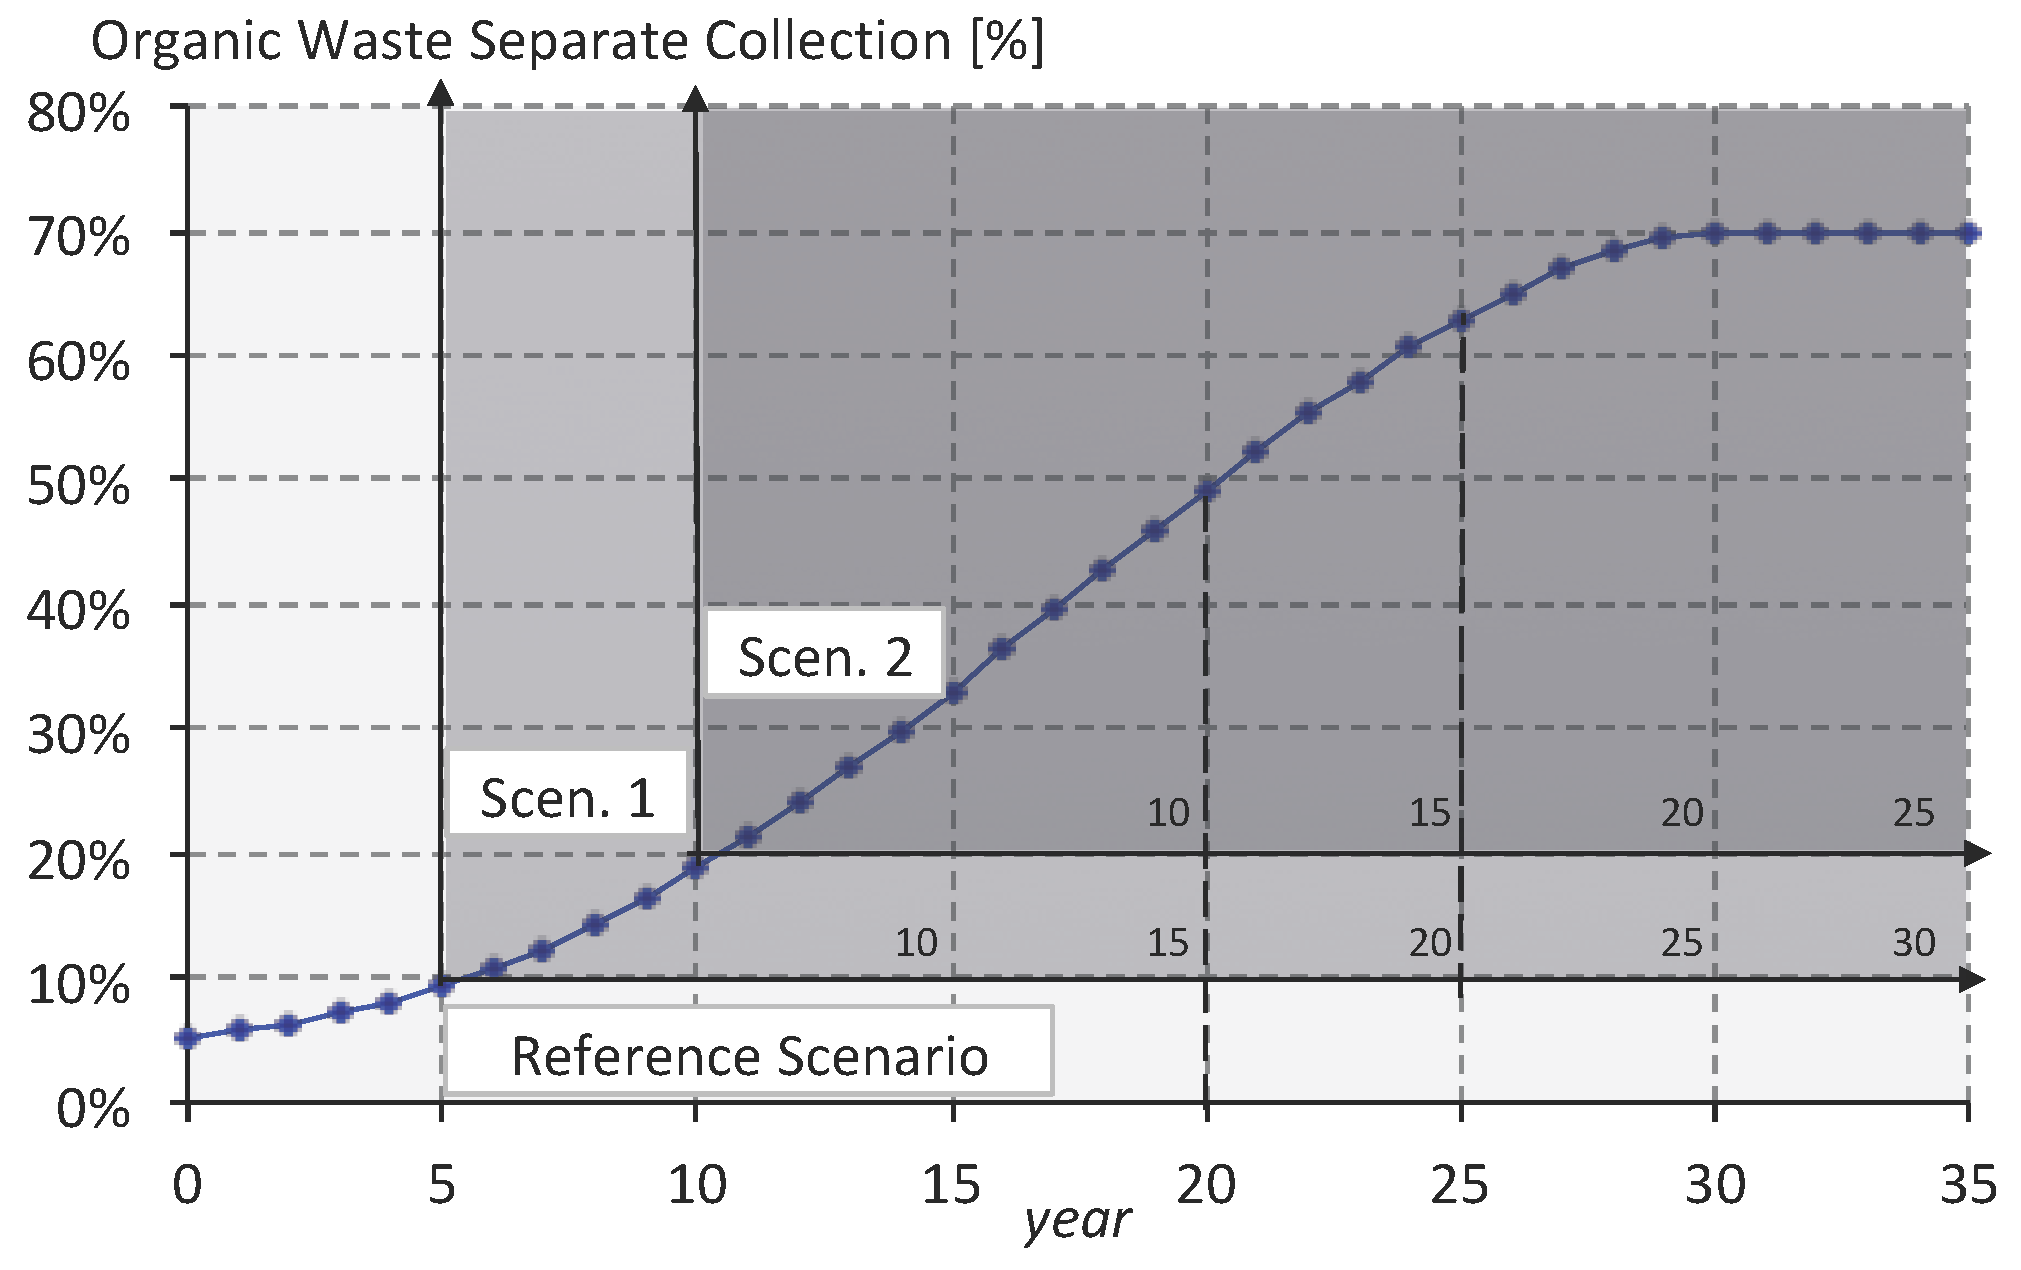
Finally, two other cases were considered. We assumed that the hypothetical investor can choose when the plant will start to work. As Figure 7 shows, this is equivalent to translating the origin of the axes (the initial time is set at Year 5 and 10, respectively, for scenario 1 and 2). The initial fraction of waste intercepted increases and the temporal evolution is different.
Simulation results obtained are shown in Table 8.
Passing from the base case scenario to scenario 1, the difference of convenience between Bekon and Dranco becomes smaller, until it reverses: in scenario 2, Dranco becomes more convenient than Bekon. The reason is always the same. The flexibility of Bekon is valuable when the values of organic fraction change considerably, but gradually, during the years, increasing from very low quantity in the first years to high quantity at the end of the useful life. On the contrary, if the variation of values is not so considerably (even at the beginning the organic fraction collected is high) or the variation is not gradually during the time, the flexibility of Bekon is less worth than Dranco.
5. Conclusions
In this paper, the feasibility study of a plant producing biogas and compost from OFMSW has been carried out. Two different plant configurations have been compared. They differ in the technology implemented for the anaerobic digestion of the OFMSW. Continuous and batch processes have been analyzed. Batch processes are designed to be simple, but biogas yield is not stable. Consequently, some technology providers (e.g., Bekon) operate a range of digesters in parallel. This provides high flexibility in capacity to this kind of plant. Thanks to the more stable biogas yield obtained with continuous processes, equipment configuration could be optimized, thus reducing unit costs. The above-mentioned remarks are valid in a context in which the demand of waste treatment is stable over time. However, many municipalities in EU are now approaching innovation in waste management that determines variations in organics collection service and treatment. In this context, flexibility of treatment plants is a critical factor and must be considered in the design phase of these plants. Traditional techniques adopted to evaluate financial and economic performance of investment project do not allow investors to assess the value of this flexibility. To overcome such a limit, in this paper, a methodology based on ROT has been adopted. The methodology supports the financial and economic performances of this type of plants taking into account their flexibility. The methodology has been applied to a full-scale case study. Results obtained proved its capability in identifying the most suitable technology for a given forecasted trend of OFMSW collected.
6. Limitations and Further Research
This study investigates how different technologies for OFMSW treatment may perform from technical, economic and financial standpoints, in presence of an uncertain organic fraction. Two AD (Anaerobic Digestion) treatment plant configurations characterized by a different technological process are considered; they differ each other in the degree of “flexibility” (modularity), i.e., the possibility of adapting their production capacity in response to the evolution of OFMSW interception. A real option based model which is able to price the value of flexibility embedded in such technologies is developed to support the decision-maker in the selection of the proper plant configuration based on the conditions of uncertainty characterizing the context in which they will operate.
The main limitation of this study lies in having developed some managerial implications about the use of such technologies based on results obtained by applying the model to a single case study. For the sake of generalizability, further research will be devoted to applying the model to other municipal contexts, characterized by different initial OFMSW collection rate and population density. This will strengthen the results of the study. Another major limitation comes from the continuous progresses on these technologies, which improve the technical and economic performance of such plants and thus make the input data, and consequently results, not so up-to-date. Actually, this limitation is only apparent since the model can be easily revised with more up-to-date values coming from both scientific literature and providers of technologies.
Acknowledgments
The authors thank Claudio Pascarelli for his support in the collection of field data and his valuable contribution in running simulations.
Author Contributions
Salvatore Digiesi, Roberta Pellegrino, and Luigi Ranieri conceived the study; Luigi Ranieri conducted the literature review, Salvatore Digiesi and Roberta Pellegrino designed the experiments; Roberta Pellegrino and Giorgio Mossa performed the experiments with the support of Claudio Pascarelli; Luigi Ranieri, Giorgio Mossa and Salvatore Digiesi analyzed the data and results; and Luigi Ranieri and Giorgio Mossa edited the final version of the paper. All authors have approved the final manuscript.
Conflicts of Interest
The authors declare no conflict of interest.
References
- Digiesi, S.; Mascolo, G.; Mossa, G.; Mummolo, G. New Models for Sustainable Logistics: Internalization of External Costs in Inventory Management; Springer Brief in Operations Management; Springer: Cham, Switzerland, 2016; ISBN 978-3-319-19709-8. [Google Scholar]
- Carli, R.; Dotoli, M.; Pellegrino, R.; Ranieri, L. Using multi-objective optimization for the integrated energy efficiency improvement of a smart city public buildings’ portfolio. In Proceedings of the 2015 IEEE International Conference on Automation Science and Engineering, Gothenburg, Sweden, 24–28 August 2015; pp. 21–26. [Google Scholar] [CrossRef]
- Gnoni, M.G.; Mummolo, G.; Ranieri, L. A mixed integer linear programming model for optimisation of organics management in an integrated solid waste system. J. Environ. Plan. Manag. 2008, 51, 833–845. [Google Scholar] [CrossRef]
- Carli, R.; Dotoli, M.; Pellegrino, R.; Ranieri, L. Measuring and managing the smartness of cities: A framework for classifying performance indicators. In Proceedings of the 2013 IEEE International Conference on Systems, Man and Cybernetics (SMC 2013), Manchester, UK, 13–16 October 2013; pp. 1288–1293. [Google Scholar] [CrossRef]
- The World Bank. What a Waste: A Global Review of Solid Waste Management; The Urban Development Series Knowledge Papers; The World Bank: Washington, DC, USA, 2012. [Google Scholar]
- Al Seadi, T.; Lukehurst, C. Quality Management of Digestate from Biogas Plants Used as Fertilizer. IEA Bioenergy Task 37 Energy from Biogas Report. 2012. Available online: https://www.iea-biogas.net/files/daten-redaktion/download/publi-task37/digestate_quality_web_new.pdf (accessed on the 30 January 2018).
- Quested, T.; Hannah, J. Household Food and Drink Waste in the UK; Waste and Resources Action Programme (WRAP): Banbury, UK, 2009; ISBN 1-84405-430-6. Available online: http://www.wrap.org.uk/sites/files/wrap/Household_food_and_drink_waste_in_the_UK_-_report.pdf (accessed on the 30 January 2018).
- Browne, J.D.; Murphy, J.D. Assessment of the resource associated with biomethane from food waste. Appl. Energy 2013, 104, 170–177. [Google Scholar] [CrossRef]
- Fdez.-Güelfo, L.A.; Álvarez-Gallego, C.; Sales, D.; Romero García, L.I. Determination of critical and optimum conditions for biomethanization of OFMSW in a semi-continuous stirred tank reactor. Chem. Eng. J. 2011, 171, 418–424. [Google Scholar] [CrossRef]
- Themelis, N.J.; Ulloa, P.A. Methane generation in landfills. Renew. Energy 2007, 32, 1243–1257. [Google Scholar] [CrossRef]
- Li, S.; Yoo, H.K.; Macauley, M.; Palmer, K.; Shih, J.S. Assessing the role of renewable energy policies in landfill gas to energy projects. Energy Econ. 2015, 49, 687–697. [Google Scholar] [CrossRef]
- Mata-Alvarez, J.; Macé, S.; Llabrés, P. Anaerobic digestion of organic solid waste. An overview of research achievements and perspectives. Bioresour. Technol. 2000, 74, 3–16. [Google Scholar] [CrossRef]
- California Environmental Protection Agency (CEPA). Current Anaerobic Digestion Technologies Used for Treatment of Municipal Organic Solid Waste. California Environmental Protection Agency. Available online: http://www.calrecycle.ca.gov/Publications/Documents/1275/2008011.pdf (accessed on the 14 October 2017).
- Barth, J. Markets for compost and digestate in Europe—Situation, requirements, future development. In Proceedings of the III Conferenza Internazionale sul Trattamento Biologico, Perugia, Italy, 15–16 April 2010. [Google Scholar]
- Digiesi, S.; Massaro, V.; Mossa, G.; Ranieri, L. The sustainability of anaerobic digestion plants: A win-win strategy for public and private bodies. J. Clean. Prod. 2015, 104, 445–459. [Google Scholar] [CrossRef]
- Caponio, G.; Digiesi, S.; Mossa, G.; Mummolo, G. Economic and environmental savings from upgraded biogas applications. In Proceedings of the XVIII Summer School “F. Turco”, Seigallia, Italy, 11–13 September 2013; ISBN 978-88-908649-0-2. [Google Scholar]
- Weiland, P. Biogas production: Current state and perspectives. Appl. Microbiol. Biotechnol. 2010, 85, 849–860. [Google Scholar] [CrossRef] [PubMed]
- Dong, L.; Zhenhong, Y.; Yongming, S. Semi-dry mesophilic anaerobic digestion of water sorted organic fraction of municipal solid waste (WS-OFMSW). Bioresour. Technol. 2010, 101, 2722–2728. [Google Scholar] [CrossRef] [PubMed]
- Walter, A.; Probst, M.; Hinterberger, S.; Müller, H.; Insam, H. Biotic and abiotic dynamics of a high solid-state anaerobic digestion box-type container system. Waste Manag. 2016, 49, 26–35. [Google Scholar] [CrossRef] [PubMed]
- Fisgativa, H.; Tremier, A.; Dabert, P. Characterizing the variability of food waste quality: A need for efficient valorisation through anaerobic digestion. Waste Manag. 2016, 50, 264–274. [Google Scholar] [CrossRef] [PubMed]
- Suwannarat, J.; Ritchie, R.J. Anaerobic digestion of food waste using yeast. Waste Manag. 2015, 42, 61–66. [Google Scholar] [CrossRef] [PubMed]
- Nielfa, A.; Cano, R.; Fdz-Polanco, M. Theoretical methane production generated by the co-digestion of organic fraction municipal solid waste and biological sludge. Biotechnol. Rep. 2015, 5, 14–21. [Google Scholar] [CrossRef] [PubMed]
- Agyeman, F.O.; Tao, W. Anaerobic co-digestion of food waste and dairy manure: Effects of food waste particle size and organic loading rate. J. Environ. Manag. 2014, 133, 268–274. [Google Scholar] [CrossRef] [PubMed]
- Angelidaki, I.; Chen, X.; Cui, J.; Kaparaju, P.; Ellegaard, L. Thermophilic anaerobic digestion of source-sorted organic fraction of household municipal solid waste: Start-up procedure for continuously stirred tank reactor. Water Res. 2006, 40, 2621–2628. [Google Scholar] [CrossRef] [PubMed]
- Kusch, S. Understanding and management the start-up phase in dry anaerobic digestion. In Proceedings in Research Conference in Technical Disciplines; Publishing Institution of the University of Zilina: Zilina, Slovakia, 2013; Volume 1, pp. 26–30. ISBN 978-80-554-0807-1. [Google Scholar]
- Fernández, J.; Pérez, M.; Romero, L.I. Kinetics of mesophilic anaerobic digestion of the organic fraction of municipal solid waste: Influence of initial total solid concentration. Bioresour. Technol. 2010, 101, 6322–6328. [Google Scholar] [CrossRef] [PubMed]
- Carbonara, N.; Pellegrino, R. Public-private partnerships for energy efficiency projects: A win-win model to choose the energy performance contracting structure. J. Clean. Prod. 2018, 170, 1064–1075. [Google Scholar] [CrossRef]
- Kumar, R.L. An options view of investments in expansion-flexible manufacturing systems. Int. J. Prod. Econ. 1995, 38, 281–291. [Google Scholar] [CrossRef]
- Karsak, E.E.; Ozogul, C.O. Valuation of expansion flexibility in flexible manufacturing system investments using sequential exchange options. Int. J. Syst. Sci. 2005, 36, 243–253. [Google Scholar] [CrossRef]
- Agenzia Nazionale per la Protezione dell’Ambiente (ANPA). Il Trattamento Anaerobico dei Rifiuti—Aspetti Progettuali e Gestionali; Manuali e Linee Guida; ANPA: Roma, Italy, 2002; ISBN 88-448-0053-5. [Google Scholar]
- Murphy, J.D.; McKeogh, E. Technical, economic and environmental analysis of energy production from municipal solid waste. Renew. Energy 2004, 29, 1043–1057. [Google Scholar] [CrossRef]
- Khalid, A.; Arshad, M.; Anjum, M.; Mahmood, T.; Dawson, L. The anaerobic digestion of solid organic waste. Waste Manag. 2011, 31, 1737–1744. [Google Scholar] [CrossRef] [PubMed]
- Ward, A.J.; Hobbs, P.J.; Holliman, P.J.; Jones, D.L. Optimization of the anaerobic digestion of agricultural resources. Bioresour. Technol. 2008, 99, 7928–7940. [Google Scholar] [CrossRef] [PubMed]
- Kusch, S.; Schäfer, W.; Kranert, M. Dry digestion of organic residues. In Integrated Waste Management—Volume I; Kumar, S., Ed.; InTech: Rijeka, Croatia, 2000; ISBN 978-953-307-469-6. [Google Scholar]
- Mata-Alvarez, J. (Ed.) Biomethanization of the Organic Fraction of Municipal Solid Wastes; IWA Publishing: London, UK, 2003; ISBN 1900222140. [Google Scholar]
- De Baere, L. Will anaerobic digestion of solid waste survive in the future? Water Sci. Technol. 2006, 53, 187–194. [Google Scholar] [CrossRef] [PubMed]
- Spendlin, H.-H.; Stegmann, R. Anaerobic fermentation of the vegeable, fruit, and yard waste. In Proceedings of the 5th International Solid Wastes Conference, Copenhagen, Denmark, 11–16 September 1988; Academic Press: London, UK, 1988; Volume 2, pp. 25–31. [Google Scholar]
- Baeten, D.; Verstraete, W. In-reactor anaerobic digestion of MSW-organics. In Science and Engineering of Composting: Design, Environmental, Microbiological and Utilization Aspects; Hoitink, H.A.J., Keener, H.M., Eds.; Renaissance Publications: Worthington, OH, USA, 1993; pp. 111–129. [Google Scholar]
- Oleszkiewicz, J.A.; Poggi-Varaldo, H.M. High-solids anaerobic digestion of mixed municipal and industrial wastes. J. Environ. Eng. 1997, 123, 1087–1092. [Google Scholar] [CrossRef]
- Kraft, E. Trockenfermentation—Brücke zwischen abfallbehandlung und landwirtschaft? In Gülzower Fachgespräche 23, Gülzower Fachgespräch “Trockenfermentation”; Fachagentur Nachwachsende Rohstoffe e.V. (FNR): Gülzow, Germany, 2004; pp. 81–95. [Google Scholar]
- De Baere, L. The Dranco Technology: A Unique Digestion Technology for Solid Organic Waste; Organic Waste Systems (OWS): Brussels, Beligium, 2010. [Google Scholar]
- Nizami, A.S.; Murphy, J.D. What type of digester configurations should be employed to produce biomethane from grass silage? Renew. Sustain. Energy Rev. 2010, 14, 1558–1568. [Google Scholar] [CrossRef]
- Dixit, A.K.; Pindyck, R.S. The Options Approach to Capital Investment. Harv. Bus. Rev. 1995, 73, 105–118. [Google Scholar]
- Black, F.; Scholes, M. The pricing of options figureand corporate liabilities. J. Political Econ. 1973, 81, 637–654. [Google Scholar] [CrossRef]
- Cox, J.C.; Ross, S.A.; Rubinstein, M. Option pricing: A simplified approach. J. Financ. Econ. 1979, 7, 229–263. [Google Scholar] [CrossRef]
- Boyle, P.P. Options: A Monte Carlo Approach. J. Financ. Econ. 1977, 4, 323–338. [Google Scholar] [CrossRef]
- Lander, D.M.; Pinches, G.E. Challenges to the Practical Implementation of Modelling and Valuing Real Options. Q. Rev. Econ. Financ. 1998, 38, 537–567. [Google Scholar] [CrossRef]
- De Neufville, R.; Scholtes, S.; Wang, T. Real options by spreadsheet: Parking garage case example. J. Infrastruct. Syst. 2006, 12, 107–111. [Google Scholar] [CrossRef]
- Istituto Superiore per la Protezione e la Ricerca Ambientale (ISPRA). Rapporto Rifiuti Urbani—Edizione 2009; ISPRA: Roma, Italy, 2009; ISBN 978-88-448-0430-5. [Google Scholar]
Figure 1.
Dranco digester scheme (adapted from [41]).
Figure 1.
Dranco digester scheme (adapted from [41]).

Figure 2.
Bekon digester scheme (adapted from [42]).
Figure 2.
Bekon digester scheme (adapted from [42]).
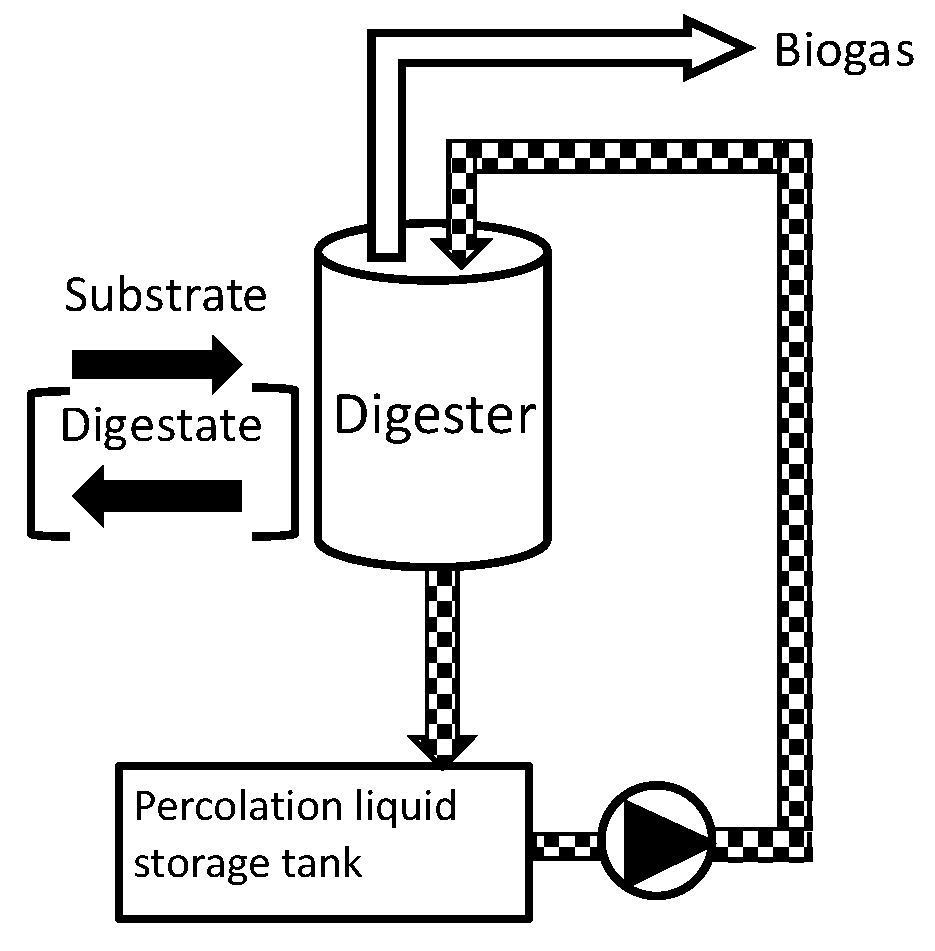
Figure 3.
Decision-making process for exercising the expansion option.
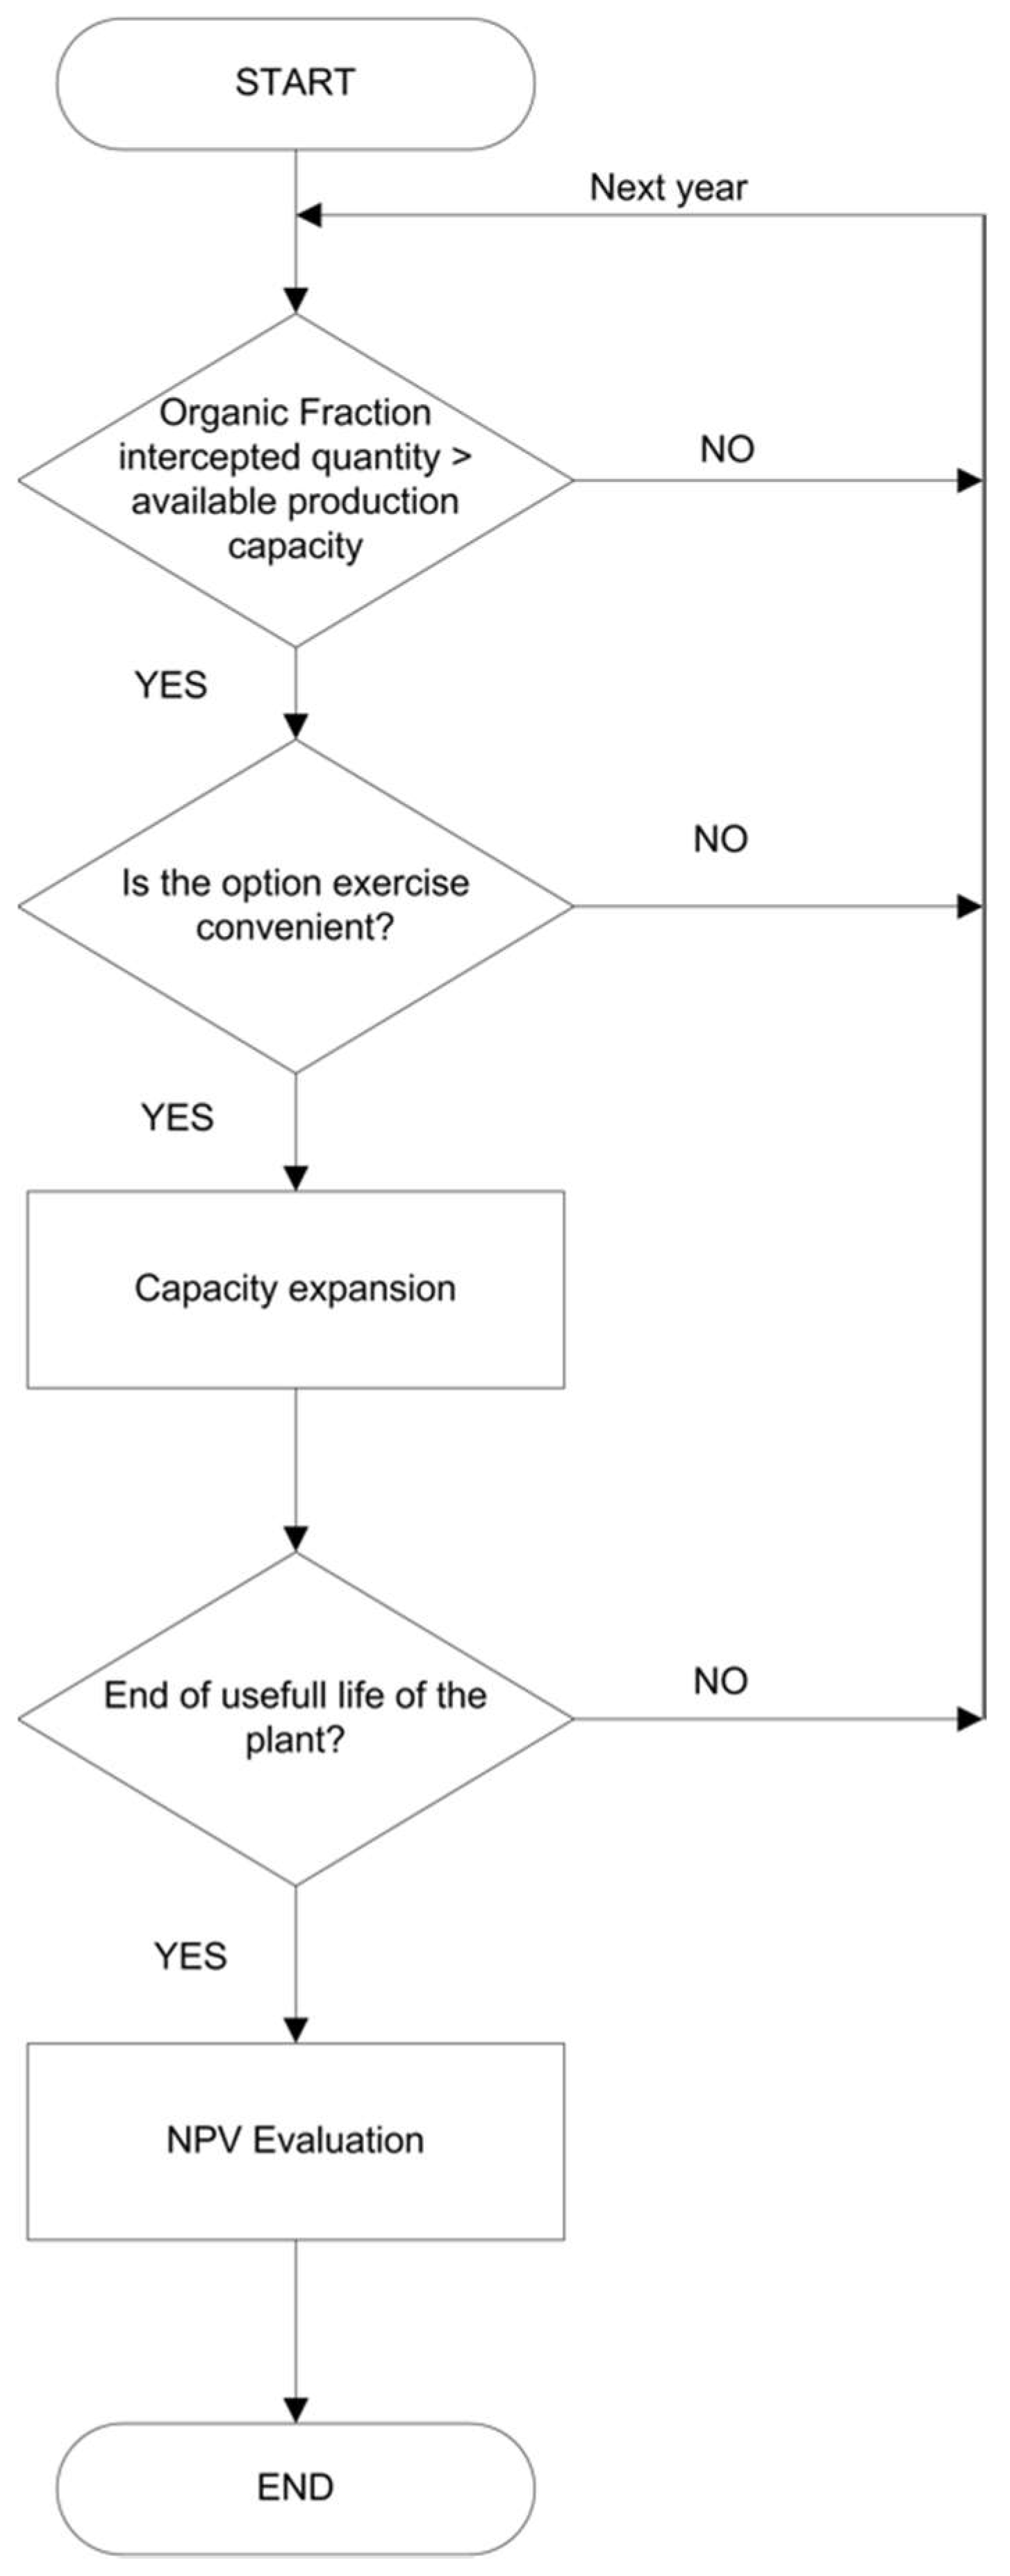
Figure 4.
Mean values of OFMSW separate collection rate.
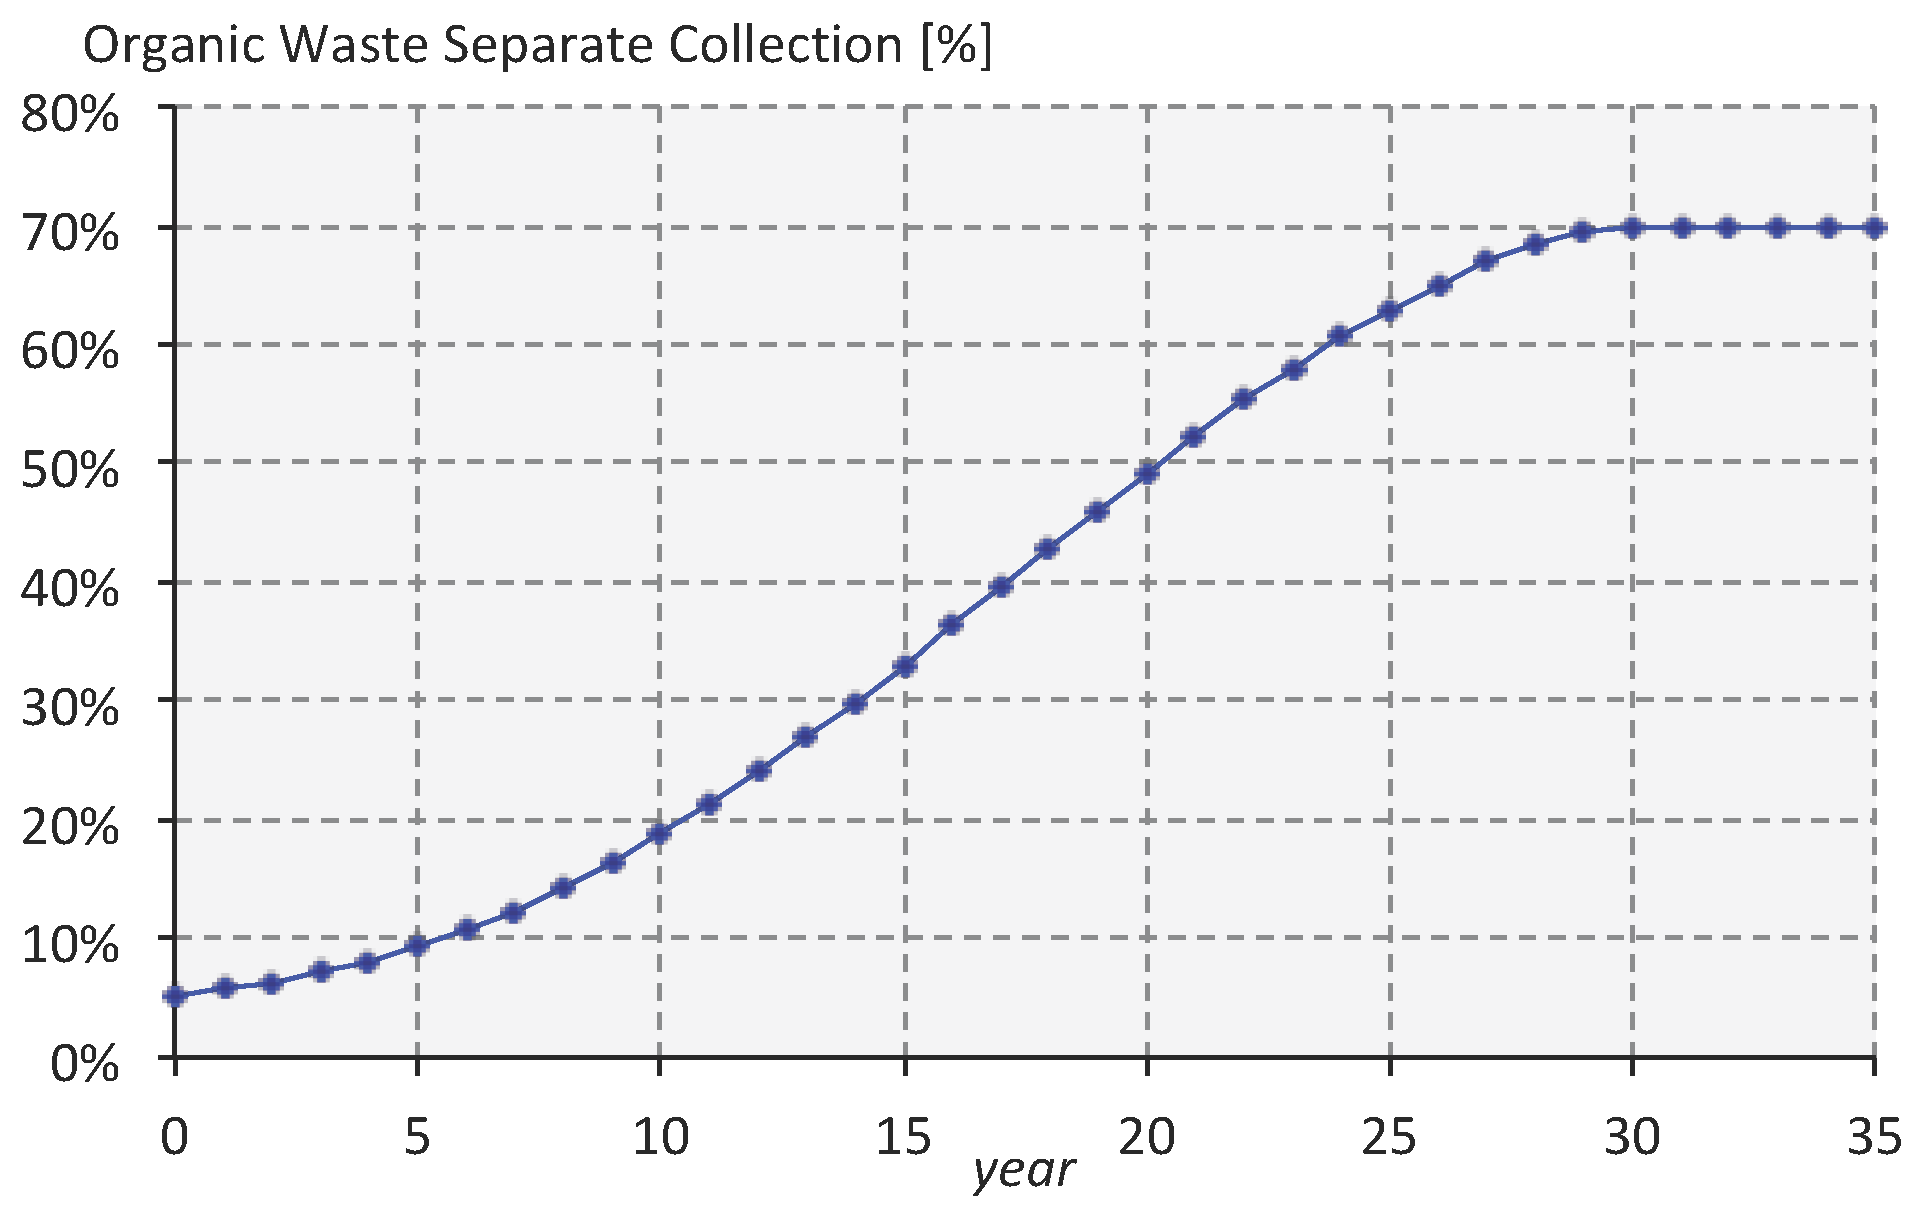
Figure 5.
Distribution of the net present value of: Bekon technology (a); and Dranco technology (b).
Figure 5.
Distribution of the net present value of: Bekon technology (a); and Dranco technology (b).
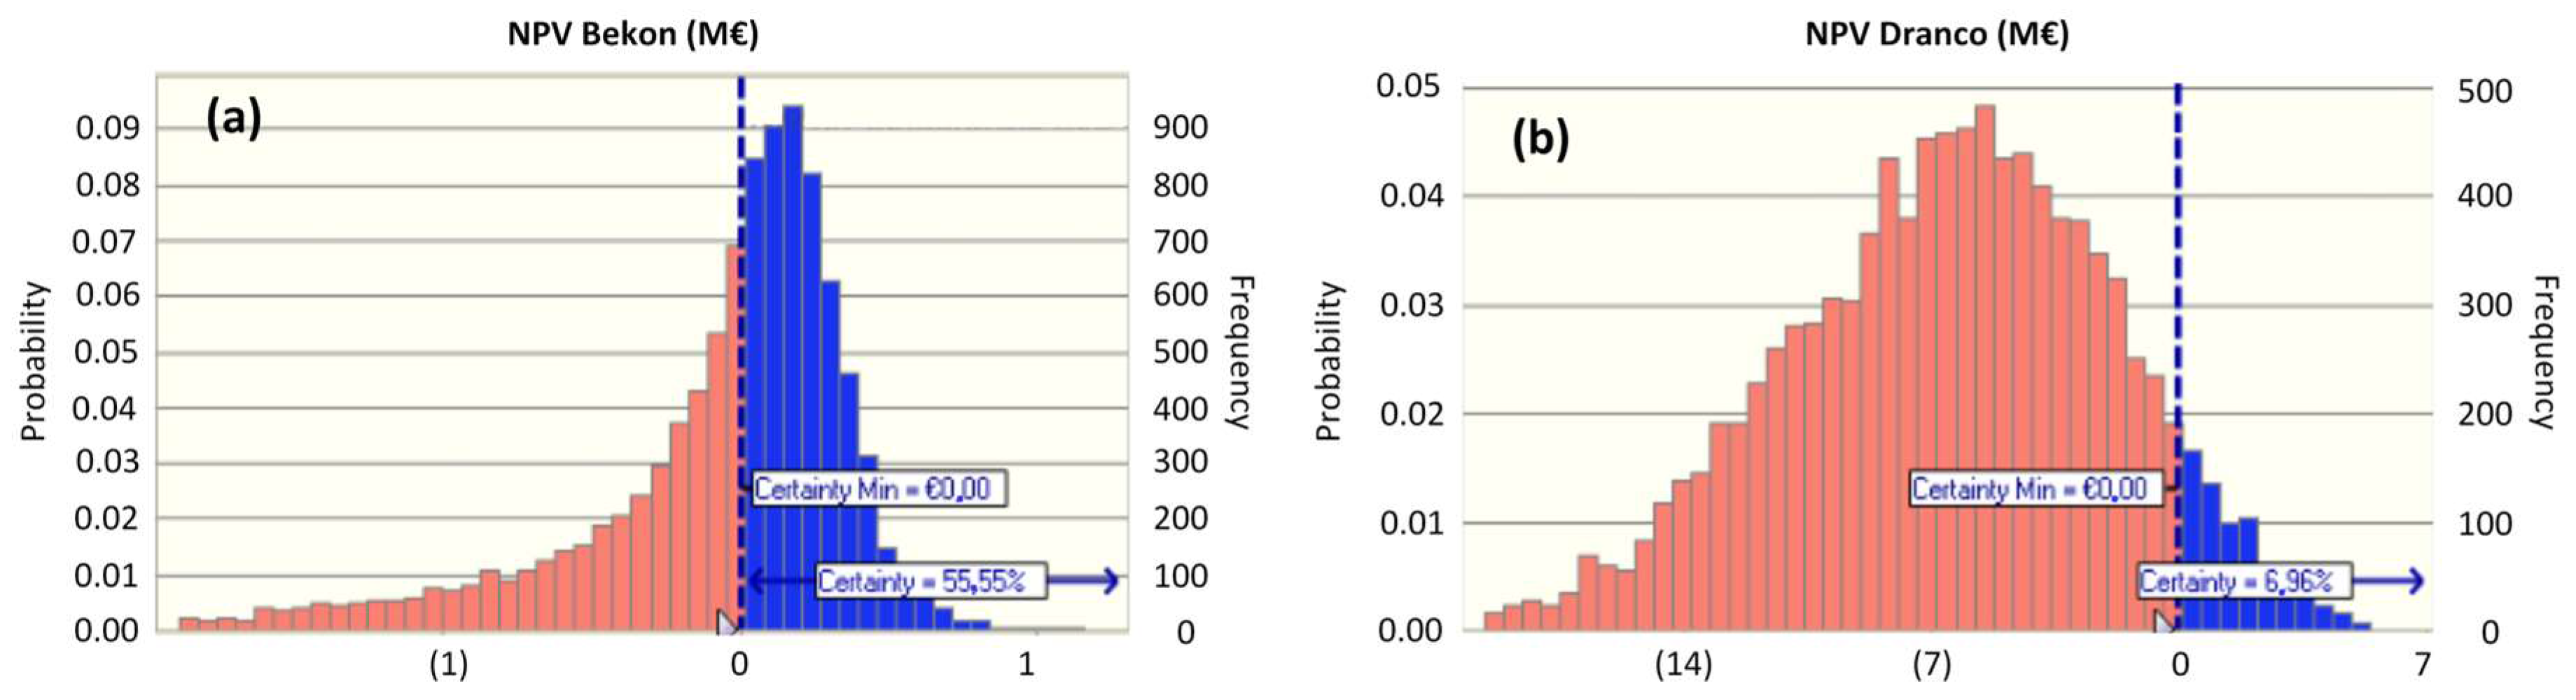
Figure 6.
Trends of OFMSW evolution.
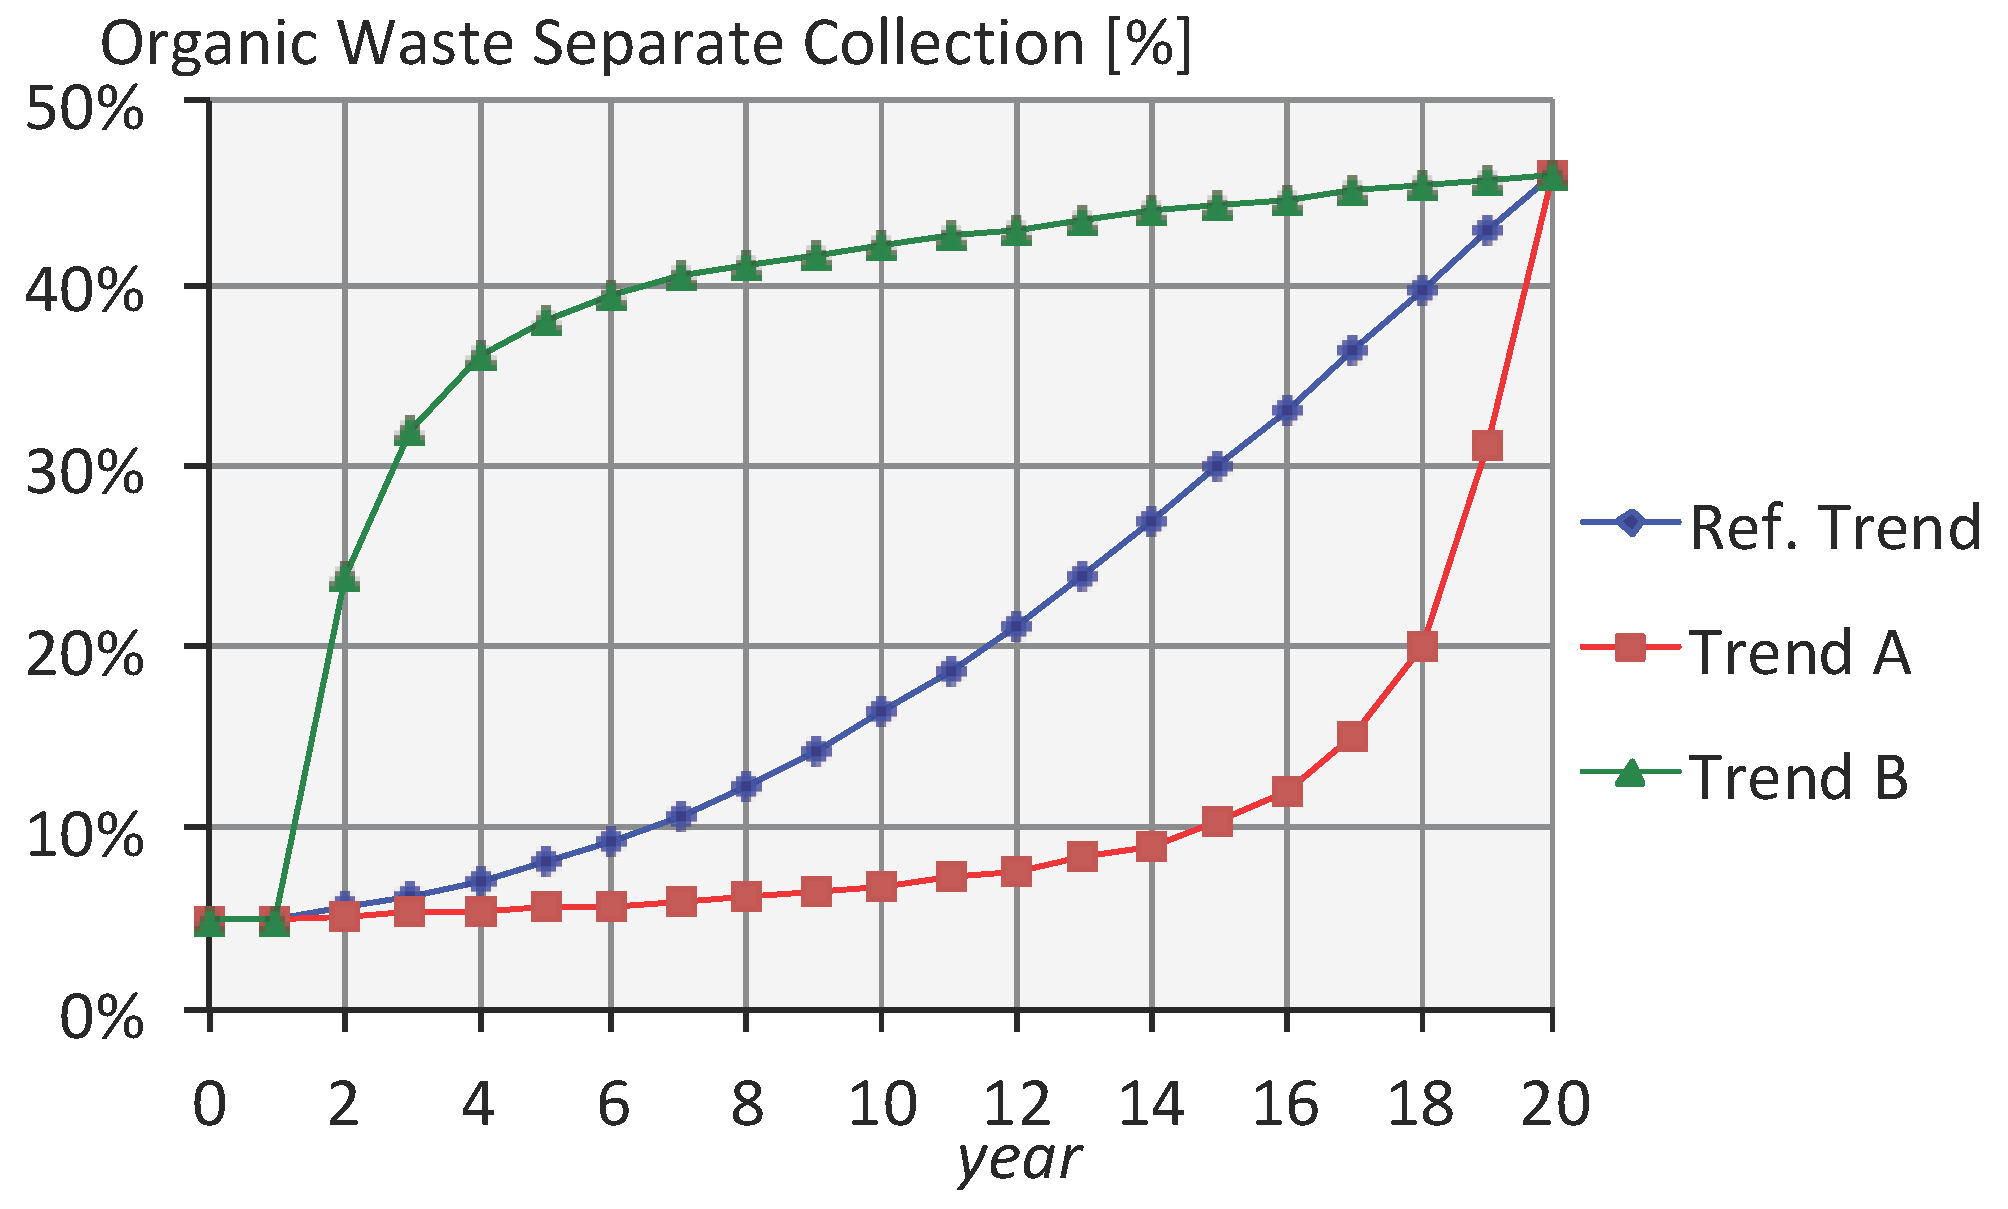
Figure 7.
OFMSW initial percentage in the scenarios considered.


Table 1.
Advantages and disadvantages of dry processes [35].
Table 1.
Advantages and disadvantages of dry processes [35].
| Criteria | Advantages | Disadvantages |
|---|---|---|
| Technological | - No need of mixers inside the reactor; - Strength and resistance to heavy inert materials and plastic; - No hydraulic short circulation. | Waste with low content of solid substance (<20% TS) cannot be treated alone. |
| Biological | - Low loss of biodegradable organic matter in the pre-treatment; - High Organic Loading Rate (OLR) applicable; - Resistance at peak concentrations of substrate or toxic substances. | Minimum possibility of diluting inhibitory substances and excessive organic loads with fresh water. |
| Environmental and economical | - Minimum and economic pre-treatment; - Reduced volumes of the reactors; - Reduced use of fresh water; - Minimum reactor heating request. | High investment costs due to equipment used for treatment. |
Table 2.
Plant users basin parameters ([49]).
Table 2.
Plant users basin parameters ([49]).
| Municipalities | Population | MSW (t/y) | Separate Collection 2008 | Separate Collection 2009 |
|---|---|---|---|---|
| 9 | 497,593 | 287,000 | 16.1% | 17.6% |
Table 3.
Historical data analysis results.
| Category | 1 | 2 | 3 | 4 |
|---|---|---|---|---|
| OFMSW collection rate | <10% | 10–20% | 20–30% | >30% |
| Occurrences (#) | 73 | 25 | 10 | 6 |
| OFMSW collection rate increase: | ||||
| Mean | 0.8% | 2.1% | 3.6% | 2.9% |
| StDev | 2.4% | 3.9% | 4.0% | 2.2% |
Table 4.
Technical data of Bekon- and Dranco-equipped plant assumed.
| Parameter | Value | Unit |
|---|---|---|
| Probabilistic Parameters | ||
| Pg (Bekon) | Uniform (240,530) | m3 of biogas/t of volatile solids |
| Pg (Dranco) | Uniform (550,780) | m3 of biogas/t of volatile solids |
| Correlation coefficient biogas production in Dranco and Bekon | 0.8 | - |
| Deterministic Parameters | ||
| Useful life of the plant | 20 | Years |
| Biogas methane concentration | 60 | % (in volume) |
| Biogas burned in security torch | 10 | % (in volume) |
| Engine-generator electrical efficiency | 40 | % |
| Treatment and post treatment (composting) electricity consumption | 18 (Bekon); 128 (Dranco) | kWh/t of OFMSW |
Table 5.
Economical data adopted in the simulation.
| Parameter | Value | Unit |
|---|---|---|
| Common data | ||
| pOF | 40 | €/t |
| pe | 0.08 | €/kWh |
| pINC | 0.088 | €/kWh |
| Bekon data | ||
| copB | 35 | €/t |
| ΔCexpminB | 2500 | t |
| Investment for ΔCexpminB | 976.19 | k€ |
| Dranco data | ||
| copD | 20 | €/t |
| CPmaxD | 50,000 | t/year |
| Initial investment | 20,000 | k€ |
Table 6.
NPV simulation results (k€).
| Parameter | Bekon (a) | Dranco (b) |
|---|---|---|
| Mean | −131 | −6592 |
| Median | 44 | −6304 |
| StDev | 626 | 4679 |
| Minimum | −10,103 | −32,959 |
| Maximum | 1220 | 8084 |
Table 7.
NPV simulation results.
| Technology | Mean (k€) | Median (k€) | StDev (k€) | Min (k€) | Max (k€) | Prob (NPV > 0) | |
|---|---|---|---|---|---|---|---|
| Trend A | Bekon | −750 | −295 | 1200 | −8412 | 1085 | 34.00% |
| Dranco | −13,089 | −13,068 | 4430 | −29,401 | 2945 | 0.12% | |
| Reference Scenario | Bekon | −131 | 44 | 626 | −10,103 | 1220 | 55.55% |
| Dranco | −6592 | −6304 | 4680 | −32,959 | 8084 | 6.96% | |
| Trend B | Bekon | 595 | 520 | 597 | −1613 | 3180 | 87.88% |
| Dranco | 11,470 | 12,301 | 3303 | −5625 | 17,287 | 100% |
Table 8.
NPV results of simulation for scenarios 1 and 2.
| Technology | Mean (€) | Median | StDev (k€) | Min (k€) | Max (k€) | Prob (NPV > 0) | |
|---|---|---|---|---|---|---|---|
| Reference Scenario | Bekon | −131 | 44 | 626 | −10,103 | 1220 | 55.55% |
| Dranco | −6592 | −6304 | 4680 | −32,959 | 8084 | 6.96% | |
| Scenario 1 | Bekon | 199 | 257 | 457 | −4783 | 1849 | 78.59% |
| Dranco | −123 | 366 | 4949 | −20,678 | 11,739 | 52.75% | |
| Scenario 2 | Bekon | 703 | 694 | 557 | −3533 | 3390 | 91.71% |
| Dranco | 9164 | 9779 | 3800 | −11,796 | 17,115 | 97.48% |
© 2018 by the authors. Licensee MDPI, Basel, Switzerland. This article is an open access article distributed under the terms and conditions of the Creative Commons Attribution (CC BY) license (http://creativecommons.org/licenses/by/4.0/).
Share and Cite
MDPI and ACS Style
Ranieri, L.; Mossa, G.; Pellegrino, R.; Digiesi, S. Energy Recovery from the Organic Fraction of Municipal Solid Waste: A Real Options-Based Facility Assessment. Sustainability 2018, 10, 368. https://doi.org/10.3390/su10020368
AMA Style
Ranieri L, Mossa G, Pellegrino R, Digiesi S. Energy Recovery from the Organic Fraction of Municipal Solid Waste: A Real Options-Based Facility Assessment. Sustainability. 2018; 10(2):368. https://doi.org/10.3390/su10020368
Chicago/Turabian StyleRanieri, Luigi, Giorgio Mossa, Roberta Pellegrino, and Salvatore Digiesi. 2018. "Energy Recovery from the Organic Fraction of Municipal Solid Waste: A Real Options-Based Facility Assessment" Sustainability 10, no. 2: 368. https://doi.org/10.3390/su10020368
Note that from the first issue of 2016, this journal uses article numbers instead of page numbers. See further details here.