Contribution of Quality Management Practices to Sustainability Performance of Vietnamese Firms

Abstract
:1. Introduction
2. Literature Review
2.1. Quality Management
- Saraph, Benson, and Schroeder [17] made a pioneering work to identify and confirm the reliability and validity of eight critical factors of quality management: (1) the role of management leadership and quality policy; (2) role of the quality department; (3) training; (4) product/service design; (5) supplier quality management; (6) process management; (7) quality data and reporting; and (8) employee relations [17].
- Flynn, Schroeder, and Sakakibara [18] validated seven key dimensions of quality management: (1) top management support; (2) quality information system; (3) process management; (4) product design; (5) workforce management; (6) supplier involvement; and (7) customer involvement [18]. In 1995, this group of authors tested measurement instruments for quality management in world-class manufacturers in the US [12]. The world-class manufacturers were randomly selected from a master list that was developed using Dun’s Industrial Guide: The Metalworking Directory [19], JETRO’s information, and Schonberger’s [20]. Eight key dimensions divided into Core Quality Management Practices are examined: (1) process flow management; (2) product design process; (3) statistical control and feedback; and Quality Management Infrastructure Practices comprising (4) top management support; (5) workforce management; (6) work attitudes; (7) supplier relationship; and (8) customer relationship. This study also tested the impact of quality management practices on performance and competitive advantage and discussed in light of Garvin’ eight dimensions of quality.
- Anderson, Rungtusanatham, Schroeder, and Devaraj [21], based on 14 Points of Deming, conducted a thorough analysis on the Deming Management Method and identified seven underlying dimensions of quality management: (1) visionary leadership; (2) internal and external cooperation; (3) learning; (4) process management; (5) continuous improvement; (6) employee fulfillment; and (7) customer satisfaction [21].
2.2. Sustainability Performance
2.3. Research on Quality Management and Sustainability Performance
3. Analytical Framework and Hypotheses Development
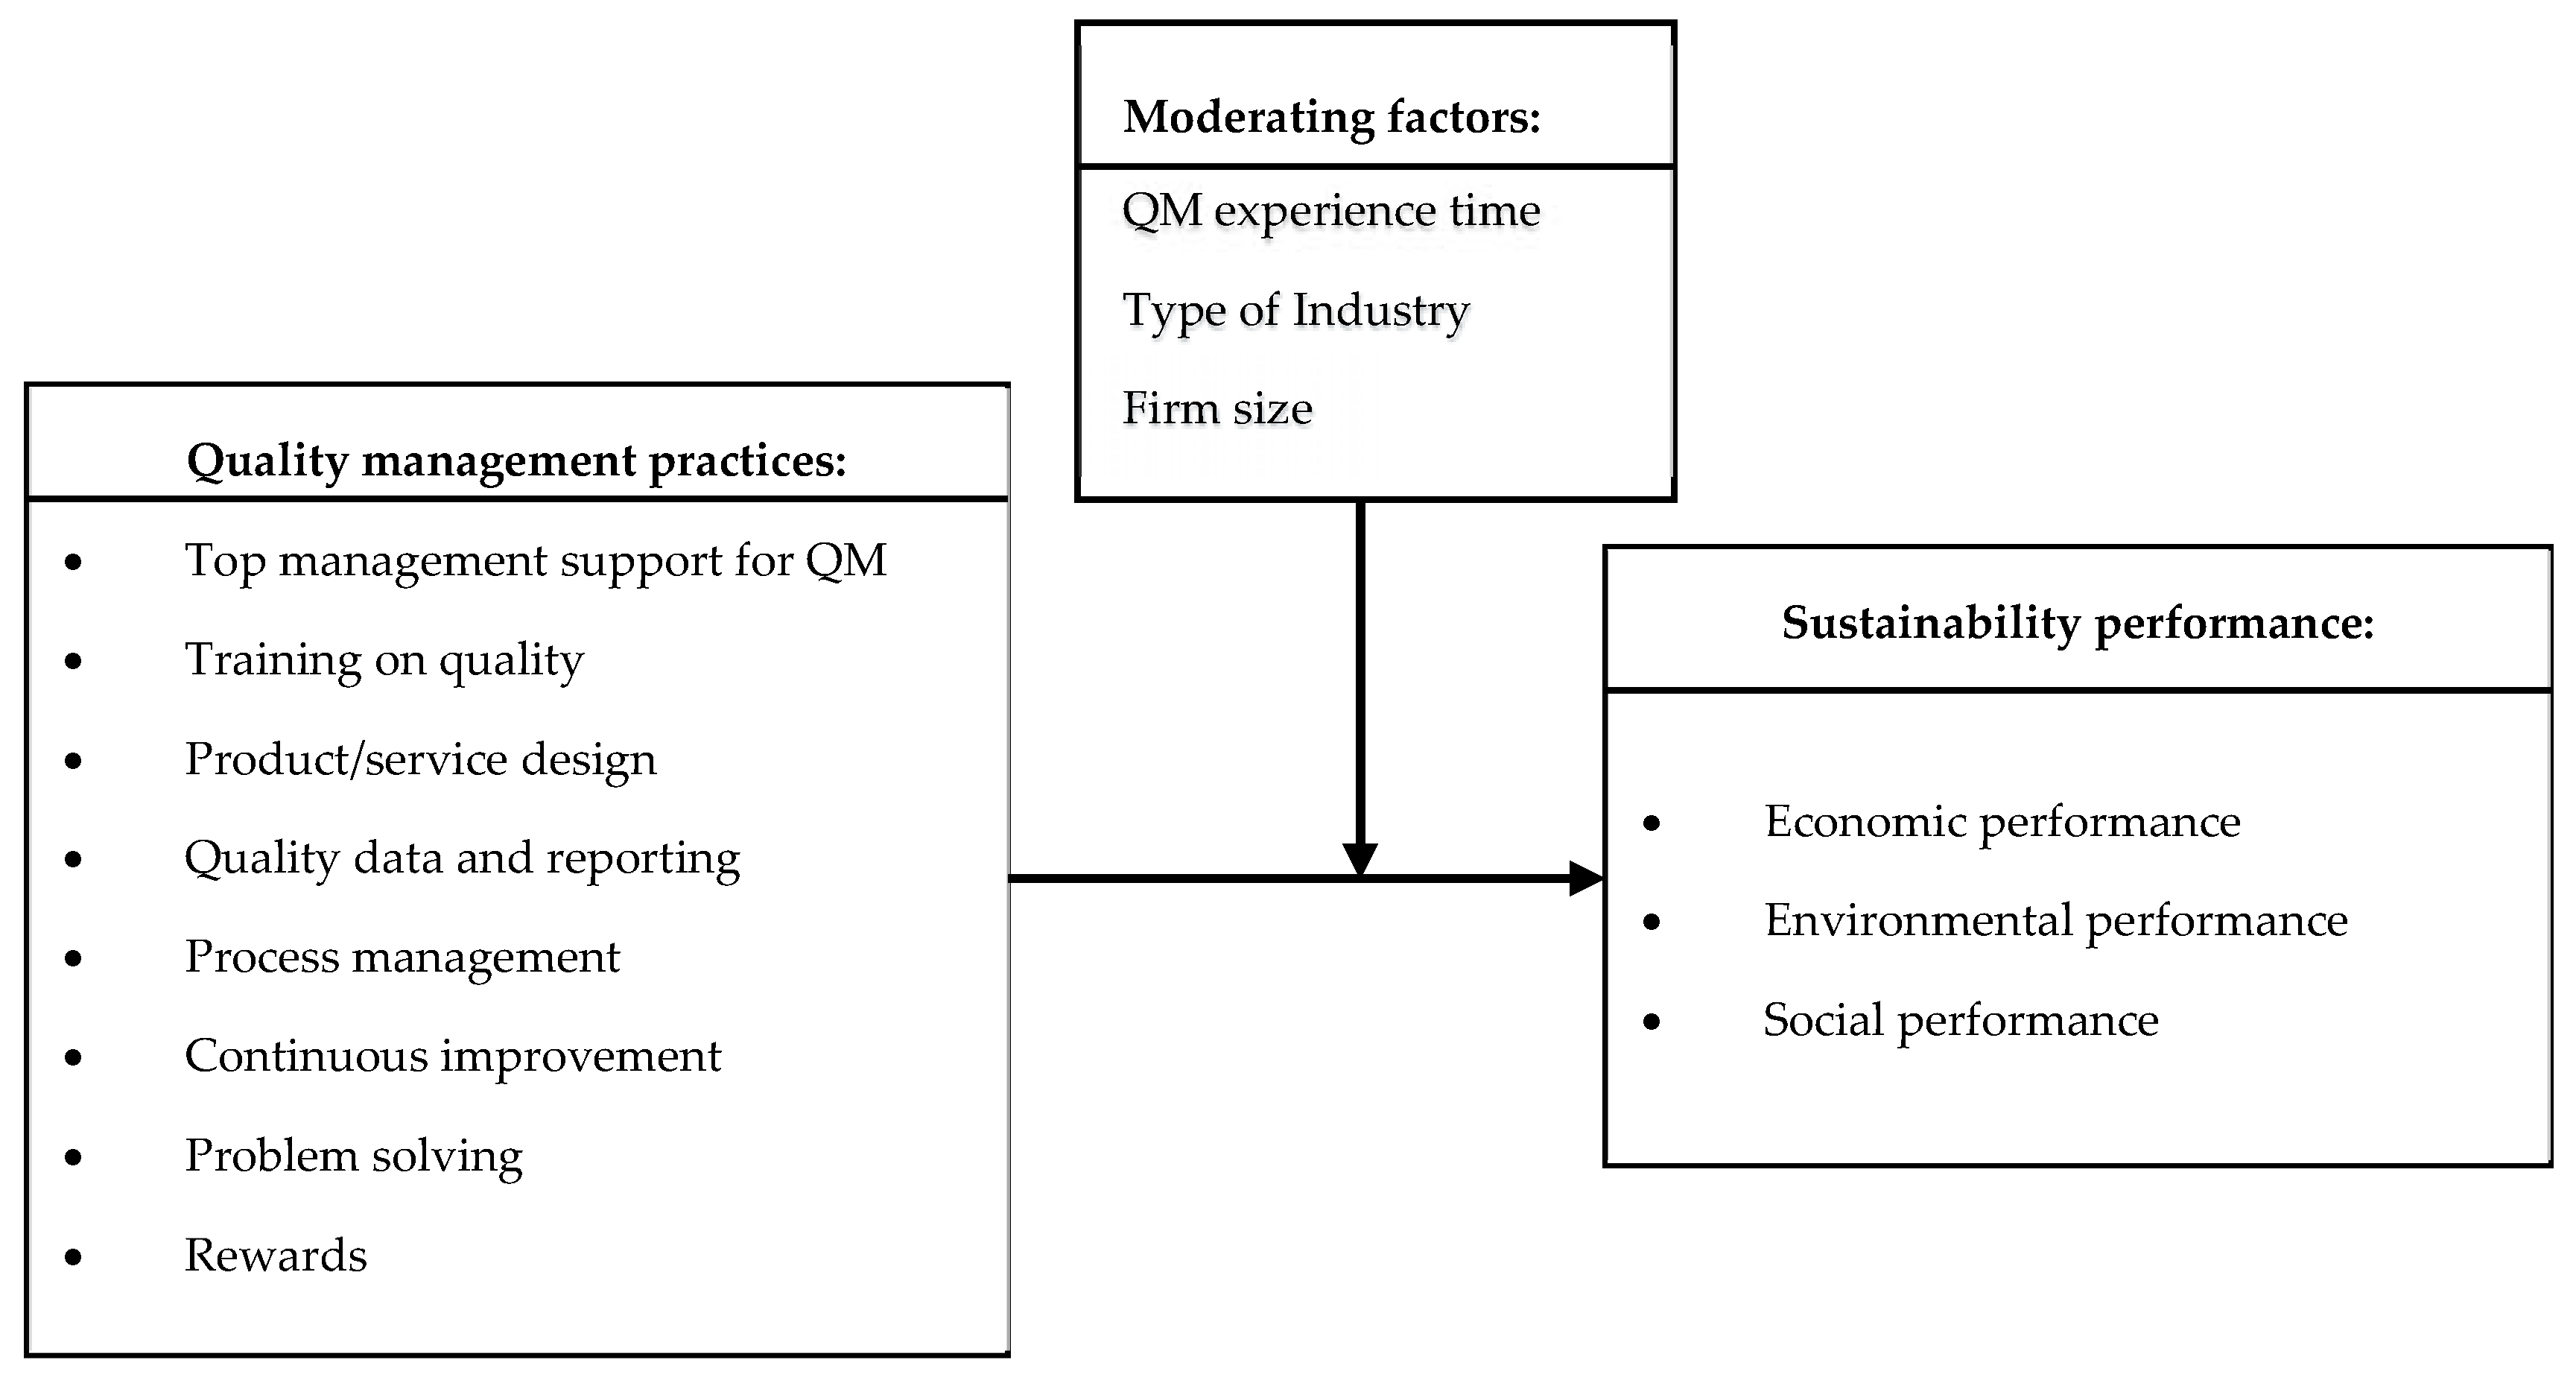
- Top management leadership for quality: Plays a vital role in setting the quality goals and strategies of the organization to achieve the goals [12]. The support from top management would encourage behaviors and performance throughout the organization toward sustainability goals. The positive influence of top management leadership for quality on other quality management practices and performance is well supported by empirical evidence in [21,23,36,63].
- Training on quality: Providing Training on quality will enhance skills of employees, especially quality-related skills. Having a good policy on internal human resource is a contribution to social sustainability. In addition, by improving skills, employees would improve the accuracy of the production processes, and in turns, reduce defects and increase the quality performance in general. This contributes to environmental and economic sustainability. This argument is supported in the literature [12,23,71].
- Product/service design: The importance of Design for high quality and defect-free product was emphasized by both Joseph Juran and Genichi Taguchi [72]. As a result, it would contribute to a reduction in wastes and material consumption, and, in turn, contribute to environmental sustainability. In addition, design for producibility and simplification would better standardize components, make it easier to produce, and lead to higher process efficiency [12,23,73]. The positive contribution of product design was demonstrated in [30,55].
- Quality data and reporting refers to the availability of information on the quality-related performance which would help managers make appropriate decisions timely based on the facts [65], and quickly detect and prevent quality problems [12,14,74]. This contributes to not only the improvement of economic efficiency but also environmental performance through defect reduction.
- Process control: Seven tools for statistical quality control were developed and disseminated by Ishikawa [72]. Thorough process control using statistical techniques is postulated to reduce process variance which, in turns, prevents defective components or products [12,63]. As a result, economic and environmental performance would be improved by reduction of material consumption as well as waste emission. The positive impact of process control is supported by empirical studies [14,23,24,26,28,36].
- Problem solving teams are usually formed with cross-functional members to deal with quality-related problems. Finding and addressing the causes of problems would prevent a repetition of the same defect type, leading to an improvement in both environmental and economic performance. This argument is supported in [12,63].
4. Data Collection and Measurement Test
4.1. Designing Questionnaire
4.2. Sampling and Data Collection
4.3. Data Description
- Less than 5 years with 38 companies (26.4%);
- From 5 to 10 years with 35 companies (24.3%);
- More than 10 years with 29 companies (20.1%).
- Industrial with 64 companies (44.4%);
- Consumer goods with 30 companies (20.8%);
- Basic materials with 25 companies (17.4%);
- Consumer services with 22 companies (15.3%).
- Small size with no more than 50 employees (58 companies, corresponding to 40.3% of the total respondents);
- Medium size companies with from 51 to 300 employees (49 companies, corresponding to 34%);
- Large size companies with more than 300 employees (37 companies, corresponding to 25.7%).
4.4. Measurement Test
- Reliability: From the results (Appendix A), the Cronbach’s Alpha values of all constructs in this study exceed the suggested threshold of 0.6 [82]. Cronbach’s Alpha values of QM constructs range from 0.730 to 0.888. Cronbach’s Alpha values of SP constructs range from 0.613 to 0.871 (see more details in Appendix A). As such, it can be concluded that the reliability of all constructs is confirmed.
- Content validity: Content validity of the questionnaire is confirmed by extensive review of previous literature on QM practices and SP. Table 3 and Table 4 show numerous empirical studies that support the utilization of measurement constructs in this study. It can be seen that content validity of measurement instrument in this study is demonstrated.
- Convergent validity: The question items in this study are mainly adopted from previous studies which were thoroughly tested and confirmed the reliability and validity. Therefore, convergent validity in this study is tested by confirmatory factor analysis or within scale factor analysis. In this study, factor analysis is conducted with Maximum likelihood method and Promax rotation. Criteria for factor analysis are: KMO (Kaiser-Mayer-Olkin) and Bartlett’s Test values which measure sampling adequacy need to be greater than 0.5 with Sig. value smaller than 0.5; each factor is uni-dimensional with a minimum eigenvalue of 1; and factor loading of each item is greater than 0.4. In this study, the factor analysis results for QM practices satisfy all of these requirements for the original constructs; factor loadings of QM practices range from 0.468 to 0.903. The factor analysis of SP breaks the original three constructs of SP into seven sub-constructs: Economic return, Cost reduction, and Market performance belong to Economic performance construct; Emission reduction and Resource consumption belong to Environmental performance; and Internal social performance (refers to social performance that has impact on internal stakeholders) and External social performance (refers to social performance that has impact on external stakeholders) belong to Social performance. The factor analysis results for these seven sub-constructs of SP satisfy all validity requirements by ranging from 0.429 to 0.925.
5. Data Analysis and Hypotheses Testing
5.1. The Impact of QM Practices on Sustainability Performance
- The impact of QM practices on Economic return: In Table 5, R-square is 0.25 indicating that these QM practices would explain 25% of the variance in economic return. Among eight QM practices, the impact of Training on quality, Product/service design, Problem solving, and Rewards on economic return are significant at 5% confident interval while the other QM practices reveal no statistically significant impact on economic return. Product/service design shows the most significant impact on economic return with the highest beta coefficient value of 0.32. Following this are Training and Rewards with positive coefficient values of 0.26 and 0.17, respectively, and Problem solving with a negative coefficient value of −0.27.
- The impact of QM practices on Cost reduction: R-square of this regression model is 0.12, indicating that these QM practices would explain 12% of the variance in cost reduction. Among eight QM practices, Training on quality, Quality data and reporting, and Process management illustrate significant effect on cost reduction at 5% confident interval, whereas the other practices have no statistically significant impact. Quality data and reporting presents the most significant impact on cost reduction with the highest beta coefficient value of 0.44. Training on quality and Process management follow with strong but negative impact with coefficient values of −0.32 and −0.27, respectively.
- The impact of QM practices on Market performance: R-square of this regression model is 0.27, indicating that these QM practices would explain 27% of the variance in market performance. Continuous improvement shows the most significant impact on market performance with a beta coefficient of 0.21 (at 5% confident interval), followed by Product/service design with beta coefficient of 0.15 (at 10% confident interval). The other QM practices do not show statistically significant impact on market performance.
- The impact of QM practices on Resource consumption reduction: R-square of this regression model is 0.15, indicating that QM practices would explain 15% of the variance in resource consumption reduction. Among eight QM practices, Quality data and reporting and Rewards illustrate a statistically significant impact on resource consumption reduction but in opposite directions. Quality data and reporting presents a positive impact with a beta coefficient of 0.39, while Rewards shows a negative one with beta coefficient of −0.23.
- The impact of QM practices on Internal social performance: R-square of this model is 0.28, indicating that these QM practices would explain 28% of the variance in internal social performance. Among QM practices, Top management support for QM plays the most important role with the highest beta coefficient of 0.30 (significant at 5%). In addition, Process management has a smaller influence with a coefficient of 0.21 (significant at 10%). The other QM practices do not show a statistically significant impact on internal social performance.
- The impact of QM practices on External social performance: R-square of this model is 0.36, indicating that these QM practices would explain 36% of the variance in external social performance. Among eight QM practices, Training on quality, Product/service design, and Continuous improvement show statistically impact on external social performance (significant at 5%). Continuous improvement has the strongest influence with a beta coefficient of 0.21, followed by Training on quality and Product/service design with beta coefficients of 0.19 and 0.16, respectively.
5.2. Timeline Effect on QM Practices
5.3. Industrial Effect on QM Practices
5.4. Size Effect on QM Practices
6. Findings and Discussions
7. Conclusions
Acknowledgments
Author Contributions
Conflicts of Interest
Appendix A. Questionnaire Items and Measurement Test Results

| Question Items | Factor Loading |
|---|---|
| Top Management Support for Quality Management (Alpha = 0.730; KMO = 0.740; Eigenvalue = 2.222, % of Variance = 55.557) | |
| Our organization has a comprehensive goal-setting process for quality | 0.6 |
| We always review of quality issues in top management meetings | 0.661 |
| Our top management considers quality improvement as a way to increase profits | 0.769 |
| All major department heads within our company accept their responsibility for quality | 0.521 |
| * Department heads provide personal leadership for quality products and quality improvement | - |
| * Department heads communicates a vision focused on quality improvement | - |
| Training on Quality (Alpha = 0.836; KMO = 0.773; Eigenvalue = 3.311; % of Variance = 55.188) | |
| We provide specific work-skills training to employees throughout the organization. | 0.815 |
| We provide quality-related training to hourly employees throughout the organization. | 0.815 |
| We provide quality-related training to managers and supervisors throughout the organization. | 0.709 |
| We provide training on the “total quality concept” (i.e., philosophy of company-wide responsibility for quality) throughout the organization. | 0.558 |
| Our employees receive training and development in workplace skills on a regular basis. | 0.595 |
| Management at our company believes that continual training and upgrading of employee skills is important | 0.535 |
| Design for Quality (Alpha = 0.802; KMO = 0.784; Eigenvalue = 2.849; % of Variance = 56.983) | |
| * Quality of new products is emphasized in relation to cost or schedule objectives. | - |
| * In the design process, we make an effort to list only the specifications that are really needed. | - |
| We work in teams, with members from a variety of areas, to introduce new products | 0.683 |
| We design for producibility | 0.674 |
| New product designs are thoroughly reviewed before the product is produced | 0.748 |
| Customer requirements are thoroughly analyzed in the new product design process | 0.78 |
| In product development, we emphasize the importance of offering products that are distinctive. | 0.505 |
| Quality Data and Reporting (Alpha = 0.752; KMO = 0.645; Eigenvalue = 2.304; % of Variance = 57.610) | |
| Quality data are always provided in a timely fashion. | 0.468 |
| * We rarely use quality data (cost of quality, defects, errors, scrap, etc.) as a tool to manage quality. | - |
| We use quality data to evaluate performance | 0.498 |
| Information on quality data is readily available to employees | 0.903 |
| Information on productivity is readily available to employees | 0.725 |
| Process Management (Alpha = 0.862; KMO = 0.824; Eigenvalue = 3.565; % of Variance = 59.418) | |
| We clearly define objectives of the processes necessary to achieve. | 0.656 |
| We establish responsibility for managing processes | 0.685 |
| We manage processes’ interrelations as a system to achieve quality objectives | 0.772 |
| We analyze the effect of modifications to individual processes on the system as a whole. | 0.775 |
| We manage risks that can affect outputs of the processes | 0.683 |
| We have standardized process instructions which are given to personnel | 0.724 |
| Problem Solving (Alpha = 0.886; KMO = 0.736; Eigenvalue = 2.445; % of Variance = 81.516) | |
| Our company forms teams to solve problems | 0.894 |
| Problem solving teams have helped improve performance in our organization | 0.875 |
| In the past three years, many problems have been solved through small group sessions | 0.783 |
| Continuous Improvement (Alpha = 0.888; KMO = 0.848; Eigenvalue = 3.467; % of Variance = 69.332) | |
| Continuous quality improvement is an important goal of this organization | 0.637 |
| People in this organization are continually looking for better ways of doing their work | 0.9 |
| People in this organization are constantly improving their business process | 0.87 |
| All employees believe that it is their responsibility to improve quality | 0.807 |
| Continuous improvement of quality is stressed in all work processes throughout our organization. | 0.701 |
| Quality improvement is not a high priority for me. | |
| Reward (Alpha = 0.869; KMO = 0.713; Eigenvalue = 2.382; % of Variance = 79.384) | |
| Staff are rewarded for quality improvement | 0.903 |
| Managers are rewarded for making continuous improvements. | 0.875 |
| We pay a group incentive for quality improvement ideas | 0.719 |
| Economic Return (Alpha = 0.731; KMO = 0.673; Eigenvalue = 1.959; % of Variance = 65.293) | |
| Revenue | 0.739 |
| Profit | 0.748 |
| Return on investment | 0.593 |
| Cost Reduction (Alpha = 0.745; KMO= 0.722; Eigenvalue = 2.342; % of variance = 58.548) | |
| Cost of poor quality | 0.429 |
| Cost of energy consumption | 0.701 |
| Fees for waste treatment | 0.877 |
| General operations cost | 0.669 |
| Market Performance (Alpha = 0.613; KMO= 0.637; Eigenvalue = 1.699; % of variance = 56.625) | |
| Responsiveness to customers’ requirements | 0.506 |
| Market share | 0.605 |
| Customer satisfaction | 0.665 |
| Emission Reduction (Alpha = 0.871; KMO = 0.820; Eigenvalue = 3.373; % of variance = 67.467) | |
| Frequency of environmental accidents | 0.656 |
| Air emissions | 0.925 |
| Waste water | 0.87 |
| Solid wastes | 0.818 |
| Consumption of hazardous materials | 0.561 |
| Resource Consumption Reduction (Alpha = 0.793; KMO = 0.700; Eigenvalue = 2.134; % of variance = 71.122) | |
| Raw material consumption | 0.674 |
| Energy consumption | 0.811 |
| Water consumption | 0.776 |
| Internal Social (Alpha = 0.642; KMO = 0.564; Eigenvalue = 1.773; % of variance = 44.318) | |
| Health insurance coverage | - |
| Attention to human resource development | 0.583 |
| Discrimination | - |
| Compliance with regulations | 0.81 |
| External Social (Alpha = 0.788; KMO = 0.703; Eigenvalue = 2.107; % of Variance = 70.230) | |
| Number of jobs provided | 0.698 |
| Involvement in local communities | 0.779 |
| Contributions to the local economy | 0.756 |
Appendix B. Timeline Effect on QM Practices Implementation Level
| Dependent Variable | I | J | Mean Difference (I–J) | Std. Error | Sig. |
|---|---|---|---|---|---|
| Top management Support for QM | Group T1 | Group T2 | −0.062 | 0.128 | 0.878 |
| Group T3 | −0.105 | 0.135 | 0.718 | ||
| Group T2 | Group T3 | −0.042 | 0.137 | 0.949 | |
| Training on Quality | Group T1 | Group T2 | −0.056 | 0.135 | 0.910 |
| Group T3 | −0.018 | 0.142 | 0.991 | ||
| Group T2 | Group T3 | 0.037 | 0.145 | 0.964 | |
| Product/Service Design | Group T1 | Group T2 | 0.104 | 0.131 | 0.707 |
| Group T3 | 0.042 | 0.140 | 0.951 | ||
| Group T2 | Group T3 | −0.062 | 0.140 | 0.898 | |
| 9 | Group T1 | Group T2 | 0.008 | 0.139 | 0.998 |
| Group T3 | −0.150 | 0.146 | 0.560 | ||
| Group T2 | Group T3 | −0.159 | 0.149 | 0.536 | |
| Process Management | Group T1 | Group T2 | −0.030 | 0.136 | 0.973 |
| Group T3 | −0.179 | 0.143 | 0.425 | ||
| Group T2 | Group T3 | −0.148 | 0.145 | 0.565 | |
| Continuous Improvement | Group T1 | Group T2 | 0.106 | 0.158 | 0.779 |
| Group T3 | −0.043 | 0.166 | 0.963 | ||
| Group T2 | Group T3 | −0.149 | 0.169 | 0.651 | |
| Problem Solving | Group T1 | Group T2 | 0.061 | 0.161 | 0.923 |
| Group T3 | −0.013 | 0.167 | 0.997 | ||
| Group T2 | Group T3 | −0.074 | 0.169 | 0.898 | |
| Rewards | Group T1 | Group T2 | 0.057 | 0.172 | 0.942 |
| Group T3 | −0.127 | 0.181 | 0.762 | ||
| Group T2 | Group T3 | −0.184 | 0.185 | 0.580 |
Appendix C. Industrial Effect on QM Practices Implementation Level
| Dependent Variable | I | J | Mean Difference (I–J) | Std. Error | Sig. |
|---|---|---|---|---|---|
| Top Management Support for QM | Group I1 | Group I2 | 0.068 | 0.128 | 0.952 |
| Group I3 | −0.007 | 0.156 | 0.970 | ||
| Group I4 | −0.033 | 0.130 | 0.805 | ||
| Group I2 | Group I3 | 0.077 | 0.159 | 1.000 | |
| Group I4 | 0.083 | 0.137 | 0.982 | ||
| Group I3 | Group I4 | 0.053 | 0.165 | 0.978 | |
| Training on Quality | Group I1 | Group I2 | −0.057 | 0.140 | 0.994 |
| Group I3 | 0.192 | 0.171 | 0.989 | ||
| Group I4 | −0.006 | 0.134 | 1.000 | ||
| Group I2 | Group I3 | 0.017 | 0.165 | 0.963 | |
| Group I4 | −0.004 | 0.150 | 0.999 | ||
| Group I3 | Group I4 | 0.112 | 0.184 | 0.988 | |
| Product/Service Design | Group I1 | Group I2 | −0.047 | 0.172 | 0.932 |
| Group I3 | 0.239 | 0.206 | 0.785 | ||
| Group I4 | −0.090 | 0.169 | 0.823 | ||
| Group I2 | Group I3 | −0.035 | 0.205 | 0.989 | |
| Group I4 | 0.068 | 0.128 | 0.606 | ||
| Group I3 | Group I4 | −0.007 | 0.156 | 0.450 | |
| Quality Data and Reporting | Group I1 | Group I2 | −0.033 | 0.130 | 0.978 |
| Group I3 | 0.077 | 0.159 | 0.801 | ||
| Group I4 | 0.083 | 0.137 | 0.939 | ||
| Group I2 | Group I3 | 0.053 | 0.165 | 0.677 | |
| Group I4 | −0.057 | 0.140 | 0.998 | ||
| Group I3 | Group I4 | 0.192 | 0.171 | 0.616 | |
| Process Management | Group I1 | Group I2 | −0.006 | 0.134 | 1.000 |
| Group I3 | 0.017 | 0.165 | 1.000 | ||
| Group I4 | −0.004 | 0.150 | 1.000 | ||
| Group I2 | Group I3 | 0.112 | 0.184 | 1.000 | |
| Group I4 | −0.047 | 0.172 | 1.000 | ||
| Group I3 | Group I4 | 0.239 | 0.206 | 0.999 | |
| Continuous Improvement | Group I1 | Group I2 | −0.090 | 0.169 | 1.000 |
| Group I3 | −0.035 | 0.205 | 0.906 | ||
| Group I4 | 0.068 | 0.128 | 0.887 | ||
| Group I2 | Group I3 | −0.007 | 0.156 | 0.929 | |
| Group I4 | −0.033 | 0.130 | 0.912 | ||
| Group I3 | Group I4 | 0.077 | 0.159 | 1.000 | |
| Problem Solving | Group I1 | Group I2 | 0.083 | 0.137 | 0.993 |
| Group I3 | 0.053 | 0.165 | 0.694 | ||
| Group I4 | −0.057 | 0.140 | 0.842 | ||
| Group I2 | Group I3 | 0.192 | 0.171 | 0.650 | |
| Group I4 | −0.006 | 0.134 | 0.785 | ||
| Group I3 | Group I4 | 0.017 | 0.165 | 0.999 | |
| Rewards | Group I1 | Group I2 | −0.004 | 0.150 | 0.950 |
| Group I3 | 0.112 | 0.184 | 0.894 | ||
| Group I4 | −0.047 | 0.172 | 0.995 | ||
| Group I2 | Group I3 | 0.239 | 0.206 | 0.998 | |
| Group I4 | −0.090 | 0.169 | 0.922 | ||
| Group I3 | Group I4 | −0.035 | 0.205 | 0.869 |
Appendix D. Size Effect on QM Practices Implementation Level
| Dependent Variable | I | J | Mean Difference (I–J) | Std. Error | Sig. |
|---|---|---|---|---|---|
| Top management Support for QM | Small | Medium | −0.113 | 0.111 | 0.567 |
| Large | −0.217 | 0.120 | 0.173 | ||
| Medium | Large | −0.104 | 0.125 | 0.683 | |
| Training on Quality | Small | Medium | 0.038 | 0.112 | 0.938 |
| Large | −0.224 | 0.122 | 0.160 | ||
| Medium | Large | −0.262 | 0.126 | 0.097 | |
| Product/Service Design | Small | Medium | −0.057 | 0.121 | 0.884 |
| Large | −0.184 | 0.131 | 0.340 | ||
| Medium | Large | −0.127 | 0.136 | 0.623 | |
| Quality Data and Reporting | Small | Medium | 0.082 | 0.120 | 0.774 |
| Large | −0.283 | 0.130 | 0.077 | ||
| Medium | Large | −0.365 ** | 0.134 | 0.020 | |
| Process Management | Small | Medium | 0.030 | 0.114 | 0.963 |
| Large | −0.318 ** | 0.123 | 0.029 | ||
| Medium | Large | −0.348 ** | 0.128 | 0.020 | |
| Continuous Improvement | Small | Medium | −0.040 | 0.125 | 0.947 |
| Large | −0.471 ** | 0.136 | 0.002 | ||
| Medium | Large | −0.432 *** | 0.141 | 0.007 | |
| Problem Solving | Small | Medium | 0.108 | 0.148 | 0.746 |
| Large | −0.223 | 0.159 | 0.343 | ||
| Medium | Large | −0.330 | 0.158 | 0.094 | |
| Rewards | Small | Medium | −0.267 | 0.144 | 0.157 |
| Large | −0.392 ** | 0.155 | 0.034 | ||
| Medium | Large | −0.124 | 0.160 | 0.717 |
References
- Delai, I.; Takahashi, S. Sustainability measurement system: A reference model proposal. Soc. Responsib. J. 2011, 7, 438–471. [Google Scholar] [CrossRef]
- Global Reporting Initiative. Sustainability Reporting Guidelines. 2002. Available online: https://www.epeat.net/documents/EPEATreferences/GRIguidelines.pdf (accessed on 17 November 2017).
- Kuei, C.; Lu, M.H. Integrating quality management principles into sustainability management. Total Qual. Manag. Bus. Excell. 2013, 3363, 62–78. [Google Scholar] [CrossRef]
- Molina-Azorín, J.F.; Tarí, J.J.; Claver-Cortés, E.; López-Gamero, M.D. Quality management, environmental management and firm performance: A review of empirical studies and issues of integration. Int. J. Manag. Rev. 2009, 11, 197–222. [Google Scholar] [CrossRef]
- Trading Economics. Vietnam GDP Annual Growth Rate. 2017. Available online: https://tradingeconomics.com/vietnam/gdp-growth-annual (accessed on 25 January 2018).
- Nguyen, P.A.; Robinson, A.G. Continuous improvement in Vietnam: Unique approaches for a unique culture. J. Asia Bus. Stud. 2015, 9, 195–211. [Google Scholar] [CrossRef]
- Flynn, B.B.; Saladin, B. Relevance of Baldrige constructs in an international context: A study of national culture. J. Oper. Manag. 2006, 24, 583–603. [Google Scholar] [CrossRef]
- Jansen, H.G.P.; Midmore, D.J.; Binh, P.H.; Valasayya, S.; Tru, L.C. Profitability and Sustainability of Peri-Urban Vegetable Production Systems in Vietnam. Neth. J. Agric. Sci. 1996, 44, 125–143. Available online: http://library.wur.nl/ojs/index.php/njas/article/view/552 (accessed on 30 January 2018).
- Lebel, L.; Tri, N.H.; Saengnoree, A.; Pasong, S.; Buatama, U.; Thoa le, K. Industrial Transformation and Shrimp Aquaculture in Thailand and Vietnam: Pathways to Ecological, Social, and Economic Sustainability? J. Hum. Environ. 2002, 31, 311–323. Available online: https://www.ncbi.nlm.nih.gov/pubmed/12174602 (accessed on 30 January 2018). [CrossRef]
- Nguyen, N.C.; Bosch, O.J.H. A Systems Thinking Approach to identify Leverage Points for Sustainability: A Case Study in the Cat Ba Biosphere Reserve, Vietnam. Syst. Res. 2013, 30, 104–115. [Google Scholar] [CrossRef]
- Schroeder, R.G.; Goldstein, S.M.; Rungtusanatham, M.J. Operations Management in the Supply Chain: Decisions and Cases; McGraw-Hill Book Company: New York, NY, USA, 2013. [Google Scholar]
- Flynn, B.B.; Schroeder, R.O.; Sakakibara, S. The impact of quality management practices on performance and competitive advantage. Decis. Sci. 1995, 26, 659–691. [Google Scholar] [CrossRef]
- Dean, H.W.; Bowen, D.E. Management Theory and Total Quality: Improving Research and Practice through Theory Development. Acad. Manag. Rev. 1994, 19, 392–418. Available online: http://www.jstor.org/stable/258933 (accessed on 30 January 2018).
- Yeung, A.C.L.; Cheng, T.C.E.; Kee-hung, L. An Empirical Model for Managing Quality in the Electronics Industry. Prod. Oper. Manag. 2005, 14, 189–204. [Google Scholar] [CrossRef]
- ISO 9001:2015. Quality Management Systems—Requirements. 2015. Available online: https://www.iso.org/standard/62085.html (accessed on 28 November 2017).
- Shingo Institute. The Shingo Model Is Not Just another Initiative; It Is a New Way of Thinking. 2017. Available online: http://www.shingoprize.org/model (accessed on 30 January 2018).
- Saraph, J.V.; Benson, P.G.; Schroeder, R.G. An Instrument for Measuring the Critical Factors of Quality Management. Decis. Sci. 1989, 20, 810–829. [Google Scholar] [CrossRef]
- Flynn, B.B.; Schroeder, R.G.; Sakakibara, S. A framework for quality management research and an associated measurement instrument. J. Oper. Manag. 1994, 11, 339–366. [Google Scholar] [CrossRef]
- Dun’s Marketing Services Staff. Dun’s Industrial Guide: The Metalworking Directory; Dun & Bradstreet: New York, NY, USA, 1986. [Google Scholar]
- Schonberger, R. World Class Manufacturing; The Free Press: New York, NY, USA, 1985. [Google Scholar]
- Anderson, J.C.; Rungtusanatham, M.; Schroeder, R.G.; Devaraj, S. A path analytic model of a theory of quality management underlying the Deming management method: Preliminary empirical findings. Decis. Sci. 1995, 26, 637–658. [Google Scholar] [CrossRef]
- Arauz, R.; Matsuo, H.; Suzuki, H. Measuring changes in quality management: An empirical analysis of Japanese manufacturing companies. Total Qual. Manag. Bus. Excell. 2009, 20, 1337–1374. [Google Scholar] [CrossRef]
- Kaynak, H. The relationship between Total Qual. Manag. practices and their effects on firm performance. J. Oper. Manag. 2003, 21, 405–435. [Google Scholar] [CrossRef]
- Miyagawa, M.; Yoshida, K. TQM practices of Japanese-owned manufactures in the USA and China. Int. J. Qual. Reliab. Manag. 2010, 27, 736–755. [Google Scholar] [CrossRef]
- Parast, M.M.; Adams, S.G.; Jones, E.C.; Rao, S.S.; Raghu-Nathan, T.S. Comparing Quality Management Practices between the United States and Mexico. Qual. Manag. J. 2006, 13, 36–49. Available online: http://asq.org/qic/display-item/index.html?item=20755 (accessed on 30 January 2018).
- Baird, K.; Hu, K.J.; Reeve, R. The relationships between organizational culture, total quality management practices and operational performance. Int. J. Oper. Prod. Manag. 2011, 31, 789–814. [Google Scholar] [CrossRef]
- Gadenne, D.; Sharma, B. An investigation of the hard and soft quality management factors of Australian SMEs and their association with firm performance. Int. J. Qual. Reliab. Manag. 2009, 26, 865–880. [Google Scholar] [CrossRef]
- Fuentes, M.M.F.; Montes, F.J.L.; Fernández, L.M.M. Total quality management, strategic orientation and organizational performance: The case of Spanish companies. Total Qual. Manag. Bus. Excell. 2006, 17, 303–323. [Google Scholar] [CrossRef]
- Martínez-Costa, M.; Martínez-Lorente, A.R.; Choi, T.Y. Simultaneous Consideration of TQM and ISO 9000 on Performance and Motivation: An Empirical Study of Spanish Companies. Int. J. Prod. Econ. 2008, 113, 23–39. [Google Scholar] [CrossRef]
- Sánchez-Rodríguez, C.; Martínez-Lorente, A.R. Effect of IT and quality management on performance. Ind. Manag. Data Syst. 2011, 111, 830–848. [Google Scholar] [CrossRef]
- Brah, S.A.; Lim, H.Y. The effects of technology and TQM on the performance of logistics companies. Int. J. Phys. Distrib. Logist. Manag. 2006, 36, 192–209. [Google Scholar] [CrossRef]
- Wang, C.-H.; Chen, K.-Y.; Chen, S.-C. Total quality management market orientation and hotel performance: The moderating effects of external environmental factors. Int. J. Hosp. Manag. 2012, 31, 119–129. [Google Scholar] [CrossRef]
- Kull, T.J.; Wacker, J.G. Quality management effectiveness in Asia: The influence of culture. J. Oper. Manag. 2010, 28, 223–239. [Google Scholar] [CrossRef]
- Agus, A.; Hassan, Z. Enhancing production performance and customer performance through Total Qual. Manag. (TQM): Strategies for competitive advantage. Procedia Soc. Behav. Sci. 2011, 24, 1650–1662. [Google Scholar] [CrossRef]
- Sadikoglu, E.; Zehir, C. Investigating the effects of innovation and employee performance on the relationship between Total Qual. Manag. practices and firm performance: An empirical study of Turkish firms. Int. J. Prod. Econ. 2010, 127, 13–26. [Google Scholar] [CrossRef]
- Zehir, C.; Ertosun, Ö.G.; Zehir, S.; Müceldilli, B. Total Qual. Manag. Practices’ Effects on Quality Performance and Innovative Performance. Procedia Soc. Behav. Sci. 2012, 41, 273–280. [Google Scholar] [CrossRef]
- Vanichchinchai, A.; Igel, B. The impact of Total Qual. Manag. on supply chain management and firm’s supply performance. Int. J. Prod. Res. 2011, 49, 3405–3424. [Google Scholar] [CrossRef]
- Appiah Fening, F.; Pesakovic, G.; Amaria, P. Relationship between quality management practices and the performance of small and medium size enterprises (SMEs) in Ghana. Int. J. Qual. Reliab. Manag. 2008, 25, 694–708. [Google Scholar] [CrossRef]
- Lakhal, L.; Pasin, F.; Limam, M. Quality management practices and their impact on performance. Int. J. Qual. Reliab. Manag. 2006, 23, 625–646. [Google Scholar] [CrossRef]
- Hoang, D.T.; Igel, B.; Laosirihongthong, T. The impact of total quality management on innovation: Findings from a developing country. Int. J. Qual. Reliab. Manag. 2006, 23, 1092–1117. [Google Scholar] [CrossRef]
- Nguyen, P.A.; Robinson, A.G. Managing continuous improvement in Vietnam: Unique challenges and approaches to overcome them. Qual. Manag. J. 2010, 17, 27–41. [Google Scholar] [CrossRef]
- Edgeman, R.L. Sustainable Enterprise Excellence: Towards a framework for holistic data analytics. Int. J. Bus. Soc. 2013, 13, 1–17. [Google Scholar] [CrossRef]
- Edgeman, R.; Eskildsen, J. Modeling and Assessing Sustainable Enterprise Excellence. Bus. Strategy Environ. 2014, 23, 173–187. [Google Scholar] [CrossRef]
- Chardine-Baumann, E.; Botta-Genoulaz, V. A framework for sustainable performance assessment of supply chain management practices. Comput. Ind. Eng. 2014, 76, 56–61. [Google Scholar] [CrossRef]
- Schaltegger, S.; Wagner, M. Integrative management of sustainability performance, measurement and reporting. Int. J. Account. Audit. Perform. Eval. 2006, 3. [Google Scholar] [CrossRef]
- Figge, F.; Hahn, T.; Schaltegger, S.; Wagner, M. The sustainability balanced scorecard—Linking sustainability management to business strategy. Bus. Strategy Environ. 2002, 11, 269–284. [Google Scholar] [CrossRef]
- Isaksson, R. Total Qual. Manag. for sustainable development. Bus. Process Manag. J. 2006, 12, 632–645. [Google Scholar] [CrossRef]
- Siva, V.; Gremyr, I.; Bergquist, B.; Garvare, R.; Zobel, T.; Isaksson, R. The support of Quality Management to sustainable development: A literature review. J. Clean. Prod. 2016, 138, 148–157. [Google Scholar] [CrossRef]
- Koc, T. The Relationship Between Tqm and Performance in Small Manufacturing Enterprises: The Mediation Effect of Failure. Int. J. Ind. Eng. 2011, 18, 203–218. [Google Scholar]
- Khan, M.A. Total Qual. Manag. and Organizational Performance-moderating Role of Managerial Competencies. Int. J. Acad. Res. 2011, 3, 453–458. [Google Scholar]
- Cua, K.O.; McKone, K.E.; Schroeder, R.G. Relationships between implementation of TQM, JIT, and TPM and manufacturing performance. J. Oper. Manag. 2001, 19, 675–694. [Google Scholar] [CrossRef]
- Konecny, P.A.; Thun, J.H. Do it separately or simultaneously—An empirical analysis of a conjoint implementation of TQM and TPM on plant performance. Int. J. Prod. Econ. 2011, 133, 496–507. [Google Scholar] [CrossRef]
- Macinati, M.S. The relationship between quality management systems and organizational performance in the Italian National Health Service. Health Policy 2008, 85, 228–241. [Google Scholar] [CrossRef] [PubMed]
- Salaheldin, S.I. Critical success factors for TQM implementation and their impact on performance of SMEs. Int. J. Prod. Perform. Manag. 2009, 58, 215–237. [Google Scholar] [CrossRef]
- Zu, X. Infrastructure and core quality management practices: How do they affect quality? Int. J. Qual. Reliab. Manag. 2009, 26, 129–149. [Google Scholar] [CrossRef]
- Zu, X.; Fredendall, L.D.; Douglas, T.J. The evolving theory of quality management: The role of Six Sigma. J. Oper. Manag. 2008, 26, 630–650. [Google Scholar] [CrossRef]
- Bergenwall, A.L.; Chen, C.; White, R.E. TPSs process design in American automotive plants and its effects on the triple bottom line and sustainability. Int. J. Prod. Econ. 2012, 140, 374–384. [Google Scholar] [CrossRef]
- Wiengarten, F.; Pagell, M. The importance of quality management for the success of environmental management initiatives. Int. J. Prod. Econ. 2012, 140, 407–415. [Google Scholar] [CrossRef]
- Yang, M.G.; Hong, P.; Modi, S.B. Impact of lean manufacturing and environmental management on business performance: An empirical study of manufacturing firms. Int. J. Prod. Econ. 2011, 129, 251–261. [Google Scholar] [CrossRef]
- Zhu, Q.; Sarkis, J.; Lai, K. Institutional-based antecedents and performance outcomes of internal and external green supply chain management practices. J. Purch. Supply Manag. 2013, 19, 106–117. [Google Scholar] [CrossRef]
- Heras-saizarbitoria, I.; Boiral, O. ISO 9001 and ISO 14001: Towards a Research Agenda on Management System Standards. Int. J. Manag. Rev. 2013, 15, 47–65. [Google Scholar] [CrossRef]
- Martínez-Jurado, P.J.; Moyano-Fuentes, J. Lean management, supply chain management and sustainability: A literature review. J. Clean. Prod. 2014, 85, 134–150. [Google Scholar] [CrossRef]
- Phan, A.C.; Abdallah, A.B.; Matsui, Y. Quality management practices and competitive performance: Empirical evidence from Japanese manufacturing companies. Int. J. Prod. Econ. 2011, 133, 518–529. [Google Scholar] [CrossRef]
- Rungtusanatham, M.; Forza, C.; Filippini, R.; Anderson, J.C. A replication study of a theory of quality management underlying the Deming management method: Insights from an Italian context. J. Oper. Manag. 1998, 17, 77–95. [Google Scholar] [CrossRef]
- Samson, D.; Terziovski, M. The relationship between Total Qual. Manag. practices and operational performance. J. Oper. Manag. 1999, 17, 393–409. [Google Scholar] [CrossRef]
- King, A.A.; Lenox, M.J. Lean and green? An empirical examination of the relationship between lean production and environmental performance. J. Prod. Oper. Manag. 2001, 10, 244–256. [Google Scholar] [CrossRef]
- Masui, K.; Sakao, T.; Kobayashi, M.; Inaba, A. Applying Quality Function Deployment to environmentally conscious design. Int. J. Qual. Rel. Manag. 2003, 20, 90–106. [Google Scholar] [CrossRef]
- Vinodh, S.; Manjunatheshwara, K.J.; Karthik Sundaram, S.; Kirthivasan, V. Application of fuzzy quality function deployment for sustainable design of consumer electronics products: A case study. Clean. Technol. Environ. Policy. 2017, 19, 1021–1030. [Google Scholar] [CrossRef]
- Vinodh, S.; Chintha, S.K. Application of fuzzy QFD for enabling sustainability. Int. J. Sustain. Eng. 2011, 4, 313–322. [Google Scholar] [CrossRef]
- Harrington, H.J. Performance improvement: A total poor-quality cost system. TQM J. 1999, 11, 221–230. [Google Scholar] [CrossRef]
- De Cerio, J.M. Quality management practices and operational performance: Empirical evidence for Spanish industry. Int. J. Prod. Res. 2003, 41, 2763–2786. [Google Scholar] [CrossRef]
- Foster, S.T. Managing Quality: Integrating the Supply Chain; Pearson: London, UK, 2013. [Google Scholar]
- Ahire, S.L.; Dreyfus, P. The impact of design management and process management on quality: An empirical investigation. J. Oper. Manag. 2000, 18, 549–575. [Google Scholar] [CrossRef]
- Phan, A.C.; Nguyen, M.H.; Luong, H.V.M.; Matsui, Y. ISO 9000 implementation and performance: Empirical evidence from Vietnamese companies. Int. J. Prod. Qual. Manag. 2016, 18, 53–77. [Google Scholar] [CrossRef]
- Hung, R.Y.Y.; Lien, B.Y.H.; Yang, B.; Wu, C.M.; Kuo, Y.M. Impact of TQM and organizational learning on innovation performance in the high-tech industry. Int. Bus. Rev. 2011, 20, 213–225. [Google Scholar] [CrossRef]
- Rungtusanatham, M.; Forza, C.; Koka, B.R.; Salvador, F.; Nie, W. TQM across multiple countries: Convergence Hypothesis versus National Specificity arguments. J. Oper. Manag. 2005, 23, 43–63. [Google Scholar] [CrossRef]
- Quazi, H.; Hong, C.; Meng, C. Impact of ISO 9000 certification on quality management practices: A comparative study. Total Qual. Manag. 2002, 13, 53–67. [Google Scholar] [CrossRef]
- Daniel, S.J.; Lee, D.; Reitsperger, W.D. Raising quality consciousness among Chinese manufacturing personnel: Testing the effectiveness of performance management tools. Asia Pac. J. Manag. 2014, 31, 549–573. [Google Scholar] [CrossRef]
- Sharma, B. Quality Management Dimensions, Contextual Factors and Performance: An Empirical Investigation. Total Qual. Manag. Bus. Excell. 2006, 17, 1231–1244. [Google Scholar] [CrossRef]
- Sila, I. Examining the effects of contextual factors on TQM and performance through the lens of organizational theories: An empirical study. J. Oper. Manag. 2007, 25, 83–109. [Google Scholar] [CrossRef]
- Zhu, Q.; Sarkis, J. The moderating effects of institutional pressures on emergent green supply chain practices and performance. Int. J. Prod. Res. 2007, 45, 4333–4355. [Google Scholar] [CrossRef]
- Nunnally, J. Psychometric Theory; McGraw Hill: New York, NY, USA, 1978. [Google Scholar]
- Kumar, R.; Singh, R.K.; Shankar, R. Critical success factors for implementation of supply chain management in Indian small and medium enterprises and their impact on performance. IIMB Manag. Rev. 2015, 27, 92–104. [Google Scholar] [CrossRef]
- Song, Y.; Su, Q. The relationship between quality management and new product development: Evidence from China. Oper. Manag. Res. 2015, 8. [Google Scholar] [CrossRef]
- Duy, N.K.; Oanh, N.T.H. Impact Evaluation of Training on Productivity of the Small and Medium Enterprises in Vietnam. Asian Soc. Sci. 2015, 11, 39–55. [Google Scholar]
- Zhang, L.; Wang, S.; Li, F.; Wang, H.; Wang, L.; Tan, W. A few measures for ensuring supply chain quality. Int. J. Prod. Res. 2011, 49, 87–97. [Google Scholar] [CrossRef]
- Chen, G.; Tjosvold, D. Shared rewards and goal interdependence for psychological safety among departments in China. Asia Pac. J. Manag. 2012, 29, 433–452. [Google Scholar] [CrossRef]
- Nohria, N.; Groysberg, B.; Lee, L. Employee Motivation: A Powerful New Model. Harv. Bus. Rev. 2008, 78–84. Available online: https://hbr.org/2008/07/employee-motivation-a-powerful-new-model (accessed on 30 January 2018).
- Gong, M.; Simpson, A.; Koh, L.; Tan, K.H. Inside out: The interrelationships of sustainable performance metrics and its effect on business decision making: Theory and practice. Resour. Conserv. Recycl. 2018, 128, 155–166. [Google Scholar] [CrossRef]
- Schuler, D.A.; Cording, M. A corporate social performance–corporate financial performance behavioral model for consumers. Acad. Manag. Rev. 2006, 31, 540–558. [Google Scholar] [CrossRef]
- Arnold, H.; Feldman, D. Social Desirability Response Bias in Self-Report Choice Situations. Acad. Manag. J. 1981, 24, 377–385. Available online: http://www.jstor.org/stable/255848 (accessed on 30 January 2018). [CrossRef]
| Award | Criteria |
|---|---|
| Malcolm Baldrige Award | Leadership; Strategic planning; Customer and market focus; Information and analysis; Human resource focus; Process management; Business results |
| Shingo Prize | Culture enablers; Continuous improvement; Enterprise Alignment; Results |
| HKMA Quality Award | Leadership; Strategic planning Customer and market focus; Information and analysis; Human resource focus; Process management; Business results |
| European Quality Award | Leadership; Policy and strategy; Partnership and resources; People management Process; People results; Customer results Society results; Key performance results |
| New Zealand Business Excellence Award | Leadership; Strategic planning; Customer and market focus; Measurement, analysis and knowledge management; Human resource focus; Process management; Business results |
| Japan Quality Award | Management vision and leadership; Strategic planning and development; Understanding customer and market and action taken; Information sharing and utilization; Human resource development and learning environment; Process management; Results of enterprise activities; Customer satisfaction |
| Egyptian Quality Award | Leadership; Planning; Customer and market focus; Information and analysis; Human resources; Process management; Business results |
| QM Experience Timeline | No. of Company | Firm Size (No. of Employee) | No. of Company | Type of Industry | No. of Company |
|---|---|---|---|---|---|
| Less than 5 years | 38 | No more than 50 | 58 | Industrial | 64 |
| 5 to 10 years | 35 | 51–300 | 49 | Consumer goods | 30 |
| More than 10 years | 29 | More than 300 | 37 | Basic materials | 25 |
| Missing | 42 | Missing | 0 | Consumer services | 22 |
| - | - | - | - | Missing | 3 |
| Total | 144 | Total | 144 | Total | 144 |
| Constructs | Definition/Description | Supported Literature |
|---|---|---|
| Top Management Support for QM | This construct measures how top management involves and supports for quality-related goal-setting and issues. | [12,14,21,23,24,32,35,36,51,54,63,65,83,84] |
| Training on Quality | This construct measures whether the organization provides quality-related training throughout the organization | [17,23,27,28,35,39,49,63,83,84,85] |
| Product/Service Design | This construct measures how quality is emphasized in the product/service design process to ensure that product/service could meet customers’ requirements. | [12,17,22,23,26,29,30,51,52,54,55,56,71,84] |
| Quality Data and Reporting | This construct measures whether quality-related data are available and ready for managers and employees | [12,17,29,31,35,65] |
| Process Management | This scale evaluates how the organization manages process related issues such as process objectives, authority and responsibility for process management, process risks, and process standardization to achieve the overall outcome of QM system | [14,15,22,23,26,31,32,35,36,49,50,51,52,53,54,55,84] |
| Continuous Improvement | This scale measures whether people in the organization are constantly looking for continuous improvement while doing their works | [21,27,31,32,34,35,36,50,54,75] |
| Problem Solving | This scale measures whether problem solving teams contribute to performance improvement. | [12,54,63,83,86] |
| Rewards | This scale evaluates whether managers or staff of the organization are rewarded with they contribute to quality improvement | [12,41,78,87,88] |
| Constructs | Definition/Description | Supported Literature |
|---|---|---|
| Economic performance | This scale measures the performance change of the organization in terms of financial return, financial expense, and market expansion | [44,81] |
| Environmental performance | This scale measures the performance change of the organization in terms of waste emitted to the environment, and consumption of natural resources | [44,81] |
| Social performance | This scale measures the performance change of the organization in terms of human-related management and contribution to local community | [44,81] |
| (1) | (2) | (3) | (4) | (5) | (6) | (7) | (8) | |
|---|---|---|---|---|---|---|---|---|
| (1) Top Management Support for QM | 0.644 | - | - | - | - | - | - | - |
| (2) Training | 0.662 ** | 0.681 | - | - | - | - | - | - |
| (3) Product/Service Design | 0.578 ** | 0.532 ** | 0.685 | - | - | - | - | - |
| (4) Quality Data and Reporting | 0.589 ** | 0.649 ** | 0.590 ** | 0.672 | - | - | - | - |
| (5) Process Management | 0.564 ** | 0.557 ** | 0.648 ** | 0.646 ** | 0.717 | - | - | - |
| (6) Continuous Improvement | 0.593 ** | 0.669 ** | 0.608 ** | 0.612 ** | 0.659 ** | 0.789 | - | - |
| (7) Problem Solving | 0.556 ** | 0.544 ** | 0.661 ** | 0.608 ** | 0.676 ** | 0.676 ** | 0.852 | - |
| (8) Rewards | 0.404 ** | 0.480 ** | 0.543 ** | 0.445 ** | 0.467 ** | 0.564 ** | 0.516 ** | 0.836 |
| Economic | Environmental | Social | ||||||
|---|---|---|---|---|---|---|---|---|
| Return | Cost Reduction | Market Perf. | Emission Reduction | Resource Consumption Reduction | Internal Social Perf. | External Social Perf. | ||
| R | 0.49 | 0.35 | 0.52 | 0.21 | 0.39 | 0.53 | 0.60 | - |
| R2 | 0.25 | 0.12 | 0.27 | 0.04 | 0.15 | 0.28 | 0.36 | - |
| df | 117 | 117 | 117 | 117 | 117 | 117 | 117 | - |
| Sig. | 0.00 | 0.05 | 0.00 | 0.74 | 0.01 | 0.00 | 0.00 | - |
| Coef. | Coef. | Coef. | Coef. | Coef. | Coef. | Coef. | VIF | |
| Constant | 2.13 | 2.48 | 1.92 | 2.97 | 4.23 | 1.40 | 1.68 | - |
| TOPQ | −0.15 | 0.18 | 0.09 | −0.04 | −0.17 | 0.30 ** | 0.08 | 2.220 |
| TRAIN | 0.26 ** | −0.32 ** | 0.11 | −0.08 | −0.22 | −0.11 | 0.19 ** | 2.638 |
| DEGN | 0.32 ** | −0.12 | 0.15* | 0.18 | 0.15 | 0.13 | 0.16 ** | 2.460 |
| QDAT | −0.02 | 0.44 ** | 0.03 | 0.06 | 0.39 ** | −0.12 | 0.03 | 2.327 |
| PCMT | 0.02 | −0.27 ** | −0.05 | 0.02 | −0.10 | 0.21 * | 0.03 | 2.725 |
| CONTI | 0.08 | 0.00 | 0.21 ** | −0.22 | −0.15 | 0.12 | 0.21 ** | 2.848 |
| PROB | −0.27 ** | 0.17 | 0.08 | 0.10 | 0.01 | 0.02 | 0.00 | 2.517 |
| REW | 0.17 ** | 0.06 | 0.02 | 0.08 | −0.23 ** | 0.05 | 0.00 | 1.645 |
| Economic | Environmental | Social | |||||
|---|---|---|---|---|---|---|---|
| Return | Cost Reduction | Market Perf. | Emission Reduction | Resource Consumption Reduction | Internal Social Perf. | External Social Perf. | |
| R | 0.68 | 0.61 | 0.70 | 0.57 | 0.54 | 0.65 | 0.70 |
| R2 | 0.46 | 0.37 | 0.49 | 0.32 | 0.29 | 0.42 | 0.48 |
| Adjusted R2 | 0.25 | 0.12 | 0.29 | 0.06 | 0.02 | 0.20 | 0.28 |
| df | 67 | 67 | 67 | 67 | 67 | 67 | 67 |
| Sig. | 0.005 | 0.099 | 0.002 | 0.245 | 0.402 | 0.021 | 0.002 |
| Coef. | Coef. | Coef. | Coef. | Coef. | Coef. | Coef. | |
| (Constant) | 2.621 | 2.770 | 0.607 | 0.845 | 3.478 | 0.568 | 1.666 |
| T2 | −0.926 | -0.916 | 2.388 | 1.596 | 0.563 | 1.895 | 0.321 |
| T3 | 0.305 | −1.416 | 0.168 | 2.817 | −0.916 | 1.286 | −0.242 |
| TOPQ | −0.005 | −0.349 | 0.216 | −0.248 | −0.668 | 0.706 | −0.160 |
| TRAIN | 0.580 | −0.086 | 0.173 | 0.106 | −0.060 | 0.153 | 0.566 |
| DEGN | −0.112 | −0.026 | 0.382 | 0.343 | 0.131 | −0.258 | −0.215 |
| QDAT | −0.183 | 0.301 | −0.098 | 0.398 | 0.615 | −0.201 | −0.139 |
| PCMT | 0.337 | −0.358 | 0.039 | −0.183 | 0.092 | 0.378 | 0.597 |
| CONTI | −0.299 | −0.029 | 0.025 | −0.068 | −0.049 | 0.122 | −0.365 |
| PROB | −0.176 | 0.675 | 0.056 | 0.155 | 0.009 | −0.181 | −0.009 |
| REW123 | 0.230 | −0.050 | 0.032 | 0.114 | −0.159 | 0.113 | 0.332 |
| T2xTOPQ | −0.075 | 0.345 | −0.400 | −0.300 | 0.852 | −0.713 ** | 0.315 |
| T2xTRAIN | −0.818 ** | −0.341 | −0.073 | −0.363 | −0.619 | −0.548 | −0.773 *** |
| T2xDEGN | 0.615 ** | −0.113 | 0.018 | 0.313 | −0.026 | 0.284 | 0.458 |
| T2xQDAT | 0.466 | 0.684 | 0.403 | −0.056 | −0.362 | 0.428 | 0.154 |
| T2xPCMT | −0.424 | 0.199 | −0.108 | 0.575 | −0.080 | −0.506 | −0.705 ** |
| T2xCONTI | 0.290 | −0.616 | −0.044 | −0.947 | 0.157 | 0.166 | 0.926 *** |
| T2xPROB | −0.069 | −0.123 | −0.269 | 0.398 | 0.180 | 0.427 | −0.279 |
| T2xREW | 0.169 | 0.224 | −0.100 | 0.028 | −0.326 | −0.018 | −0.264 |
| T3xTOPQ | −0.388 | 0.958 | 0.282 | 0.469 | 0.821 | −0.653 | 0.206 |
| T3xTRAIN | 0.273 | −0.726 | −0.425 | −0.561 | −0.237 | −0.230 | −0.614 |
| T3xDEGN | 0.313 | 0.451 | −0.369 | 0.068 | 0.515 | 0.266 | 0.193 |
| T3xQDAT | −0.141 | −0.275 | 0.267 | −0.902 | −0.338 | 0.221 | 0.090 |
| T3xPCMT | 0.105 | −0.038 | −0.218 | 0.526 | −0.314 | −0.277 | −0.352 |
| T3xCONTI | 0.622 ** | 0.154 | 0.088 | 0.490 | −0.053 | −0.116 | 0.872 *** |
| T3xPROB | −0.601 | −0.380 | 0.162 | −0.552 | −0.340 | 0.194 | −0.035 |
| T3xREW | −0.354 | 0.121 | 0.082 | −0.265 | 0.052 | 0.243 | −0.408 |
| Economic | Environmental | Social | |||||
|---|---|---|---|---|---|---|---|
| Return | Cost Reduction | Market Perf. | Emission Reduction | Resource Consumption Reduction | Internal Social Perf. | External Social Perf. | |
| R | 0.67 | 0.63 | 0.64 | 0.48 | 0.60 | 0.67 | 0.73 |
| R2 | 0.44 | 0.40 | 0.41 | 0.23 | 0.36 | 0.45 | 0.54 |
| Adjusted R2 | 0.23 | 0.17 | 0.18 | −0.06 | 0.11 | 0.24 | 0.36 |
| df | 88 | 88 | 88 | 88 | 88 | 88 | 88 |
| Sig. | 0.004 | 0.022 | 0.015 | 0.783 | 0.096 | 0.002 | 0.000 |
| Coef. | Coef. | Coef. | Coef. | Coef. | Coef. | Coef. | |
| (Constant) | 2.115 | 2.066 | 3.005 | 3.374 | 4.460 | 2.101 | 2.065 |
| I2 | 0.242 | 0.313 | −0.953 | 0.629 | 0.285 | −0.605 | −0.425 |
| I3 | −0.049 | 0.103 | −0.070 | −0.283 | 0.526 | 0.023 | −0.332 |
| I4 | 0.534 | 0.073 | −0.615 | −0.434 | −0.311 | 0.097 | −0.290 |
| TOPQ | −0.079 | −0.097 | −0.075 | −0.118 | −0.434 | 0.059 | 0.010 |
| TRAIN | 0.205 | −0.359 | 0.149 | −0.005 | 0.019 | 0.102 | 0.085 |
| DEGN | 0.583 | −0.045 | 0.137 | −0.105 | 0.095 | 0.213 | −0.043 |
| QDAT | −0.174 | 0.451 | 0.069 | −0.082 | 0.159 | −0.168 | −0.030 |
| PCMT | −0.223 | −0.095 | −0.191 | 0.236 | −0.001 | 0.083 | 0.138 |
| CONTI | .104 | −0.071 | 0.148 | 0.043 | −0.150 | 0.002 | 0.362 |
| PROB | −0.362 | 0.329 | −0.033 | −0.153 | 0.160 | 0.104 | −0.163 |
| REW | 0.345 | 0.144 | 0.045 | 0.169 | −0.211 | 0.065 | 0.078 |
| I2xTOPQ | −0.212 | 0.098 | 0.088 | −0.123 | 0.122 | 0.028 | −0.018 |
| I2xDEGN | −0.209 | 0.303 | −0.357 | 0.223 | 0.084 | −0.012 | 0.232 |
| I2xQDAT | 0.087 | 0.104 | −0.159 | −0.299 | 0.143 | −0.063 | 0.092 |
| I2xPCMT | 0.198 | −0.543 * | 0.235 | −0.210 | −0.522 | 0.063 | −0.089 |
| I2xCONTI | 0.228 | −0.333 | 0.068 | −0.208 | 0.436 | 0.333 | 0.084 |
| I2xPROB | 0.091 | 0.225 | 0.227 | 0.403 | −0.375 | −0.250 | −0.116 |
| I2xREW | −0.204 | 0.077 | 0.099 | 0.091 | 0.013 | 0.00 | −0.089 |
| I3xTOPQ | 0.078 | 0.320 | −0.086 | 0.161 | 0.130 | 0.118 | 0.182 |
| I3xTRAIN | 0.154 | −0.067 | 0.155 | −0.029 | −0.143 | −0.119 | 0.047 |
| I3xDEGN | −0.300 *** | −0.175 | −0.006 | 0.062 | −0.037 | −0.019 | −0.026 |
| I3xQDAT | 0.059 | 0.017 | −0.087 | 0.016 | 0.130 | 0.053 | 0.043 |
| I3xPCMT | −0.046 | −0.096 | 0.129 | −0.205 | −0.160 | 0.014 | −0.30 *** |
| I3xCONTI | 0.008 | 0.102 | 0.031 | −0.106 | −0.075 | 0.023 | −0.053 |
| I3xPROB | 0.085 | −0.169 | −0.054 | 0.196 | 0.052 | −0.008 | 0.130 |
| I3xREW | −0.028 | 0.008 | −0.070 | −0.035 | −0.036 | −0.066 | 0.039 |
| I4xTOPQ | 0.096 | 0.041 | −0.002 | 0.014 | 0.007 | 0.147 | −0.128 |
| I4xTRAIN | −0.032 | 0.057 | −0.018 | −0.129 | −0.165 | −0.114 | 0.074 |
| I4xDEGN | −0.120 | 0.299 * | 0.047 | 0.243 | 0.198 | −0.39 *** | 0.086 |
| I4xQDAT | 0.037 | −0.220 | 0.074 | 0.263 | 0.102 | 0.212 | 0.002 |
| I4xPCMT | 0.121 | −0.002 | 0.073 | 0.045 | 0.143 | 0.099 | 0.030 |
| I4xCONTI | −0.121 | −0.024 | −0.041 | −0.081 | 0.045 | −0.034 | −0.118 |
| I4xPROB | −0.018 | −0.052 | −0.002 | −0.133 | −0.209 | 0.014 | 0.107 |
| I4xREW | −0.088 | −0.150 * | 0.014 | −0.119 | −0.045 | 0.059 | 0.037 |
| Economic | Environmental | Social | |||||
|---|---|---|---|---|---|---|---|
| Return | Cost Reduction | Market Perf. | Emission Reduction | Resource Consumption Reduction | Internal Social Perf. | External Social Perf. | |
| R | 0.69 | 0.544 | 0.604 | 0.372 | 0.556 | 0.656 | 0.715 |
| R2 | 0.48 | 0.296 | 0.364 | 0.138 | 0.309 | 0.430 | 0.511 |
| Adjusted R2 | 0.34 | 0.111 | 0.198 | −0.088 | 0.128 | 0.281 | 0.382 |
| df | 99 | 99 | 99 | 99 | 99 | 99 | 99 |
| Sig. | 0.000 | 0.052 | 0.003 | 0.925 | 0.033 | 0.000 | 0.000 |
| Coef. | Coef. | Coef. | Coef. | Coef. | Coef. | Coef. | |
| (Constant) | 0.704 | 3.418 | 2.256 | 2.556 | 3.727 | −0.565 | 1.634 |
| M | 0.647 | −1.111 | −0.862 | −0.101 | 0.952 | 2.138 | −0.644 |
| L | 2.370 | −2.114 | −0.901 | 0.441 | −1.610 | 1.926 | −0.426 |
| TOPQ | −0.078 | −0.431 | 0.044 | −0.202 | −0.614 | 0.460 | −0.244 |
| TRAIN | 0.471 | −0.255 | 0.294 | −0.023 | 0.089 | 0.237 | 0.398 |
| DEGN | 0.214 | −0.027 | 0.021 | −0.094 | 0.268 | 0.036 | 0.104 |
| QDAT | −0.179 | 0.672 | −0.023 | 0.127 | 0.666 | −0.243 | 0.103 |
| PCMT | 0.268 | −0.367 | −0.089 | 0.075 | −0.406 | 0.459 | 0.045 |
| CONTI | −0.318 | −0.099 | 0.082 | −0.511 | −0.220 | −0.103 | 0.072 |
| PROB | 0.140 | 0.491 | 0.091 | 0.558 | 0.538 | 0.199 | 0.067 |
| REW | 0.295 | −0.048 | 0.004 | 0.307 | −0.466 | 0.074 | 0.048 |
| MxTOPQ | 0.183 | 1.07 *** | −0.011 | 0.433 | 0.817 ** | −0.071 | 0.356 |
| MxTRAIN | −0.401 | −0.061 | −0.340 | 0.099 | −0.710 * | −0.458 | −0.374 * |
| MxDEGN | 0.312 | −0.391 | 0.057 | 0.246 | −0.498 | 0.295 | −0.222 |
| MxQDAT | 0.217 | −0.324 | 0.184 | −0.247 | −0.171 | −0.075 | −0.088 |
| MxPCMT | −0.651 ** | 0.168 | 0.079 | −0.197 | 0.249 | −0.366 | 0.020 |
| MxCONTI | 0.629 ** | 0.156 | 0.330 | 0.278 | 0.121 | 0.251 | 0.317 |
| MxPROB | −0.436 * | −0.604 * | −0.128 | −0.470 | −0.602 * | −0.106 | 0.110 |
| MxREW | −0.099 | 0.196 | 0.036 | −0.184 | 0.487 | −0.080 | −0.018 |
| LxTOPQ | −0.507 | 0.930 ** | 0.433 | −0.074 | 0.481 | −0.088 | 0.599 ** |
| LxTRAIN | 0.565 | −0.552 | −0.550 | 0.005 | 0.067 | −0.621 | −0.717 * |
| LxDEGN | 0.049 | 0.022 | 0.126 | 0.720 | 0.235 | 0.110 | 0.157 |
| LxQDAT | 0.135 | −0.078 | 0.081 | −0.006 | −0.407 | 0.291 | −0.085 |
| LxPCMT | −0.099 | −0.022 | 0.207 | 0.220 | 0.318 | −0.308 | 0.231 |
| LxCONTI | 0.257 | −0.168 | 0.149 | 0.437 | 0.515 | 0.611 | 0.297 |
| LxPROB | −0.919 *** | 0.194 | −0.464 | −0.938 | −0.981 ** | −0.67 ** | −0.512 ** |
| LxREW | −0.108 | 0.154 | 0.153 | −0.514 | 0.023 | 0.112 | 0.028 |
© 2018 by the authors. Licensee MDPI, Basel, Switzerland. This article is an open access article distributed under the terms and conditions of the Creative Commons Attribution (CC BY) license (http://creativecommons.org/licenses/by/4.0/).
Share and Cite
Nguyen, M.H.; Phan, A.C.; Matsui, Y. Contribution of Quality Management Practices to Sustainability Performance of Vietnamese Firms. Sustainability 2018, 10, 375. https://doi.org/10.3390/su10020375
Nguyen MH, Phan AC, Matsui Y. Contribution of Quality Management Practices to Sustainability Performance of Vietnamese Firms. Sustainability. 2018; 10(2):375. https://doi.org/10.3390/su10020375
Chicago/Turabian StyleNguyen, Minh Hue, Anh Chi Phan, and Yoshiki Matsui. 2018. "Contribution of Quality Management Practices to Sustainability Performance of Vietnamese Firms" Sustainability 10, no. 2: 375. https://doi.org/10.3390/su10020375
APA StyleNguyen, M. H., Phan, A. C., & Matsui, Y. (2018). Contribution of Quality Management Practices to Sustainability Performance of Vietnamese Firms. Sustainability, 10(2), 375. https://doi.org/10.3390/su10020375